Memory recall involves a transient break in excitatory-inhibitory balance
- Wellcome Centre for Integrative Neuroimaging, University of Oxford, FMRIB, John Radcliffe Hospital, United Kingdom
- Medical Research Council Brain Network Dynamics Unit, University of Oxford, United Kingdom
- School of Health Sciences, Purdue University, United States
Figures
Figure 1 with 2 supplements
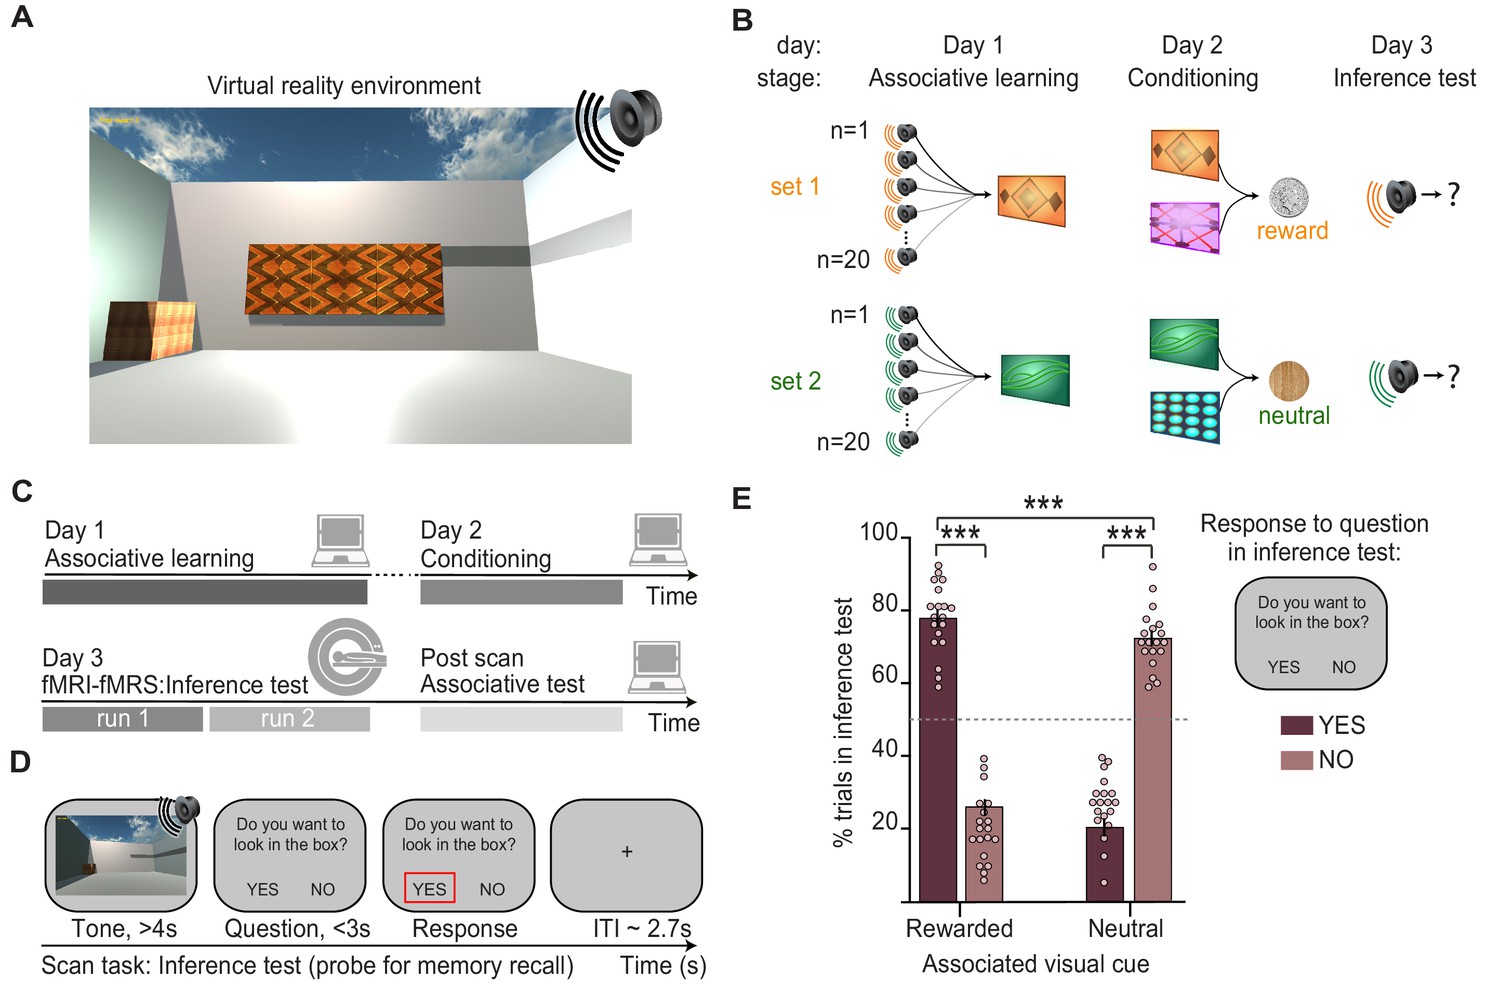
Inference task design and behavioural performance.
(A) The inference task was performed within a virtual-reality environment. (B) Three-stage inference task designed to investigate hippocampal-dependent associative memory recall. First, participants learned to associate auditory cues with visual cues (‘associative learning’ stage, day 1), where four different visual cues were each associated with 20 auditory cues. Second, participants learned to associate visual cues with an outcome delivered to a wooden box in the corner of the virtual-reality environment (‘conditioning’ stage, day 2). Two visual cues predicted a rewarding outcome (set 1, monetary coin) while the other two predicted a neutral outcome (set 2, woodchip). Third, the auditory cues were played in isolation and we assessed participants’ ability to infer the relevant outcome by recalling the intermediary visual cue (‘inference test’, day 3). (C) Schematic: training and testing protocol. The inference test was performed inside the 7T MRI scanner. After exiting the scanner, participants were given a surprise post-scan associative test to directly assess participants’ memory for auditory-visual associations learned on day 1. (D) Example inference test trial performed inside the scanner. For each auditory cue, participants were required to infer the indirectly associated outcome by recalling the relevant auditory-visual association. To indicate whether participants inferred the outcome to be rewarding or neutral, on each trial participants pressed ‘yes’ or ‘no’ in response to a question asking, ‘Would you like to look in the box?’, referring to the box where the outcome cues were delivered during conditioning. (E) Behaviour during the inference test revealed a significant interaction between the response to auditory cues in set 1 and 2 (“rewarded” and “neutral”) and whether or not the participants indicated that they wanted to look in the box (“yes” and “no”) (two-way ANOVA, F1,72 = 630.99, p < 0.001). Tukey’s post hoc test showed participants pressed “yes” more often for auditory cues in set 1 (p < 0.001), and “no” more often for auditory cues in set 2 (p < 0.001). This inferential behaviour was observed despite participants never experiencing the outcomes in response to the auditory cues. For the purpose of the analyses reported in Figs. 2-5, trials where participants pressed “yes” for auditory cues in set 1, or “no” for auditory cues in set 2 were categorised as “correctly inferred” trials. *** indicates p<0.001.
-
Figure 1—source data 1
Percentages of inference test trials in set 1 and 2 (“rewarded” and “neutral”) split according to whether participants wanted to look in the box (“yes” and “no”).
- https://cdn.elifesciences.org/articles/70071/elife-70071-fig1-data1-v2.zip
Figure 1—figure supplement 1

Behavioural training and performance.
(A–B) On day 1, during the ‘associative learning’ stage, participants learned to associate each of the 80 different auditory cues with one of four possible visual cues. (A) The associative learning stage was performed in a virtual reality (VR) environment (Figure 1A). (B) Learning was monitored using an associative test, in the absence of feedback. (C–D) On day 2, during the ‘conditioning’ stage, participants learned to associate each of the four visual cues with one of two possible outcomes (monetary reward for set 1; neutral woodchip for set 2) (Figure 1B). (C) The conditioning stage was performed in a VR environment (Figure 1A). (D) Learning was monitored using a conditioning test, in the absence of feedback. (E) Left: Participants performed the associative learning task until they showed recall accuracy on the associative test of at least 50% of the 80 possible auditory-visual pairs. Middle: On the associative test, used to monitor performance during the associative learning, there was no difference in accuracy between auditory-visual pairs in set 1 (rewarded) and set 2 (neutral). Right: On the associative test, there was no difference in accuracy between auditory cues associated with the four different visual cues. (F) On day 2, participants performed the conditioning task until they reached 100% accuracy on all visual-outcome associations in the conditioning test.
Figure 1—video 1
Example video used for trials on the inference test during the magnetic resonance imaging (MRI) scan.
On each trial of the inference test participants were presented with a video together with an auditory cue. Each video was taken from the virtual reality (VR) environment used during training and involved a trajectory constrained to a 1/16 quadrant of the VR environment, evenly distributed across the different auditory cues.
Figure 2
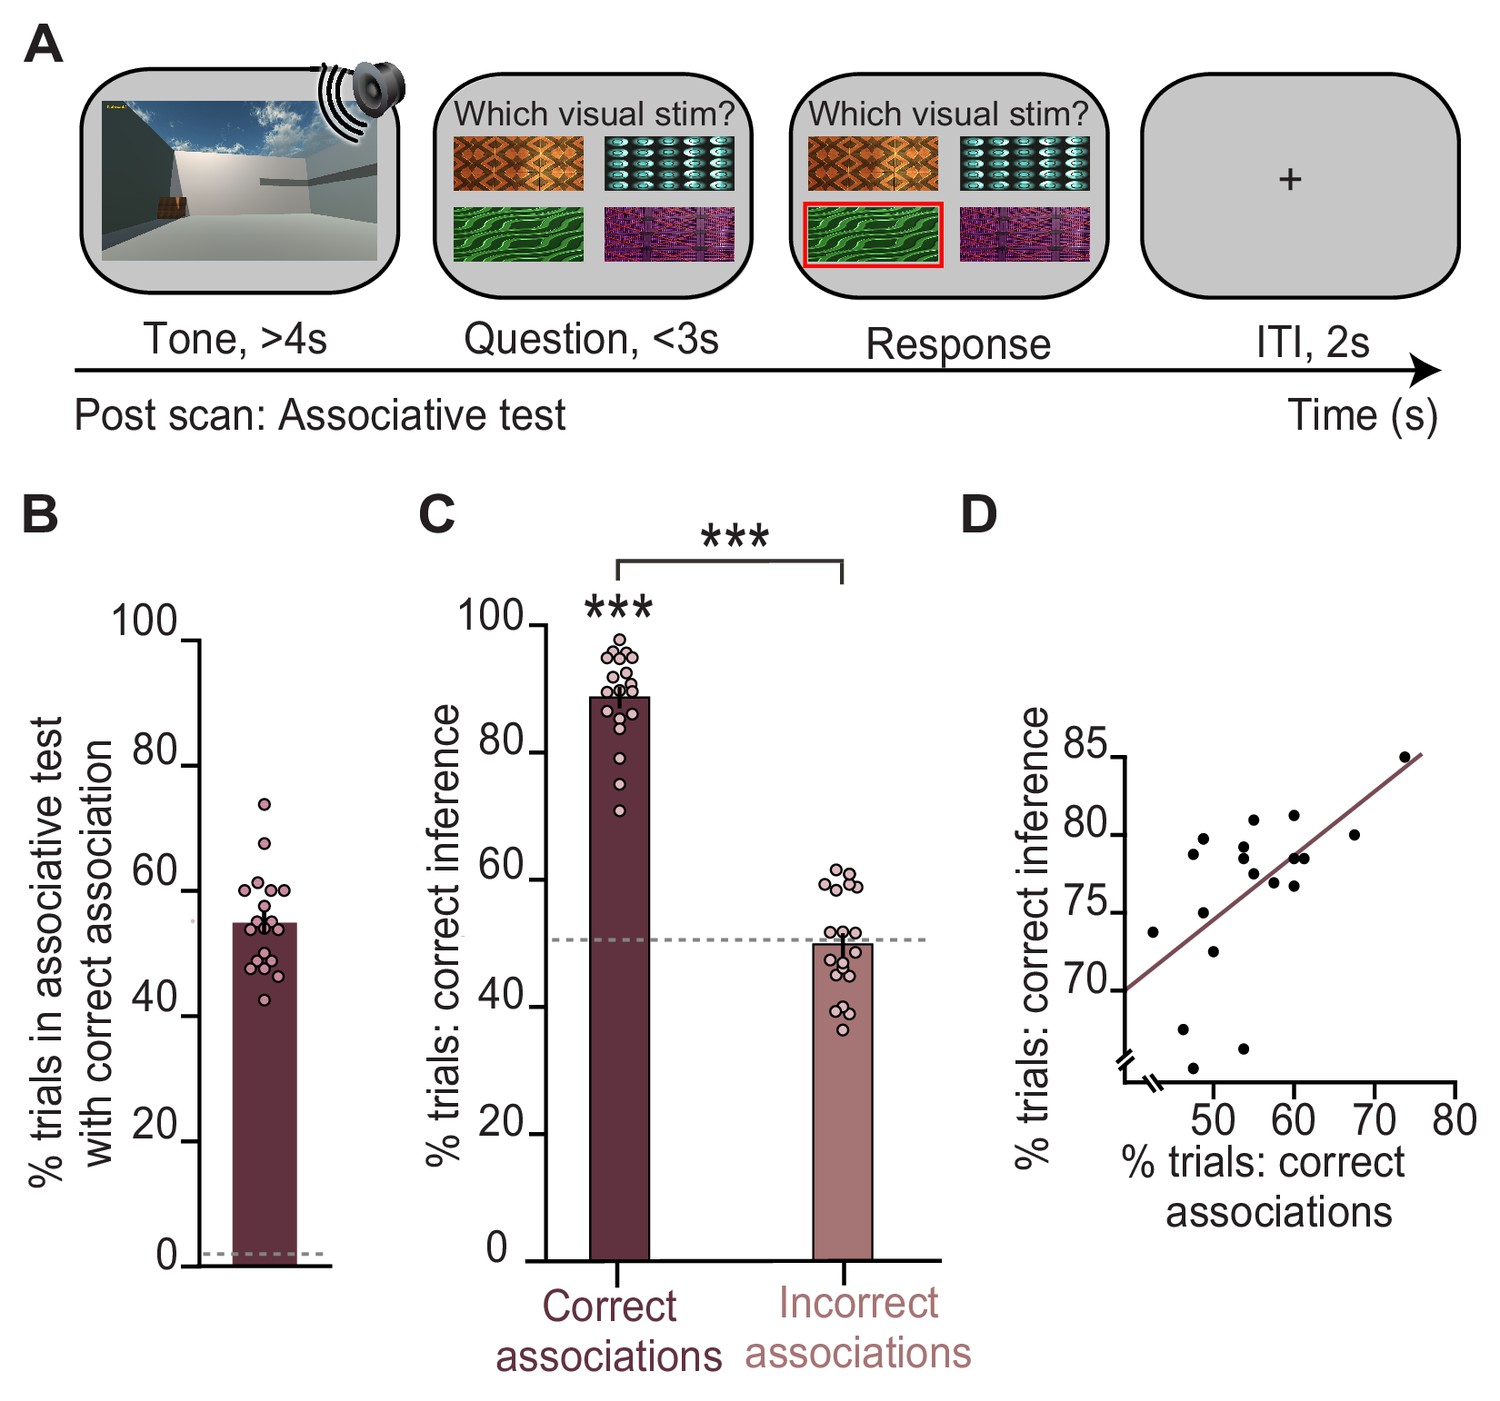
Behavioural performance in the inference test is predicted by performance on an associative test.
(A) Example trial from the surprise post-scan associative test which directly tested participants’ memory for auditory-visual associations learned on day 1. (B) During the post-scan associative test, participants remembered 55% of the auditory-visual associations (54.8% ± 1.78%; mean ± SEM), significantly above chance as indicated by the dotted line (t18 = 29.96, p < 0.001). (C) In response to auditory cues during the inference test (Figure 1D), participants successfully inferred the appropriate outcome (Figure 1E) on trials where they could later recall the correct auditory-visual association in the post-scan associative test (‘correct association’: t18 = 22.91, p < 0.001; ‘incorrect association’: t18 = 0.09, p = 0.925; ‘correct association’–‘incorrect association’: t18 = 16.21, p < 0.001; dotted line indicates chance). (D) Across participants, behavioural performance on the inference test was predicted by behavioural performance on the post-scan associative test (r17 = 0.57, p = 0.010). Notably, there was no significant effect of sex on behavioural performance (Supplementary file 1). *** indicates p < 0.001.
-
Figure 2—source data 1
Percentages of remembered auditory-visual associations in the post-scan associative test.
- https://cdn.elifesciences.org/articles/70071/elife-70071-fig2-data1-v2.zip
-
Figure 2—source data 2
Percentages of correctly inferred trials during the inference test, split according to performance in the post-scan associative test.
- https://cdn.elifesciences.org/articles/70071/elife-70071-fig2-data2-v2.zip
-
Figure 2—source data 3
Behavioural performance on the inference test versus on the post-scan associative test.
- https://cdn.elifesciences.org/articles/70071/elife-70071-fig2-data3-v2.zip
Figure 3 with 1 supplement
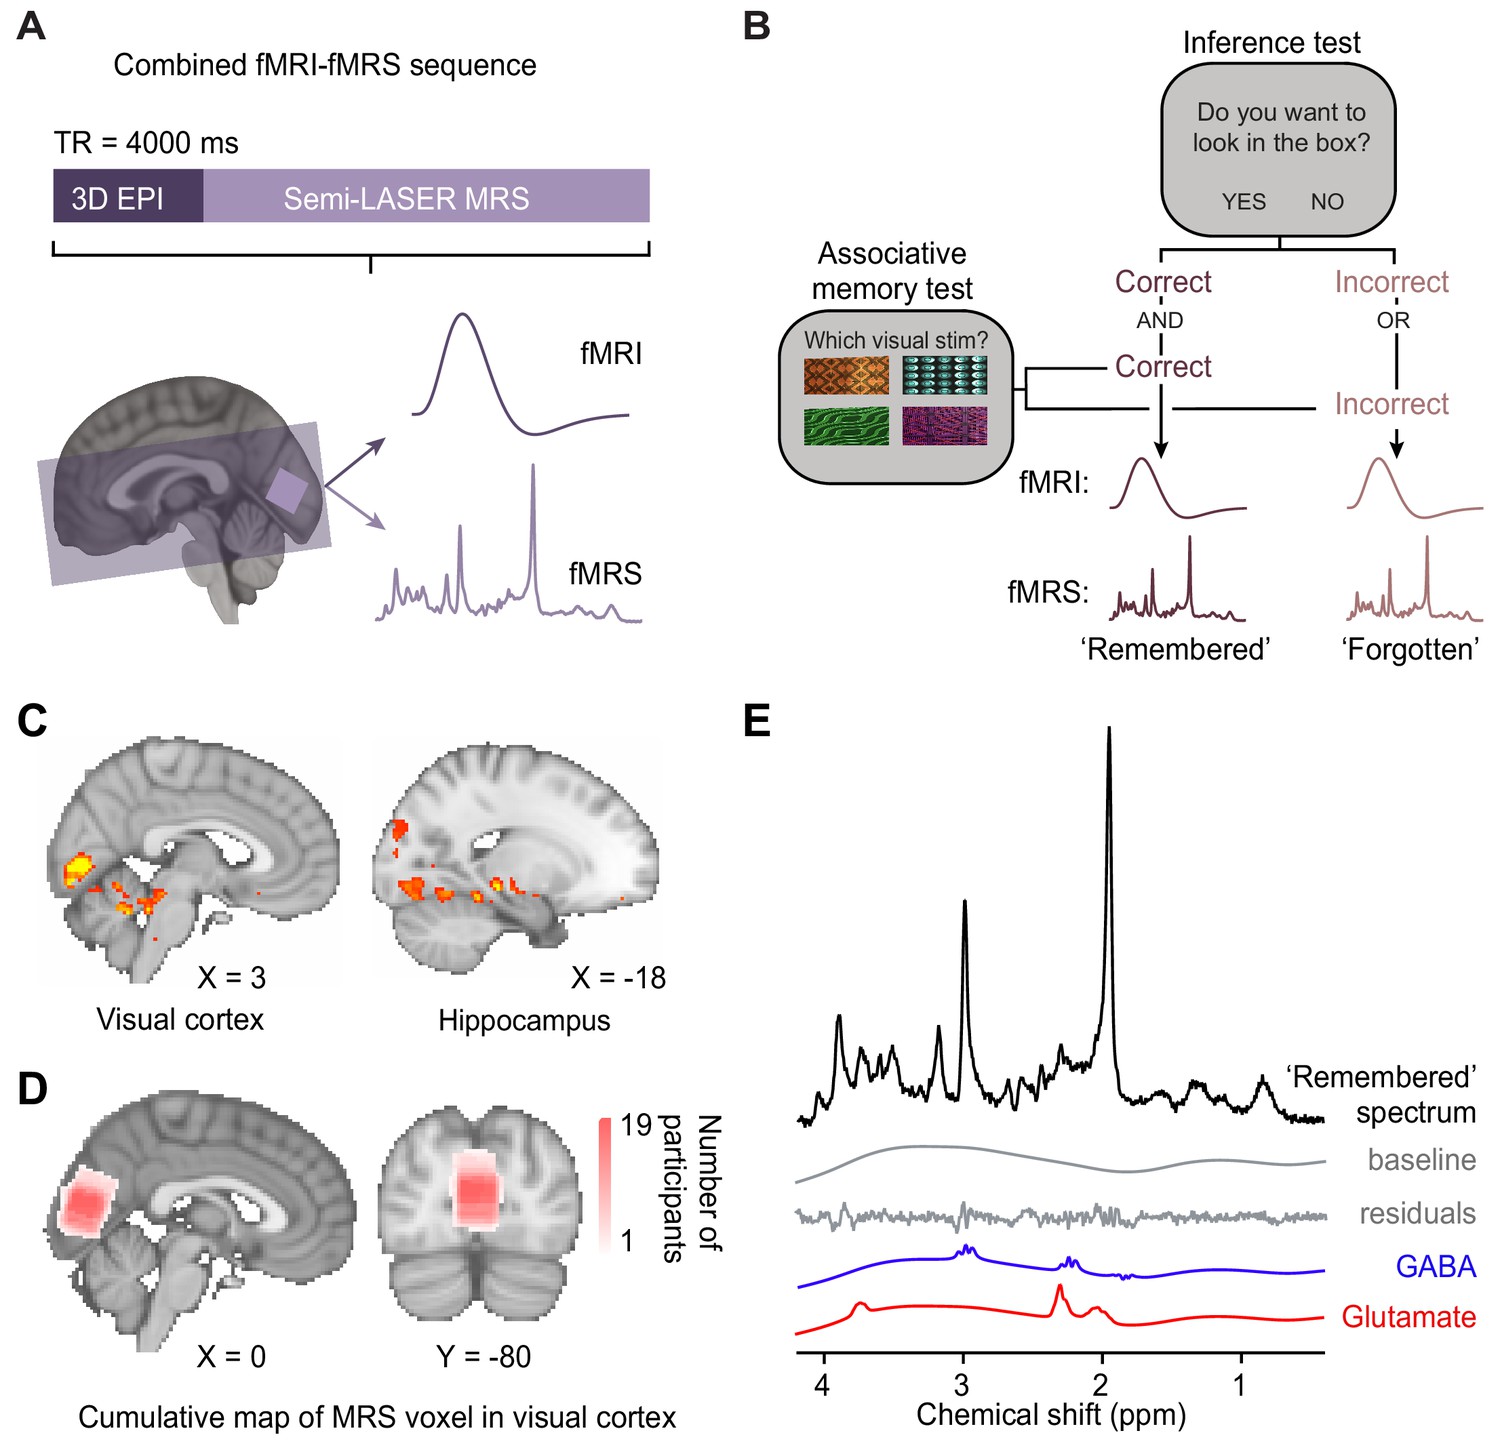
Using functional magnetic resonance imaging (fMRI)-functional magnetic resonance spectroscopy (fMRS) data to assess changes in blood oxygen level-dependent (BOLD) signal and glu/GABA ratio during the inference test.
(A) 7 T MRI sequence. 3D BOLD echo planar imaging (3D-EPI) and semi-LASER MR spectroscopy were acquired in the same TR. The MRS voxel was positioned in primary visual cortex (V1) (light-purple) and the EPI slice coverage included occipital and temporal lobes (dark-purple). (B) Schematic showing how trials during the inference test were categorized into ‘remembered’ and ‘forgotten’. Trials were categorised as ‘remembered’ if participants correctly inferred the appropriate outcome during the inference test and subsequently indicated the correct auditory-visual association in the post-scan associative test. Trials were categorised as ‘forgotten’ if participants incorrectly inferred the appropriate outcome during the inference test or indicated the incorrect auditory-visual association in the post-scan associative memory test. Notably, by using performance on the associative test to filter trials on the inference test, this approach helped eliminate false positive and false negative responses during the inference test where chance was otherwise at 50% (Figure 2C). This conservative approach thus provides a more reliable measure of associative memory recall during inference. (C) During the question period in the inference test (Figure 1C–D), BOLD signal in the visual cortex and the hippocampus was significantly higher for ‘remembered’ versus ‘forgotten’ auditory cues (‘remembered’–‘forgotten’, visual cortex: t17 = 5.92, p < 0.001; hippocampus: t17 = 4.33, p = 0.017; whole-volume family wise error (FWE)-corrected; together with regions listed in Supplementary file 4; Montreal Neurological Institute [MNI] coordinates). (D) Anatomical location of 2 × 2 × 2 cm3 MRS voxel positioned in V1. Cumulative map across participants; MNI coordinates. (E) Representative MRS spectrum from ‘remembered’ trials in the inference test for an example participant.
-
Figure 3—source data 1
SPM output for ‘remembered’ – ‘forgotten’ contrast.
- https://cdn.elifesciences.org/articles/70071/elife-70071-fig3-data1-v2.zip
-
Figure 3—source data 2
Cumulative map of MRS voxel location across participants.
- https://cdn.elifesciences.org/articles/70071/elife-70071-fig3-data2-v2.zip
-
Figure 3—source data 3
LCModel output for an example ‘remembered’ MRS spectrum of a single participant.
- https://cdn.elifesciences.org/articles/70071/elife-70071-fig3-data3-v2.zip
Figure 3—figure supplement 1
Comparison of different smoothing parameters applied to functional magnetic resonance imaging (fMRI) data.
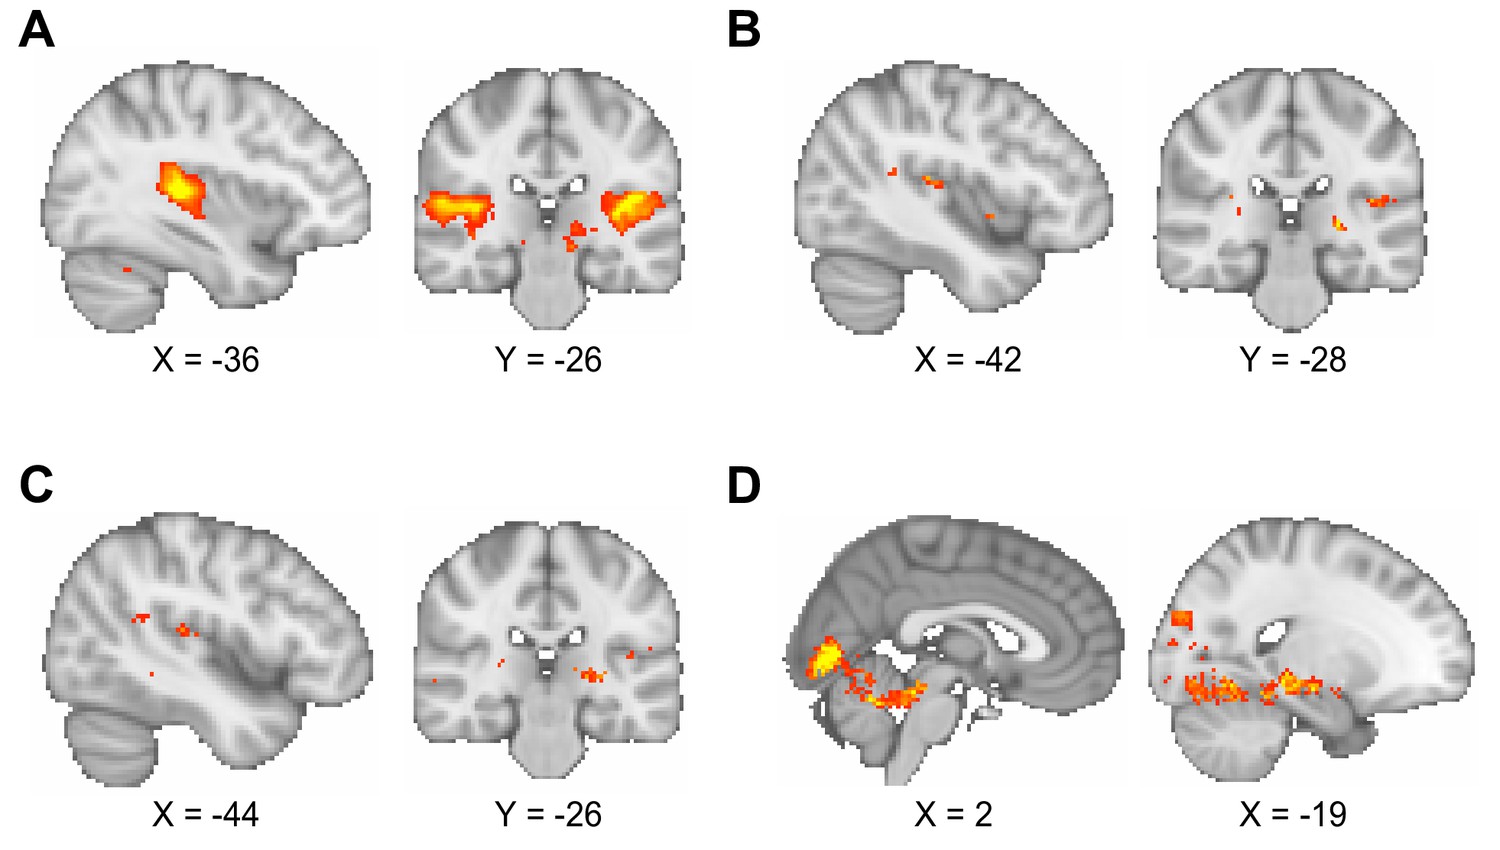
(A–C) The blood oxygen level-dependent (BOLD) signal response to auditory cues in the inference test was used to assess the effect of different smoothing parameters (contrast of interest: [all trials during inference test – all trials during conditioning]). As noted in the Materials and methods, the quality of the fMRI data in the interleaved fMRI-functional magnetic resonance spectroscopy (fMRS) sequence was compromised relative to contemporary standards for 7 T fMRI. The smoothing parameters applied to the data influenced the reliability of the analysis, as illustrated here. Montreal Neurological Institute (MNI) coordinates. (A) Smoothing at the second level using a 5 mm kernel, approximately two times the voxel size, as recommended (Worsley and Friston, 1995), gave significant BOLD signal in bilateral auditory cortex (left auditory cortex, t17 = 8.94, p < 0.001; right auditory cortex, t17 = 6.76, p < 0.001; whole-brain family wise error (FWE)-corrected; thresholded at p < 0.001 uncorrected for visualisation purposes only). This smoothing protocol was used for all analyses presented in the main figures. (B) Smoothing at the first level using a 5 mm kernel did not give significant BOLD signal in auditory cortex (whole-brain FWE-corrected; thresholded at p < 0.01 uncorrected for visualisation purposes only). (C) Smoothing at the first level using an 8 mm kernel (default for SPM) did not give significant BOLD signal in auditory cortex (whole-brain FWE-corrected; thresholded at p < 0.01 uncorrected for visualisation purposes only). (D) When contrasting ‘remembered’ and ‘forgotten’ trials in the inference test, smoothing at the first level using an 8 mm kernel (as in C) gave similar results to those presented in Figure 3C, despite the absence of a main effect response to auditory cues as shown in (C). Thus, as shown in Figure 3C, during the question period in the inference test trials (Figure 1B and D), BOLD signal in the visual cortex and the hippocampus was significantly higher for ‘remembered’ versus ‘forgotten’ auditory cues (‘remembered’ – ‘forgotten’, visual cortex: t17 = 6.01, p < 0.001; right hippocampus: t17 = 7.58, p < 0.001; left hippocampus (sub-threshold): t17 = 4.91, p > 0.05; whole-volume FWE-corrected; thresholded at p < 0.01 uncorrected for visualisation purposes only; MNI coordinates).
Figure 4 with 8 supplements
Memory recall and inference involves a transient break in glu/GABA ratio.
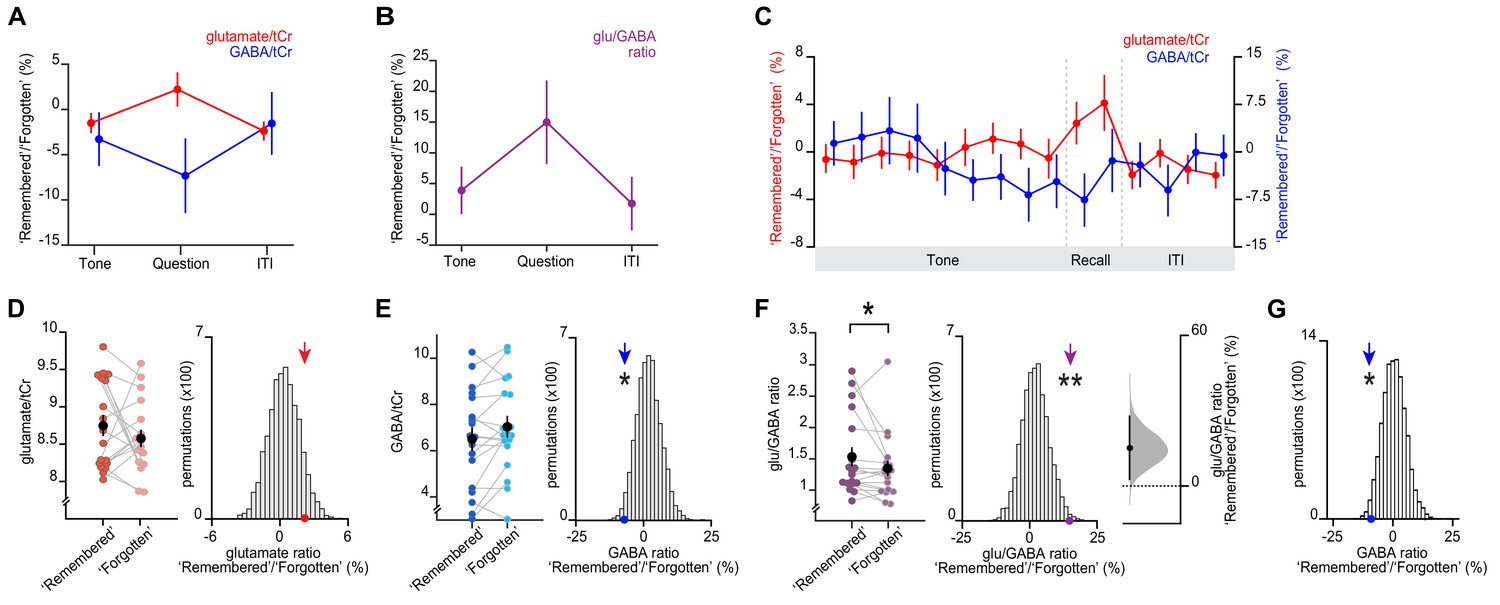
(A–B) During the question period of the inference test trials (up to 3 s), glu/GABA ratio significantly increased during ‘remembered’ versus ‘forgotten’ trials (‘remembered’:‘forgotten’, glu/GABA ratio: t17 = 2.21, p = 0.041). One participant (n = 1) was excluded from this analysis, where there were less than eight spectra for either the ‘remembered’ or ‘forgotten’ conditions during the question period (see Materials and methods). This break in glu/GABA ratio was not observed during the ‘tone’ (~7 s) or inter-trial interval (‘ITI’) (~2.7 s) periods (‘tone’, glu/GABA ratio: t18 = 1.01, p = 0.325; ‘ITI’, glu/GABA ratio: t18 = 0.40, p = 0.692). Note that glutamate:tCR (total creatine) and GABA:tCr concentrations have been multiplied by eight as per convention. To detect dynamic changes in glu/GABA, we chose not to use LCModel’s default settings which assume the dynamic range of GABA is fixed (see Materials and methods; Figure 4—figure supplement 2, Appendix 1—supplementary note 1). (C) Moving average showing glutamate:tCr and GABA:tCr for the ratio of ‘remembered’ to ‘forgotten’ trials during the inference test. Each point represents a 2.5 s time bin (mean ± SEM). By incorporating a random jitter in the behavioural paradigm, MRS spectra across all trials and all participants were acquired in all possible 2.5 s time bins of the inference test trial (Figure 4—figure supplement 1), thus achieving a higher temporal resolution than the TR of 4 s (see Materials and methods). (D–F) Left: The metabolite values and glu/GABA ratio during the question period for ‘remembered’ and ‘forgotten’ trials (mean ± SEM). (D, E) Right, (F) Middle: Comparing the mean ratio of ‘remembered’ to ‘forgotten’ (coloured arrows) against null distributions generated by permuting the trial labels to control for any potential biases in the analyses. Relative to the null distributions, GABA significantly decreased while glu/GABA ratio significantly increased (glutamate:tCr: p = 0.089; GABA:tCr: p = 0.014; glu/GABA ratio: p = 0.007). Note: To detect dynamic changes in GABA, it was not appropriate to normalise GABA estimates relative to the concentration of more stable metabolites (see Materials and methods). Consequently, GABA values are higher than those generated using default settings in LCModel which are optimised for detecting static estimates (Figure 4—figure supplement 2). (F) Right panel: full sampling-error curve for glu/GABA ratio estimated using bootstrap-coupled estimation (DABEST) plot (Ho et al., 2019). The 95% confidence interval is non-overlapping with zero (p = 0.017). Black dot, mean; black tick, 95% confidence interval; filled-curve, sampling-error distribution. (G) The average measured spectra were used as an input to Monte Carlo simulations, to generate simulated spectra with the level of noise matched to the observed data (see Figure 4—figure supplement 2). Using this simulated data, we established a null distribution for the difference between pairs of ‘remembered’ and ‘forgotten’ spectra that would be expected by chance (i.e. when the condition labels are shuffled). Relative to this null distribution, the observed GABA ratio measured in vivo (shown in E) was significant (p = 0.019). * indicates p < 0.05, ** indicates p < 0.01.
-
Figure 4—source data 1
Glutamate:tCr and GABA:tCr ‘remembered’/‘forgotten’ ratios during the ’tone', ‘question', and ‘ITI' periods of inference trials.
- https://cdn.elifesciences.org/articles/70071/elife-70071-fig4-data1-v2.zip
-
Figure 4—source data 2
Glu/GABA ratio during the ’tone', ‘question', and ‘ITI' periods of inference trials.
- https://cdn.elifesciences.org/articles/70071/elife-70071-fig4-data2-v2.zip
-
Figure 4—source data 3
Moving average of glutamate:tCr and GABA:tCr for the ratio of ‘remembered’ to ‘forgotten’ trials during the inference test.
- https://cdn.elifesciences.org/articles/70071/elife-70071-fig4-data3-v2.zip
-
Figure 4—source data 4
Glutamate:tCr during the question period for ‘remembered’ and ‘forgotten’ trials, and null distribution generated by permuting the trial labels.
- https://cdn.elifesciences.org/articles/70071/elife-70071-fig4-data4-v2.zip
-
Figure 4—source data 5
GABA:tCr during the question period for ‘remembered’ and ‘forgotten’ trials, and null distribution generated by permuting the trial labels.
- https://cdn.elifesciences.org/articles/70071/elife-70071-fig4-data5-v2.zip
-
Figure 4—source data 6
Glu/GABA ratio during the question period for ‘remembered’ and ‘forgotten’ trials, and null distribution generated by permuting the trial labels.
- https://cdn.elifesciences.org/articles/70071/elife-70071-fig4-data6-v2.zip
-
Figure 4—source data 7
Monte Carlo simulated GABA:tCr ratio for ‘remembered’ vs ‘forgotten’ trials.
- https://cdn.elifesciences.org/articles/70071/elife-70071-fig4-data7-v2.zip
Figure 4—figure supplement 1
Estimation of functional magnetic resonance spectroscopy (fMRS) moving average.
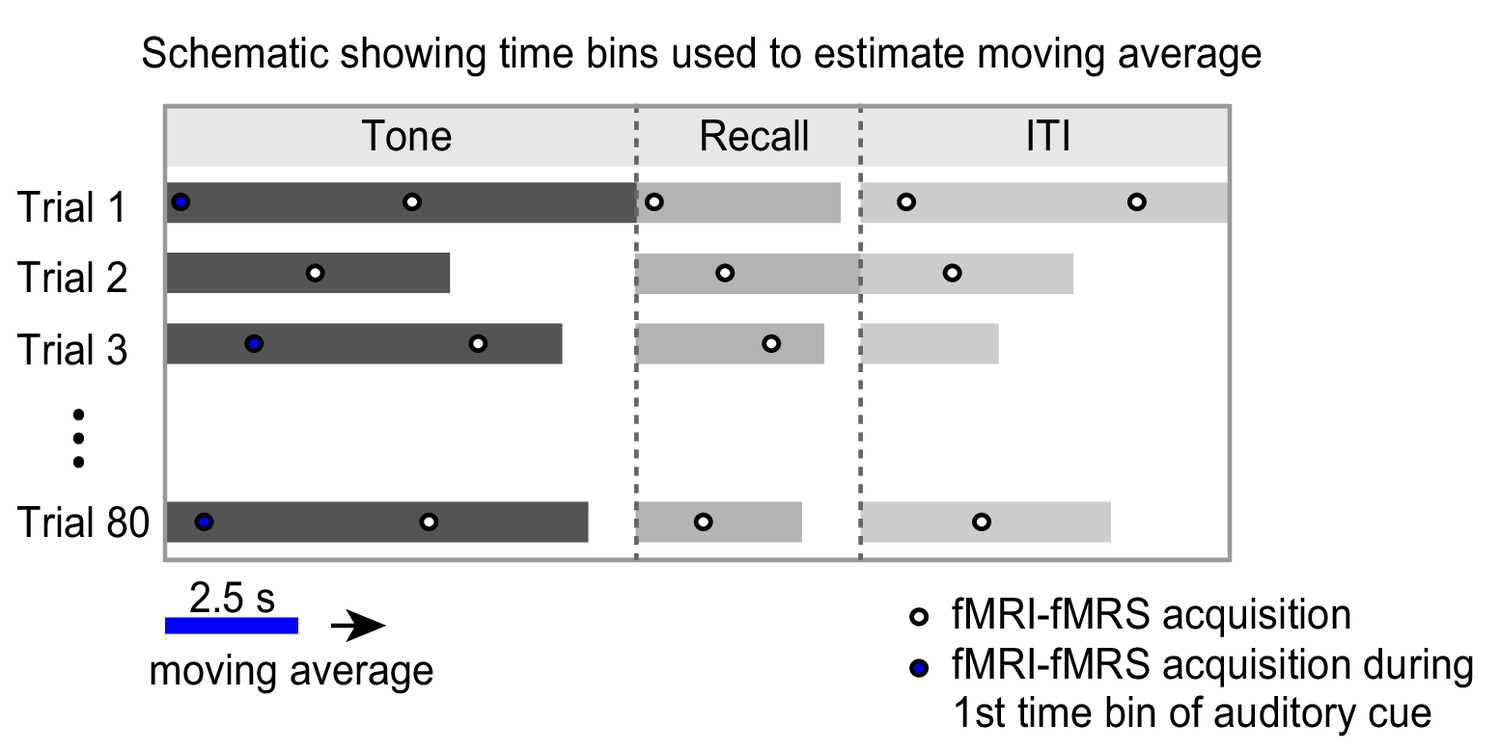
Illustration of how the moving average for fMRS data was generated. To generate the moving average for fMRS data in Figures 4 and 5 and Figure 5—figure supplement 1, we leveraged the jitter in the temporal relationship between data acquisition and experimental paradigm. Data acquisition and experimental paradigm were started at the same time. Due to the temporal jitter in each trial of the experimental paradigm (see Materials and methods), fMRS spectra were acquired across different segments of the inference test trials. Each time bin constituted a 2.5 s time window shifted by 0.5 s in each iteration. For each subject, spectra across all 80 trials were averaged within 2.5 s time bins to generate a moving average. The first time bin during the auditory cue (‘tone’) is shown as an example in blue.
Figure 4—figure supplement 2
Monte Carlo simulations to assess magnetic resonance spectroscopy (MRS) data quality.
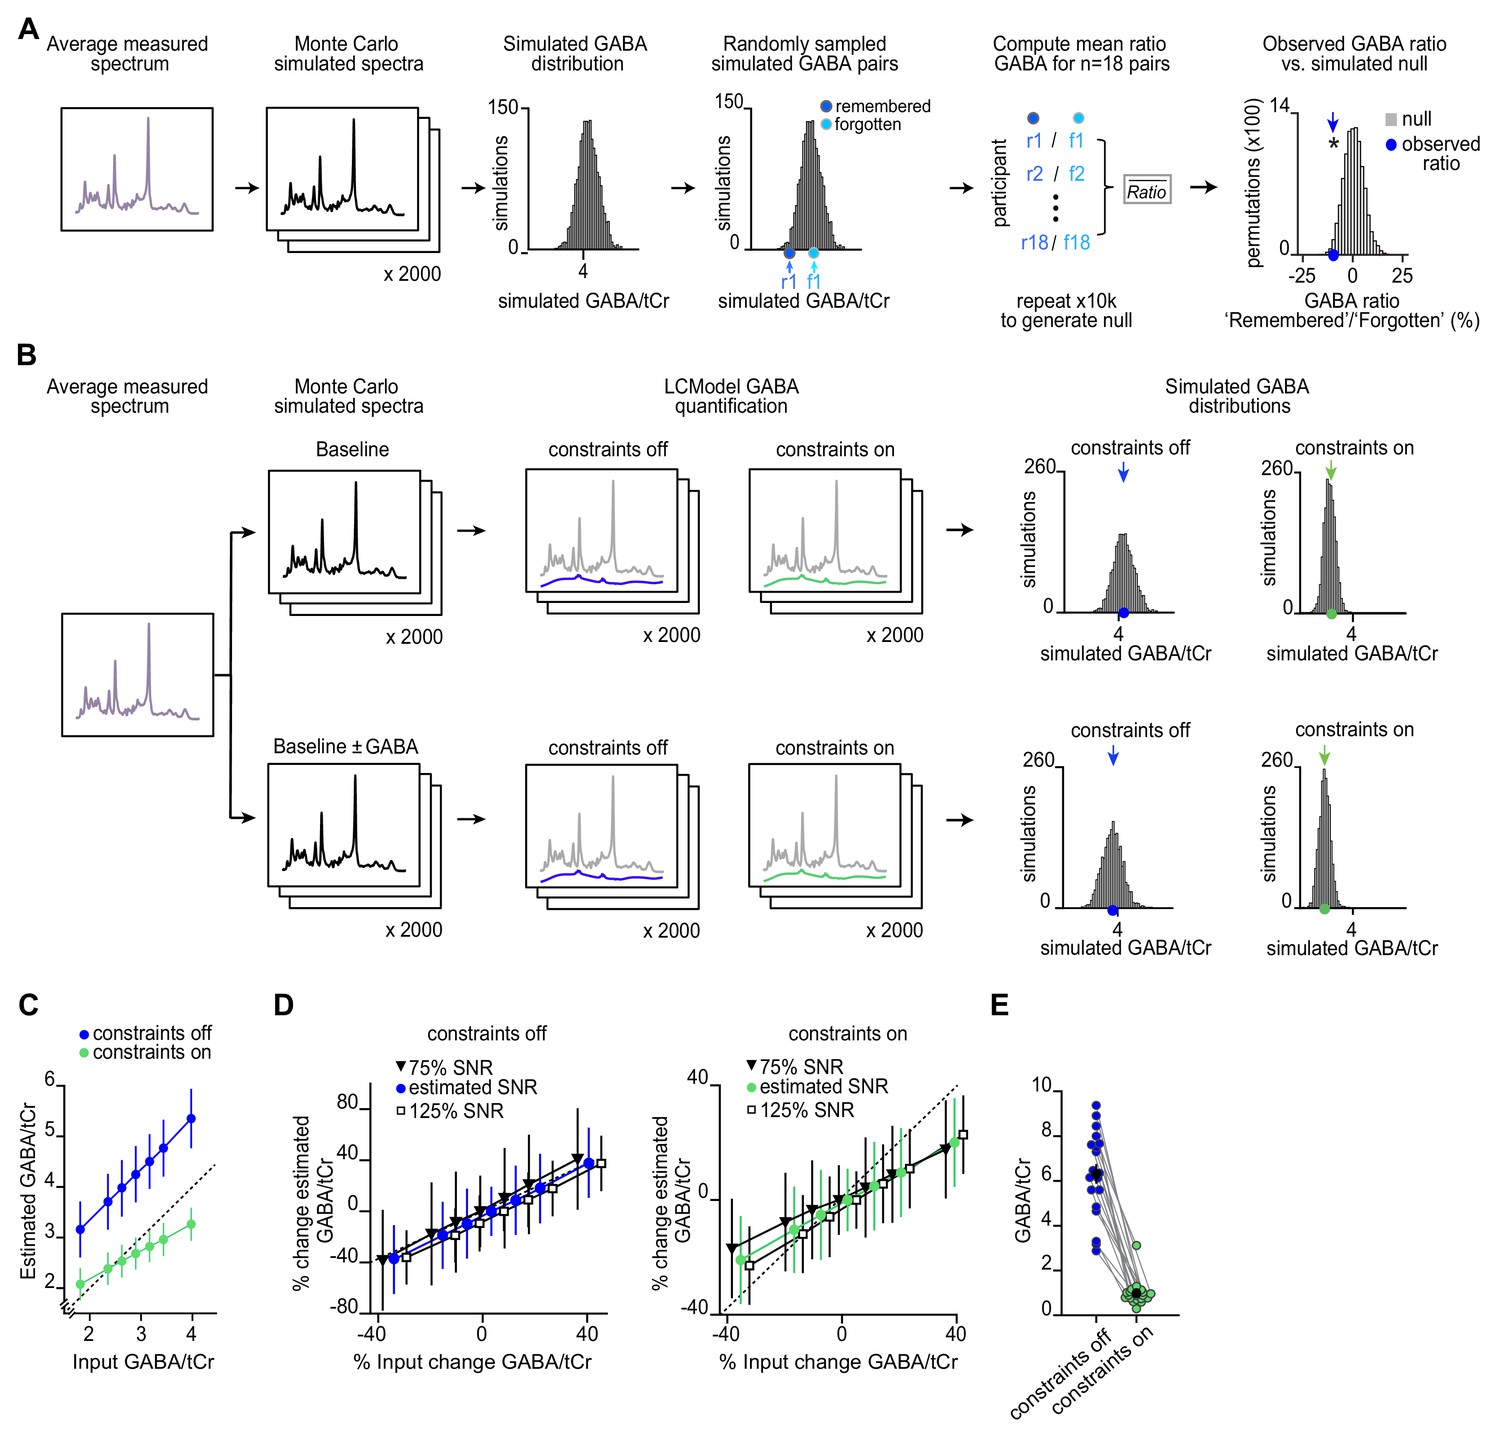
(A–B) The average measured spectra were used as an input to Monte Carlo simulations, to generate simulated spectrum with the level of noise (signal-to-noise ration [SNR]) and line width matched to the observed data. (A) Using this simulated data, we established a null distribution for the GABA:tCr (total creatine) ratio between ‘remembered’ and ‘forgotten’ spectra that would be expected by chance. Relative to this null distribution, the observed GABA ratio was significant (p = 0.019), as shown in Figure 4G. (B) Using the Monte Carlo simulations, sets of 2000 spectra were generated with changes in GABA imposed relative to the average estimated GABA concentration (‘baseline’). The imposed changes in GABA included multiples (±0.5, ±1, ±2) of the observed difference between ‘remembered’ and ‘forgotten’ conditions shown in Figure 4E. The imposed change when subtracting 1× the observed difference between ‘remembered’ and ‘forgotten’ conditions is illustrated here in the lower row. All simulated spectra were then fit using LCModel to obtain a distribution of estimated GABA:tCr concentrations. We assessed how sensitive different model fitting settings in LCModel are to detecting a change in GABA. Specifically, we changed the NRATIO parameter to compare settings where GABA:tCr estimates are constrained relative to the concentration of more abundant neurochemicals (‘constraints on’, NRATIO = 12), to settings where GABA estimates are not subject to prior constraints as used for analyses reported in Figures 4–5 (‘constraints off’, NRATIO = 0) (see Appendix 1—supplementary note 1). (C) For different imposed changes in GABA, the mean ± standard deviation for the resulting GABA:tCr concentrations (n = 2000) is shown, as estimated with LCModel using ‘constraints off’ (blue) and ‘constraints on’ (green). The dashed line represents agreement between the imposed and estimated GABA:tCr concentration. As expected, the estimated GABA:tCr was higher for ‘constraints off’ compared to ‘constraints on’. Importantly, for ‘constraints off’ compared to ‘constraints on’, the range in estimated GABA:tCr concentrations more closely reflected the imposed change in GABA (‘constraints off’: slope = 1.01; ‘constraints on’: slope = 0.546). To estimate the power to reject the null hypothesis of equal slopes between conditions (‘constraints off’ versus ‘constraints on’), we randomly selected n = 18 spectra for each imposed change in GABA per condition, thus matching the number of simulations to the number of participants in our sample (Figure 4). Over 500 sets of size n = 126 (i.e. n = 18 simulated spectra for each imposed change in GABA), we estimated the power to reject the null hypothesis of equal slopes to be 0.997. Similarly, over 500 sets of size n = 126, we estimated the t-statistic to reject the null hypothesis of equal slopes to be (t248 = 5.23, p < 0.001). These Monte Carlo simulations demonstrate that sensitivity to detecting dynamic changes in GABA:tCr is greater when using ‘constraints off’ compared to ‘constraints on’ in LCModel. (D) To verify whether changes in GABA could be detected in fMRS data with lower or higher average SNR, we looked at the effect of decreasing and increasing SNR in the simulated spectra upon detecting the imposed changes in GABA concentration using LCModel. With ‘constraints off’, the estimated changes closely reflected the imposed changes in GABA at different SNRs (slope = 1.06 for 75% SNR; slope = 0.985 for 125% SNR; power to reject null hypothesis of equal slopes estimated as described in C, ‘75% SNR’ versus ‘125% SNR’: 0.251, see Materials and methods). With ‘constraint on’ the measured changes deviated from the imposed changes at both higher and lower SNRs (slope = 0.458 for 75% SNR; slope = 0.612 for 125% SNR; power to reject the null hypothesis of equal slopes ‘75% SNR’ versus ‘125% SNR’: 0.827, see Materials and methods). These simulations show that dynamic changes in GABA are reflected in the measured GABA concentrations using ‘constraints off’, even when SNR is reduced relative to that observed in the data reported in Figures 4–5. (E) Comparison of GABA:tCr estimates with and without model constraints. When using a model fit that does not constrain GABA estimates within a predefined range (‘constraints off’), the absolute concentration of GABA:tCr is higher and the resulting dynamic range is greater. When instead using a model fit that constrains metabolite values within a predefined range (‘constraints on’), GABA:tCr values are biased towards the predetermined ratio and show reduced variance. * indicates p < 0.05 *** indicates p < 0.001.
Figure 4—figure supplement 3
Magnetic resonance spectroscopy (MRS) data quality metrics across all spectra.
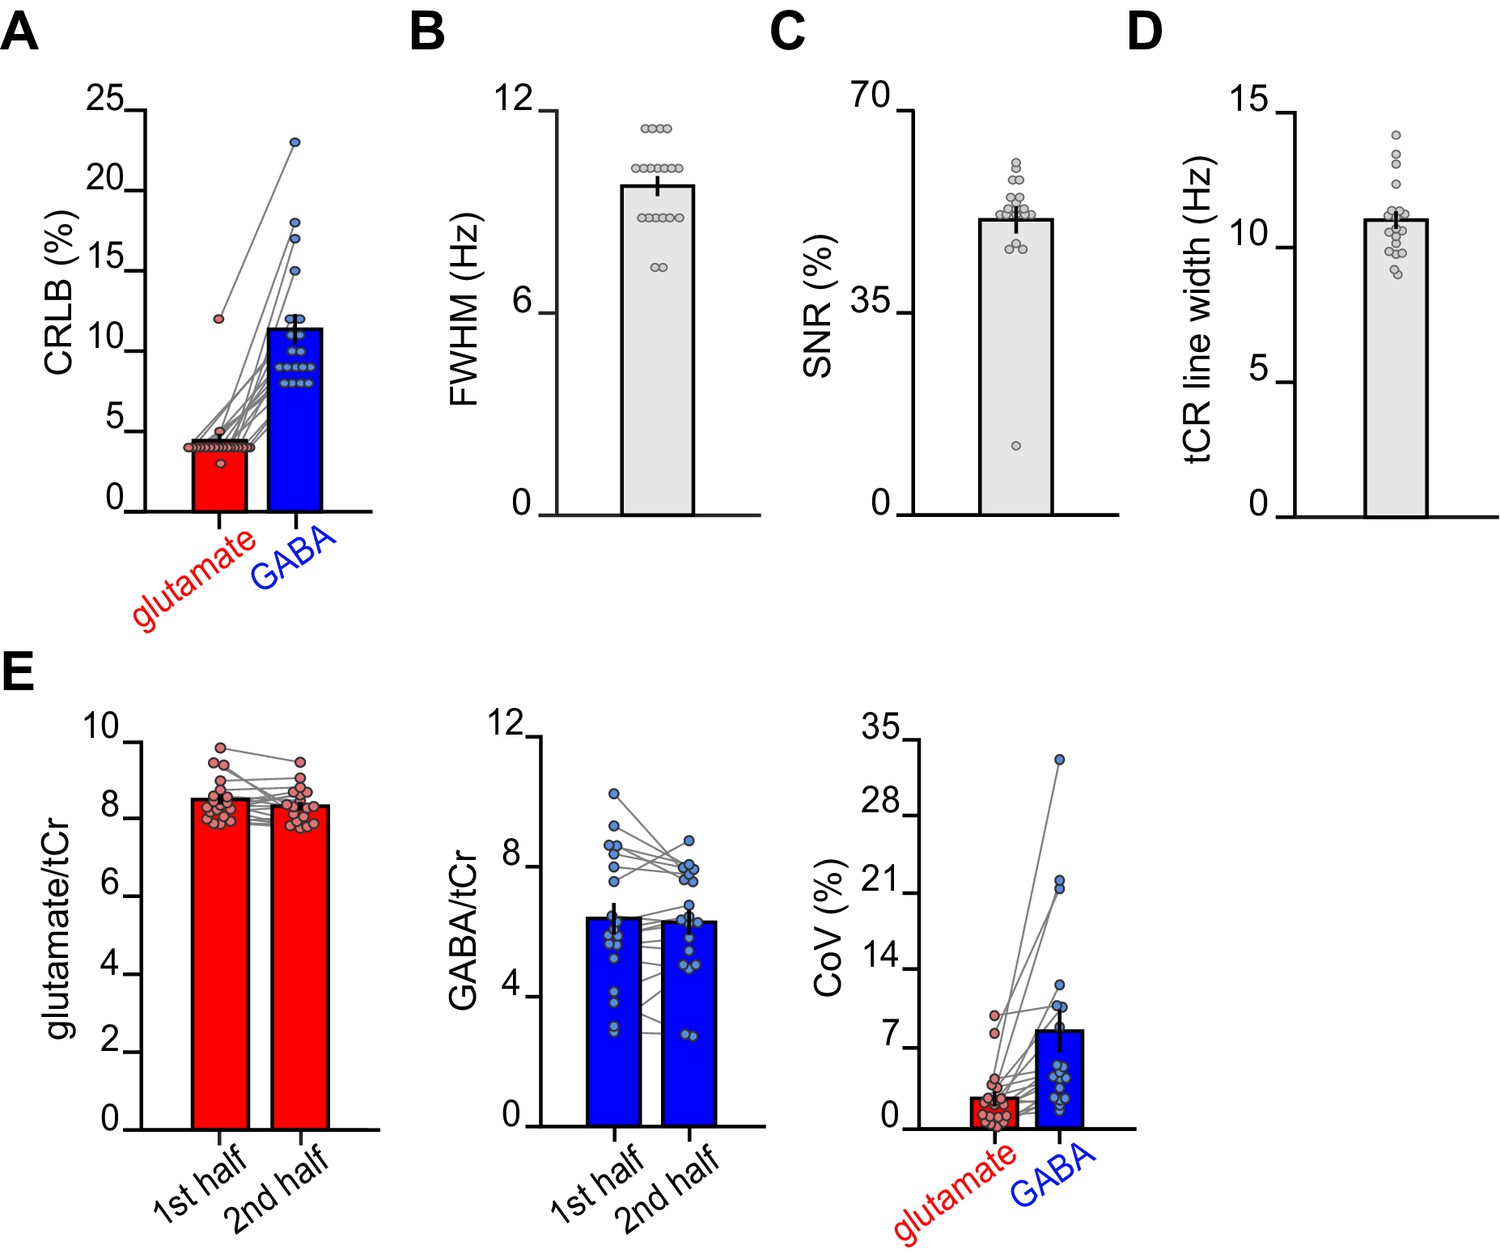
For each subject, quality metrics across all MRS spectra were assessed (mean total number of spectra: 457). (A) The average Cramér-Rao lower bound (CRLB) for glutamate was 4.42% ± 0.43% and the average CRLB for GABA was 11.37% ± 0.94% (mean ± SEM). (B) The average full width at half max (FWHM) as determined by LCModel was 9.86 ± 0.30 Hz (mean ± SEM). (C) The average signal-to-noise ratio (SNR) as determined by LCModel was 51.1% ± 2.37% (mean ± SEM). (D) The average line width of the total creatine (tCr) peak was estimated to be 11.01 ± 0.32 Hz (mean ± SEM). (E) The intra-subject coefficient of variance (CoV) was estimated by splitting the dataset into two equal halves (on average 278 spectra in each half) and analysing each half in LCModel. We defined CoV as the standard deviation between the two halves divided by their mean. The intra-subject CoV for glutamate was 2.68% ± 0.62%, and the intra-subject CoV for GABA was 8.74% ± 1.95% (mean ± SEM). These findings demonstrate stability in our MRS measurements over the course of the scan task. Notably, this analysis differs from standard estimates of intra-subject CoV where test-retest is assessed across two separate scanning sessions.
Figure 4—figure supplement 4
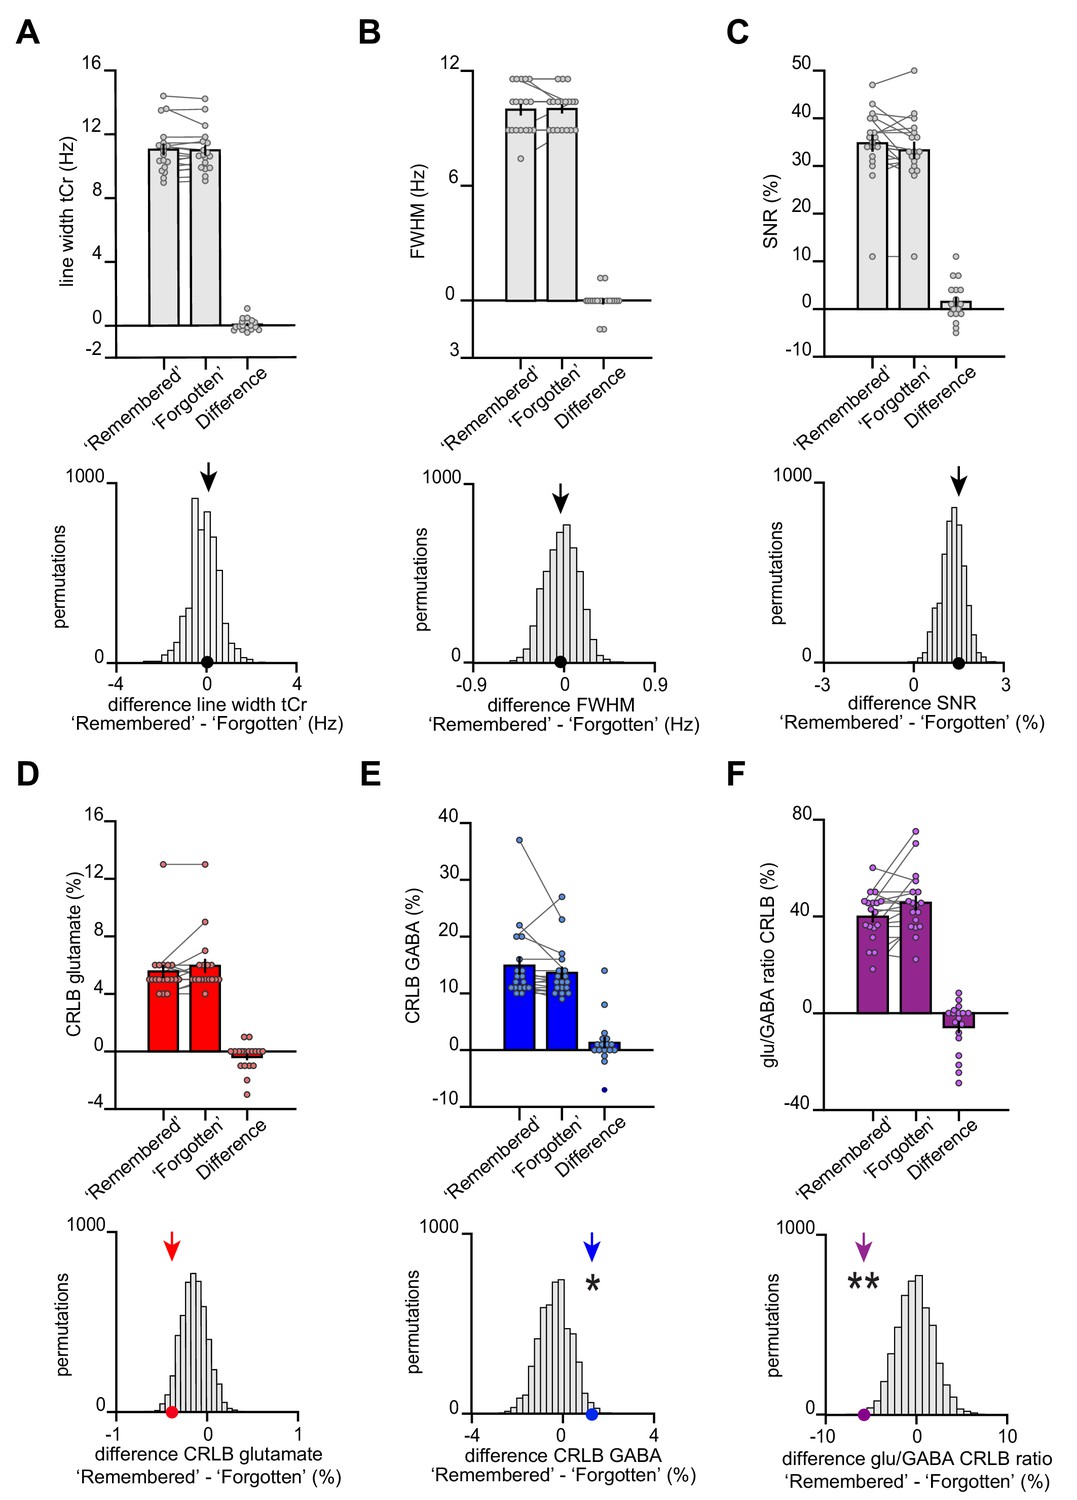
The transient break in glu/GABA ratio observed during recall cannot be explained by changes in data quality metrics or goodness of model fit.
(A–B) At 7 T, increases in blood oxygen level-dependent (BOLD) effects alter T2* of metabolite signals, a phenomenon that results in line narrowing of all signals in the spectrum (Mangia et al., 2006). This phenomenon is most discernible on the strongest singlets such as total creatine (tCr). To assess the reliability of our functional magnetic resonance spectroscopy (fMRS) measures, we therefore quantified the difference in line width between our conditions of interest. These analyses show no significant difference in line width between categories ‘remembered’ and ‘forgotten’. Thus, as line width was matched across categories, there was no evidence for a category-specific bias in BOLD-related confounds for metabolite values reported in Figure 4. (A) The line width of the tCr peak was estimated for each participant for both the ‘remembered’ and ‘forgotten’ spectra acquired during the question period of the inference test. Across participants, we observed no difference in tCr line width between the two conditions of interest (‘remembered’–‘forgotten’: t17 = 0.61, p = 0.552) (mean ± SEM). To control for systematic differences in the number of ‘remembered’ and ‘forgotten’ trials, we compared the group mean difference in tCr (black arrow) against a null distribution generated by permuting the trial labels (×5000) and re-estimating the line width difference for ‘remembered’–‘forgotten’. Again, there was no significant difference between the group mean difference in tCr and the null distribution (p = 0.403). (B) To further quantify differences in line width for each participant’s ‘remembered’ and ‘forgotten’ spectra, we compared the full width at half maximum (FWHM). Between our two conditions of interest, we observed no significant difference in FWHM (‘remembered’–‘forgotten’: t17 = −0.21, p = 0.832) (mean ± SEM). There was no significant difference between the FWHM group mean for ‘remembered’–‘forgotten’ and its null distribution generated as described in (A) (p = 0.466). (C) To verify that the differences between ‘remembered’ and ‘forgotten’ cannot be attributed to a difference in signal strength, we assessed the SNR for both conditions. We observed no significant difference in SNR (‘remembered’–‘forgotten’: t17 = 1.55, p = 0.140). In addition, there was no significant difference between the SNR group mean difference for ‘remembered’–‘forgotten’ and its null distribution (p = 0.319). The positive shift of the null distribution can be explained by the difference in number of trials between the ‘remembered’ and ‘forgotten’ conditions (Supplementary file 6). (D–F) CRLB estimates can be applied to confirm the effects we observed in Figure 4D-F that is, that glutamate:tCr and glu/GABA ratio increases and GABA:tCr decreases for ‘remembered’ versus ‘forgotten’ spectra. CRLB% estimates decrease (indicating more confident model fit) as metabolite concentrations increase, and vice versa. For the difference between conditions (‘remembered’–‘forgotten’), the increase in the relative concentration of glutamate has a negative effect on CRLBs, while the decrease in the relative concentration of GABA has a positive effect on CRLBs. Indeed, we observed a decrease in glu/GABA CRLB, supporting the observed increase in glu/GABA ratio for ‘remembered’ versus ‘forgotten’ (‘remembered’–‘forgotten’, glutamate:tCr: t17 = −1.69, p = 0.110; GABA:tCr: t17 = 1.28, p = 0.218; glu/GABA ratio: t17 = −2.29, p = 0.035). Next, we compared the true group mean CRLBs (‘remembered’–‘forgotten’) with null distributions generated by permuting the trial labels. Relative to these respective null distributions, we asked whether the true difference in CRLBs for ‘remembered’ ‘forgotten’ was negative for glutamate and glu/GABA ratio, and positive for GABA. For glutamate and glu/GABA ratio, we observed significant differences between the CRLB group means and their respective null distributions in the expected direction: CRLBs for glutamate and glu/GABA ratio were significantly negative (glutamate:tCr: p = 0.071; GABA:tCr: p = 0.011; glu/GABA ratio: p = 0.002). These control analyses support the differences between ‘remembered’ and ‘forgotten’ spectra we report in Figure 4D–F. * indicates p < 0.05, ** indicates p < 0.01.
Figure 4—figure supplement 5
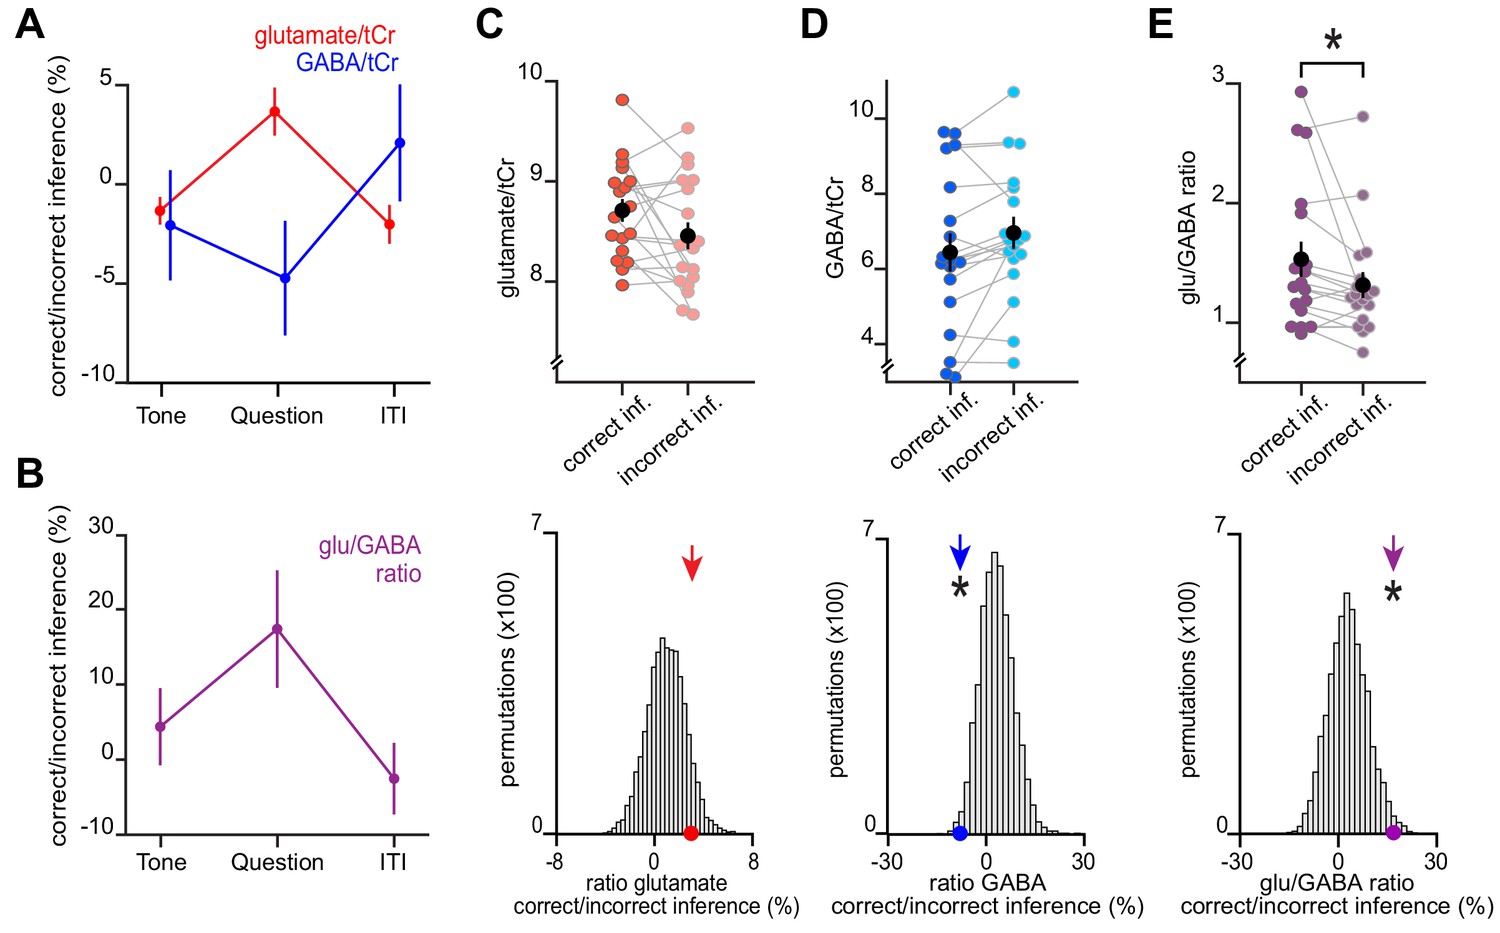
An increase in glu/GABA ratio in primary visual cortex (V1) during memory recall is also observed when categorising trials into ‘remembered’ and ‘forgotten’ using a less conservative approach.
Here, we repeated the analyses in Figure 4 using only performance on the inference test to categorize trials from the inference test into ‘remembered’ (correct inference) and ‘forgotten’ (incorrect inference). (A–B) Similar to using the more conservative definition for ‘remembered’ and ‘forgotten’ shown in Figure 4, glu/GABA ratio significantly increased during the question period for ‘remembered’ versus ‘forgotten’ trials (‘correct inference’:‘incorrect inference’, glu/GABA ratio: t17 = 2.23, p = 0.039). One participant (n = 1) was excluded from this analysis, where there were less than eight spectra for either the ‘remembered’ or ‘forgotten’ conditions during the question period. This break in glu/GABA ratio was not observed during the ‘tone’ (~7 s) or inter-trial interval (‘ITI’) (~2.7 s) periods (‘tone’, glu/GABA ratio: t18 = 0.87, p = 0.395; ‘ITI’, glu/GABA ratio: t18 = −0.51, p = 0.616). (C–E) Upper row: Metabolite values and glu/GABA ratio during the question period for ‘remembered’ and ‘forgotten’ trials (mean ± SEM). Lower row: Comparison of the mean ratio of ‘correct inference’ to ‘incorrect inference’ (coloured arrows) against null distributions generated by permuting the trial labels (×5000) to control for any potential biases in the analyses. Relative to the null distributions, GABA significantly decreased while glu/GABA ratio significantly increased (glutamate:tCr: p = 0.088; GABA:tCr: p = 0.017; glu/GABA ratio: p = 0.011). * indicates p < 0.05.
Figure 4—figure supplement 6
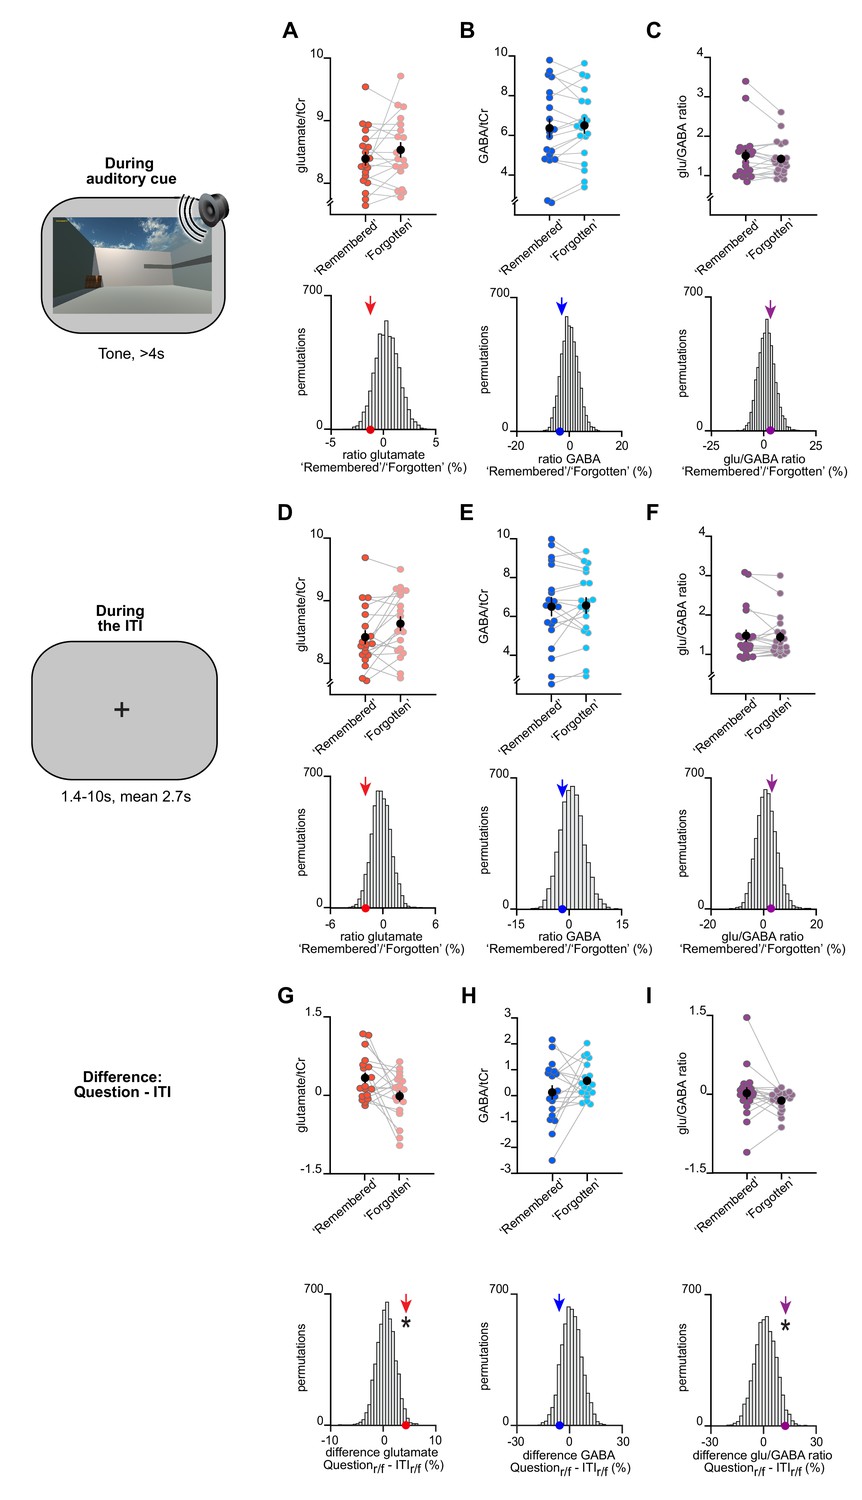
The change in glu/GABA ratio is transient and only observed during memory recall.
(A–F) Upper rows: The difference in metabolite ratios for ‘remembered’ versus ‘forgotten’ trials during the auditory cue period (A–C) and inter-trial interval (ITI) period (D–F) (mean ± SEM). Lower rows: To control for any biases due to differences in the number of ‘remembered’ and ‘forgotten’ trials, we compared the group mean (coloured arrows) against a null distribution generated by permuting the trial labels (×5000). MRS voxel shown in Figure 3D. (A–C) During the auditory cue period, there was no significant increase in glu/GABA ratio between ‘remembered’ and ‘forgotten’ trials (‘remembered’:‘forgotten’, glutamate:tCr: t18 = −1.34, p = 0.198; GABA:tCr: t18 = 1.11, p = 0.282; glu/GABA ratio: t18 = 1.01, p = 0.325). Similarly, there was no significant difference between any of the group means and their respective null distributions (glutamate:tCr: p = 0.107; GABA:tCr: p = 0.191; glu/GABA ratio: p = 0.314). (D–F) During the ITI period, there was no significant increase in glu/GABA ratio between ‘remembered’ and ‘forgotten’ trials (‘remembered’:‘forgotten’, glutamate:tCr: t18 = −2.27, p = 0.036; GABA:tCr: t18 = −0.44, p = 0.661; glu/GABA ratio: t18 = 0.40, p = 0.692). For GABA and glu/GABA ratio, there were no differences between any of the group means and their respective null distributions, although a significant decrease was observed for glutamate (glutamate:tCr: p = 0.029; GABA:tCr: p = 0.223; glu/GABA ratio: p = 0.386). (G–I) To test whether the break in glu/GABA ratio was transient and only observed during memory recall, we compared our measure of glu/GABA ratio for ‘remembered’:‘forgotten’ during the question period (‘Question’) to the period immediately after (‘ITI’) on the same trial. To control for the difference in numbers of trials between conditions, we compared the difference of the group means to a permuted null distribution. Compared to the respective null distributions, a significant difference was observed for glutamate and glu/GABA ratio between the group means for ‘Question’ versus ‘ITI’ (glutamate:tCr: p = 0.017; GABA:tCr: p = 0.124; glu/GABA ratio: p = 0.033). ‘r/f’ indicates ‘remembered’:‘forgotten’; * indicates p < 0.05.
Figure 4—figure supplement 7

The changes in metabolite concentrations cannot be attributed to changes in NAA:tCr (total creatine).
(A) No significant change between ‘remembered’ and ‘forgotten’ trials was observed for NAA during the ‘Question’ period of the inference test trials (remembered:forgotten NAA:tCr: t17 = −0.58, p = 0.570). Notably, NAA has overlapping peaks with GABA but is found at higher concentration. (B) Left: Metabolite values during the 'Question' period for ‘remembered’ and ‘forgotten’ trials (mean ± SEM). Right: Ratios between ‘remembered’:’forgotten’ (black arrows) against null distributions generated by permuting the trial labels. Relative to the null distributions, the mean NAA ratio showed no significant difference (NAA:tCr: p = 0.220).
Figure 4—figure supplement 8
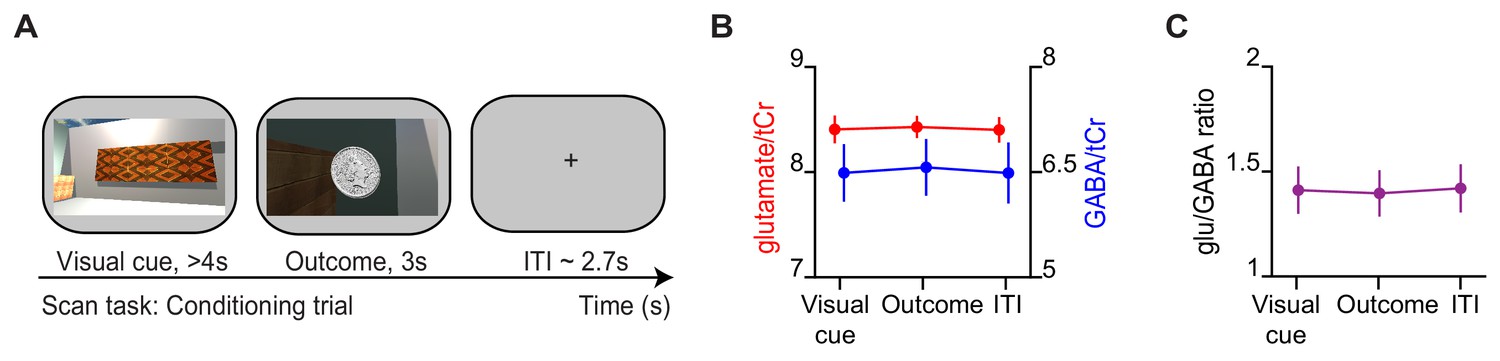
During conditioning trials, no difference in glu/GABA ratio was observed.
(A) Example conditioning trial encountered during the magnetic resonance imaging (MRI) scan task. (B) The concentration of glutamate:tCr and GABA:tCr during the ‘visual cue’, ‘outcome’, and inter-trial interval (‘ITI’) periods of conditioning trials. (C) glu/GABA ratio did not change during presentation of the visual cue or outcome, relative to the ITI period (‘visual cue’–’ITI’: t18 = −0.18, p = 0.862; ‘outcome’–‘ITI’: t18 = −0.32, p = 0.754).
Figure 5 with 1 supplement
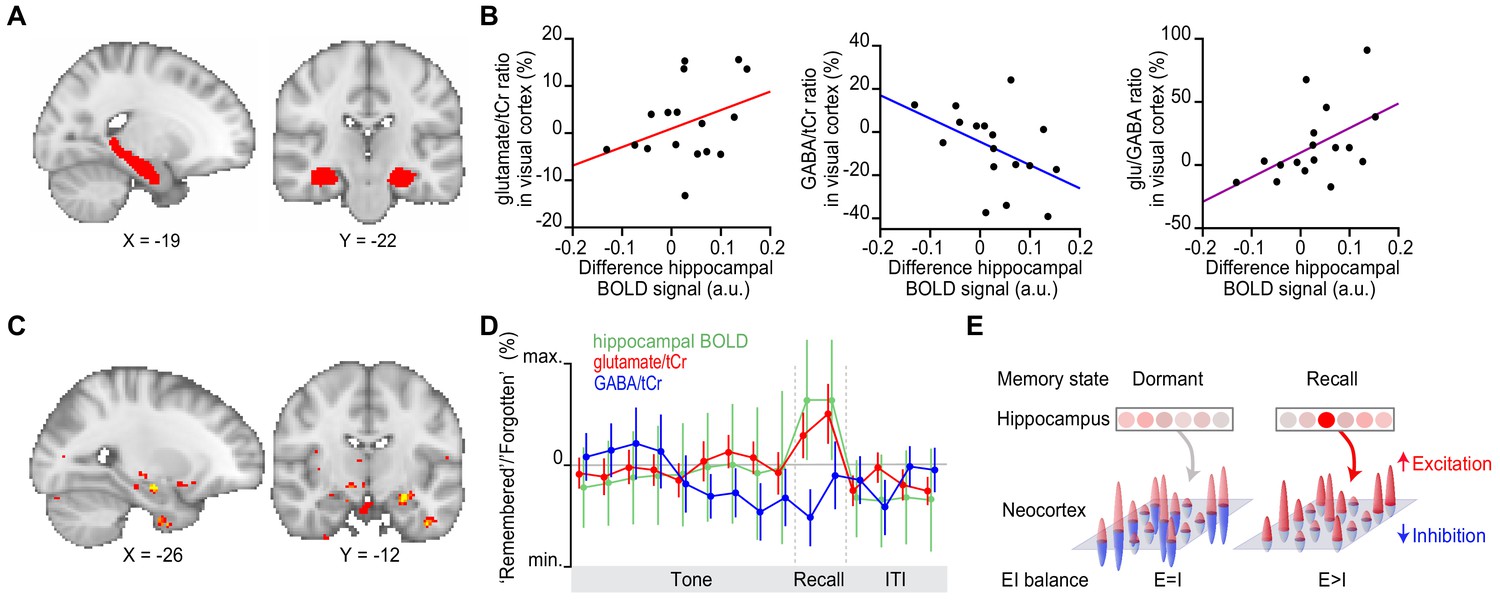
Hippocampal blood oxygen level-dependent (BOLD) signal predicts neocortical glu/GABA ratio during recall.
(A) Region of interest (ROI) in the hippocampus (red). MNI coordinates. (B) Across participants, the increase in hippocampal BOLD signal during ‘remembered’ compared to ‘forgotten’ trials positively predicted the decrease in GABA and the increase in glu/GABA ratio observed in primary visual cortex (V1) (Figure 4) (glutamate:tCr [total creatine]: r15 = 0.14, p = 0.585; GABA:tCr: r15 = −0.56, p = 0.022; glu/GABA ratio: r15 = 0.52, p = 0.033). (C) Across the imaged brain volume, for ‘remembered’ versus ‘forgotten’ trials, the correlation between the BOLD signal and V1 glu/GABA ratio was selectively observed in the left hippocampus (t16 = 11.37, p = 0.005, whole-brain family wise error (FWE)-corrected; Supplementary file 7; MNI coordinates). (D) Moving average showing the ratio of ‘remembered’ to ‘forgotten’ trials during the inference test: hippocampal BOLD signal (green, range [–4:4]), glutamate:tCr (red, range [–8:8]), GABA:tCr (blue, range [–15:15]). Each point represents a 2.5 s time bin (mean ± SEM). By incorporating a random jitter in the behavioural paradigm, MRS spectra across all trials and all participants were acquired in all possible 2.5 s time bins of the inference test trial (Figure 4—figure supplement 1), thus achieving a higher temporal resolution than the TR of 4 s (see Materials and methods). (E) Schematic illustrating how the hippocampus may facilitate (if indirectly) memory recall of a sensory cue during a transient break in neocortical EI balance.
-
Figure 5—source data 1
Region of interest (ROI) in the hippocampus.
- https://cdn.elifesciences.org/articles/70071/elife-70071-fig5-data1-v2.zip
-
Figure 5—source data 2
Hippocampal BOLD contrast for ‘remembered’–‘forgotten’ versus glutamate:tCr, GABA:tCr and glu/GABA ‘remembered’/‘forgotten’ ratio.
- https://cdn.elifesciences.org/articles/70071/elife-70071-fig5-data2-v2.zip
-
Figure 5—source data 3
SPM output for correlation between ‘remembered’–‘forgotten’ contrast and glu/GABA ratio.
- https://cdn.elifesciences.org/articles/70071/elife-70071-fig5-data3-v2.zip
-
Figure 5—source data 4
Moving average of the ratio of ‘remembered’ to ‘forgotten’ trials during the inference test for the hippocampal BOLD signal, glutamate:tCr and GABA:tCr.
- https://cdn.elifesciences.org/articles/70071/elife-70071-fig5-data4-v2.zip
Figure 5—figure supplement 1
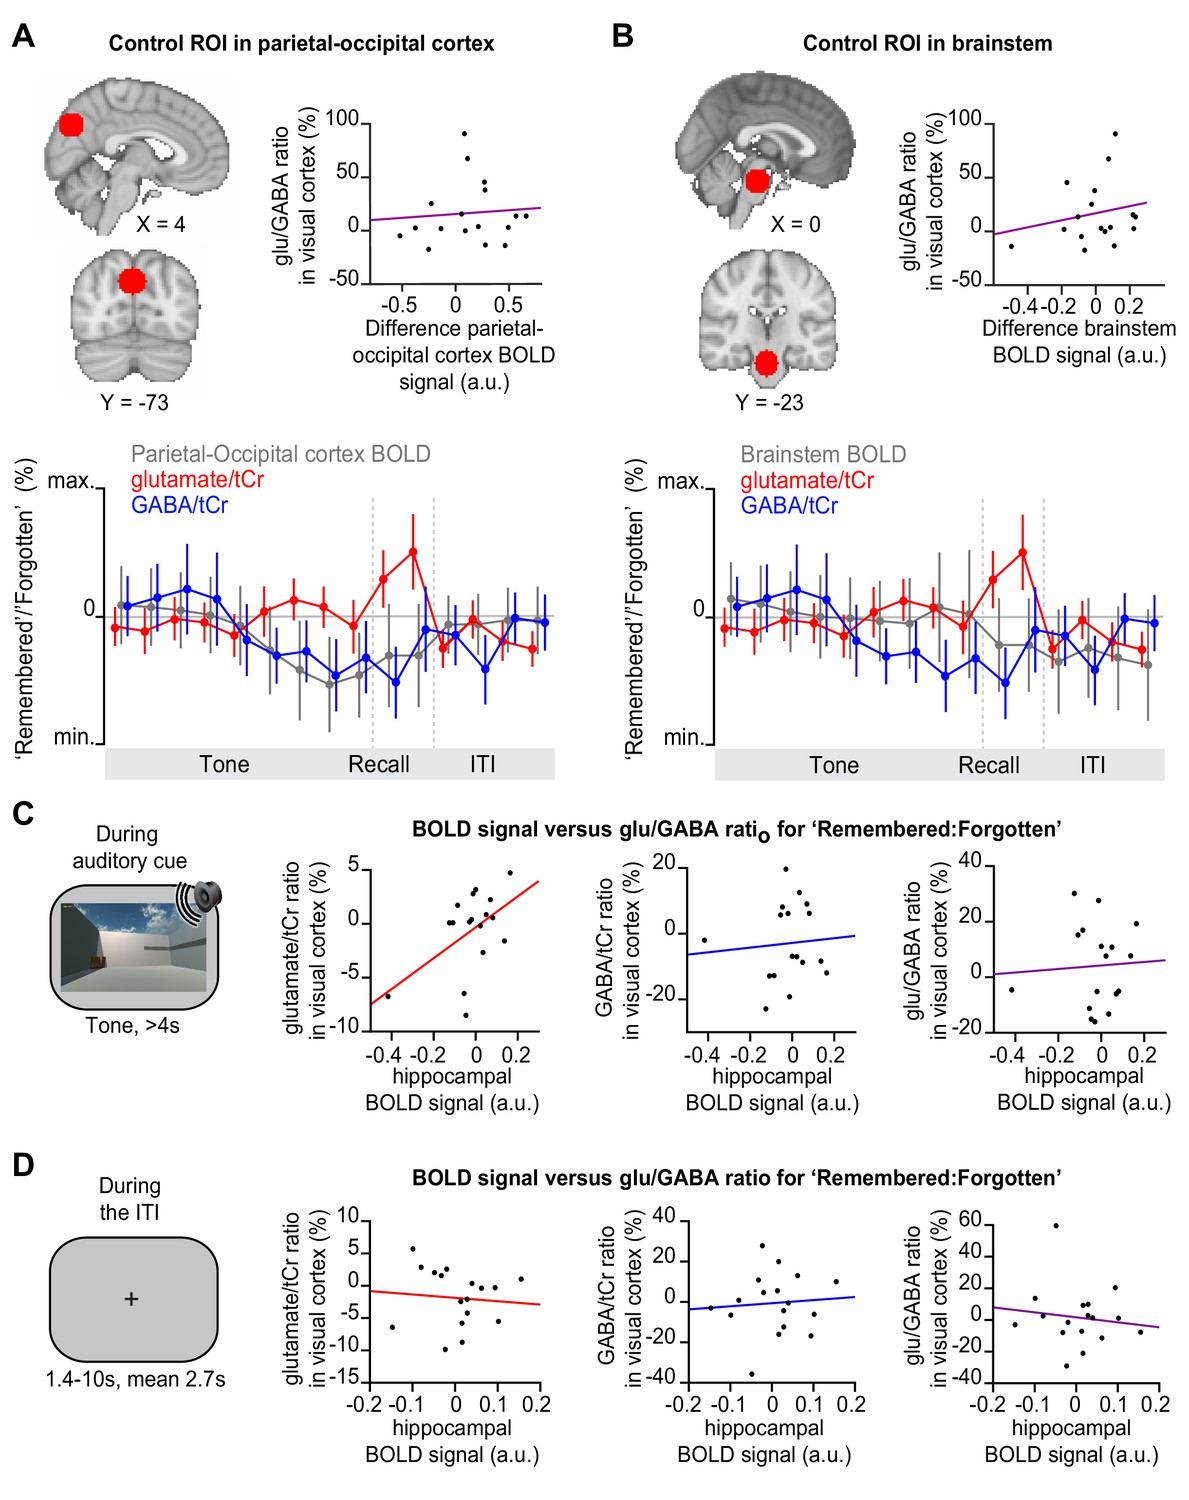
Before and after memory recall, the hippocampal blood oxygen level-dependent (BOLD) signal did not positively predict glu/GABA ratio in primary visual cortex (V1).
(A–B) Control analyses for Figure 5D; MNI coordinates. Upper left: Regions of interest (ROIs) in parietal-occipital cortex (A) and brain stem (B), defined using a 12 mm sphere. Note: These control regions were restricted to the partial epi volume shown in Figure 3A. Upper right: In these two brain regions, the difference in the BOLD signal for ‘remembered’ versus ‘forgotten’ trials did not significantly predict the increase in glu/GABA ratio observed in V1 (Figure 4B and F) (A, parietal-occipital cortex: r15 = 0.14, p = 0.592; B, brain stem: r15 = 0.28, p = 0.281). Lower: Moving average showing the ratio of ‘remembered’ to ‘forgotten’ trials during the inference test: BOLD signal from parietal-occipital cortex (A, range [–10:10]) and brain stem (B, range [–4:4]) shown in grey, glutamate:tCr (total creatine) (red, range [–8:8]), GABA:tCr (blue, range [–15:15]). Each point represents a 2.5 s time bin (mean ± SEM). By incorporating a random jitter in the behavioural paradigm, MRS spectra across all trials and all participants were acquired in all possible 2.5 s time bins of the inference test trial (Figure 4—figure supplement 1), thus achieving a higher temporal resolution than the TR of 4 s (see Materials and methods). (C–D) During ‘remembered’ relative to ‘forgotten’ trials on the inference test (the question period, Figure 1D), we observed a significantly positive correlation between the hippocampal BOLD signal and glu/GABA ratio in visual cortex (Figure 5B–C). To assess how transient this relationship was, we assessed the relationship between hippocampal BOLD and neocortical glu/GABA ratio during the period immediately before (C) and after the question period (D). (C) Immediately prior to the question period, during presentation of the auditory cue (‘tone’), the change in hippocampal BOLD signal between subsequently ‘remembered’ and ‘forgotten’ trials did not predict the equivalent change in glu/GABA ratio in V1. However, during the auditory cue a trend towards a positive relationship was observed between the hippocampal BOLD signal and glutamate ratio in V1 (glutamate:tCr: r15 = 0.427, p = 0.089; GABA:tCr: r15 = 0.20, p = 0.438; glu/GABA ratio: r15 = −0.05, p = 0.846; hippocampal ROI as shown in Figure 5A). (D) Immediately after the question period, during the inter-trial interval (‘ITI’), the change in hippocampal BOLD signal between subsequently remembered and forgotten trials did not predict the equivalent change in glu/GABA ratio in V1 (glutamate:tCr: r15 = −0.21, p = 0.421; GABA:tCr: r15 = −0.02, p = 0.951; glu/GABA ratio: r15 = −0.05, p = 0.854; hippocampal ROI as shown in Figure 5A).
Additional files
-
Supplementary file 1
The effect of sex on behaviour and on glu/GABA ratio in primary visual cortex (V1).
Using a general linear model (GLM), differences in sex (male or female) were regressed onto behavioural performance during both the inference test and associative test, and onto glu/GABA ratio during the question period of the inference test. No significant effect of sex was observed.
- https://cdn.elifesciences.org/articles/70071/elife-70071-supp1-v2.docx
-
Supplementary file 2
Number of trials per condition.
The number of trials per condition, reported as mean ± SEM.
- https://cdn.elifesciences.org/articles/70071/elife-70071-supp2-v2.docx
-
Supplementary file 3
Number of trials split according to outcome.
The number of inference trials per condition (‘remembered’ and ‘forgotten’, see Materials and methods for definition), split according to whether the auditory cue was indirectly associated with a rewarding or neutral outcome (set 1: rewarded; set 2: neutral), reported as mean ± SEM. There was no significant difference in the number of trials split by set (memory set, two-way ANOVA: F(1,68)=0.67, p = 0.424). Notably, the average difference in the total number of trials in set 1 and 2 was less than one trial, suggesting memory recall was not confounded by reward status.
- https://cdn.elifesciences.org/articles/70071/elife-70071-supp3-v2.docx
-
Supplementary file 4
Functional magnetic resonance imaging (fMRI) contrast for ‘remembered’–‘forgotten’.
The fMRI blood oxygen level-dependent (BOLD) signal was assessed for a contrast comparing ‘remembered’ and ‘forgotten’ trials (Figure 3B) in the inference test. Brain regions that survived whole-volume correction for multiple comparisons are listed (p < 0.05 with whole-brain family wise error [FWE] correction at the cluster level). Montreal Neurological Institute (MNI) coordinates are listed. Notably, the activation in hippocampus was bilateral but the peak on the right-hand side was not significant when applying whole-brain FWE correction (t17 = 3.74, p > 0.05 [x = 22, y=-24, z=−13]).
- https://cdn.elifesciences.org/articles/70071/elife-70071-supp4-v2.docx
-
Supplementary file 5
Inter-subject covariance of glutamate and GABA.
Inter-subject covariances (%) for the key metabolite measurements during the ‘Question’ period of inference trials (presented in Figure 4D–E).
- https://cdn.elifesciences.org/articles/70071/elife-70071-supp5-v2.docx
-
Supplementary file 6
Average number of spectra (NEX).
The number of spectra contributing to metabolite estimates during the various trial periods in the inference test (mean ± SEM).
- https://cdn.elifesciences.org/articles/70071/elife-70071-supp6-v2.docx
-
Supplementary file 7
Covariance between hippocampal blood oxygen level-dependent (BOLD) signal and functional magnetic resonance spectroscopy (fMRS) for remembered versus forgotten.
The relationship between functional magnetic resonance imaging (fMRI) and fMRS during ‘remembered’ versus ‘forgotten’ trials in the inference test was assessed. To this end, fMRS measures of glu/GABA ratio from primary visual cortex (V1) for ‘remembered’–‘forgotten’ were included as covariates in a group analysis for the equivalent fMRI contrast (p < 0.05 with family wise error [FWE] correction at the cluster level). The only brain region to survive whole-brain correction for multiple comparisons was the left hippocampus. Thus, the BOLD signal in left hippocampus significantly predicted individual differences in glu/GABA ratio measured from V1 during memory recall; MNI coordinates.
- https://cdn.elifesciences.org/articles/70071/elife-70071-supp7-v2.docx
-
Supplementary file 8
Minimum reporting standards in MRS (MRSinMRS) checklist.
- https://cdn.elifesciences.org/articles/70071/elife-70071-supp8-v2.docx
-
Transparent reporting form
- https://cdn.elifesciences.org/articles/70071/elife-70071-transrepform1-v2.pdf
Download links
A two-part list of links to download the article, or parts of the article, in various formats.
Downloads (link to download the article as PDF)
Open citations (links to open the citations from this article in various online reference manager services)
Cite this article (links to download the citations from this article in formats compatible with various reference manager tools)
Memory recall involves a transient break in excitatory-inhibitory balance
eLife 10:e70071.
https://doi.org/10.7554/eLife.70071


