Gaps in global wildlife trade monitoring leave amphibians vulnerable
- Centre for Integrative Conservation, Xishuangbanna Tropical Botanical Garden, China
- School of Biology, Institute of Science, Suranaree University of Technology, Thailand
Figures
Figure 1
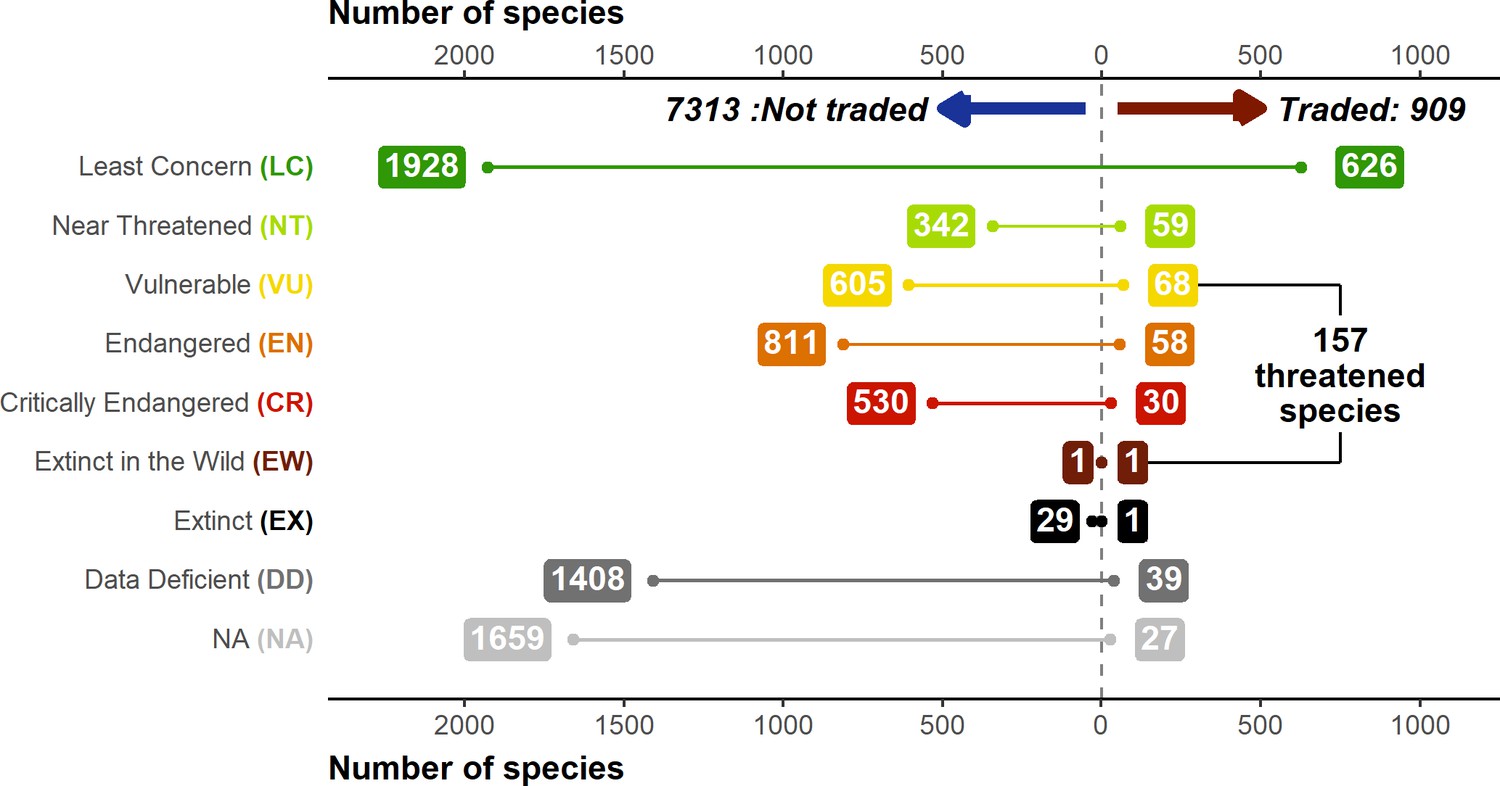
Breakdown of IUCN Redlist status of traded and not-traded amphibian species.
IUCN assessments based on data from AmphibiaWeb. Inclusion as a traded species based on appearance in online searches (2004–2019 and 2020 online contemporary sample), Law Enforcement Management Information System (LEMIS) (2000–2014), and Convention on International Trade in Endangered Species (CITES) data sources (1975–2019). Generated using Source code 8 and Source data 10.
Figure 2 with 4 supplements
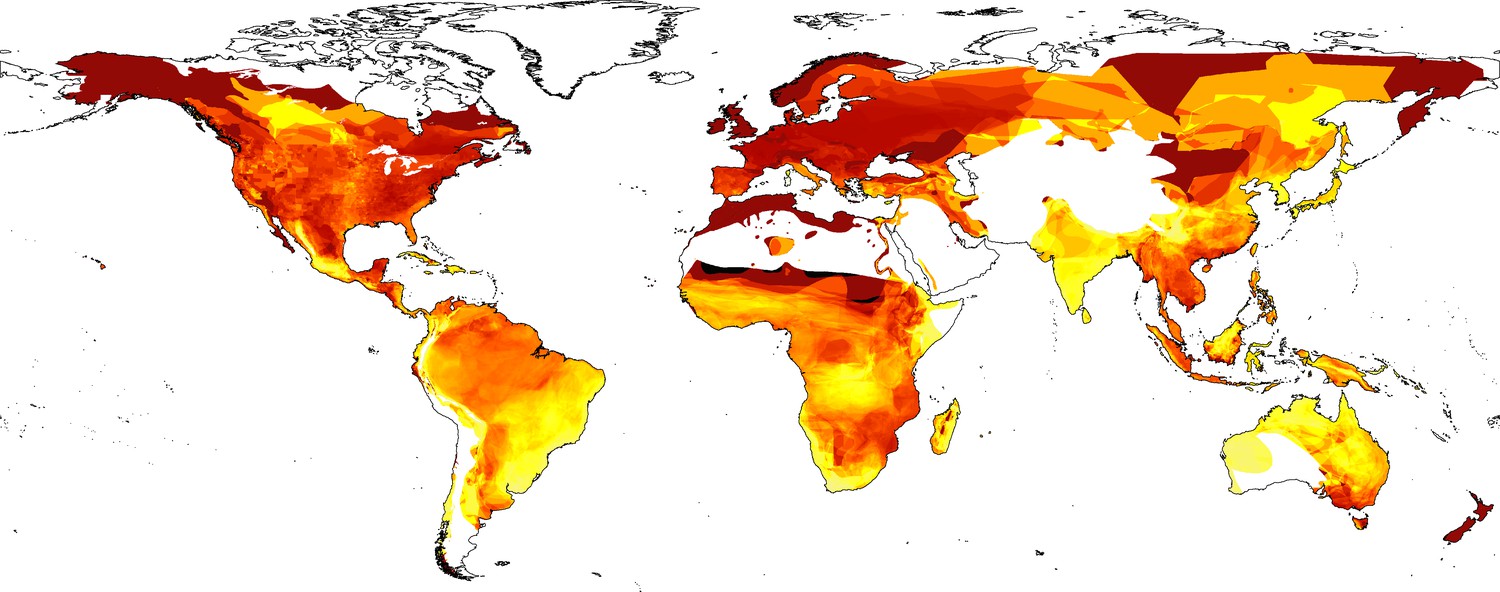
Percentage of species in trade based on three combined contemporary datasets (Law Enforcement Management Information System [LEMIS], Convention on International Trade in Endangered Species [CITES], Online [yellow (0%)-red-black (100%)]).
Also see Figure 2—figure supplements 1, 2, 3, and 4 for patterns of individual countries and inventories.
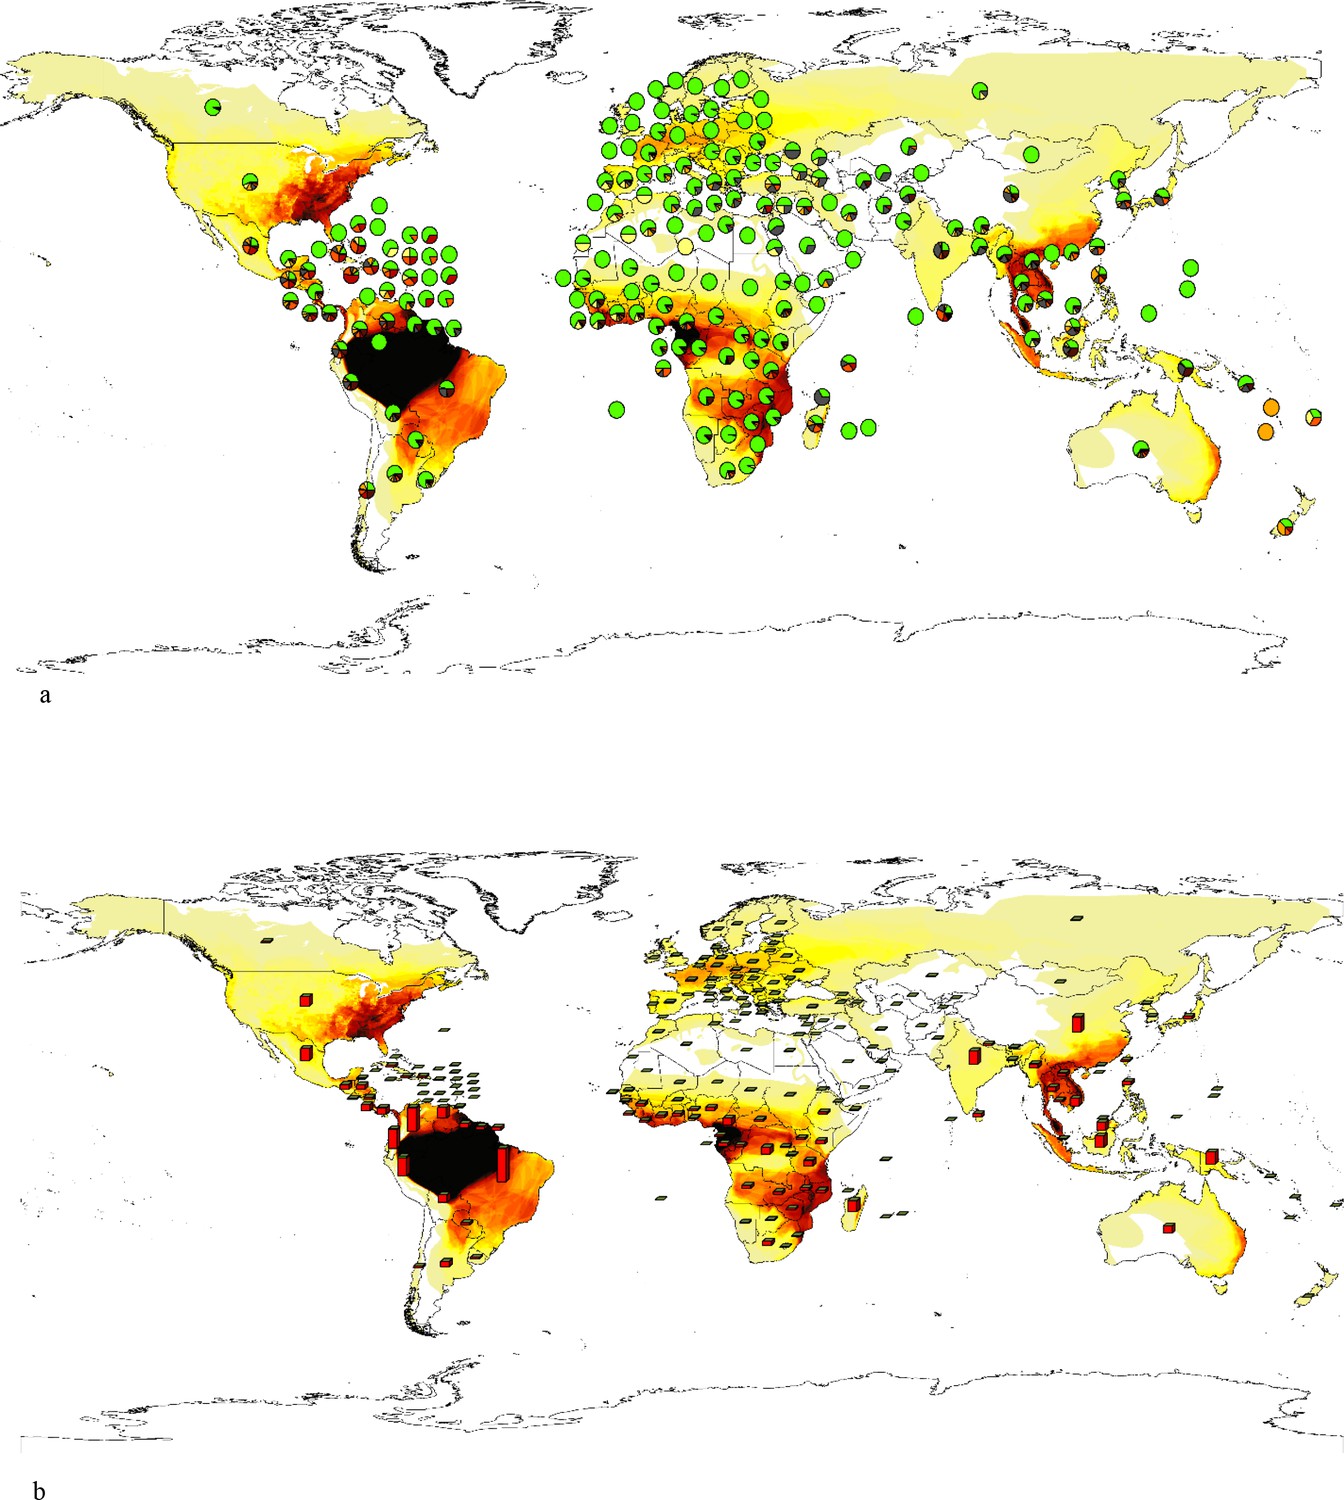
Figure 2—figure supplement 1
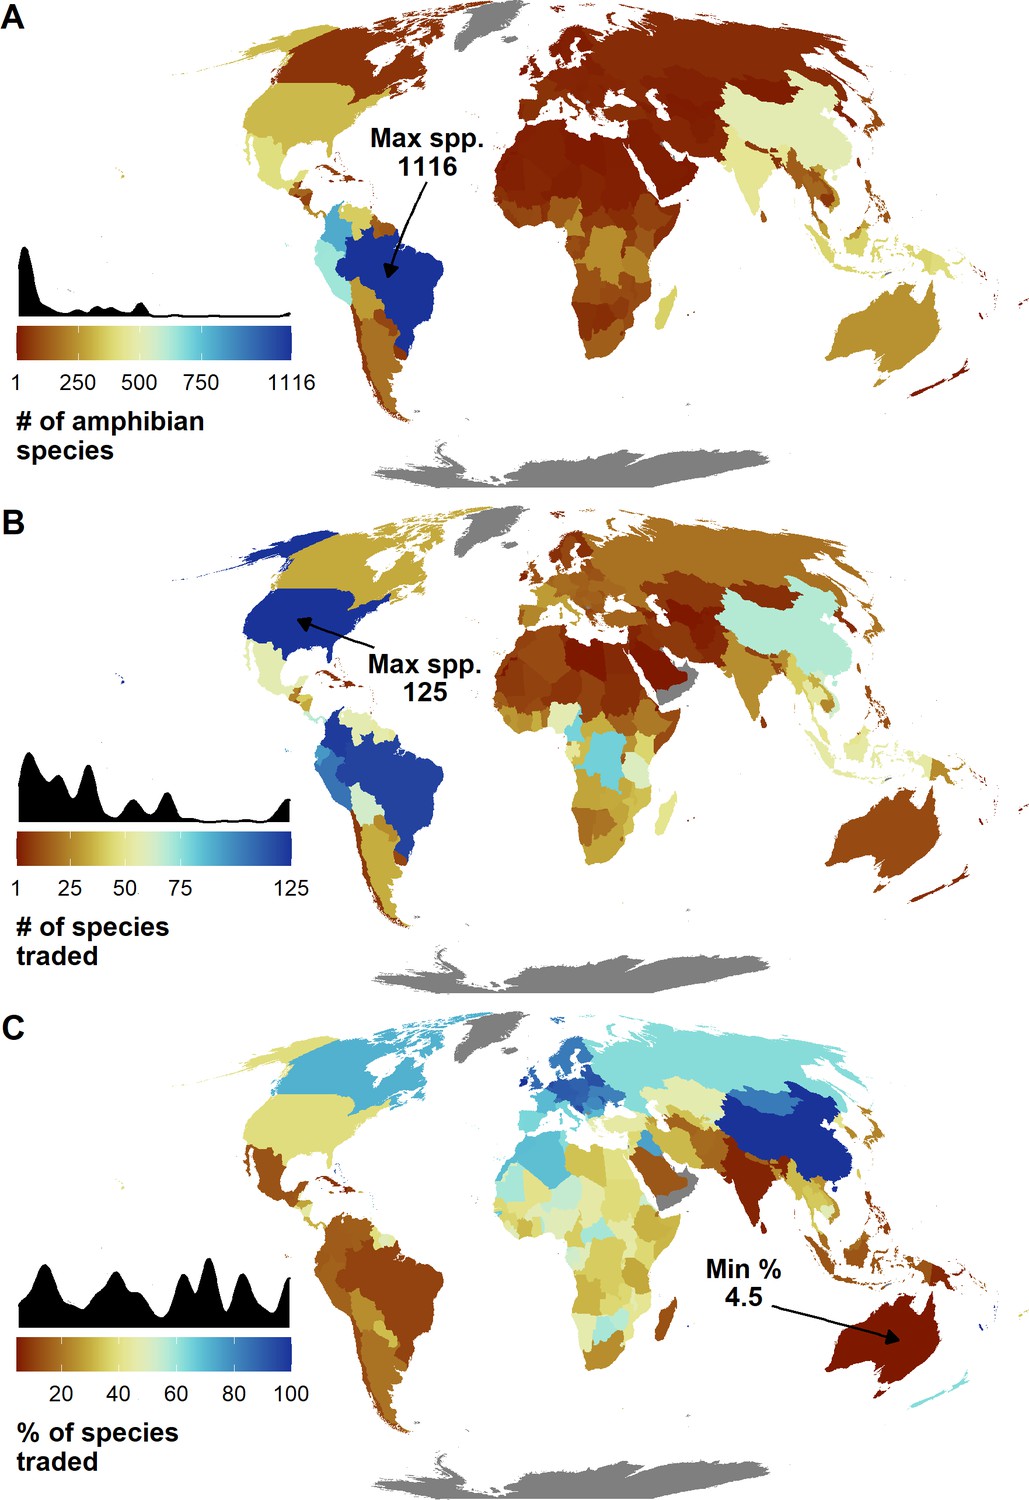
Map of trade by country derived from Online, Law Enforcement Management Information System (LEMIS), and Convention on International Trade in Endangered Species (CITES) trade data, and mapped using AmphibiaWeb distribution data.
(A) The number of amphibian species present in a country. (B) The number of species present in that country and also present in the trade. (C) The % of species found in a country that are traded.
Figure 2—figure supplement 2
Species traded from different trade inventories.
Figure 2—figure supplement 3
Maps of national statistics of species with different IUCN.
Redlist status and Convention on International Trade in Endangered Species (CITES) listing in trade.
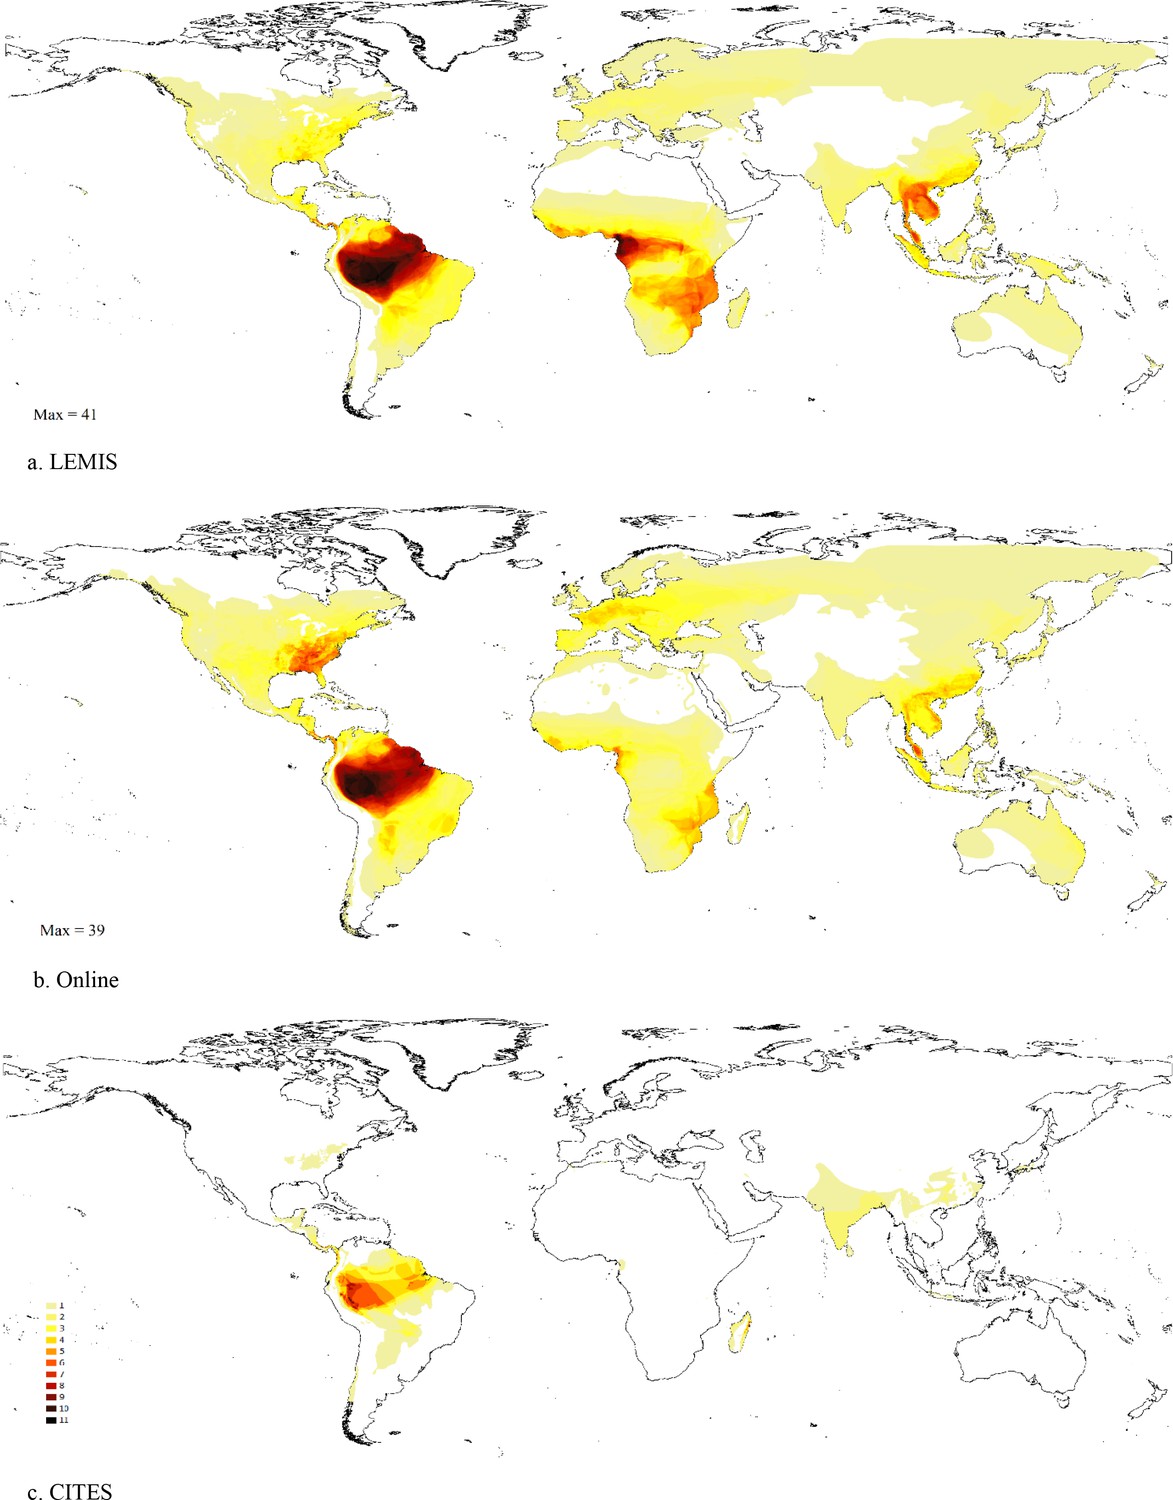
Figure 2—figure supplement 4
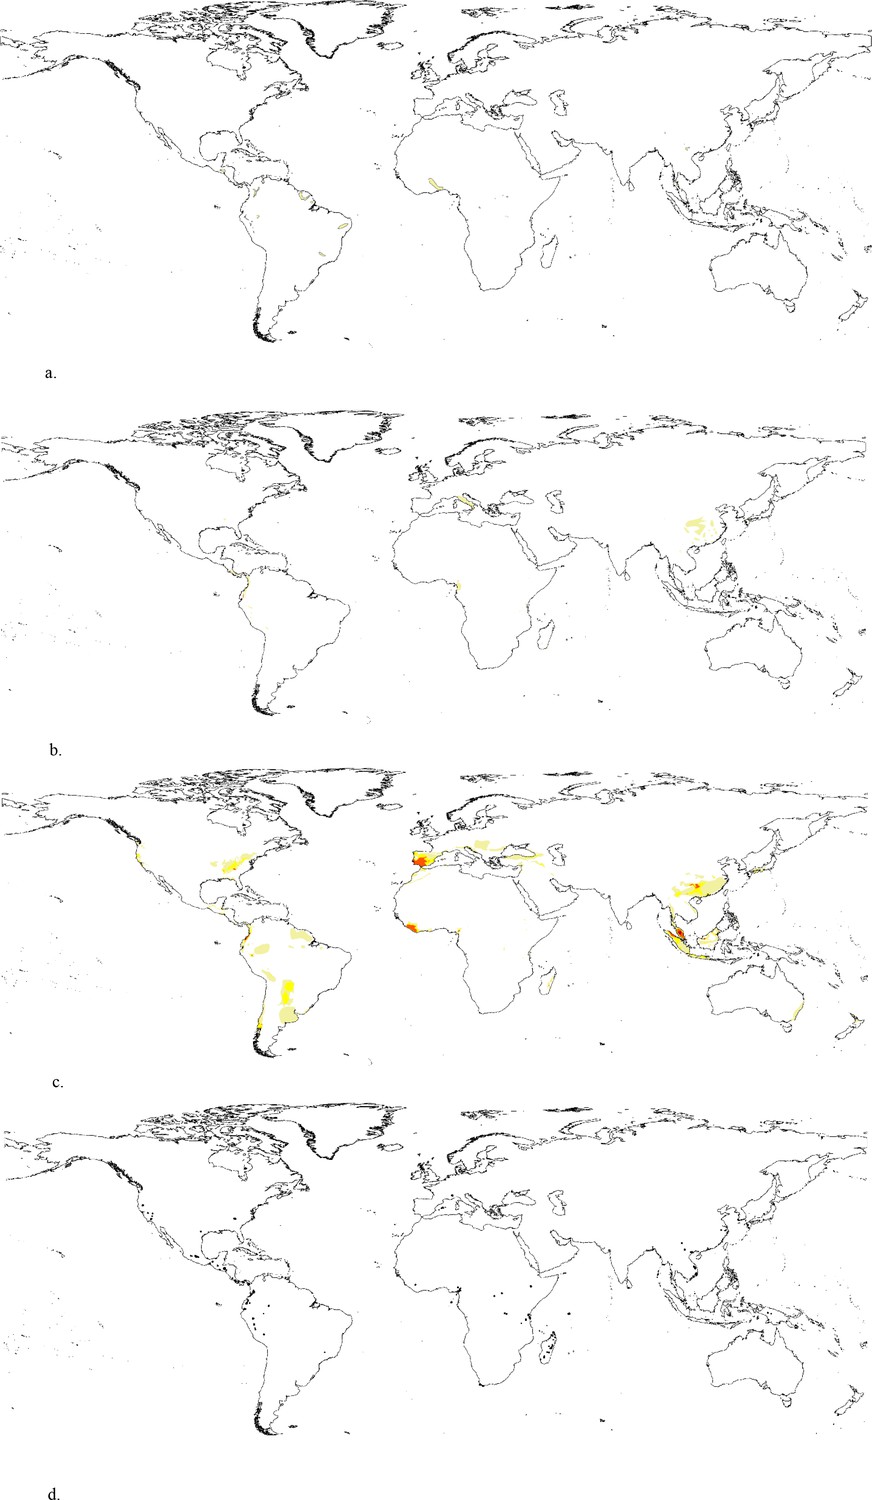
Maps of threatened species in trade based on the three trade inventories.
Figure 3 with 6 supplements
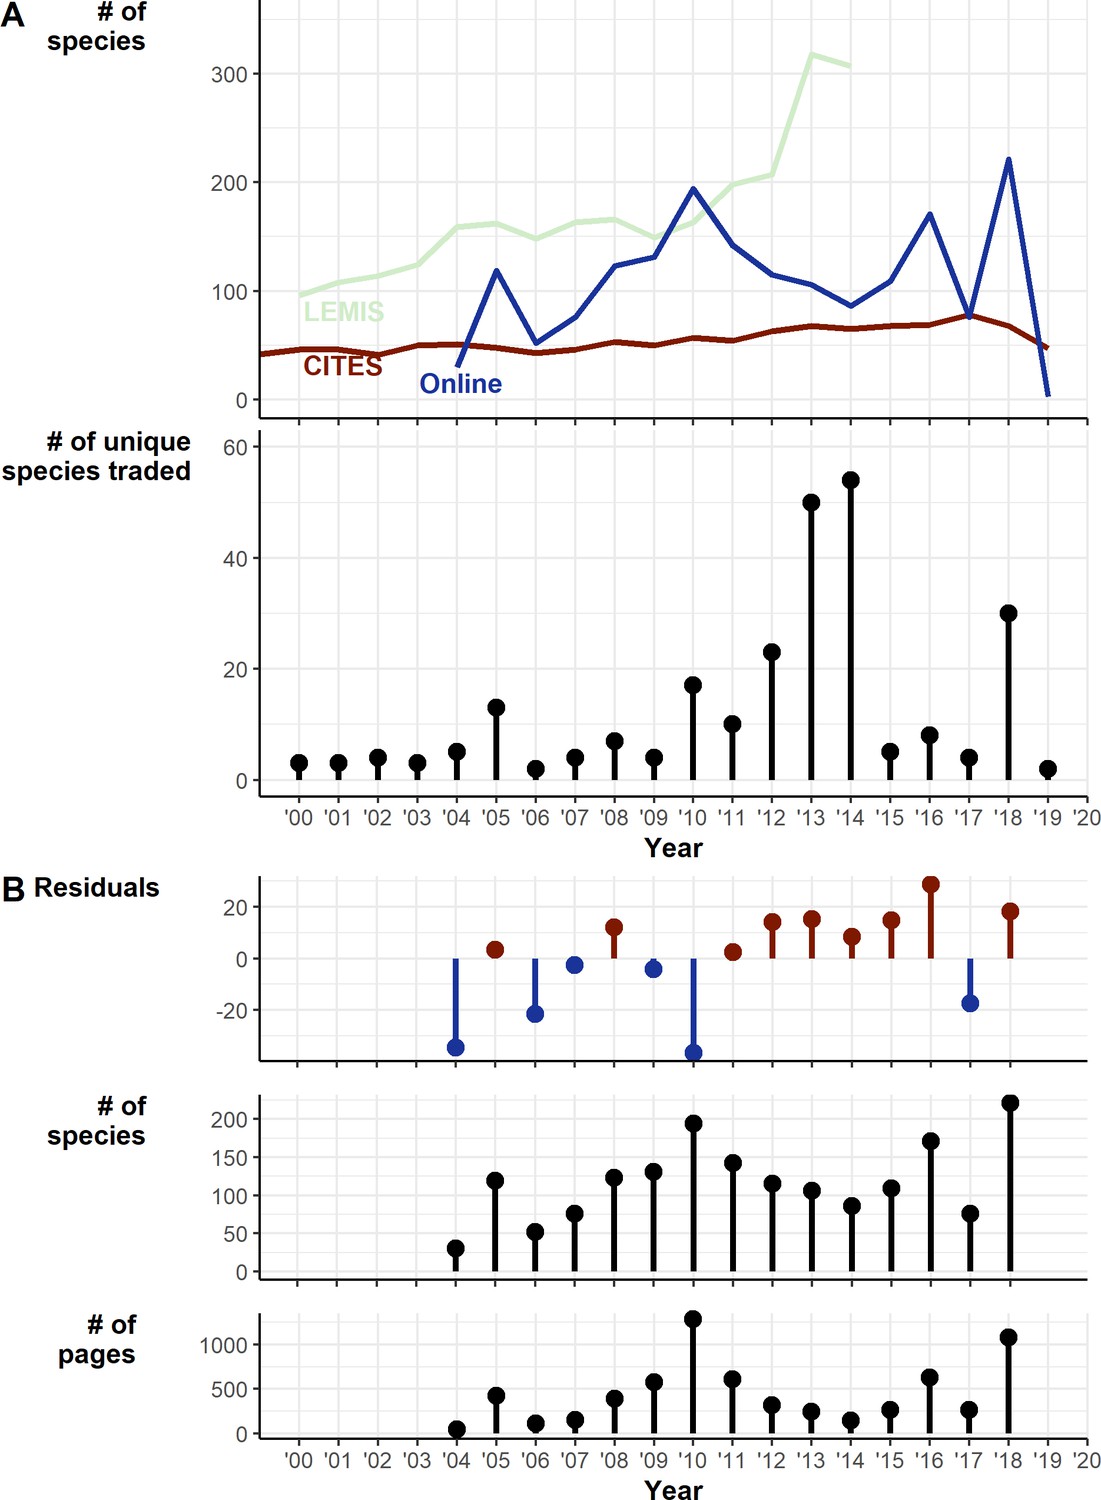
Temporal trends in traded species 2000–2019.
(A) Trends over time of Online, LEMIS, and CITES datasets: (1) Raw counts of numbers of species detected in each year. (2) The number of species traded only in a particular year. (B) Exploration of trends in online trade: (1) Residuals from the linear regression of number of species detected against number of pages (df = 13, intercept = 58.73, number of pages coef. = 0.13). (2) Number of species per year. (3) Number of archived pages retrieved and searched. Generated using Source code 9 and Source data 7, 9, and 10. Also see Figure 3—figure supplements 1–6 for a breakdown of how many individuals are coming from the wild for taxa traded at different volumes.
Figure 3—figure supplement 1
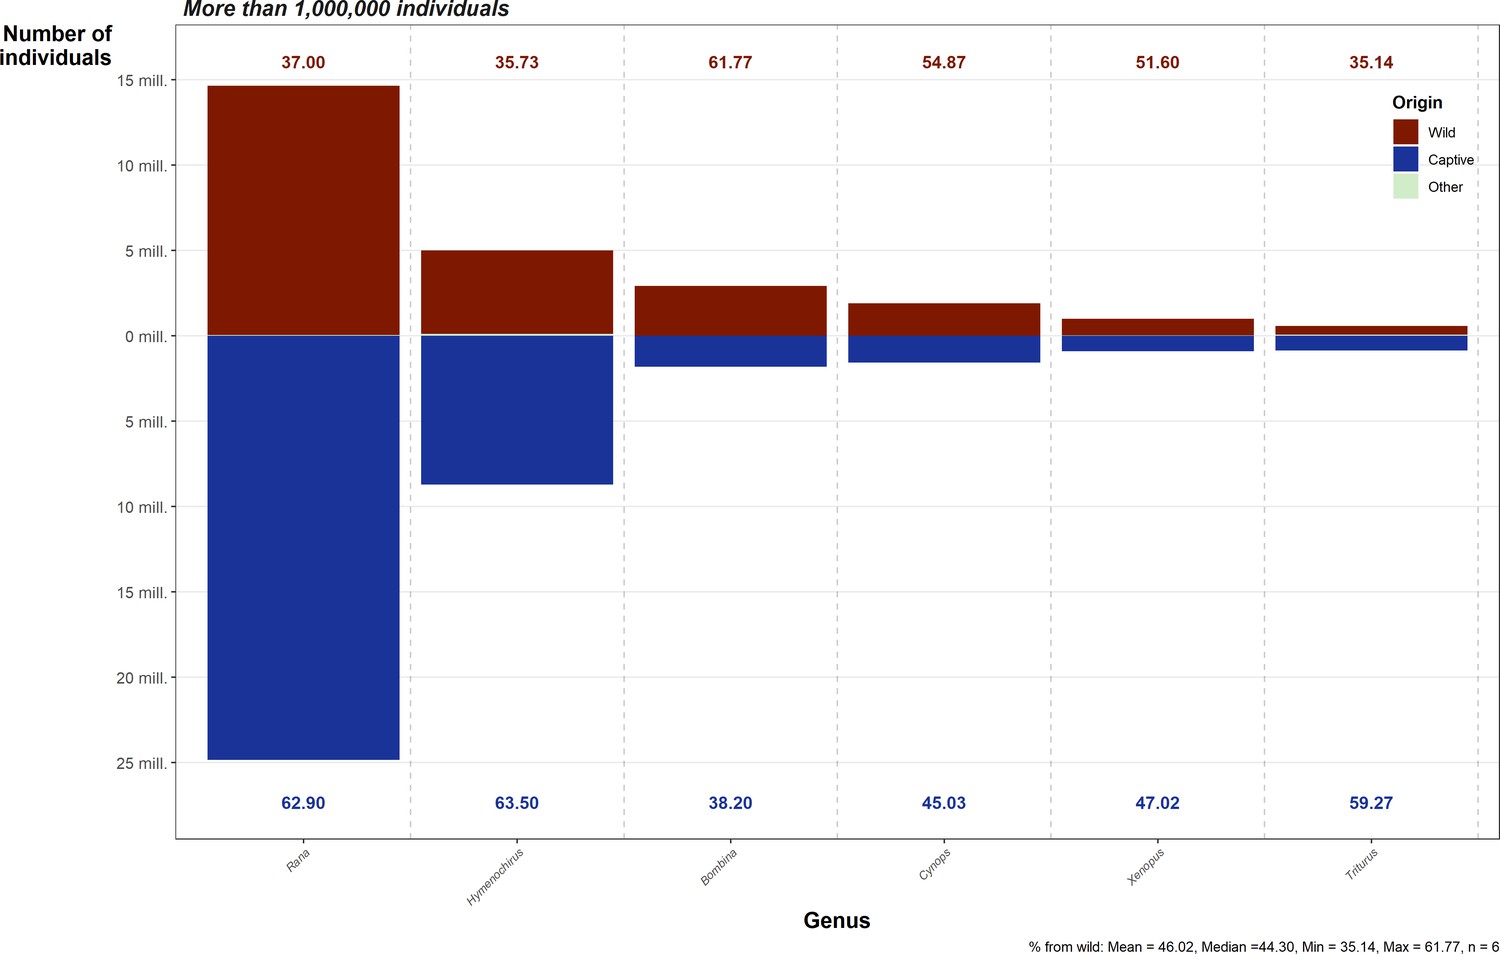
Bar chart showing the number and origin of imported individuals per genera, subset to genera with over 1,000,000 individuals recorded.
Data from Law Enforcement Management Information System (LEMIS) 2000–2014. Red indicates those originating from the wild. Blue indicates those originating from captive operations (animals bred in captivity, commercially bred, and originating from a ranching operation). Labels top and bottom show the percentage of that genera from the wild or captive sources. Summary statistics per genera are provided in the caption.
Figure 3—figure supplement 2
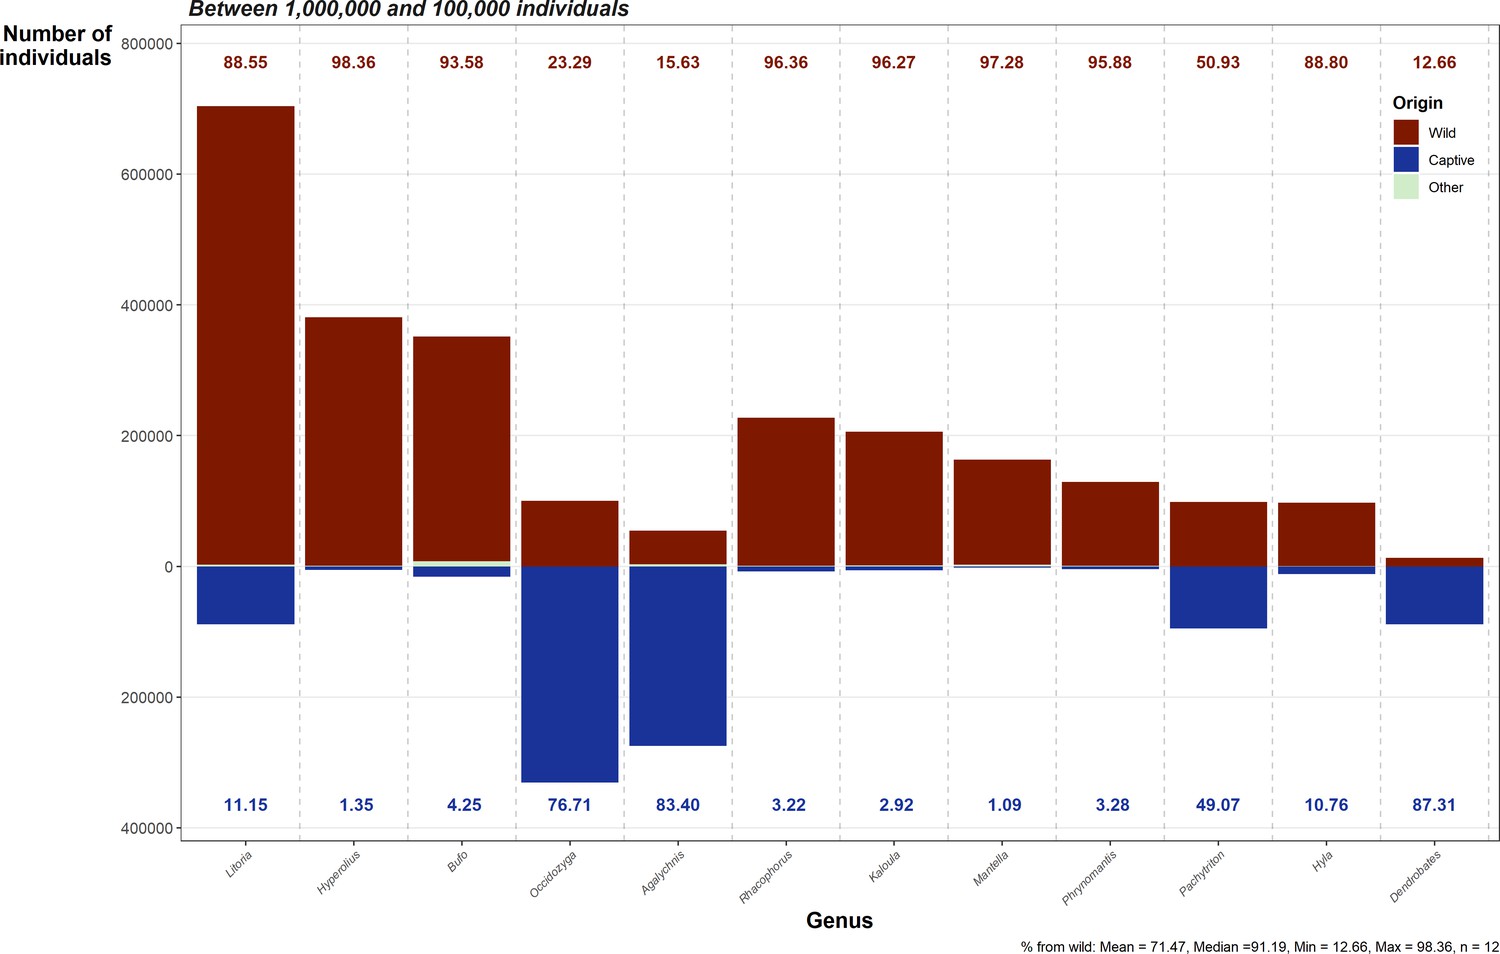
Bar chart showing the number and origin of imported individuals per genera, subset to genera with between 1,000,000 and 100,000 individuals recorded.
Data from Law Enforcement Management Information System (LEMIS) 2000–2014. Red indicates those originating from the wild. Blue indicates those originating from captive operations (animals bred in captivity, commercially bred, and originating from a ranching operation). Labels top and bottom show the percentage of that genera from the wild or captive sources. Summary statistics per genera are provided in the caption.
Figure 3—figure supplement 3
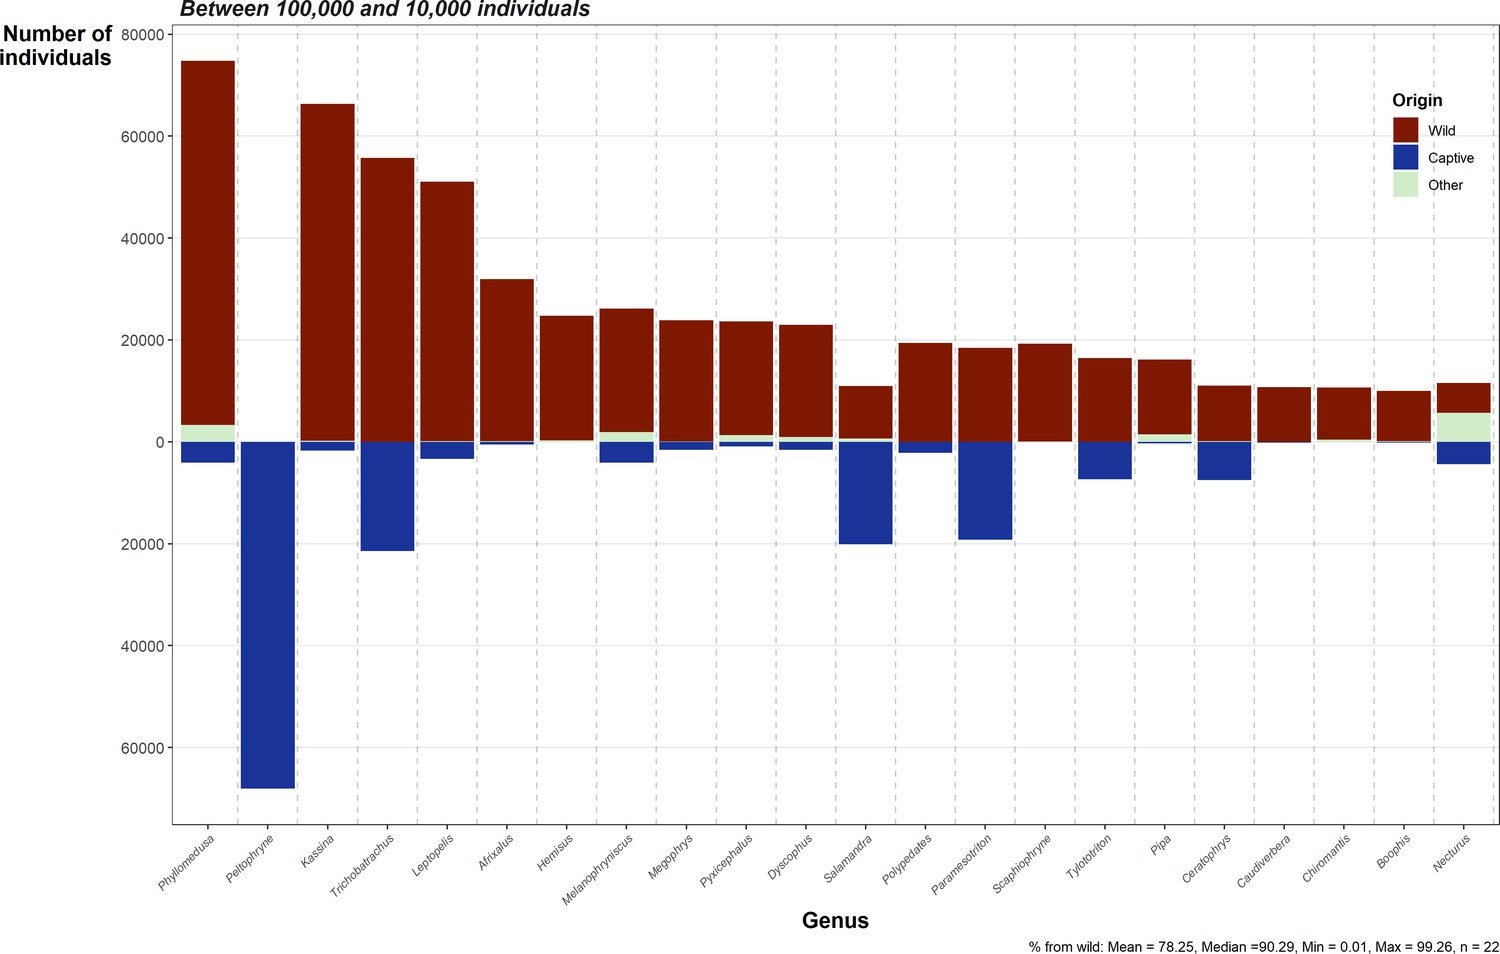
Bar chart showing the number and origin of imported individuals per genera, subset to genera with between 100,000 and 10,000 individuals recorded.
Data from Law Enforcement Management Information System (LEMIS) 2000–2014. Red indicates those originating from the wild. Blue indicates those originating from captive operations (animals bred in captivity, commercially bred, and originating from a ranching operation). Summary statistics per genera are provided in the caption.
Figure 3—figure supplement 4
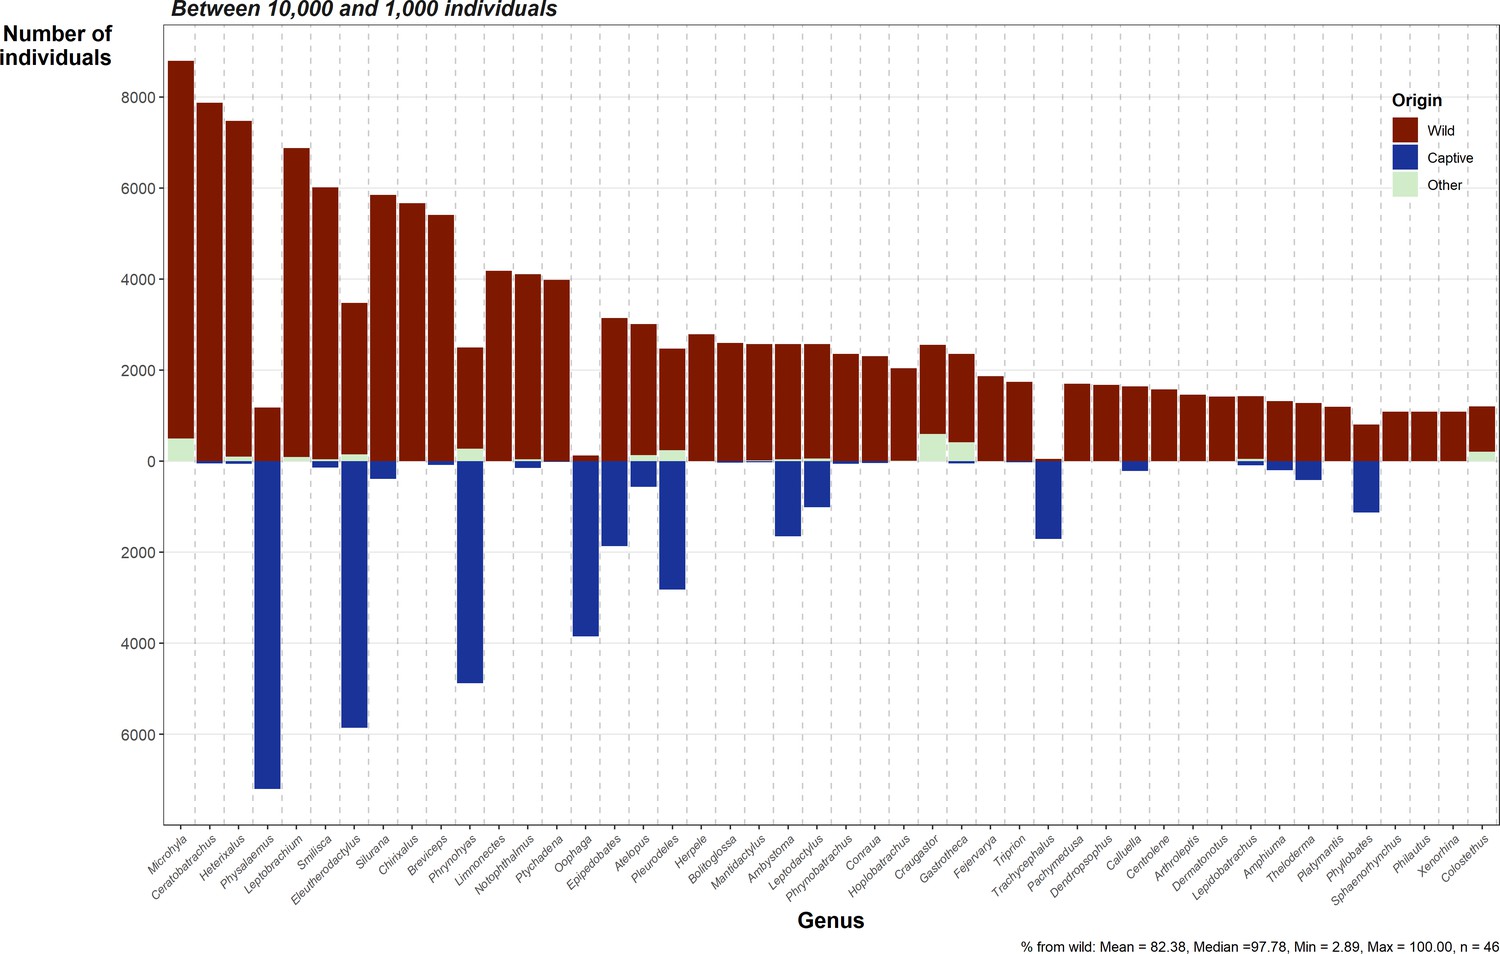
Bar chart showing the number and origin of imported individuals per genera, subset to genera with between 10,000 and 1000 individuals recorded.
Data from Law Enforcement Management Information System (LEMIS) 2000–2014. Red indicates those originating from the wild. Blue indicates those originating from captive operations (animals bred in captivity, commercially bred, and originating from a ranching operation). Summary statistics per genera are provided in the caption.
Figure 3—figure supplement 5
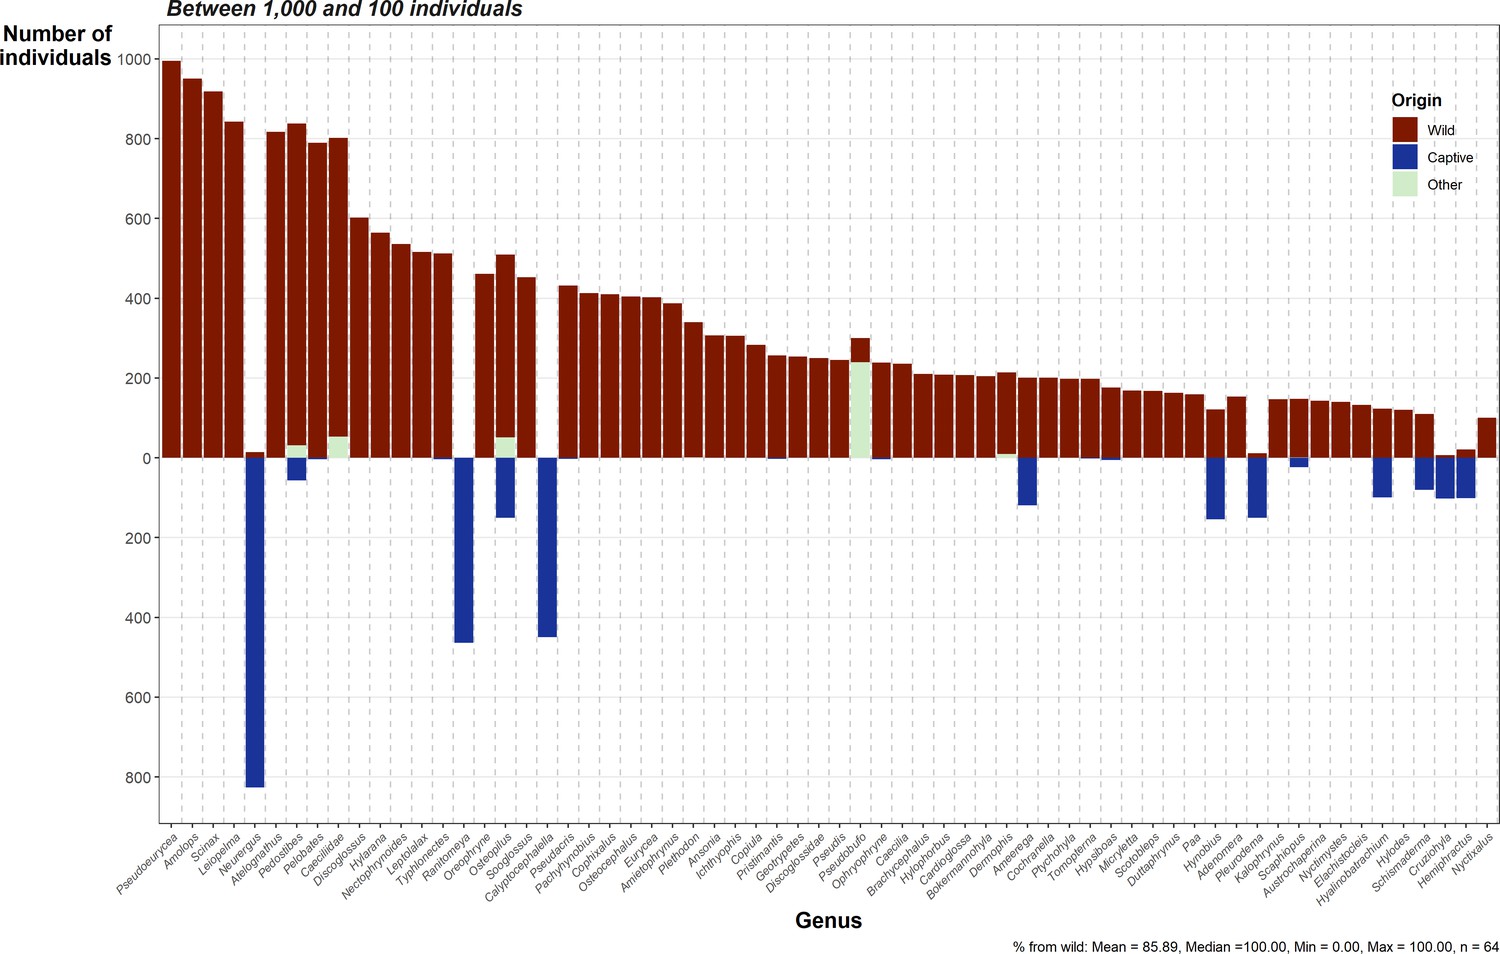
Bar chart showing the number and origin of imported individuals per genera, subset to genera with between 1000 and 100 individuals recorded.
Data from Law Enforcement Management Information System (LEMIS) 2000–2014. Red indicates those originating from the wild. Blue indicates those originating from captive operations (animals bred in captivity, commercially bred, and originating from a ranching operation). Summary statistics per genera are provided in the caption.
Figure 3—figure supplement 6
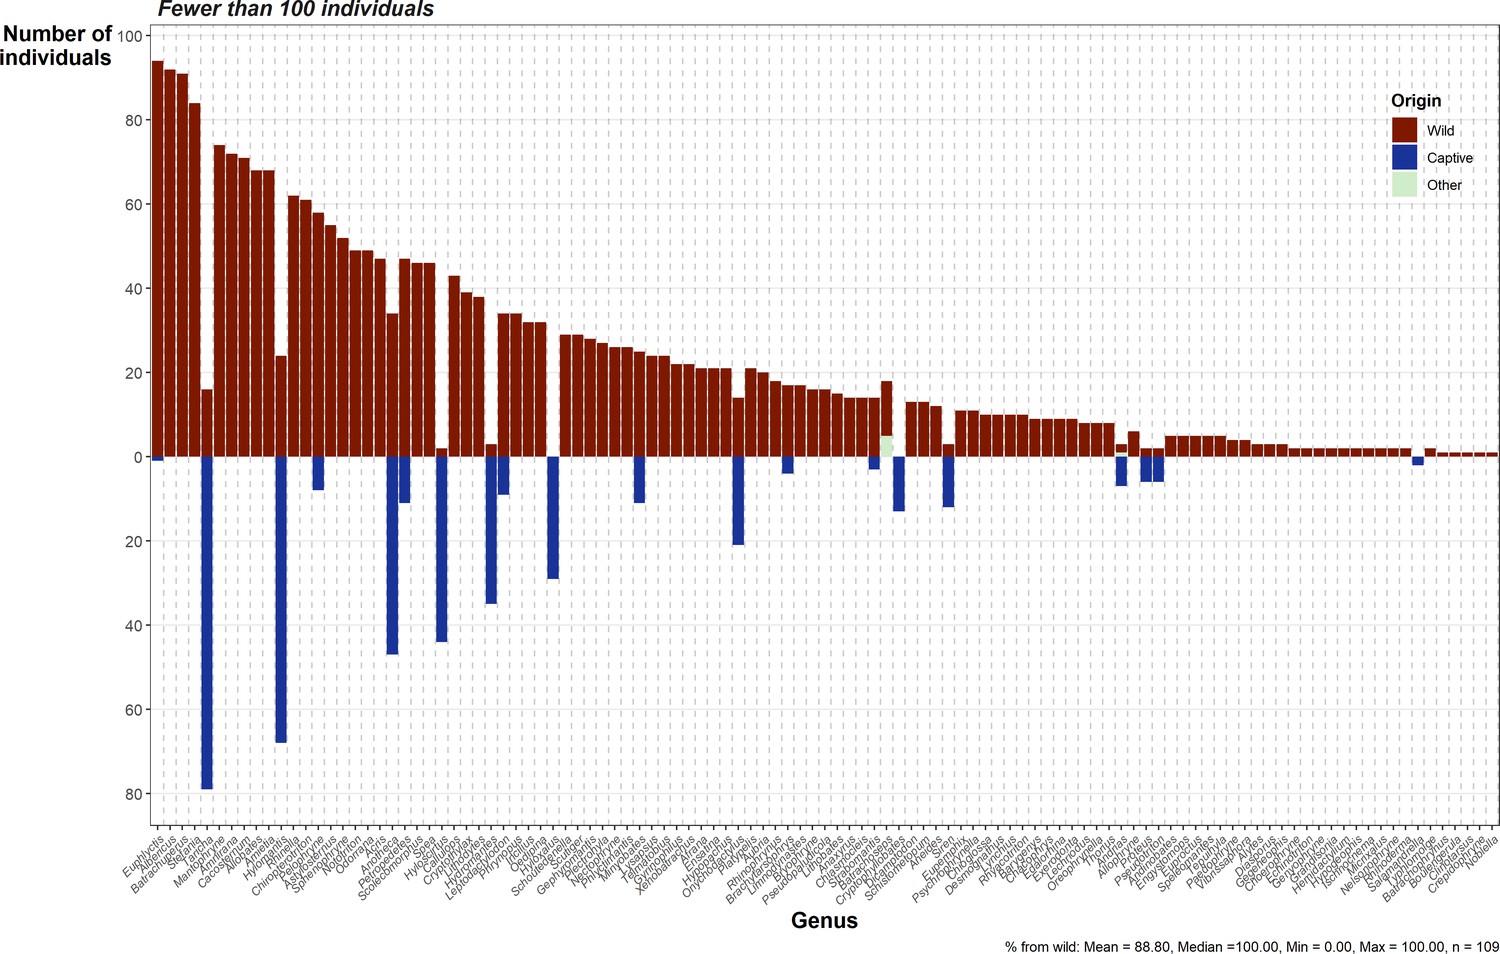
Bar chart showing the number and origin of imported individuals per genera, subset to genera with fewer than 100 individuals recorded.
Data from Law Enforcement Management Information System (LEMIS) 2000–2014. Red indicates those originating from the wild. Blue indicates those originating from captive operations (animals bred in captivity, commercially bred, and originating from a ranching operation). Summary statistics per genera are provided in the caption.
Figure 4
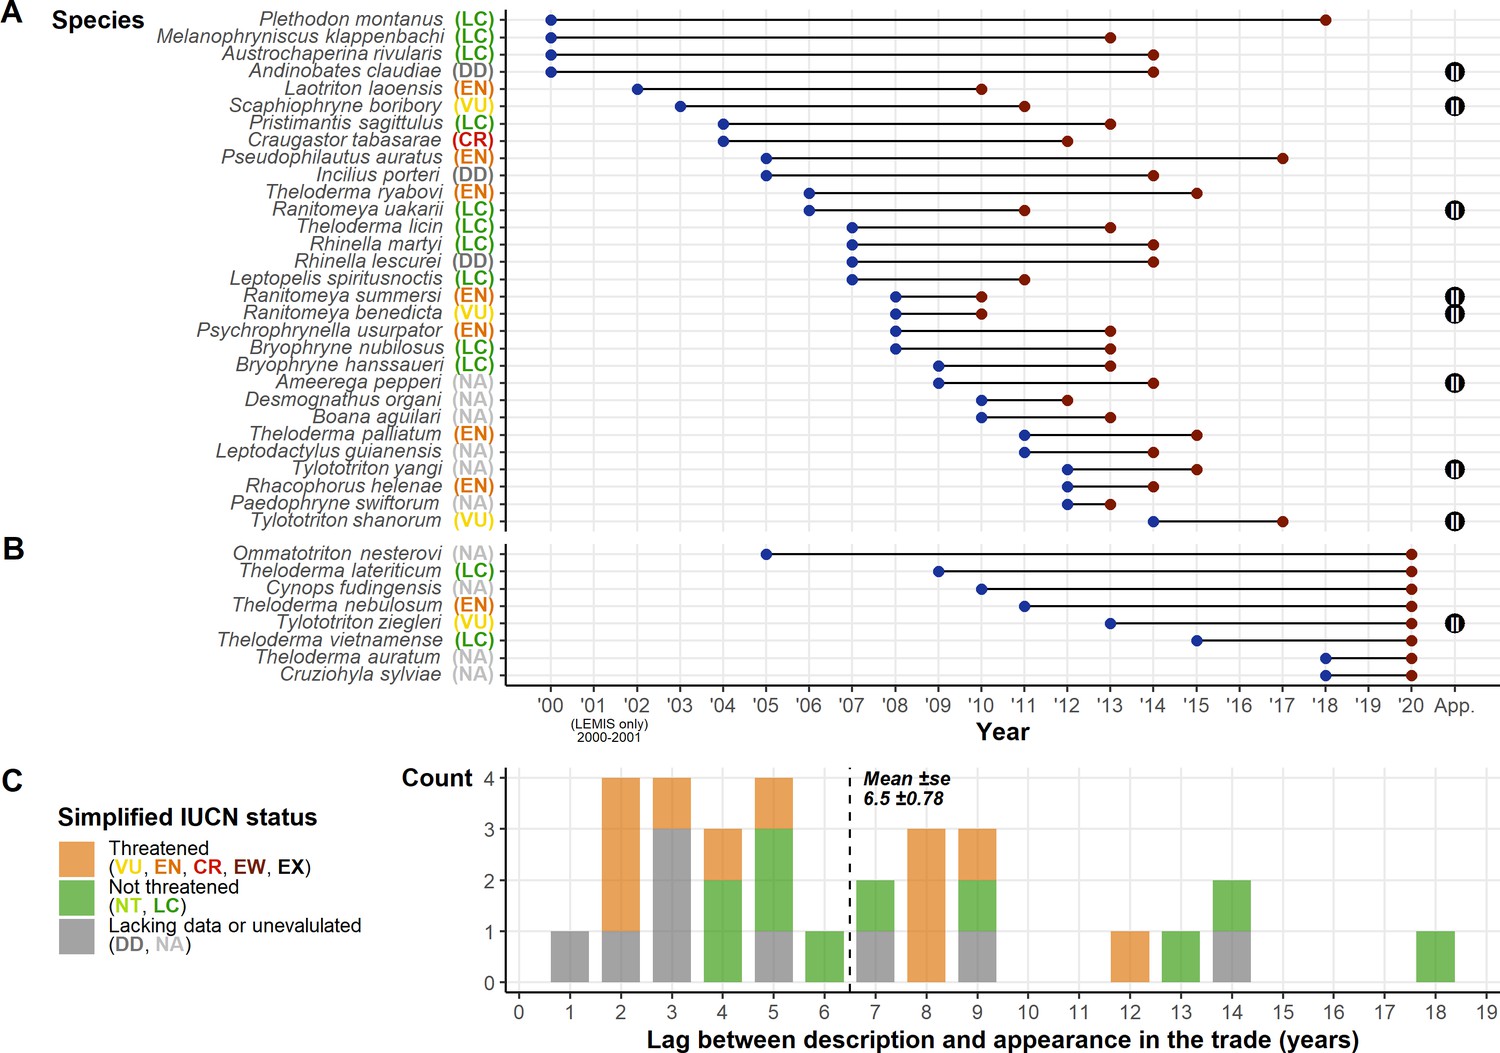
Summary of post-1999 described species and their presence in the trade.
(A) The species described post-1999 detected in the trade displaying the year of description and the year detected in the trade. (B) Species described post-1999 but were only detected in the 2020 snapshot. Alongside species names in A and B are their IUCN Redlist status; the Convention on International Trade in Endangered Species (CITES) appendix (where listed) is shown on the right of the plot. (C) Frequency plot showing the count of time lags between description and trade, with colours corresponding to broad summaries of IUCN Redlist status. Generated using Source code 11 and 12, and Source data 4, 7, and 10.
Figure 5

Number of species detected via each language in the online search.
Light blue shows the total number of species per language, and percentage of the overall online species list. Dark blue shows the number of species unique to a particular language and the percentage of that language’s species that are unique. Lollipop alongside bars describe the number of websites sampled. Generated using Source code 10 and Source data 1 and 3.
Figure 6
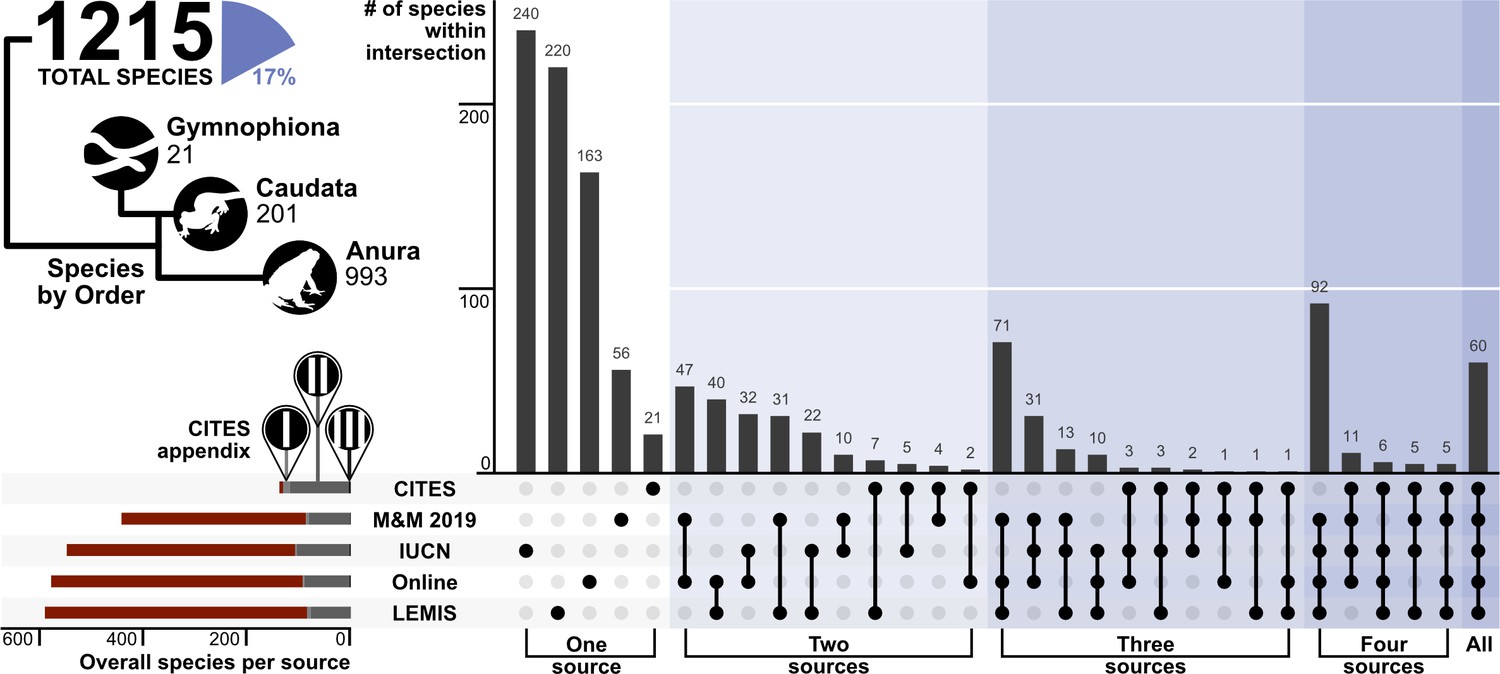
Upset plot showing the coverage and intersection of the five trade data sources.
The number of species per order is presented as an illustrative tree, alongside the % of the 8212 amphibian species in trade. The number of species that are covered by each CITES appendix is represented in the bottom left plot (red – not listed, light grey – Appendix I, medium grey - Appendix II, black – Appendix III). N.b., M&M 2019 is referring to Mohanty and Measey, 2019. Generated using Source code 8, and Source data 10.
Figure 7

Mapping diversity of species in trade for different uses based on the five data sources.
(A) Pet, (B) meat; (C) medicinal, (D) research, and (E) all trade.
Tables
Key resources table
| Reagent type (species) or resource | Designation | Source or reference | Identifiers | Additional information |
|---|---|---|---|---|
| Other | Data S1 – Target Websites Censored.csv | Self-generated via the use of http://www.google.com/ and http://www.bing.com/ | Data S1 | Website review and sampling |
| Other | Data S2. Original AmphibiaWeb data (‘AmphibiaWeb 2020-08-29.csv’) | AmphibiaWeb: https://amphibiaweb.org/amphib_names.txt | Data S2 | Original AmphibiaWeb Data: Accessed 2020-08-29 |
| Other | Data S3. Snapshot Online Data.csv | Self-generated | Data S3 | Online search results from the contemporary sample |
| Other | Data S4 Temporal Online Data.csv | Self-generated via the Internet Archive’s Wayback Machine API and Terraristika (https://www.terraristik.com) | Data S4 | Online search results from the temporal sample |
| Other | Data S5 new_list_amp_jan_FINAL.csv | Self-generated | Data S5 | Species listed purposes from each data source |
| Other | Data S6 supplement_trade_keywords.csv | Self-generated | Data S6 | List of keywords associated the importers and exporters |
| Other | Data S7 LEMIS Data AmphiNames.csv | Self-generated by combining aspects of Data S1 and data from LEMIS: Eskew EA, White AM, Ross N, Smith KM, Smith KF, Rodríguez JP, Zambrana-Torrelio C, Karesh WB, Daszak P. 2019. United States LEMIS wildlife trade data curated by EcoHealth Alliance. Zenodo Dataset. doi:10.5281/zenodo.3565869 | Data S7 | Filtered LEMIS data with AmphibiaWeb compatible names: Retrieved using the lemis package: Ross N, Eskew EA, White AM, Zambrana-Torrelio C. 2019. lemis: The LEMIS Wildlife Trade Database.https://github.com/ecohealthalliance/lemis#readme |
| Other | Data S8 Index_of_CITES_Species_[CUSTOM]_2020-09-20 15_51.csv | CITES: http://checklist.cites.org/#/en | Data S8 | Filter CITES appendix data |
| Other | Data S9 gross_imports_2020-09-20 15_25_comma_separated.csv | CITES: https://trade.cites.org/# | Data S9 | Filtered CITES data |
| Other | Data S10 Amphibians_in_trade.csv | Self-generated using aspects of Data S2–S4, S7–S9 | Data S10 | The final dataset |
| Other | Data S11. Amphibians_in_trade_METADATA.csv | Self-generated | Data S11 | The final dataset metadata |
| Software, algorithm | R | R Core Team | Please see appropriate code listed in text | |
| Software, algorithm | ArcGis | ESRI | ||
| Other | IUCN species polygons | iucnredlist.org |
Additional files
-
Source code 1
Code used to extract URLs from saved search result pages.
- https://cdn.elifesciences.org/articles/70086/elife-70086-code1-v2.zip
-
Source code 2
Code to collect website data using the hierarchical search method.
- https://cdn.elifesciences.org/articles/70086/elife-70086-code2-v2.zip
-
Source code 3
Code to collect website data from the wayback machine.
- https://cdn.elifesciences.org/articles/70086/elife-70086-code3-v2.zip
-
Source code 4
Code used to implement string matching searches for species keywords.
- https://cdn.elifesciences.org/articles/70086/elife-70086-code4-v2.zip
-
Source code 5
Code used to compile website search results with Law Enforcement Management Information System (LEMIS) and Convention on International Trade in Endangered Species (CITES) data.
- https://cdn.elifesciences.org/articles/70086/elife-70086-code5-v2.zip
-
Source code 6
Code used to filter initial Law Enforcement Management Information System (LEMIS) data.
- https://cdn.elifesciences.org/articles/70086/elife-70086-code6-v2.zip
-
Source code 7
Code used to summarise and explore Law Enforcement Management Information System (LEMIS) data.
- https://cdn.elifesciences.org/articles/70086/elife-70086-code7-v2.zip
-
Source code 8
Code used to generate summary figures.
- https://cdn.elifesciences.org/articles/70086/elife-70086-code8-v2.zip
-
Source code 9
Code used to generate figures showing change over time.
- https://cdn.elifesciences.org/articles/70086/elife-70086-code9-v2.zip
-
Source code 10
Code used to plot the different species counts between languages used during online searches.
- https://cdn.elifesciences.org/articles/70086/elife-70086-code10-v2.zip
-
Source code 11
Code used to retrieve species authorities.
- https://cdn.elifesciences.org/articles/70086/elife-70086-code11-v2.zip
-
Source code 12
Code used to calculate and plot lag times between species description and appearance in the trade.
- https://cdn.elifesciences.org/articles/70086/elife-70086-code12-v2.zip
-
Source data 1
Website review and sampling (‘Target Websites Censored.csv’).
- https://cdn.elifesciences.org/articles/70086/elife-70086-data1-v2.csv
-
Source data 2
Original AmphibiaWeb data (‘AmphibiaWeb 2020-08-29.csv’).
- https://cdn.elifesciences.org/articles/70086/elife-70086-data2-v2.csv
-
Source data 3
Online search results from the contemporary sample (‘Snapshot Online Data.csv’).
- https://cdn.elifesciences.org/articles/70086/elife-70086-data3-v2.csv
-
Source data 4
Online search results from the temporal sample (‘Temporal Online Data.csv’).
- https://cdn.elifesciences.org/articles/70086/elife-70086-data4-v2.csv
-
Source data 5
Species listed purposes from each data source (‘new_list_amp_jan_FINAL.csv’).
- https://cdn.elifesciences.org/articles/70086/elife-70086-data5-v2.csv
-
Source data 6
List of keywords associated the importers and exporters (‘supplement_trade_keywords.csv’).
- https://cdn.elifesciences.org/articles/70086/elife-70086-data6-v2.csv
-
Source data 7
Filtered Law Enforcement Management Information System (LEMIS) data with AmphibiaWeb compatible names (‘LEMIS Data AmphiNames.csv’).
- https://cdn.elifesciences.org/articles/70086/elife-70086-data7-v2.csv
-
Source data 8
Filter Convention on International Trade in Endangered Species (CITES) appendix data (‘Index_of_CITES_Species_[CUSTOM]_2020-09-20 15_51.csv’).
- https://cdn.elifesciences.org/articles/70086/elife-70086-data8-v2.csv
-
Source data 9
Filtered Convention on International Trade in Endangered Species (CITES) data (‘gross_imports_2020-09-20 15_25_comma_separated.csv’).
- https://cdn.elifesciences.org/articles/70086/elife-70086-data9-v2.csv
-
Source data 10
The final dataset (‘Amphibians_in_trade.csv’).
- https://cdn.elifesciences.org/articles/70086/elife-70086-data10-v2.csv
-
Source data 11
The final dataset metadata (‘Amphibians_in_trade_METADATA.csv’).
- https://cdn.elifesciences.org/articles/70086/elife-70086-data11-v2.csv
-
Transparent reporting form
- https://cdn.elifesciences.org/articles/70086/elife-70086-transrepform-v2.docx
Download links
A two-part list of links to download the article, or parts of the article, in various formats.
Downloads (link to download the article as PDF)
Open citations (links to open the citations from this article in various online reference manager services)
Cite this article (links to download the citations from this article in formats compatible with various reference manager tools)
Gaps in global wildlife trade monitoring leave amphibians vulnerable
eLife 10:e70086.
https://doi.org/10.7554/eLife.70086


