Transcription initiation at a consensus bacterial promoter proceeds via a ‘bind-unwind-load-and-lock’ mechanism
- Biological Physics Research Group, Clarendon Laboratory, Department of Physics, University of Oxford, United Kingdom
- Waksman Institute and Department of Chemistry, Rutgers University, United States
Figures
Figure 1 with 4 supplements

Single-molecule promoter unwinding-induced fluorescence enhancement (smUIFE): DNA unwinding in the upstream part of the transcription bubble precedes DNA unwinding in the downstream part of the transcription bubble.
(A) (Top) Design of experiment monitoring promoter unwinding in real time. Grey, RNAP; orange, RNAP clamp; purple dot, RNAP active-centre; black, ds-DNA; blue, ss-DNA; light green, Cy3 on ds-DNA; dark green, Cy3 on ss-DNA. (Bottom) A cropped area (0.94 μm × 1.034 μm) of the field of view, showing appearance and enhancement of fluorescence signal from binding of single Cy3-labelled promoter fragment to an immobilised RNAP molecule. (B) (Left) Time trajectories of intensity from Cy3 on downstream segment of promoter bubble. Black, raw intensity; dark blue, idealised intensity; hidden Markov model (HMM)-assigned states: no promoter (black bars), closed promoter (light yellow bars) and open promoter (green bars). Frame rates: 50 ms, top and middle; 200 ms, bottom. Laser powers: 0.60 mW, top and middle; 0.15 mW, bottom. (Right) Dwell-time histograms of promoter state before unwinding, tUNWIND. (C) (Left) Time trajectories of intensity from Cy3 on upstream segment of promoter bubble. Colours as in B. Frame rates: 50 ms. Laser powers: 0.6 mW. (Right) Dwell-time histograms of promoter state before unwinding, tUNWIND. (D) Table comparing unwinding times for different promoter constructs.
-
Figure 1—source data 1
Data for single-molecule UIFE experiments in Figure 1.
- https://cdn.elifesciences.org/articles/70090/elife-70090-fig1-data1-v2.zip
Figure 1—figure supplement 1
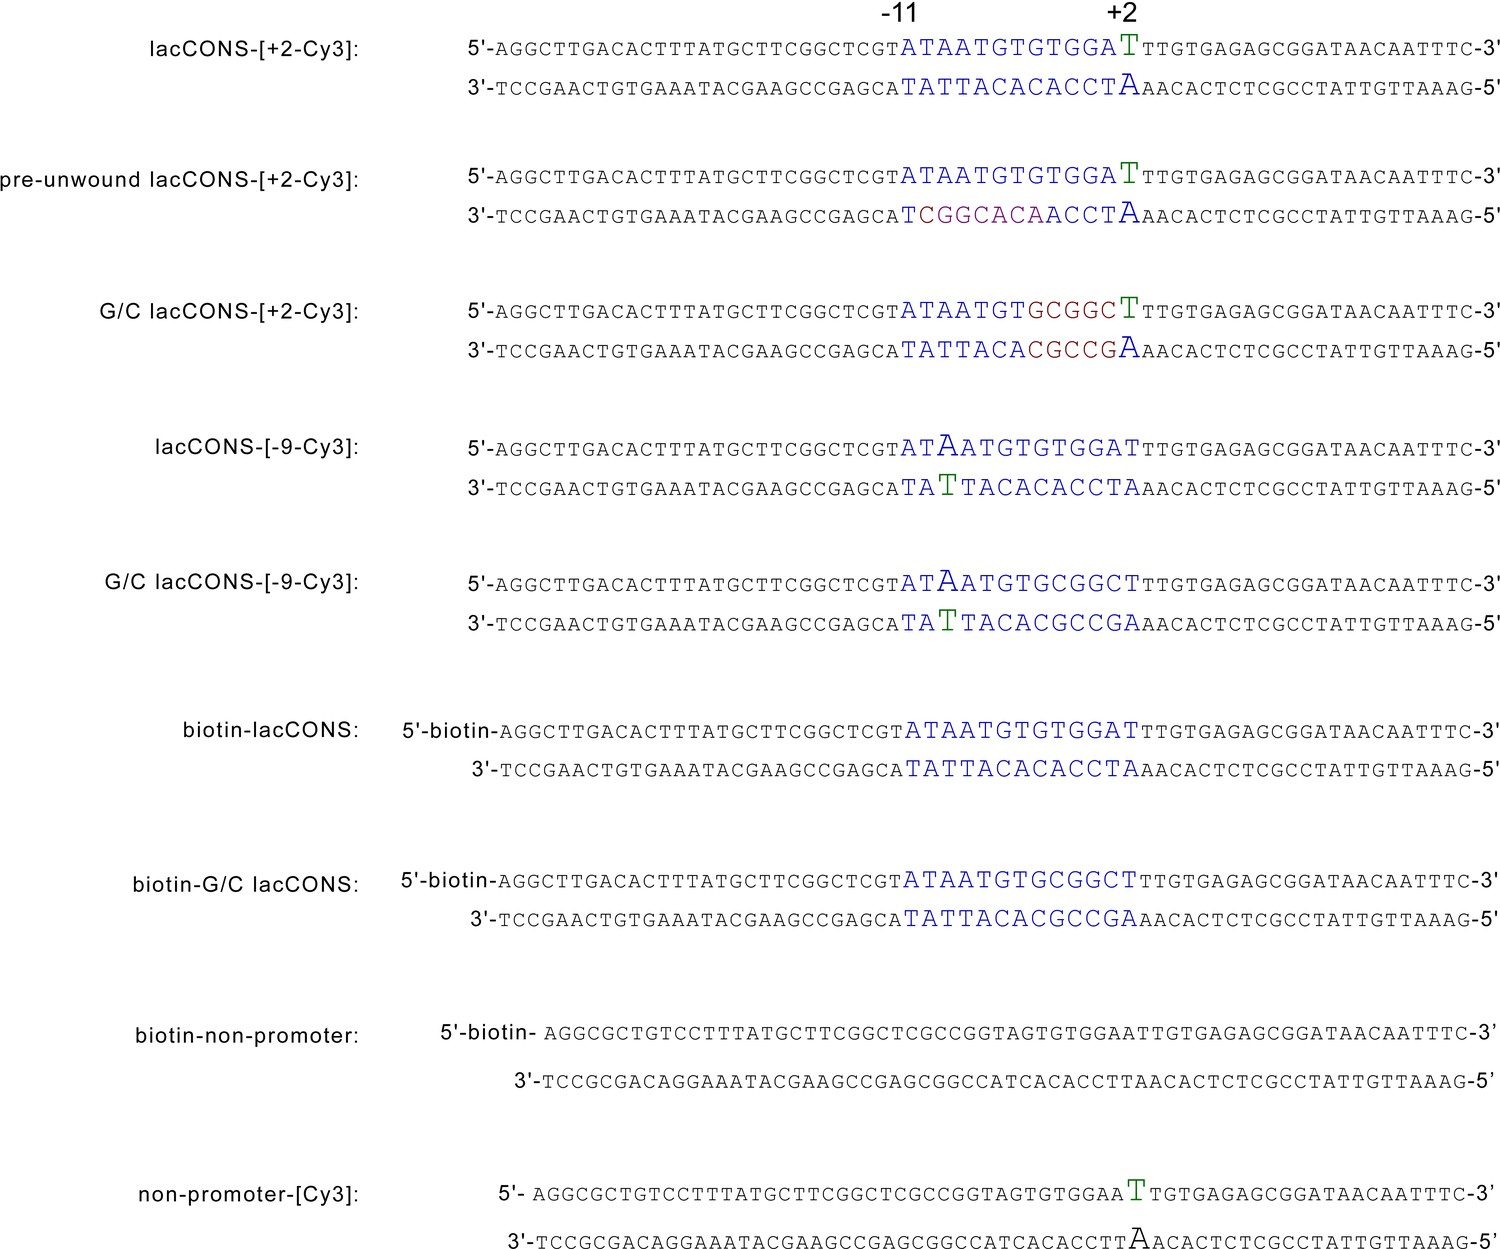
Sequence of consensus lac-promoter fragments used in the study.
Top strand: non-template DNA strand; bottom strand: template strand. Nucleotides labelled with Cy3 are shown in green. The numbering refers to the DNA position relative to the transcription start site.
Figure 1—figure supplement 2
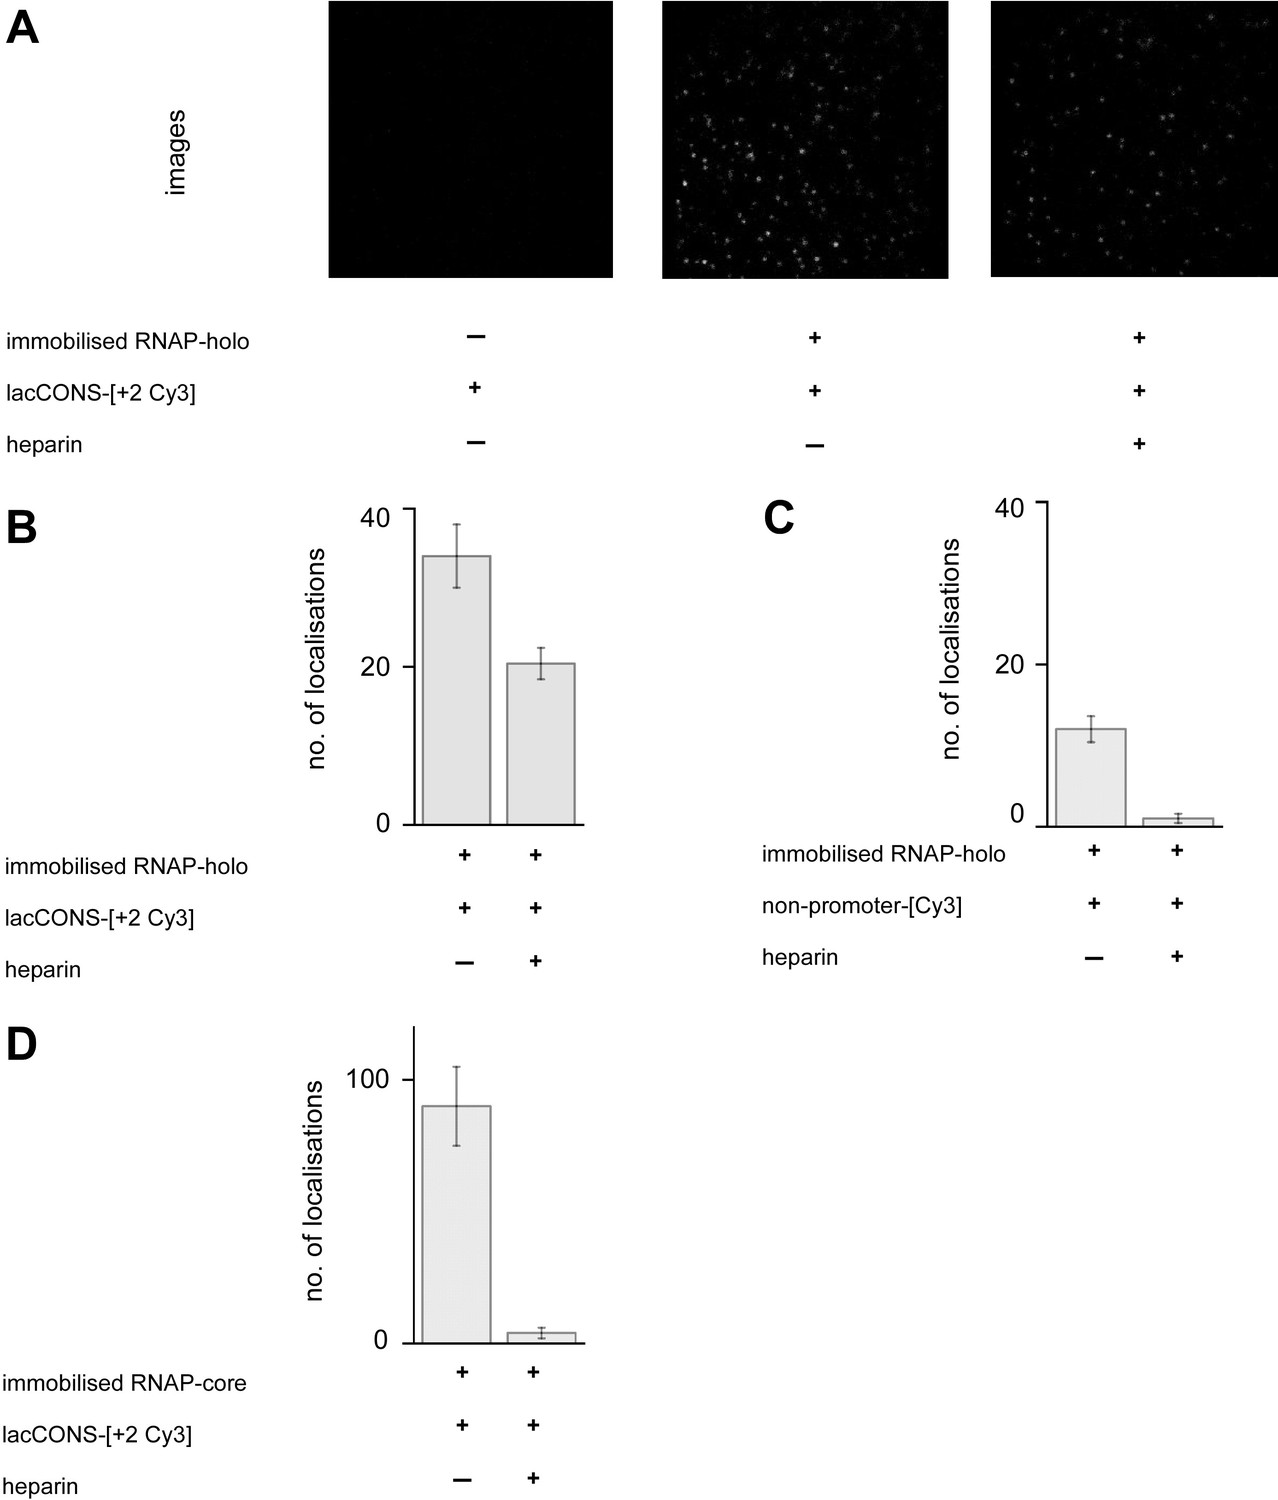
Characterisation of complexes between RNAP and Cy3-labelled DNA fragments.
(A) Raw images (field of view: 24 μm × 24 μm) of immobilised hexahistidine-tagged RNAP holoenzyme (left), immobilised hexahistidine-tagged RNAP holoenzyme bound to lacCONS-[+ 2Cy3] promoter fragment before (middle) and after (right) addition of heparin. (B) Mean number of localisations per field of view for single lacCONS-[+ 2Cy3] promoter fragments bound to immobilised hexahistidine-tagged RNAP holoenzyme in absence and presence of heparin. (C) Mean number of localisations per field of view for single non-promoter-[Cy3] fragments bound to immobilised hexahistidine-tagged RNAP holoenzyme in absence and presence of heparin. (D) Mean number of localisations per field of view for single Cy3-labelled promoter fragments bound to immobilised hexahistidine-tagged RNAP core enzyme in absence and presence of heparin. Mean number of localisations are average of three measurements. Errors bars represent the standard deviation from the mean.
Figure 1—figure supplement 3
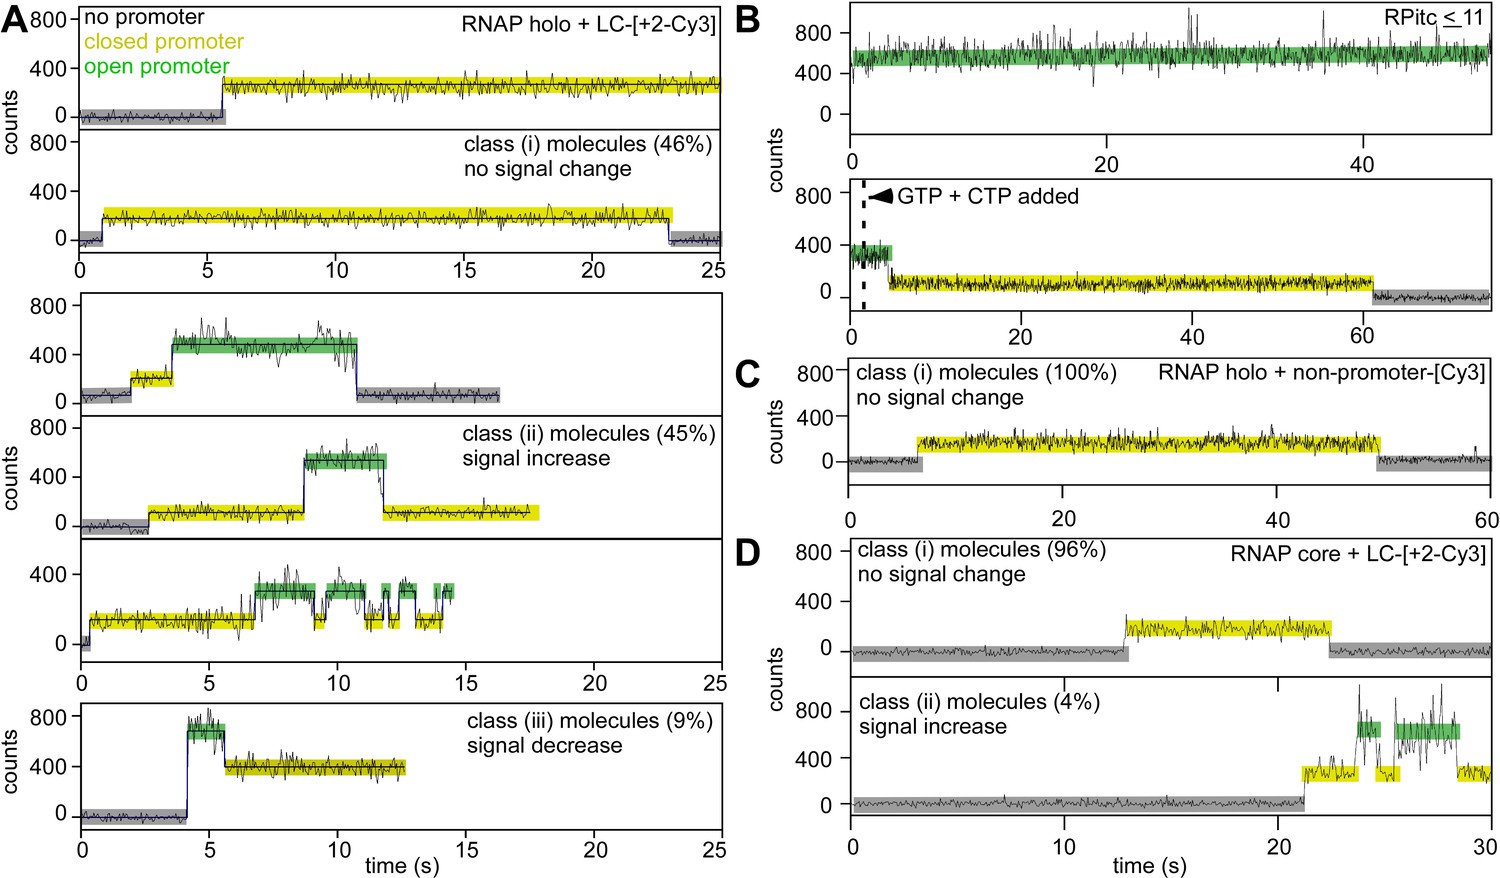
Representative intensity vs. time trajectories from.
(A) Binding of lacCONS-[+ 2 Cy3] promoter fragment to immobilised RNAP holoenzyme. (B) (Top) Stalled initial transcribing complexes (RPitc <11) formed with RNAP holoenzyme, lacCONS-[+ 2 Cy3] and subset of NTPs (ATP, GTP, and UTP). (Bottom) Real-time addition of NTPs (GTP and CTP) to stalled initial transcribing complexes (Rpitc <11). (C) Binding of non-promoter-[Cy3] fragment to immobilised RNAP holoenzyme. (D) Binding of lacCONS-[+ 2 Cy3] promoter fragment to immobilised RNAP core enzyme. Black, raw intensity; dark blue, idealised intensity; hidden Markov model (HMM)-assigned states: no promoter (black bars), closed promoter (light yellow bars), and open promoter (green bars). Frame duration: 50 ms; laser power: 0.60 mW.
Figure 1—figure supplement 4
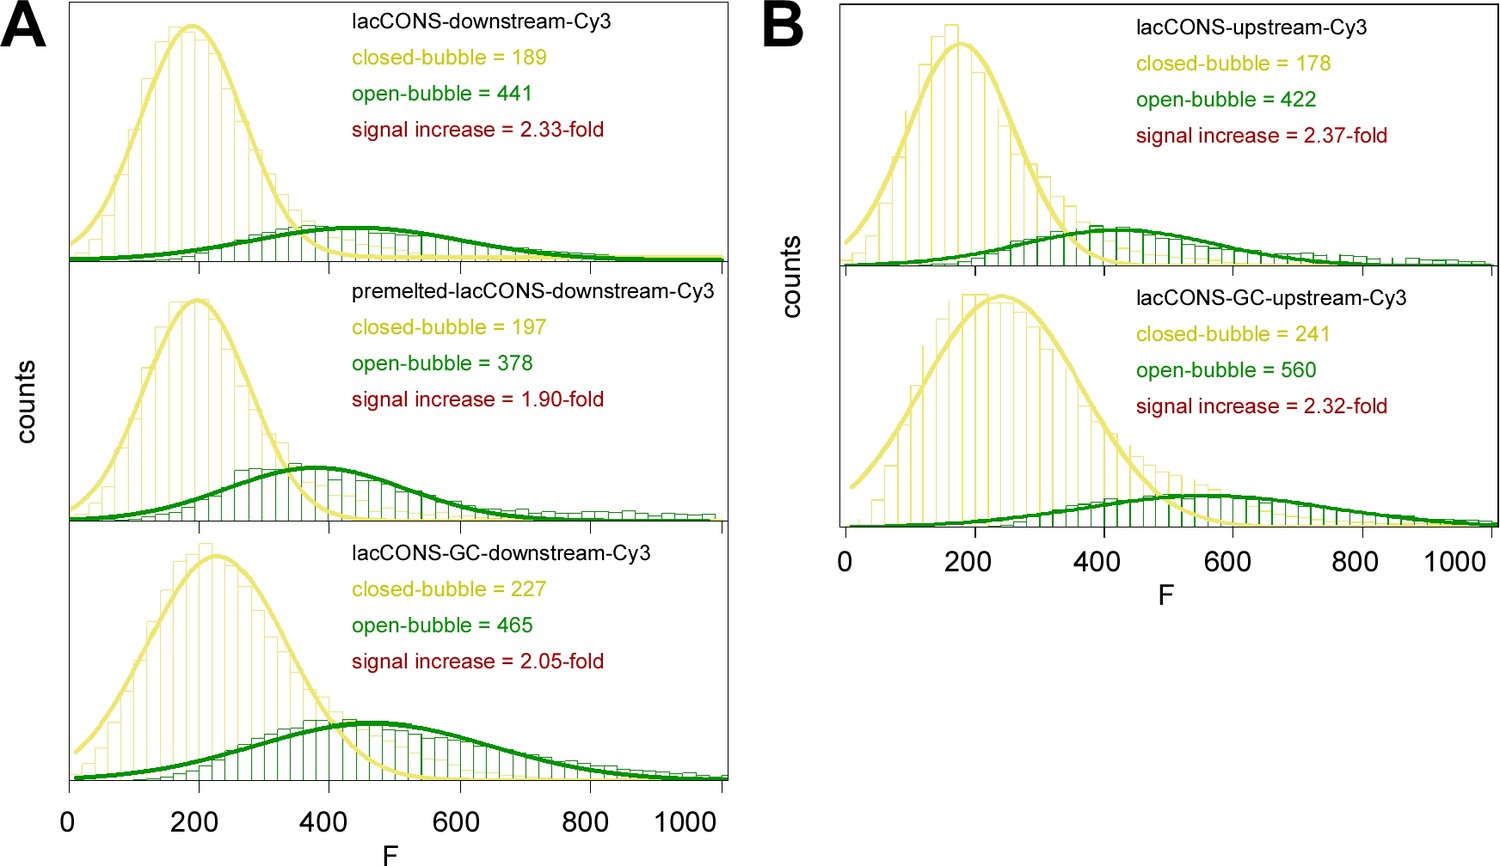
Fluorescence intensities from Cy3-labelled promoter fragments pre- and post-unwinding.
Hidden Markov model (HMM)-assigned histograms and Gaussian fits of fluorescence intensities, pre-unwinding (yellow) and post-unwinding (green) for Cy3-labelled promoter fragments. Mean intensities for the two states and fold-increase of intensities are shown (inset). (A) Data for lacCONS-[+ 2Cy3] promoter fragments. (B) Data for lacCONS-[–9Cy3] promoter fragments.
Figure 2 with 1 supplement
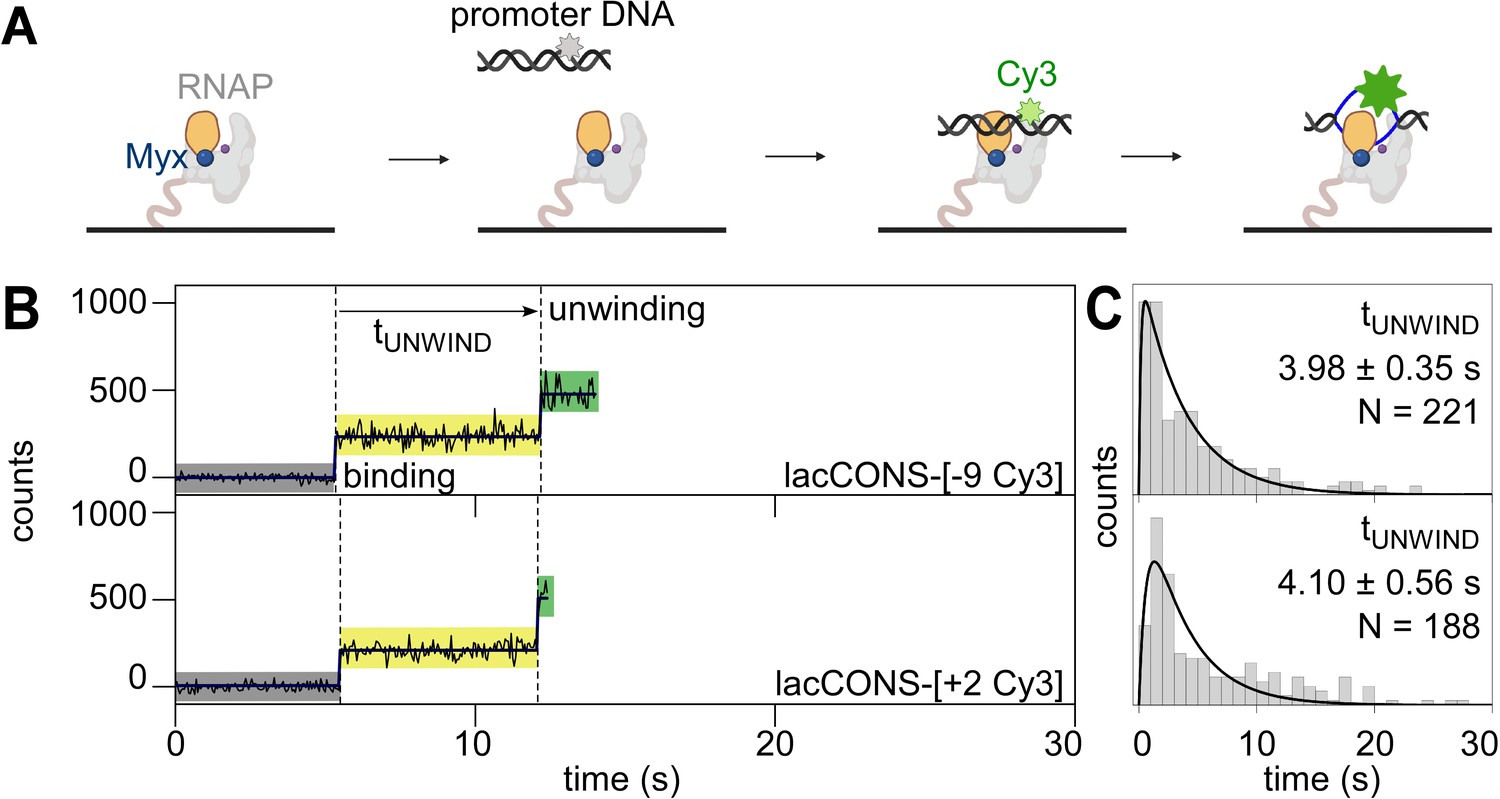
Single-molecule promoter unwinding-induced fluorescence enhancement (smUIFE) in the presence of an inhibitor that prevents RNAP clamp opening: preventing RNAP clamp opening does not prevent DNA unwinding.
(A) Design of promoter unwinding experiment in presence of myxopyronin (Myx). Blue sphere, Myx; rest as in 1 A. (B) (Left) Time trajectory of intensity from Cy3 on upstream (top) and downstream (bottom) segment of promoter bubble. Colours as in 1B. Frame rates: 50 ms. Laser powers: 0.60 mW. (Right) Dwell-time histograms of promoter state before unwinding, tUNWIND.
-
Figure 2—source data 1
Data for single-molecule UIFE experiments in presence of Myxopyronin in Figure 2.
- https://cdn.elifesciences.org/articles/70090/elife-70090-fig2-data1-v2.zip
Figure 2—figure supplement 1
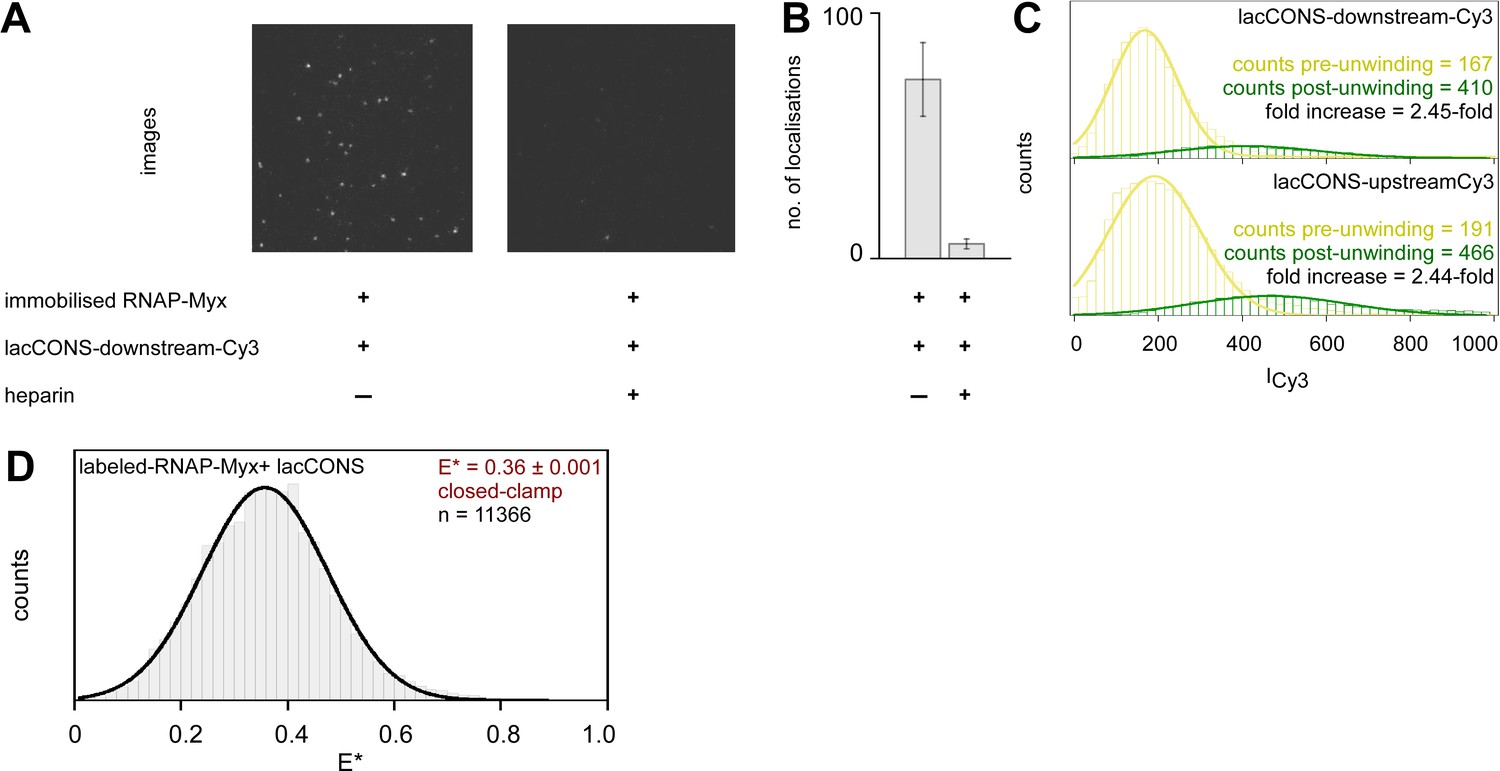
Characterisation of complexes formed between RNAP and promoter fragments in presence of myxopyronin (Myx).
(A) Raw images showing field of view (24 μm × 24 μm) with immobilised biotin promoter fragment bound to labelled RNAP complexes formed in presence of Myx (left), and with remaining immobilised hexahistidine-tagged RNAP holoenzyme complexes bound to Cy3-labelled promoter fragment, formed in presence of Myx, after addition of heparin (right). (B) Mean number of localisations per field of view for single Cy3-labelled promoter fragments bound to immobilised hexahistidine-tagged RNAP holoenzyme, formed in presence of Myx, before and after addition of heparin. Mean number of localisations are average of three measurements. Error bars represent the standard deviation from the mean. (C) Hidden Markov model (HMM)-assigned histograms and Gaussian fits of fluorescence intensities corresponding to pre-unwinding (yellow) and post-unwinding (green) states for promoter fragments with Cy3 on +2 position of the non-template strand (top) or –9 position of the template strand (bottom) of the promoter bubble. Mean intensities for the two states and fold-increase of intensities are shown (inset). (D) Histogram and Gaussian fit of E* showing mean E* values for clamp conformational state for clamp-labelled RNAP molecules bound to immobilised lacCONS-promoter fragments in presence of Myx.
Figure 3 with 4 supplements

Single-molecule fluorescence resonance energy transfer (smFRET): DNA unwinding occurs without RNAP clamp opening and is followed by RNAP clamp locking.
(A) Design of experiment monitoring clamp status in real time. Black, ds-DNA; orange, RNAP clamp; grey, rest of RNAP; purple dot, RNAP active-centre; blue, ss-DNA; green, Cy3B; and red, Alexa647. (B) Representative time trajectories of E* for experiments with a lacCONS promoter fragment, showing hidden Markov model (HMM)-assigned closed-clamp state (orange), locked-clamp state (red), and interstate transition (dark-blue). Expected range of E* values for an open-clamp state is highlighted in light blue. Frame rate: 100 ms. Laser powers: 200 μW in red and 500 μW in green. (C) HMM-assigned histograms and Gaussian fits of E* for full-time trajectories from experiments with a lacCONS promoter fragment. (D) Dwell-time histograms of time before transition to the locked-clamp state, tLOCK, for experiments with a lacCONS promoter fragment. (E) Table showing mean E*; difference in E* (ΔE*) between closed-clamp or locked-clamp states and time to transition to a locked-clamp state after initial binding for the lacCONS and lacCONS-GC promoter fragments.
-
Figure 3—source data 1
Data for single-molecule FRET experiments in Figure 3.
- https://cdn.elifesciences.org/articles/70090/elife-70090-fig3-data1-v2.zip
Figure 3—figure supplement 1
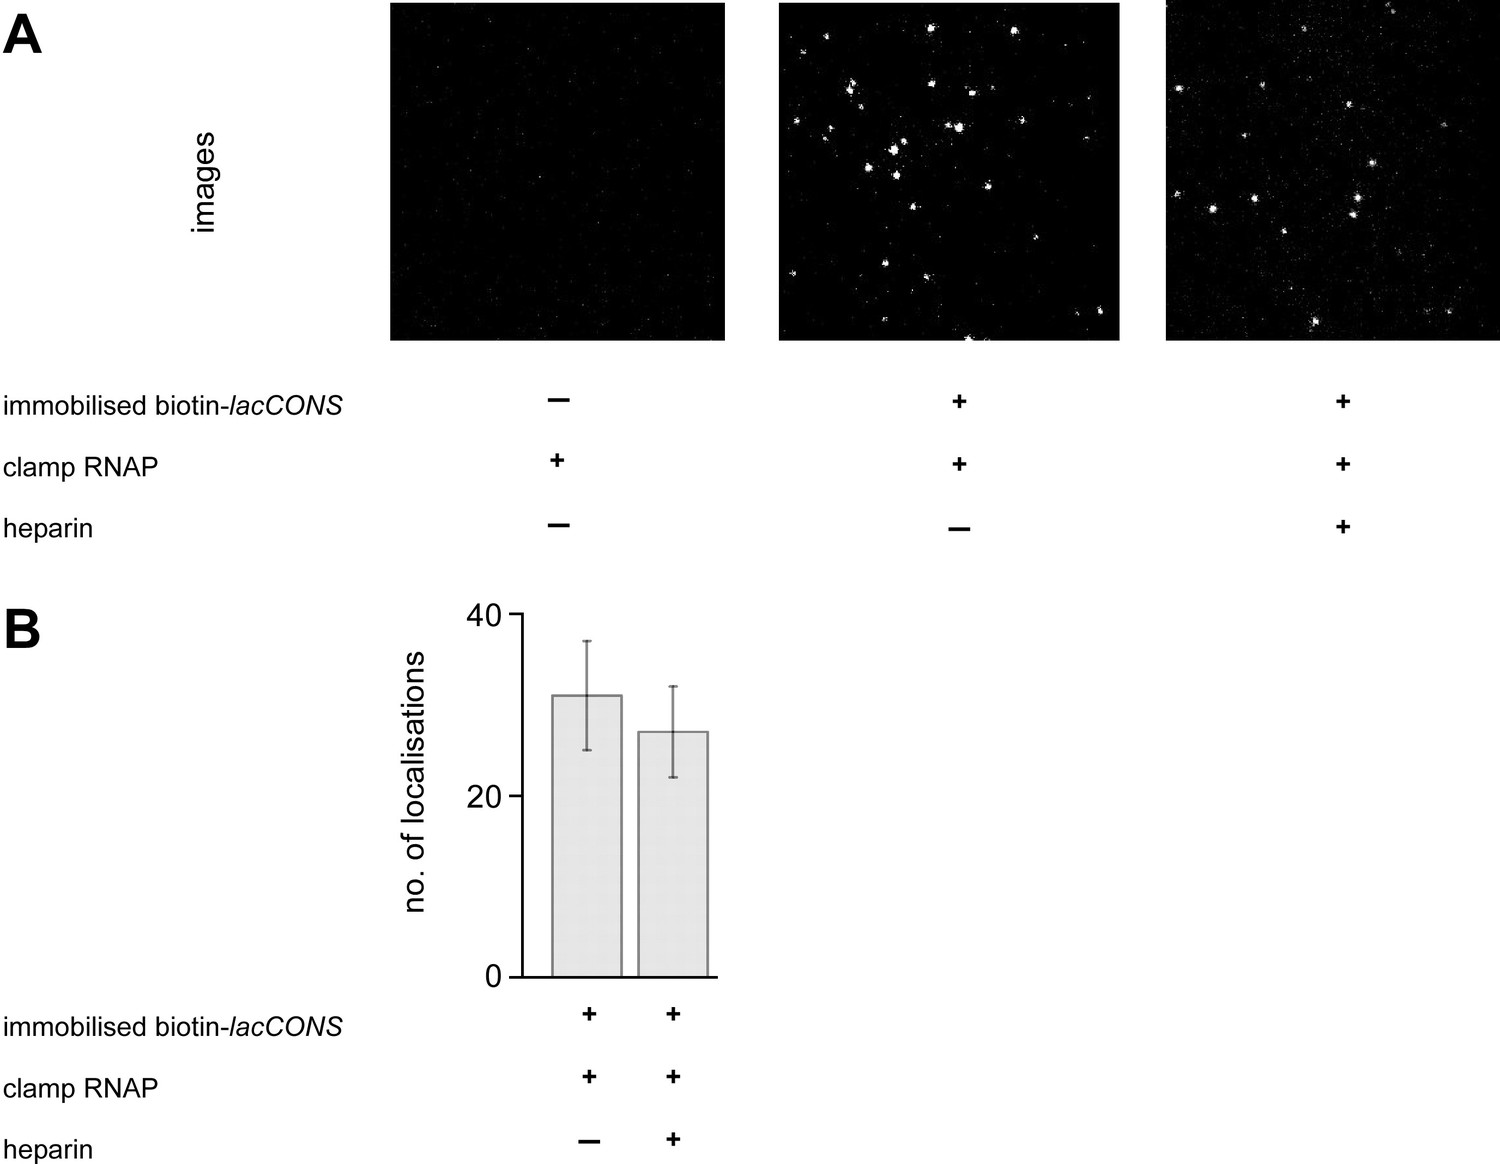
Characterisation of complexes formed between clamp-labelled RNAP and immobilised promoter fragments.
(A) Raw images of the green emission channel showing field of view (24 mm × 24 mm) with immobilised biotin-lacCONS promoter fragments (left), with immobilised biotin-lacCONS promoter fragments bound to clamp-labelled RNAP (middle), and with remaining immobilised biotin-lacCONS promoter fragments bound to clamp-labelled RNAP, after addition of heparin (right). (B) Mean number of localisations per field of view for single clamp-labelled RNAP molecules with both green (Cy3B) and red (Alexa647) probes, bound to immobilised biotin-lacCONS promoter fragments, before and after addition of heparin. Mean number of localisations are average of three measurements. Error bars represent the standard deviation from the mean.
Figure 3—figure supplement 2
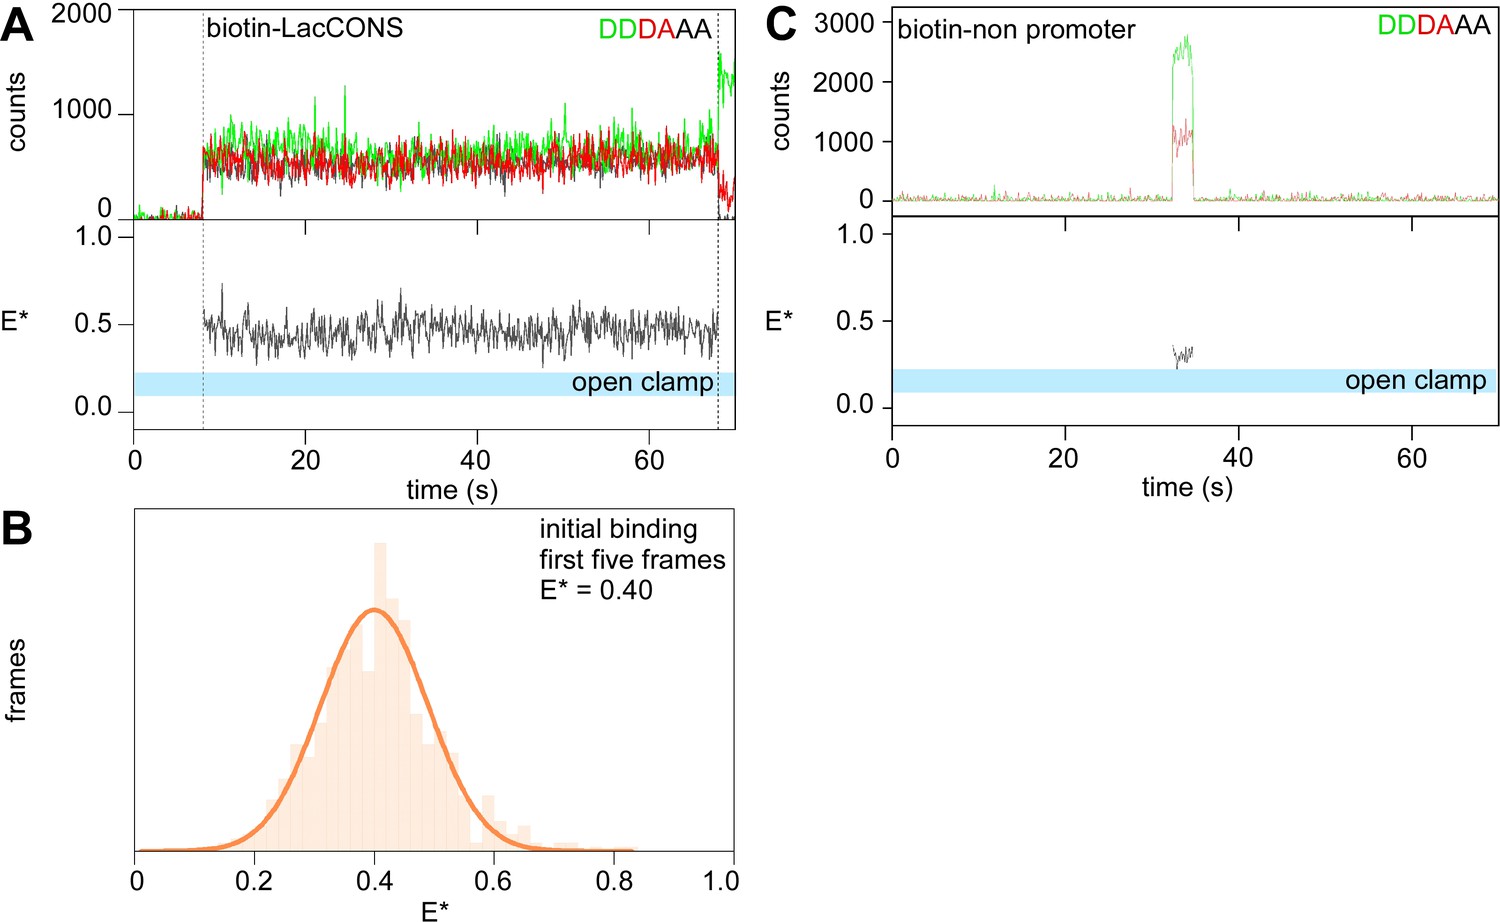
Single-molecule fluorescence resonance energy transfer (smFRET): initial binding of RNAP to surface-immobilised promoter DNA fragments take place via a closed-clamp conformation.
(A) Fluorescence intensity vs. time trajectories showing simultaneous appearance (at ~8 s) of donor and acceptor signals from labelled RNAP bound to biotin-lacCONS promoter fragment (top) and FRET efficiency, E* (bottom). Range for expected E* values corresponding to an open-clamp conformation is highlighted in cyan. (B) Histogram and Gaussian fit of E* values for first five frames after binding define the mean E* for initial binding. Frame duration: 100 ms. Laser powers: 200 μW in red and 500 μW in green. (C) Fluorescence intensity vs. time trajectories showing simultaneous appearance of donor and acceptor signals from labelled RNAP bound to biotin-non-promoter fragment (top) and FRET efficiency, E* (bottom). Range for expected E* values corresponding to an open-clamp conformation is highlighted in cyan.
Figure 3—figure supplement 3
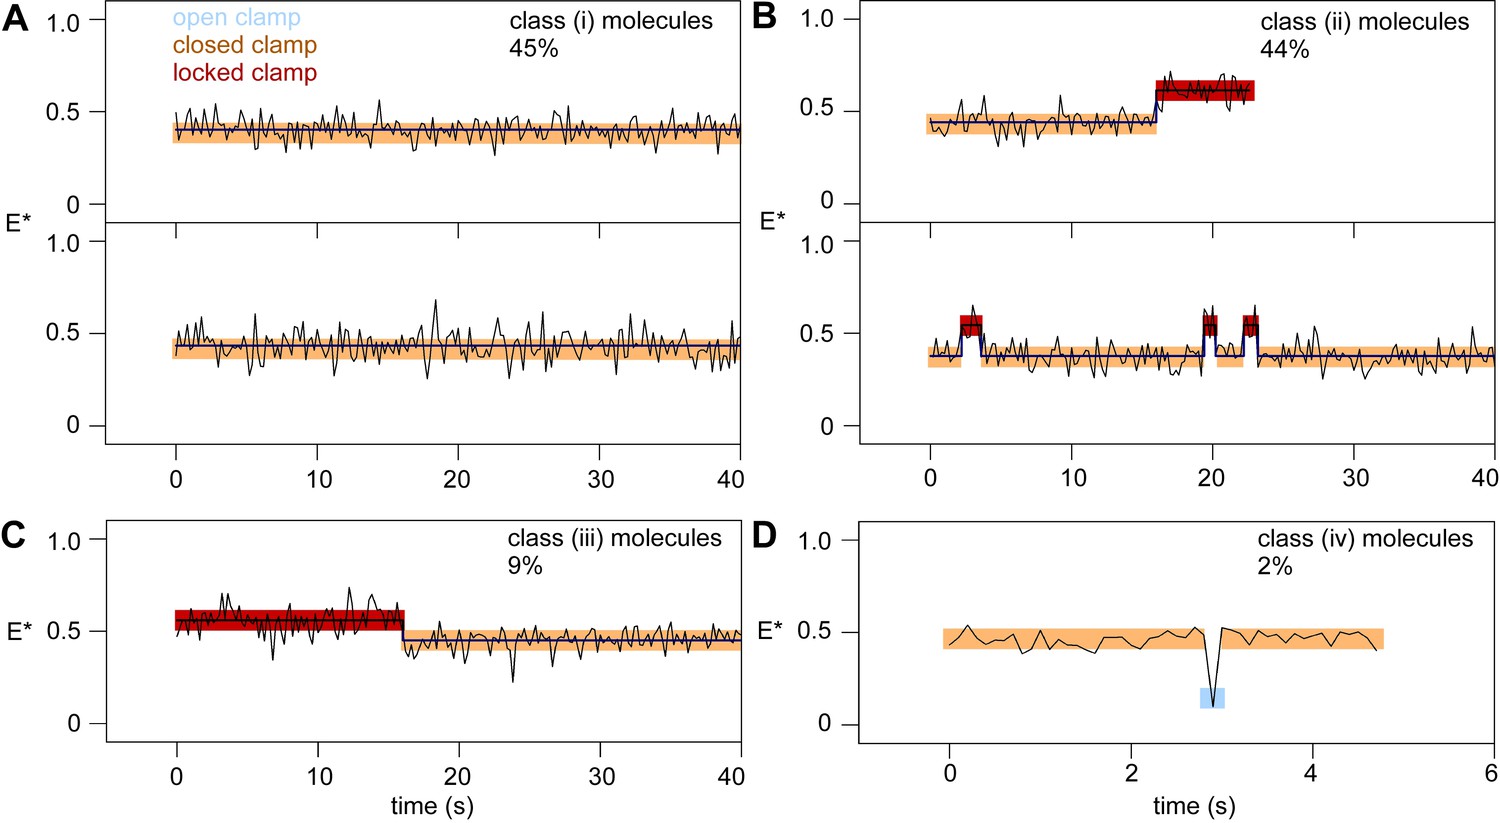
Classification for different time trajectories of E* of clamp-labelled RNAP molecules bound to immobilised lacCONS-promoter fragments in real time.
Hidden Markov model (HMM)-assigned E* time trajectories showing closed-clamp states (orange), locked-clamp states (red), open-clamp states (cyan), and interstate transitions (dark-blue).
Figure 3—figure supplement 4
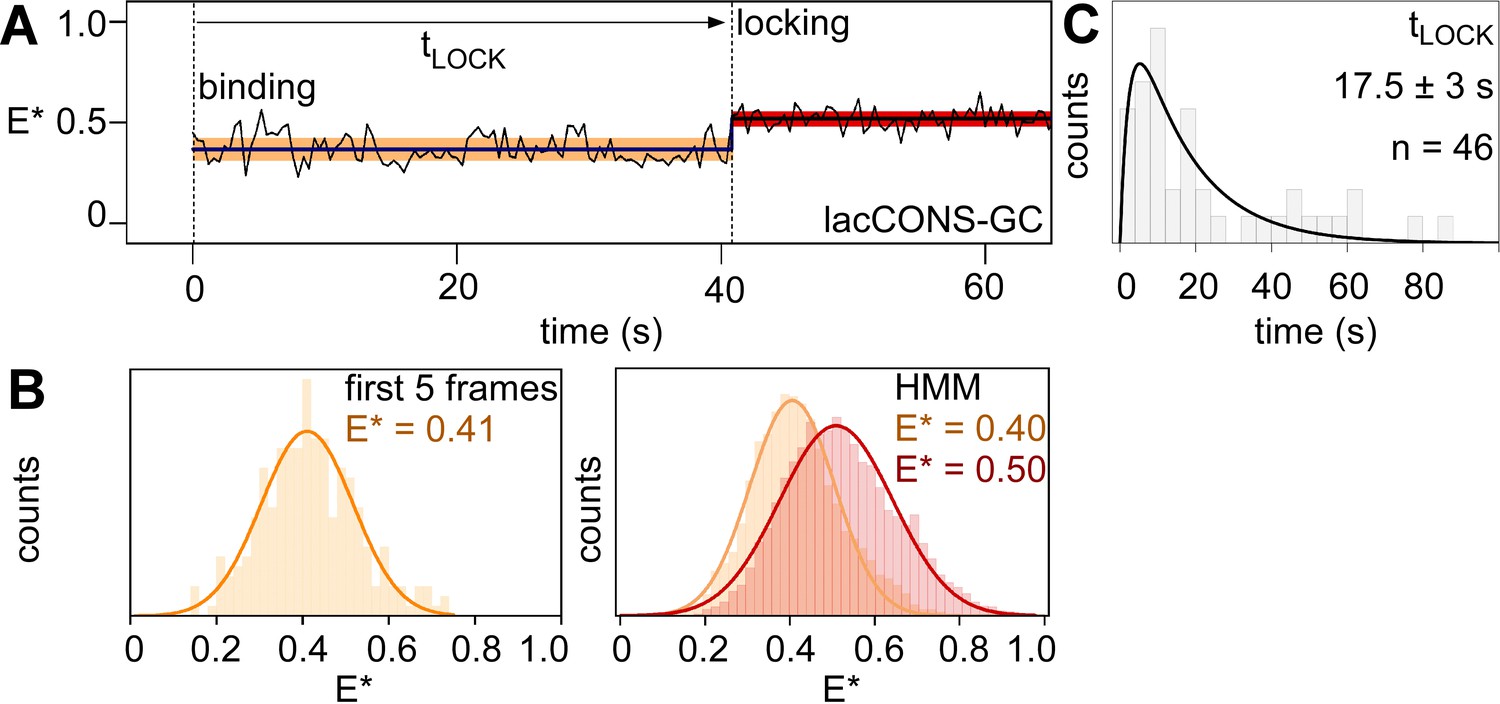
Single-molecule fluorescence resonance energy transfer (smFRET) data showing binding of clamp-labelled RNAP to immobilised biotin-G/C lacCONS promoter fragments.
(A) Time trajectory of E*, showing hidden Markov model (HMM)-assigned closed-clamp state (orange) and locked-clamp state (red). Frame duration: 400 ms. Laser powers: 50 μW in red and 150 μW in green. (B) HMM-assigned histograms and Gaussian fits of E* for first five frames (left) and full time trajectories (right). (C) Dwell-time histograms for time before transition to the locked-clamp state, tLOCK.
Figure 4
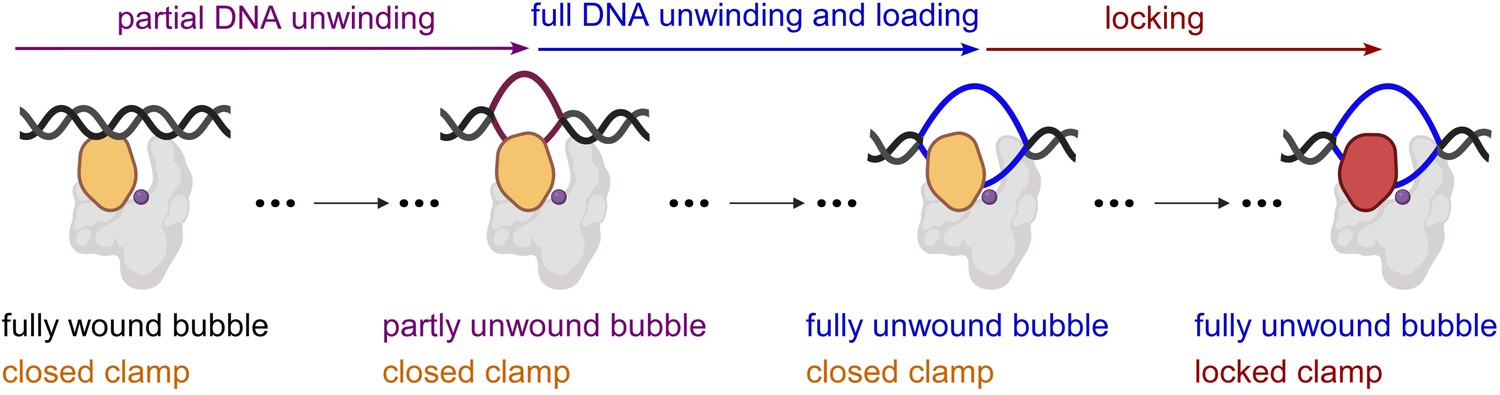
'Bind-unwind-load-and-lock’ mechanism for the formation of RPo.
Orange, closed clamp; red, locked clamp; grey, rest of RNAP; purple dot, RNAP active-centre; black, ds-DNA; magenta, partly unwound bubble and blue, fully unwound bubble.
Additional files
Download links
A two-part list of links to download the article, or parts of the article, in various formats.
Downloads (link to download the article as PDF)
Open citations (links to open the citations from this article in various online reference manager services)
Cite this article (links to download the citations from this article in formats compatible with various reference manager tools)
Transcription initiation at a consensus bacterial promoter proceeds via a ‘bind-unwind-load-and-lock’ mechanism
eLife 10:e70090.
https://doi.org/10.7554/eLife.70090


