Subpopulations of neurons in lOFC encode previous and current rewards at time of choice
- Center for Neural Science, New York University, United States
- Princeton Neuroscience Institute, Princeton University, United States
- Department of Molecular Biology, Princeton University, United States
- Howard Hughes Medical Institute, Princeton University, United States
- Center for Data Science, New York University, United States
Figures
Figure 1 with 1 supplement
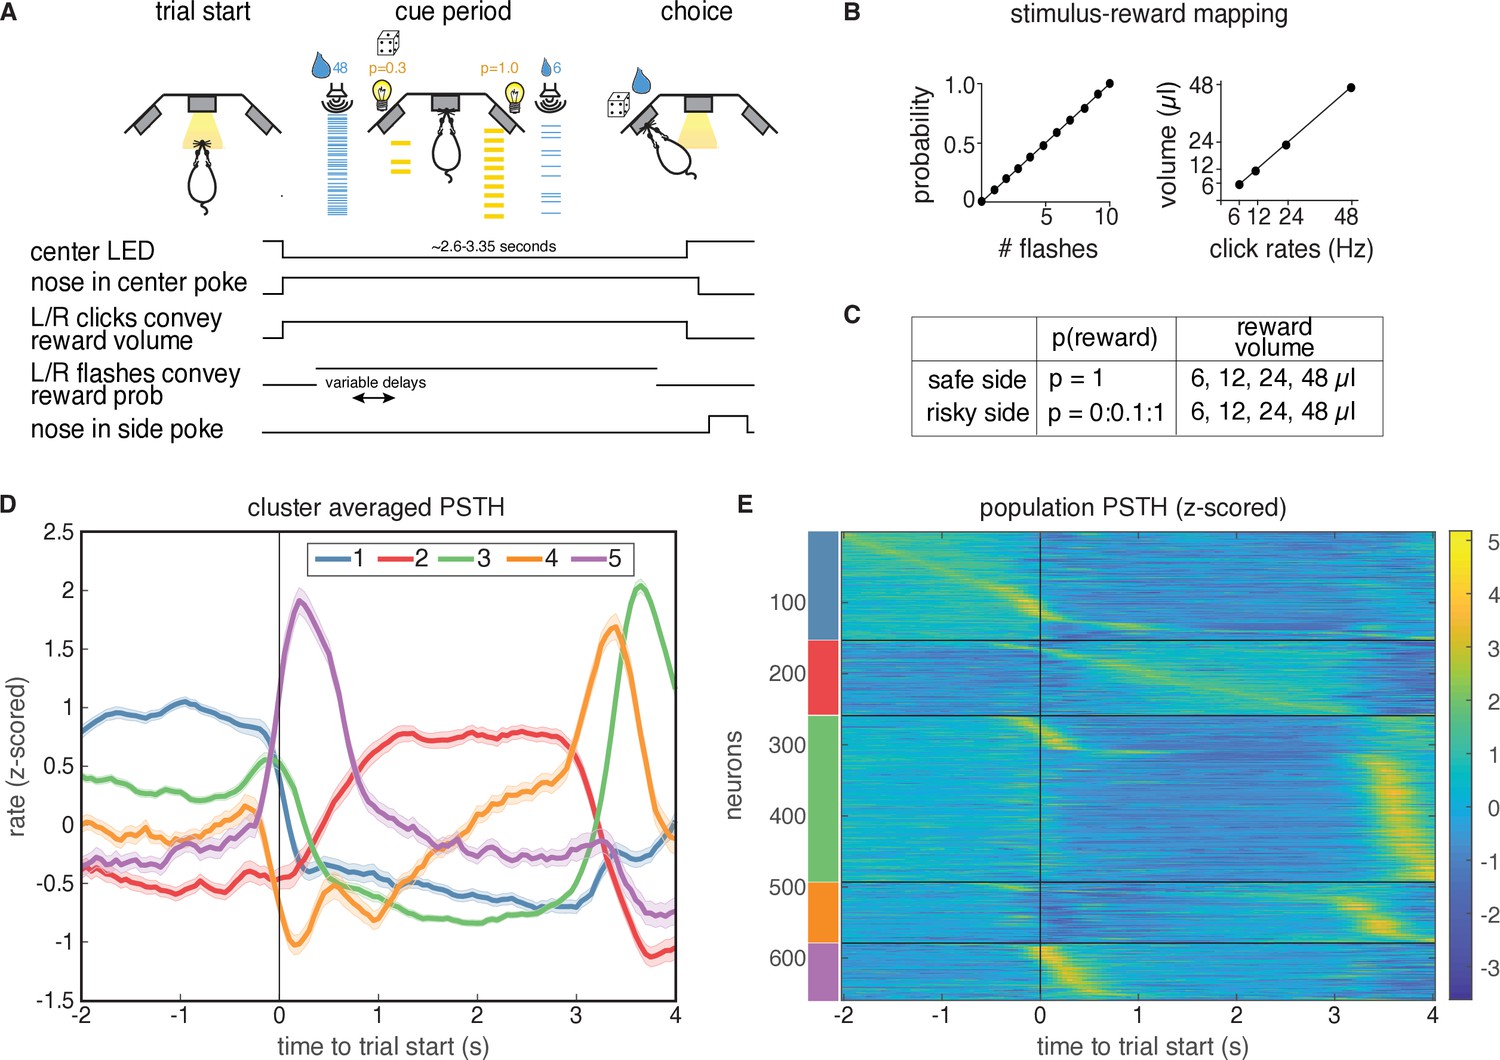
Task description and PSTH clustering.
Single units in lOFC belong to clusters with distinct temporal response profiles. (A) Behavioral task: rats chose between a guaranteed and probabilistic water reward on each trial, that could each be one of four water volumes. Rats were well-trained and tended to choose the option with the greater subjective value. Reward probability and volume were cued by visual flashes and auditory click rates, respectively. (B) Mapping between the visual flashes/auditory clicks and reward attributes. (C) Range of reward attributes. (D) Cluster-specific, mean responses of the trial-averaged, z-scored PSTHs. Error bars denote s.e.m. (E). Z-scored PSTHs for neurons in each cluster, sorted by time to peak within each cluster. Colored bars on the left indicate the cluster identities from panel D. Panels A-C reproduced and modified from Constantinople et al., 2019a.
Figure 1—figure supplement 1

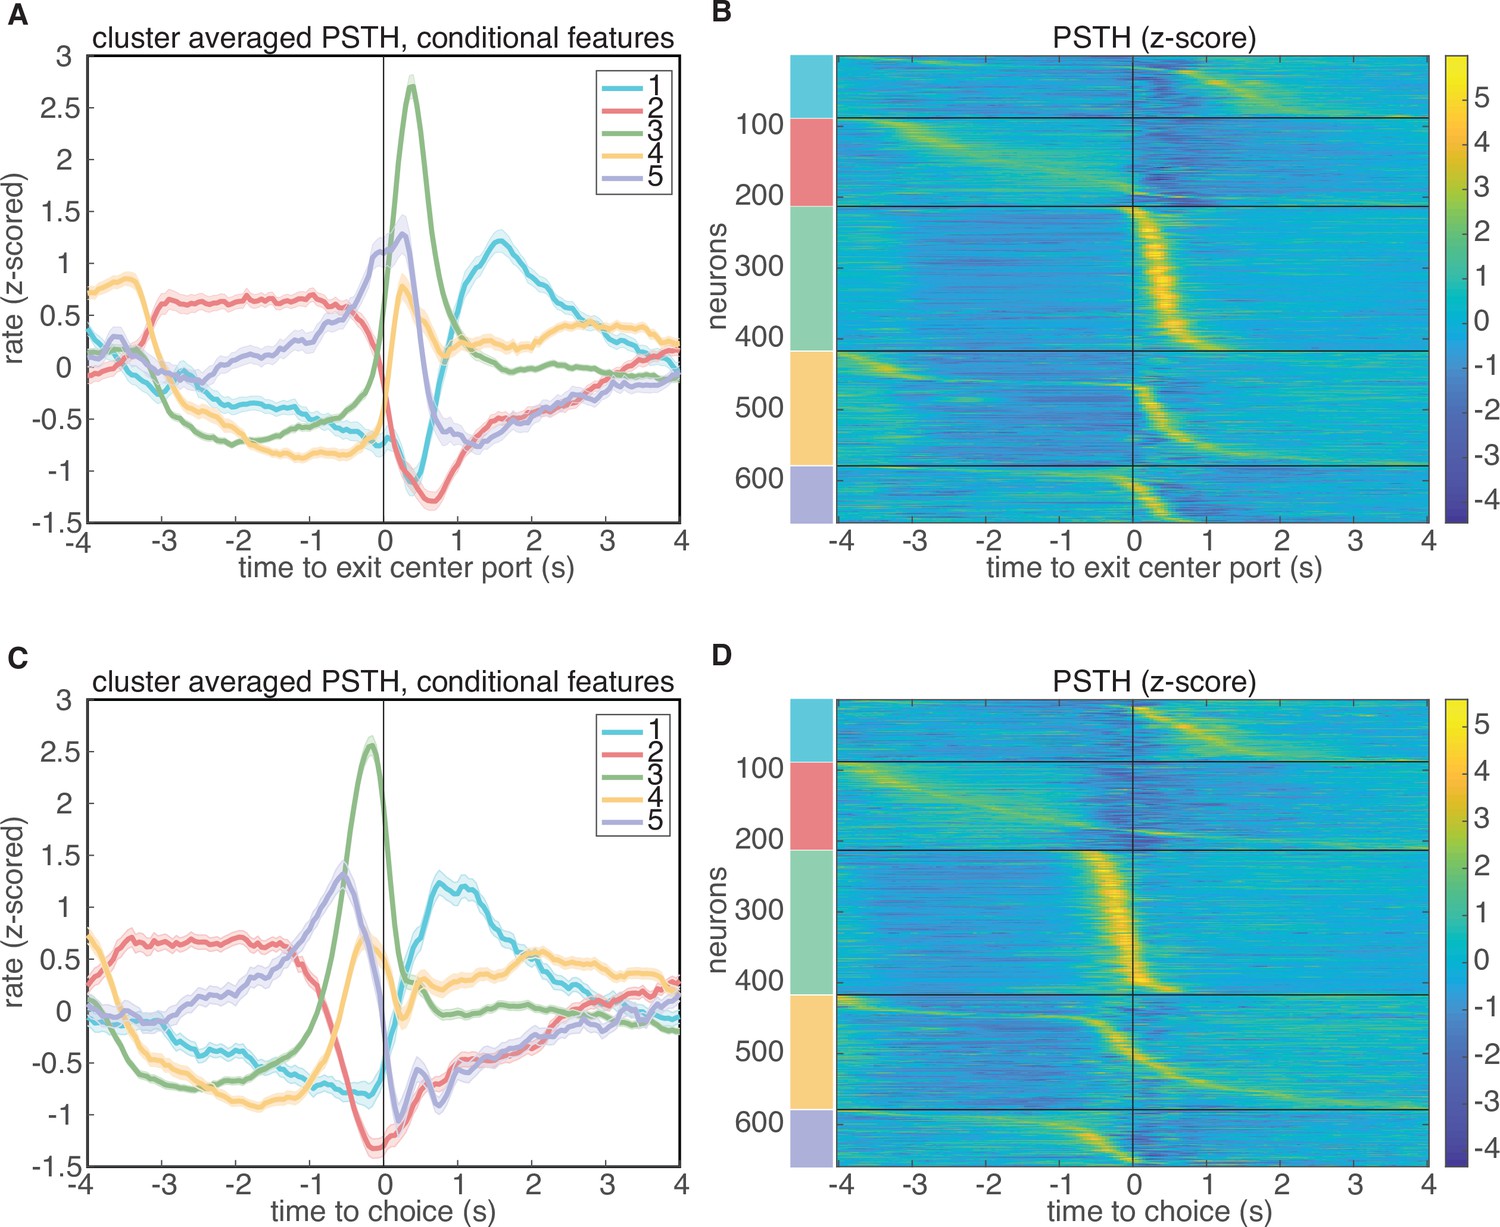
Clustering aligned to different task events.
PSTH-based clustering of responses, aligned to different events in the task. (A-B) Results aligned to exiting the center port. (C-D) Results aligned to choice.
Figure 2 with 6 supplements
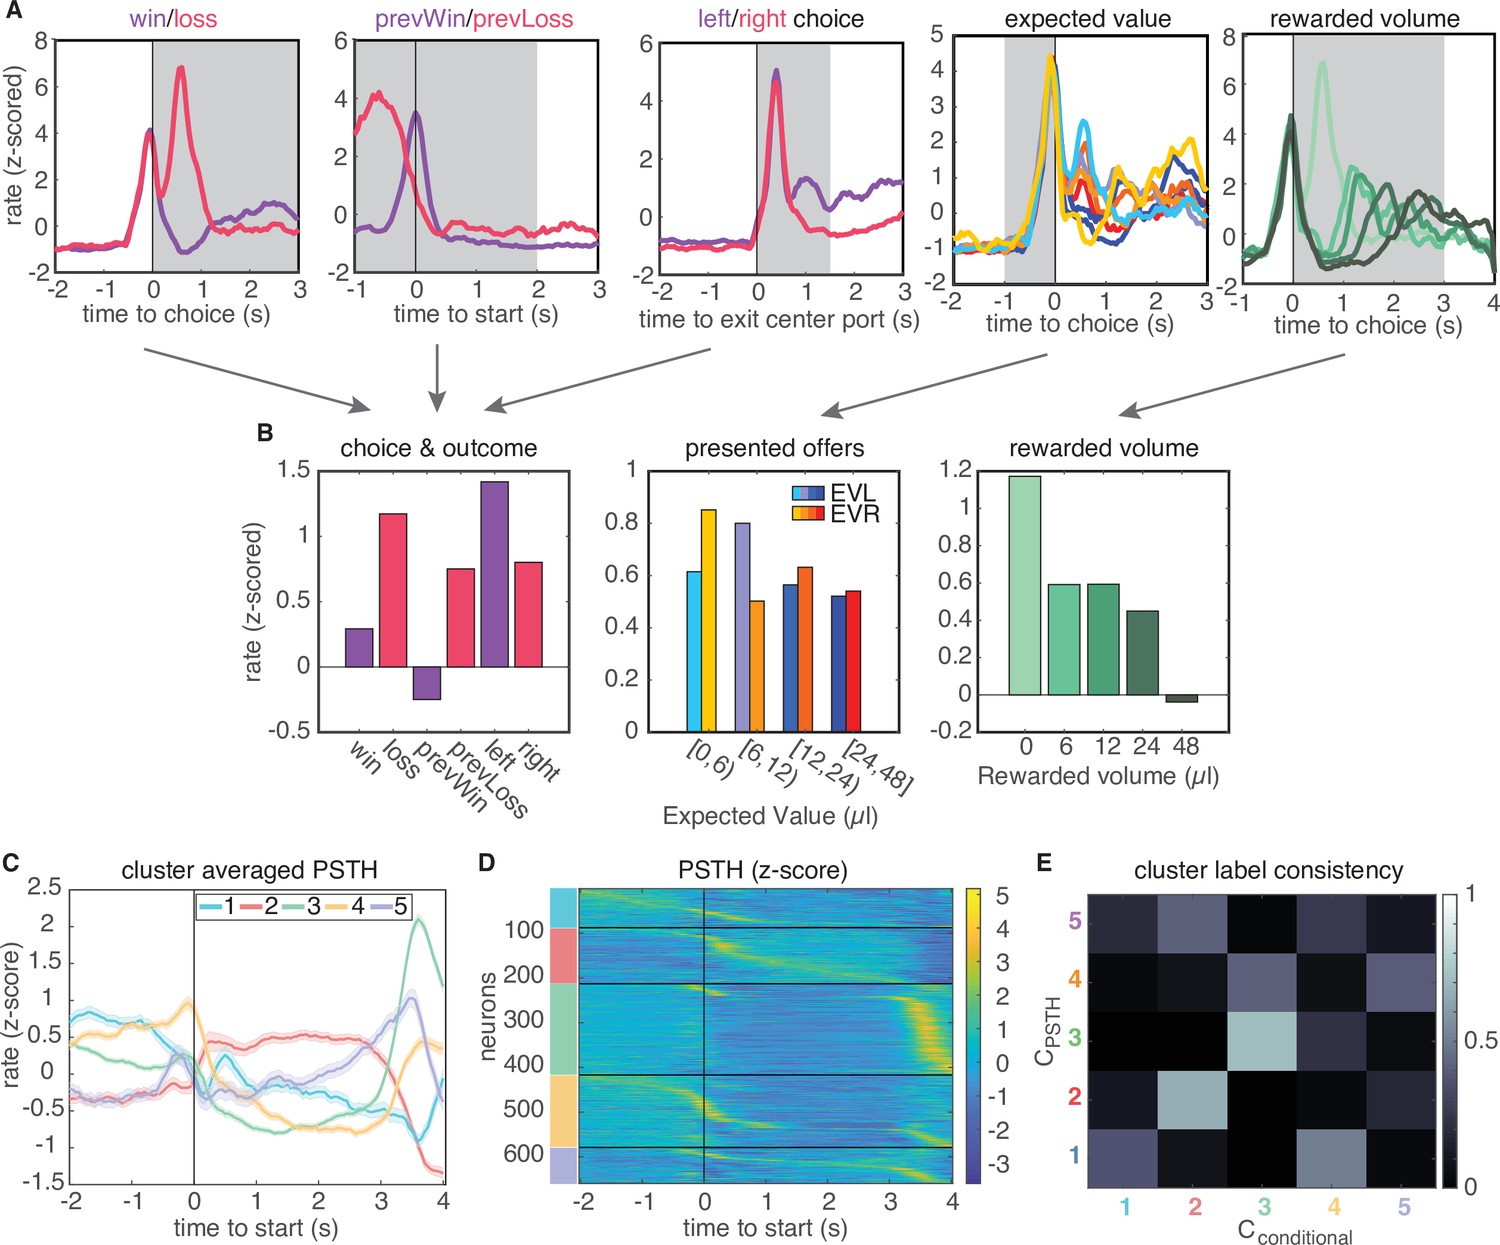
Conditional feature space clustering.
(A) Feature-conditioned PSTHs of an example neuron. The average z-scored firing rate in each gray time window comprises an element in the feature space. (B) Feature space for conditional clustering for the sample neuron from A. The average firing rate for each condition is concatenated to yield a 19-dimensional feature space. Here, features are grouped into three qualitative types (for presentation purposes only): responses for choice and trial outcome (left); responses to expected value of left and right offers (middle); and responses to received reward volume (right). (C) Cluster-averaged PSTHs, aligned to trial initiation, using this conditional feature space. Error bars denote s.e.m. (D) Z-scored PSTHs for all neurons, sorted by time to peak within each cluster. (E) Consistency of cluster labeling, calculated as the conditional probability of belonging in any ‘conditional’ cluster (), given that a unit belongs to a certain PSTH-defined cluster ().
Figure 2—figure supplement 1

Gap statistic.
Gap statistic evaluation for both clustering approaches (see Materials and methods for details). Error bars denote ±2 s.e.m. (A) PSTH-based clustering results. (B) Alternative clustering approach based upon a conditional feature space. Vertical black lines denote largest significant number of clusters.
Figure 2—figure supplement 2

Similarity across clustering methods.
Similarity of clusters in feature space. (A) t-SNE embedding of the PSTH feature space: Dots are individual neurons, and colors denote the cluster identity. (B) Similar t-SNE embedding of the conditional feature space. Quantification of the cluster similarity through the cluster-averaged Mahalanobis distance of neurons from a given cluster distribution from all other clusters for (C) the PSTH feature space clustering result and (D) the conditional feature space clustering result.
Figure 2—figure supplement 3
Clustering aligned to different task events.
Results of clustering on conditional features space, aligned to different events in the task. (A-B) Results aligned to exiting the center port. (C-D) Results aligned to choice.
Figure 2—figure supplement 4

PAIRS analysis.
PAIRS statistic analysis. (A) Average angles between k = 3 nearest neighbors in the PSTH-based feature space (red) compared to a Gaussian distribution in the same dimension (blue). (B) Similar distribution for the conditional feature space representation of neural responses, for k = 8 nearest neighbors. The Kolomolgorov Smirnov (KS) statistic comparing the data distributions to the reference distribution yielded for the PSTH clustering, and for the conditional clustering. PAIRS statistics were 0.13 () and 0.06 (). Details on the reference data are provided in Methods.
Figure 2—figure supplement 5

Silhouette score and adjusted Rand index evaluation of cluster number.
Silhouette score and adjusted Rand index (ARI) in different features spaces. (A) Mean ARI values for clustering on PSTHs. ARI was calculated between the full dataset and 100 samples of subsampled data, created by sampling 90% of the population without replacement. Error bars are s.e.m. (B) Silhouette score for clustering on PSTHs. (C-D) Same analysis, but for the conditional feature space.
Figure 2—figure supplement 6
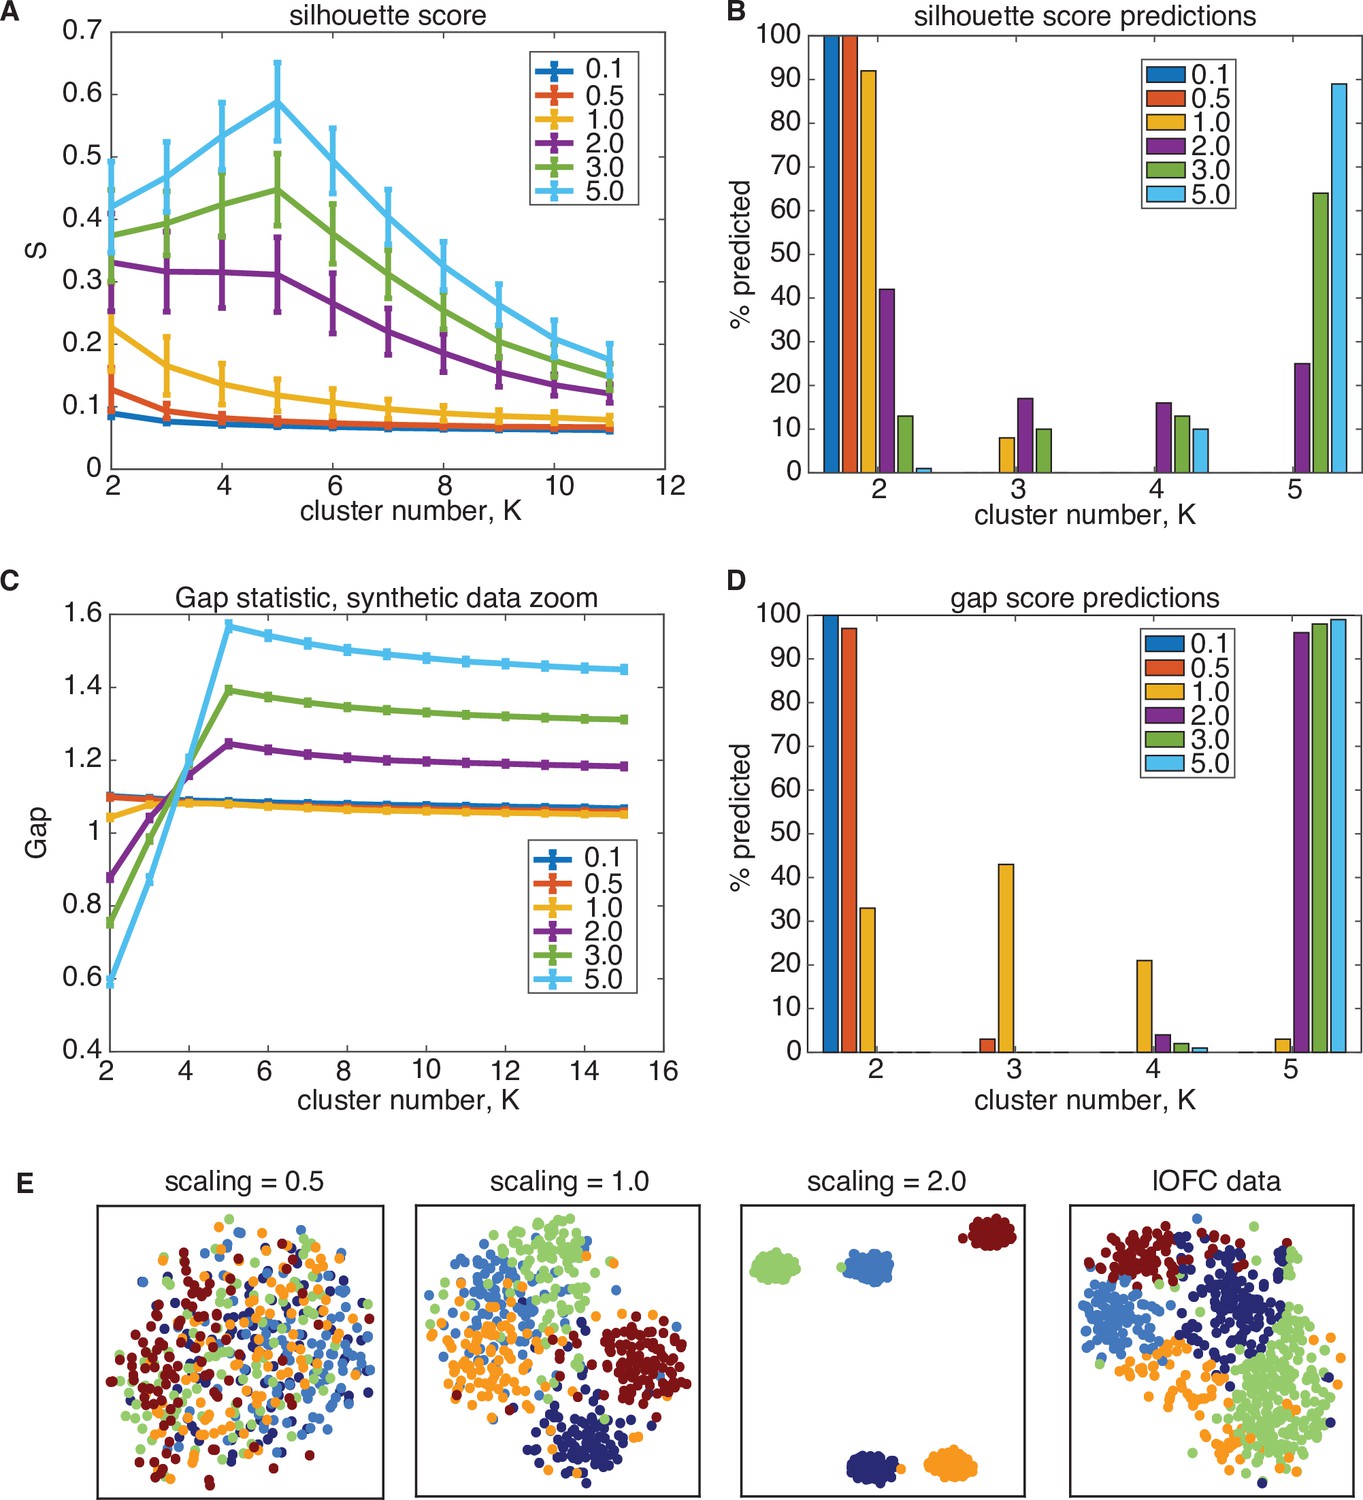
Synthetic data study of silhouette score performance.
Silhouette score underestimates the number of clusters on ground-truth data in the same data regime as lOFC responses. The covariance structure lOFC data in the PSTH feature space was used to generated ground-truth, synthetic data containing clusters, and the total-data covariance was scaled to investigate the ratio of across-cluster and within-cluster variance (See Methods for full details). (A) Performance of silhouette score for varying scaling of total-data covariance, where scaling = 1.0 (yellow) is the same regime as lOFC responses. Error bars are 1 s.e.m over 100 ground-truth datasets (B) Frequency of cluster number chosen for each dataset when using the silhouette score. For data scaled similarly to lOFC responses, silhouette scores predominantly choose K = 2 clusters, and do not identify the true cluster number until the data is scaled to be very separated (scaling = 5.0, light blue) (C) Performance of the gap statistic on the same synthetic data, where error bars are 1 s.e.m. (D) Frequency of chosen cluster number using the gap statistic. The gap statistic also understimates cluster number in the lOFC data regime, but does so in a less severe manner: It predicts a range of values for scaling = 1.0, and quickly converges to predicting the correct number of clusters at only modest scaling of the data (scaling = 2.0, purple). (E) t-SNE visualization of ground-truth data for different total-data covariance scaling.
Figure 3 with 2 supplements
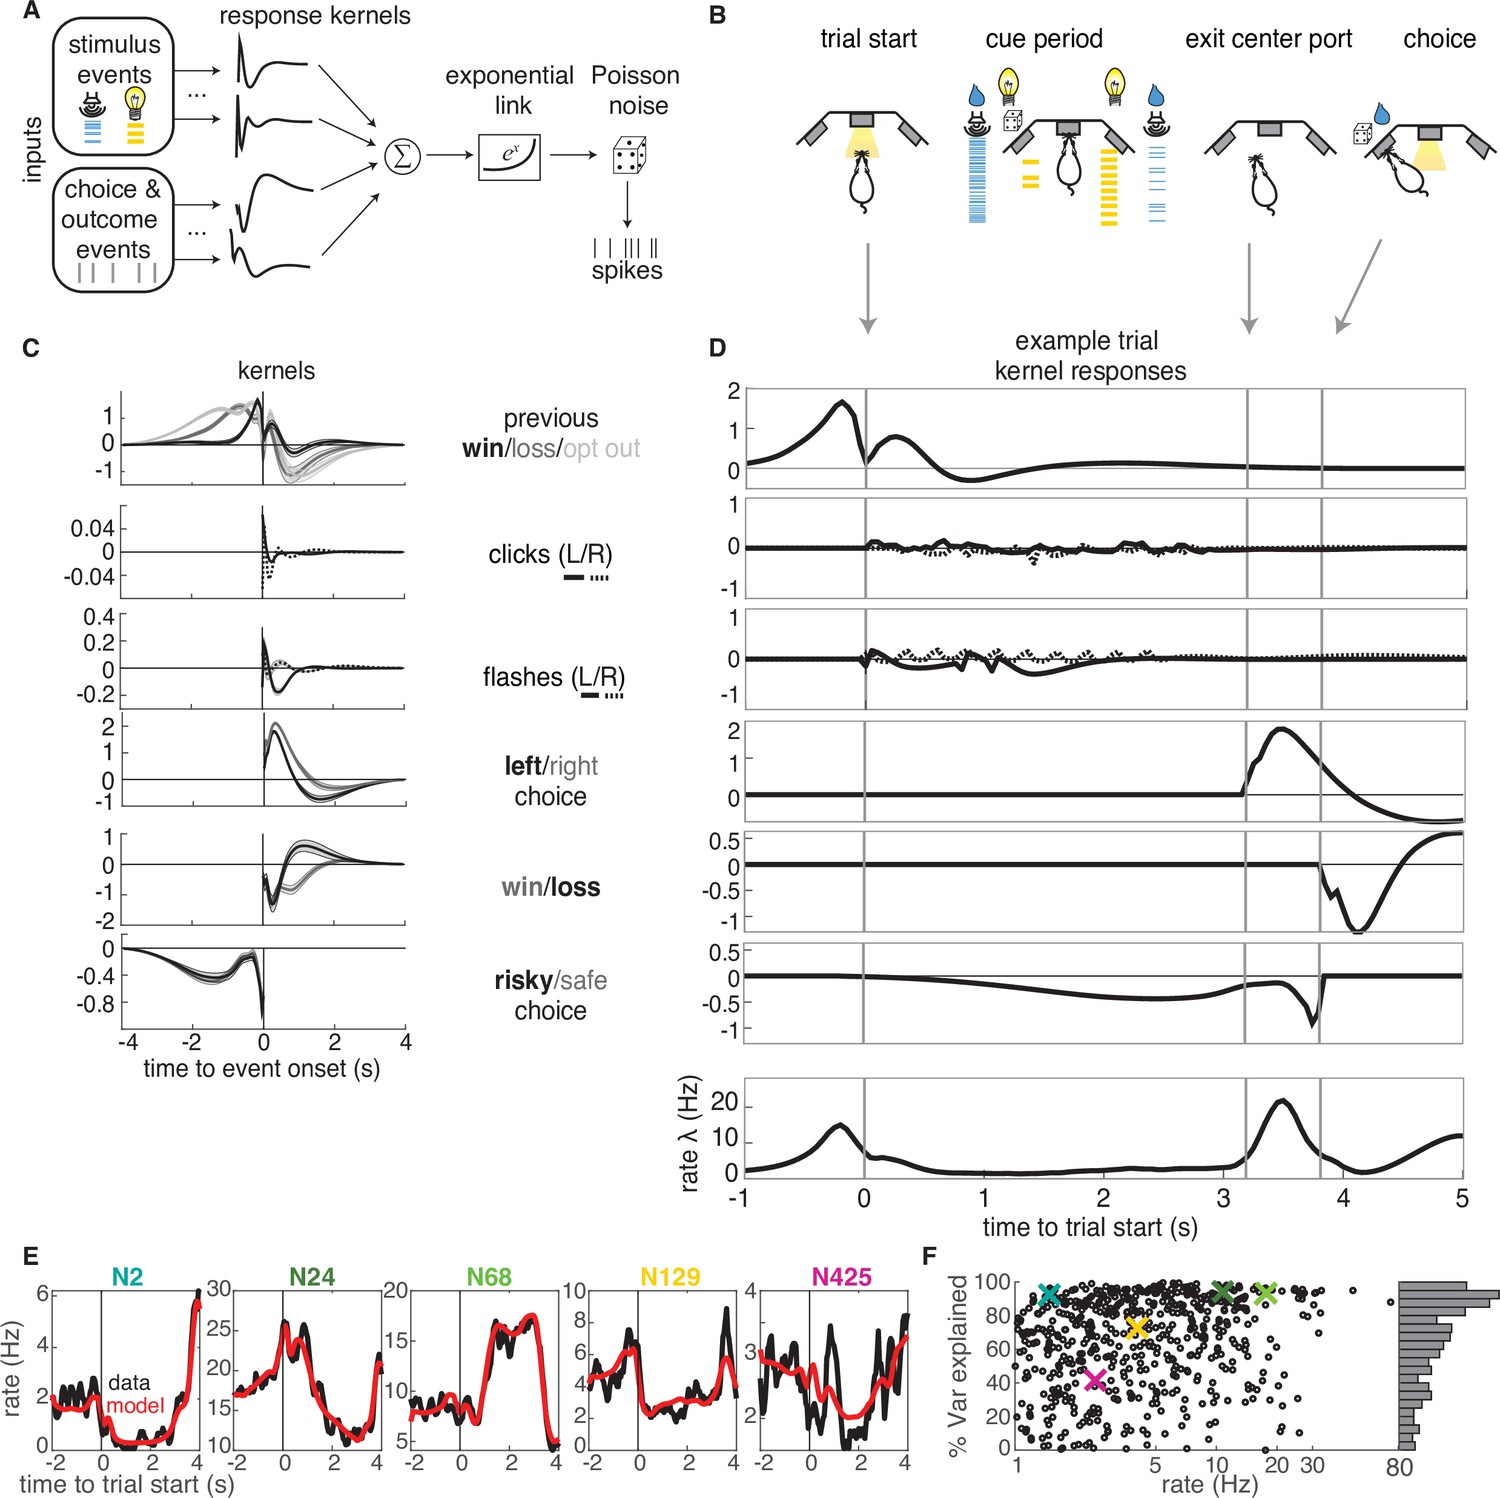
GLM analysis.
(A) Model schematic: the timing of external stimuli conveying reward attributes, as well as timing of choices and outcomes on each trial are model inputs. Nonlinear response kernels convolved with each input generate time dependent responses that are summed and exponentiated to give a mean firing rate, , in each time bin. Spikes are generated from a Poisson process with mean firing rate . (B) Task schematic illustrating the key choice and outcome inputs to the model. (C) Kernel fits for a sample neuron. Kernels are grouped by the aspects of the task that they model. Error bars denote estimated kernel standard deviation (Materials and methods). (D) Timing of each kernel’s contribution in an example trial. The kernels in bold from panel C are the kernels that are active in this trial. The resulting model-predicted firing rate is shown in the bottom row. (E) Representative PSTHs to held-out testing data from five different neurons (black) and model prediction (red). (F). Variance explained for each neuron, with sample neurons from E denoted by correspondingly colored crosses. The distribution of values is presented along edge of the panel.
Figure 3—figure supplement 1

Model comparison.
Model ‘best’ was the model utilized in this work, and detailed in Figure 3. Two more complex models (+ vol,+ prevVol), as well as two simpler models (-RewRate,-RewHist) were compared through model comparison on held-out data log-likelihood.+ prevVol substituted previous wins with rewarded volume on the previous trial, and+ vol additionally substituted trial wins with rewarded volume. -RewRate omitted the sessionProgress, prevRewardRate, and previousOptOut kernels, and -RewHist further omitted the remaining reward history kernels. (A-D) Individual model comparisons. (Left) Histograms of the population-level changes in held-out negative log-likelihood demonstrate when a model performs significantly better if the median is different than 0. Significance is assessed through Wilcoxon signed rank test. in all comparisons. Median values were , , , . Sample neuron fits demonstrating the most extreme change in are shown in the middle columns, and neurons demonstrating the median change in are shown in right columns. (E) Performance of models assessed through the mean-squared error on PSTHs from held-out test data as compared to model predictions.
Figure 3—figure supplement 2
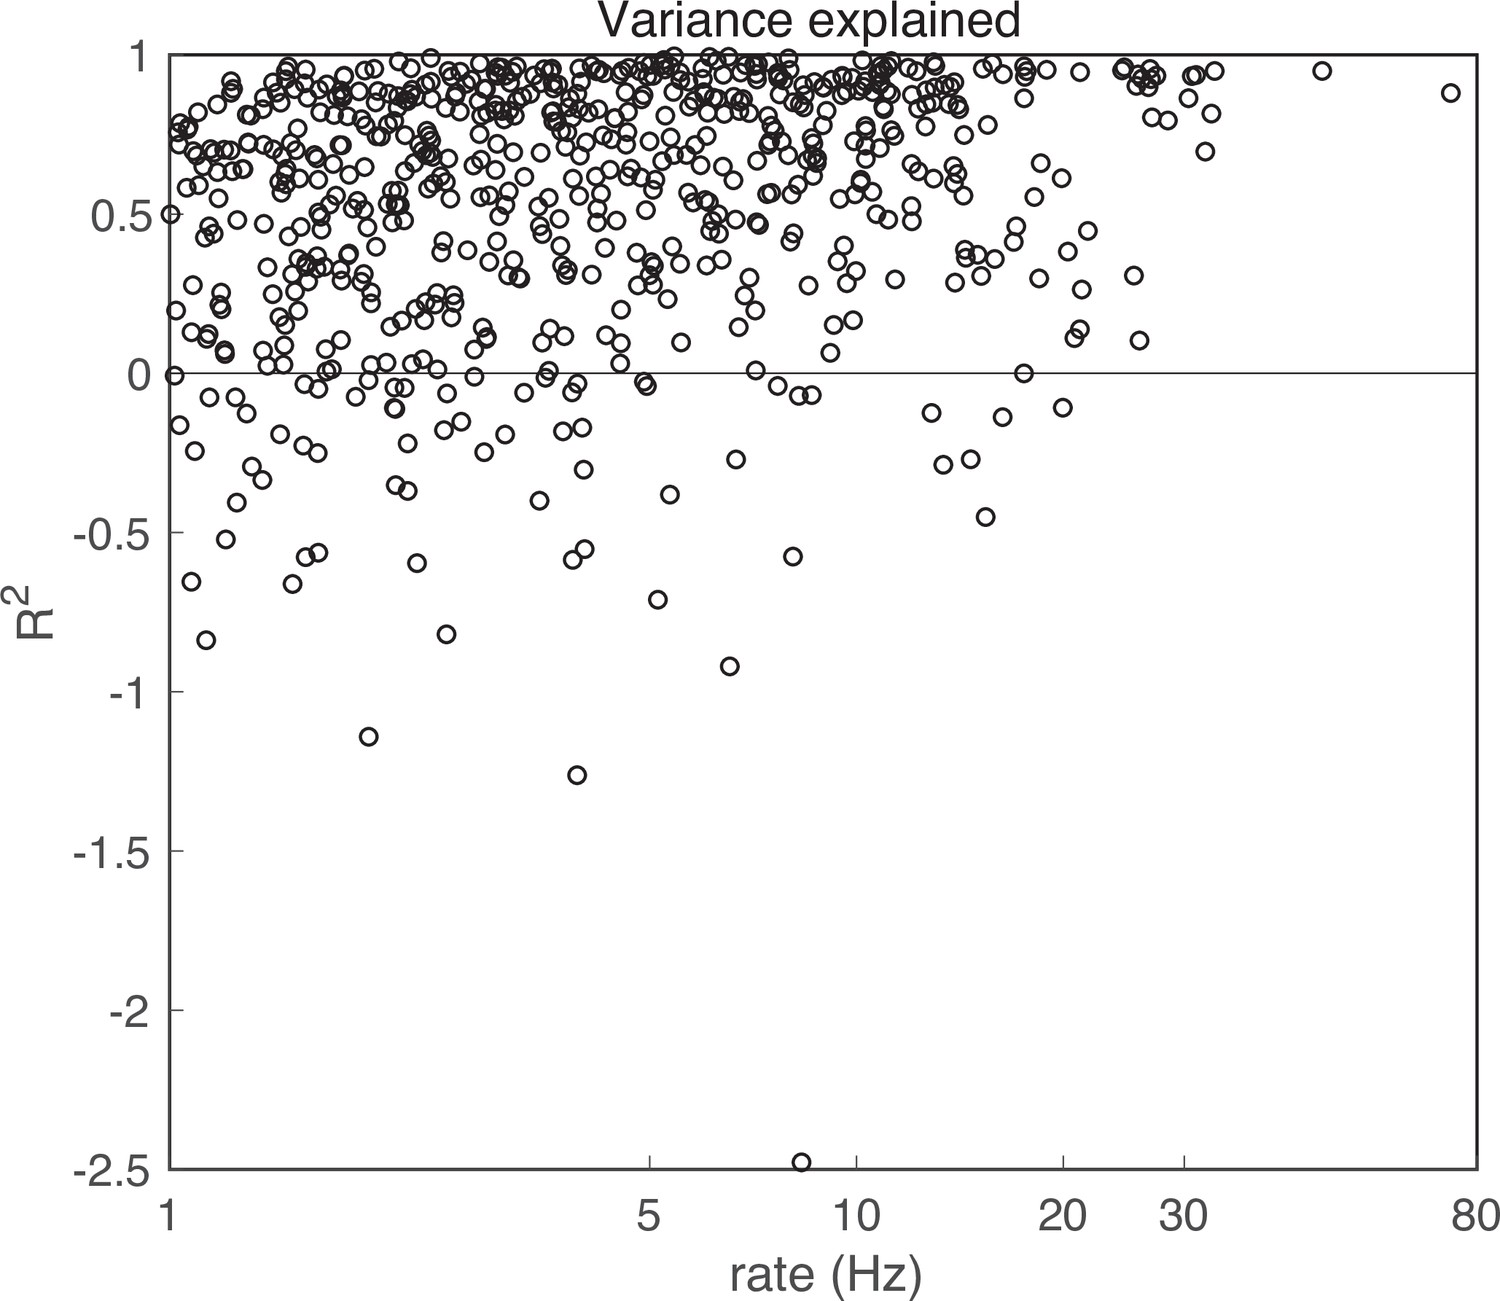
Variance explained.
Variance explained, R2 , for all model fits. For 69 units (10.5%), the model had R2 < 0. These units were excluded from further analysis.
Figure 4 with 1 supplement
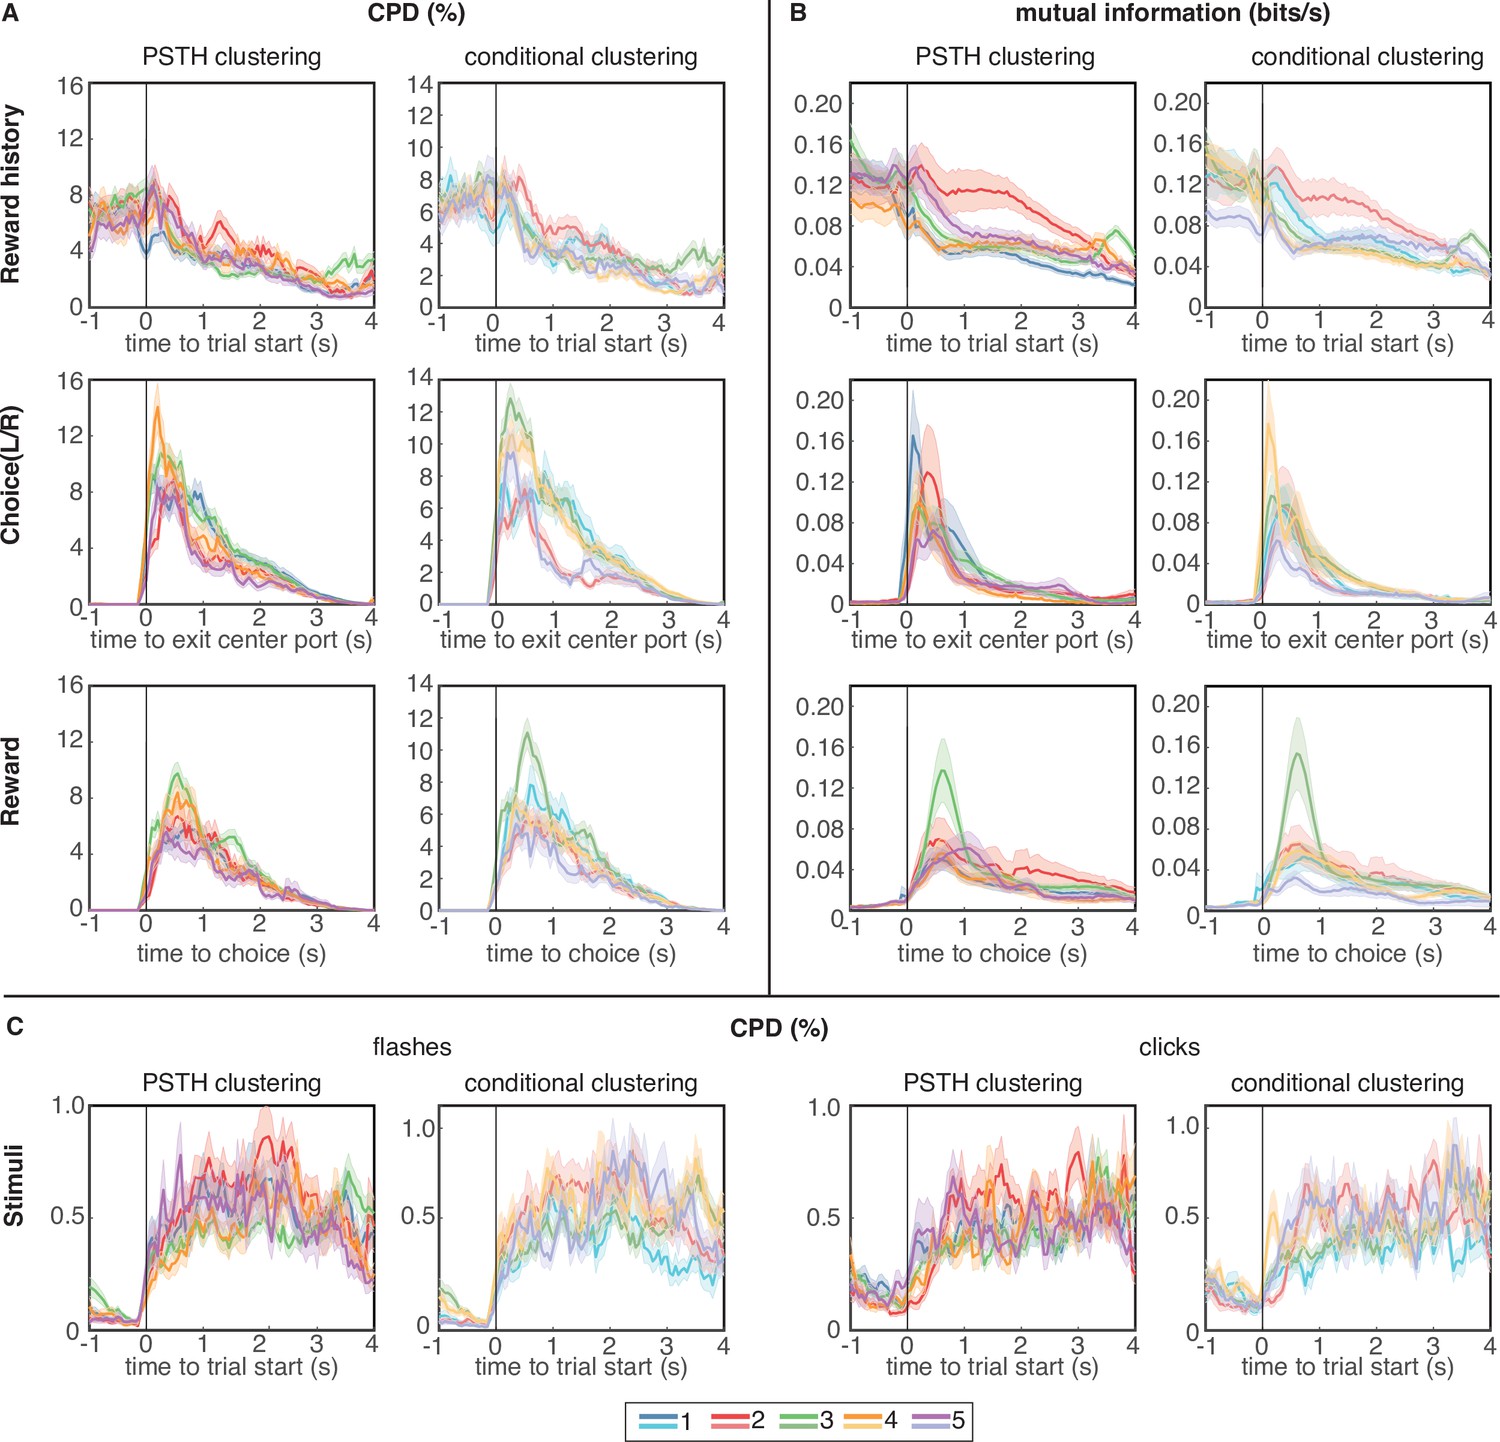
Coefficient of partial determination (CPD) and mutual information (MI) reveal broad encoding of all task parameters in each cluster.
(A) CPD for choice and reward outcome encoding: Reward history panels quantify encoding of outcome on the previous trial (previous win/loss/opt out), choice panels convey encoding of choices on the current trial (left/right), and reward panels quantify encoding of outcomes on the current trial (win/loss). (B) Mutual information for same task parameters. (C) CPD of flashes (left panels) and clicks (right panels) that encode reward probability and reward volume, respectively. CPD and MI values are averaged over neurons in each cluster; error bars show s.e.m. Results for PSTH clustering are in the left columns, and results for conditional clustering are in the right columns.
Figure 4—figure supplement 1
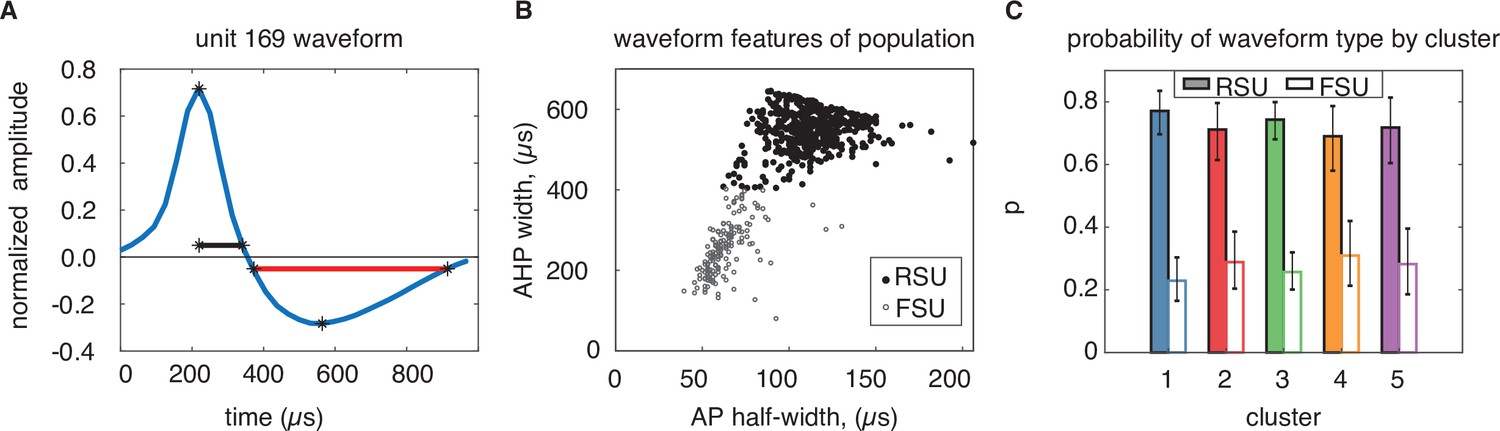
Waveform analysis.
Waveform action potential (AP) and after-hyperpolarization (AHP) widths are equally distributed across clusters. (A) The half-width of the AP peak (black), and full width of the AHP trough (red) were taken as key features of the waveform from each neuron. Waveforms were standardized by mean-subtracting and normalizing by the maximum amplitude range. (B) AP and AHP for the population of units clustered into two putative groups: Regular spiking units (RSU, solid circles), and fast spiking units (FSU, open circles). (C) Probability of an RSU or FSU neuron occurring in each N = 5 clusters from the PSTH-based clustering labeling. Error bars denote the 95% binomial distribution confidence interval. The means of the two putative FSU and RSU clusters were significantly different (, , , signed-rank test, not shown).
Figure 5 with 2 supplements
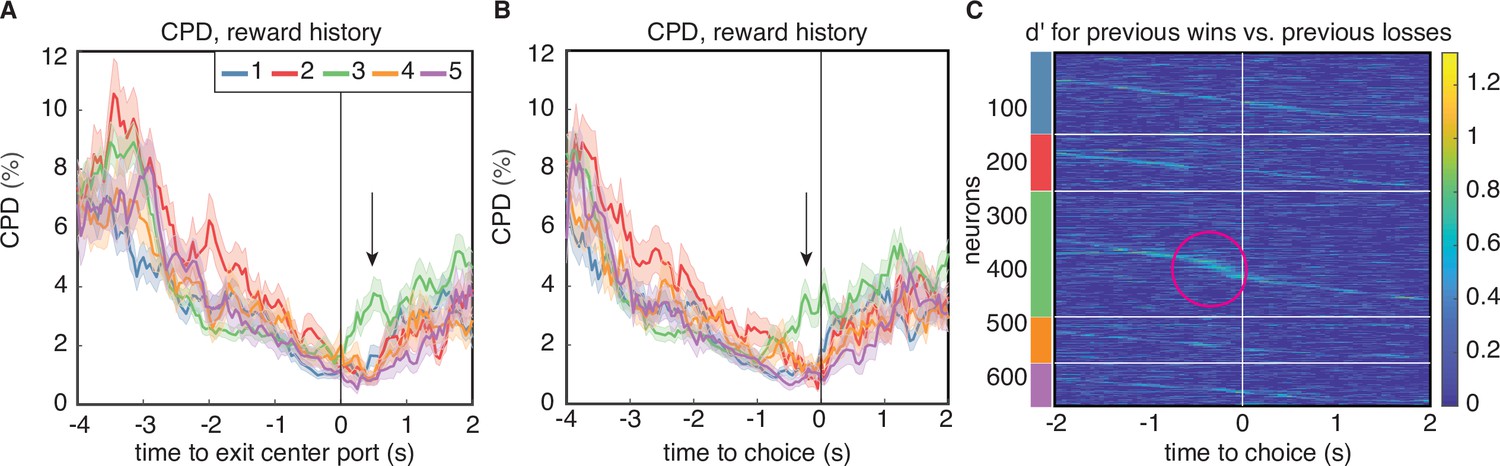
Encoding of reward history emerges late in the trial for cluster 3.
(A) CPD for reward history, aligned to leaving the center poke after the cue period. Note the peak in encoding that is isolated to cluster 3 (black arrow). (B) CPD similarly aligned to choice, demonstrates that this encoding occurs before reward delivery on the current trial. (C) Sensitivity, , across time and neurons for reward history has activity isolated to cluster 3 (magenta circle). is sorted within the PSTH-based clusters by time-to-peak.
Figure 5—figure supplement 1
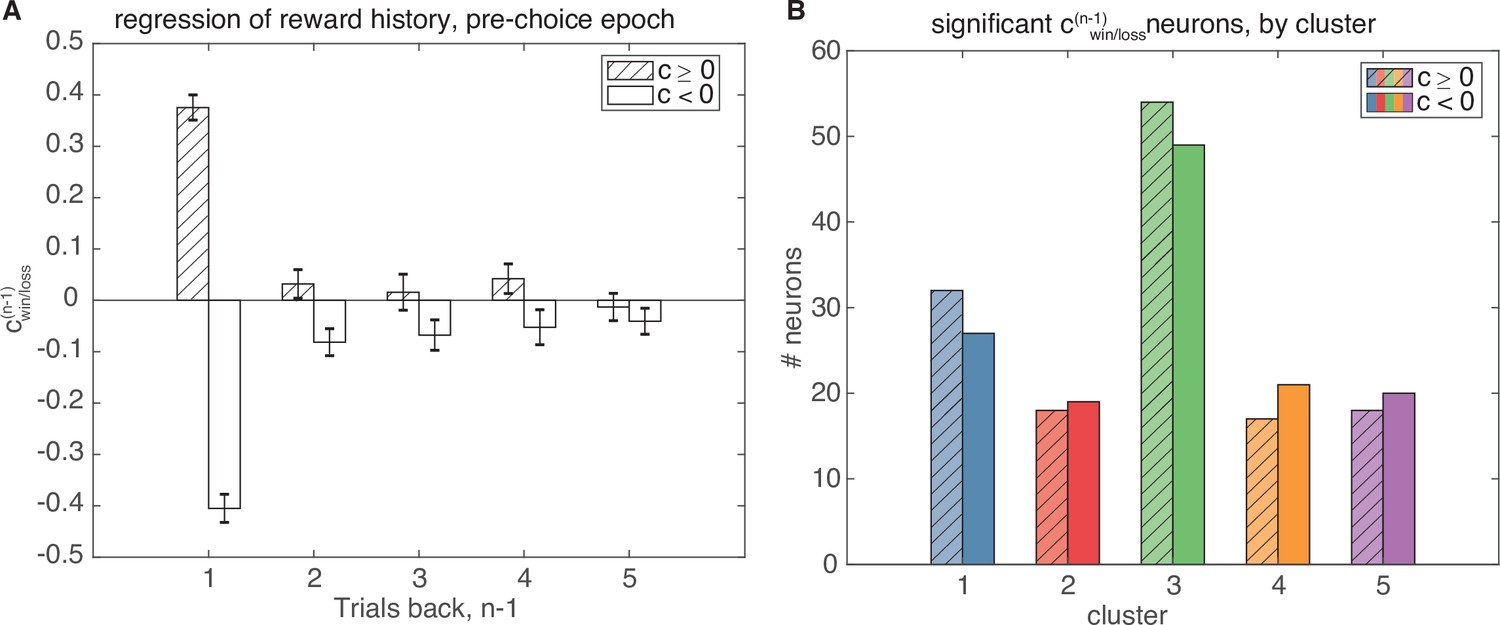
Linear regression on recent trial history.
Linear regression of the pre-choice epoch based on recent trial history. (A) Average regression coefficients for all statistically significant models with significant ( for F-test comparing full model to mean-rate baseline model, for t-test of ). Regression coefficients one trial back have both positive and negative coefficients for reward outcome one trial back that convey different coding schemes for rewarded value, but coefficients for increasingly further trials back are not significant. (B) Number of neurons with significant models containing either positive (shaded) or negative (not shaded) coefficients, separated by cluster. Cluster 3 contains the majority of statistically significant neurons.
Figure 5—figure supplement 2
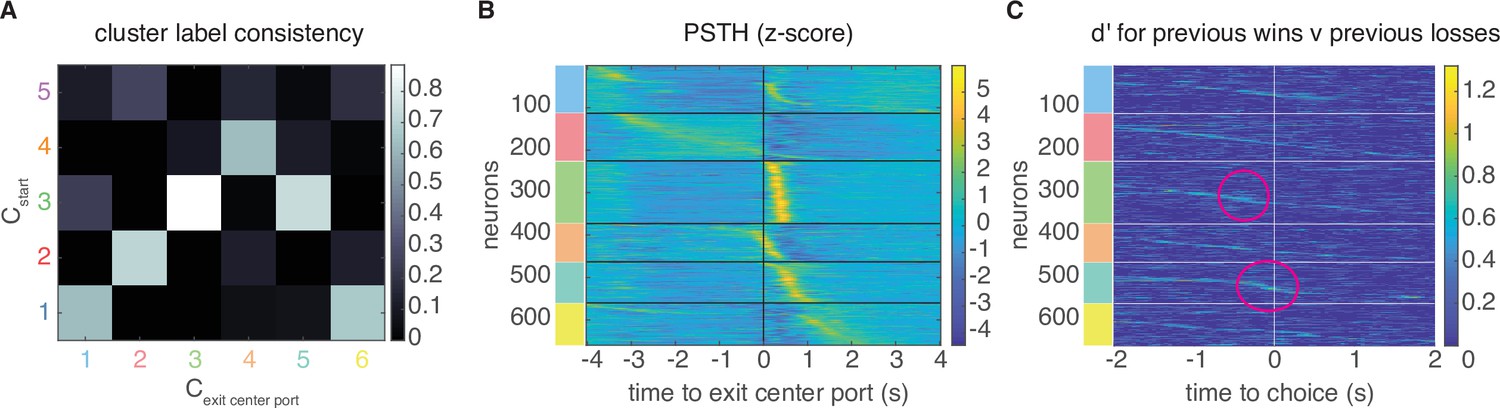
Clustering on later trial events.
Clustering on PSTHs aligned to the later trial event of exiting the center port yields consistent responses to start-aligned PSTH clustering. (A) Consistency of cluster labeling, calculated as the conditional probability of belonging in any cluster from the exit center port clustering procedure (), given that a unit belongs to a certain start-aligned PSTH cluster (). Responses in clusters 1–4 in are similar to , and cluster 5 in is also similar to cluster 3. (B) Z-scored PSTH responses within each cluster, sorted by cluster and time to peak. Response profiles are similar to the original clustering procedure (compare to Figure 1B). (C) Sensitivity, , across time and neurons for reward history has more detailed structure when clustering on PSTHS aligned to later trial events. Cluster 3 still maintains sensitivity just before choice, although additional substructure is now visible in Cluster 5 right at choice on the current trial (magenta circles). is sorted within the PSTH-based clusters by time-to-peak. Encoding of other task attributes, assessed through CPD was similar between the two clustering procedures (not shown).
Figure 6 with 2 supplements
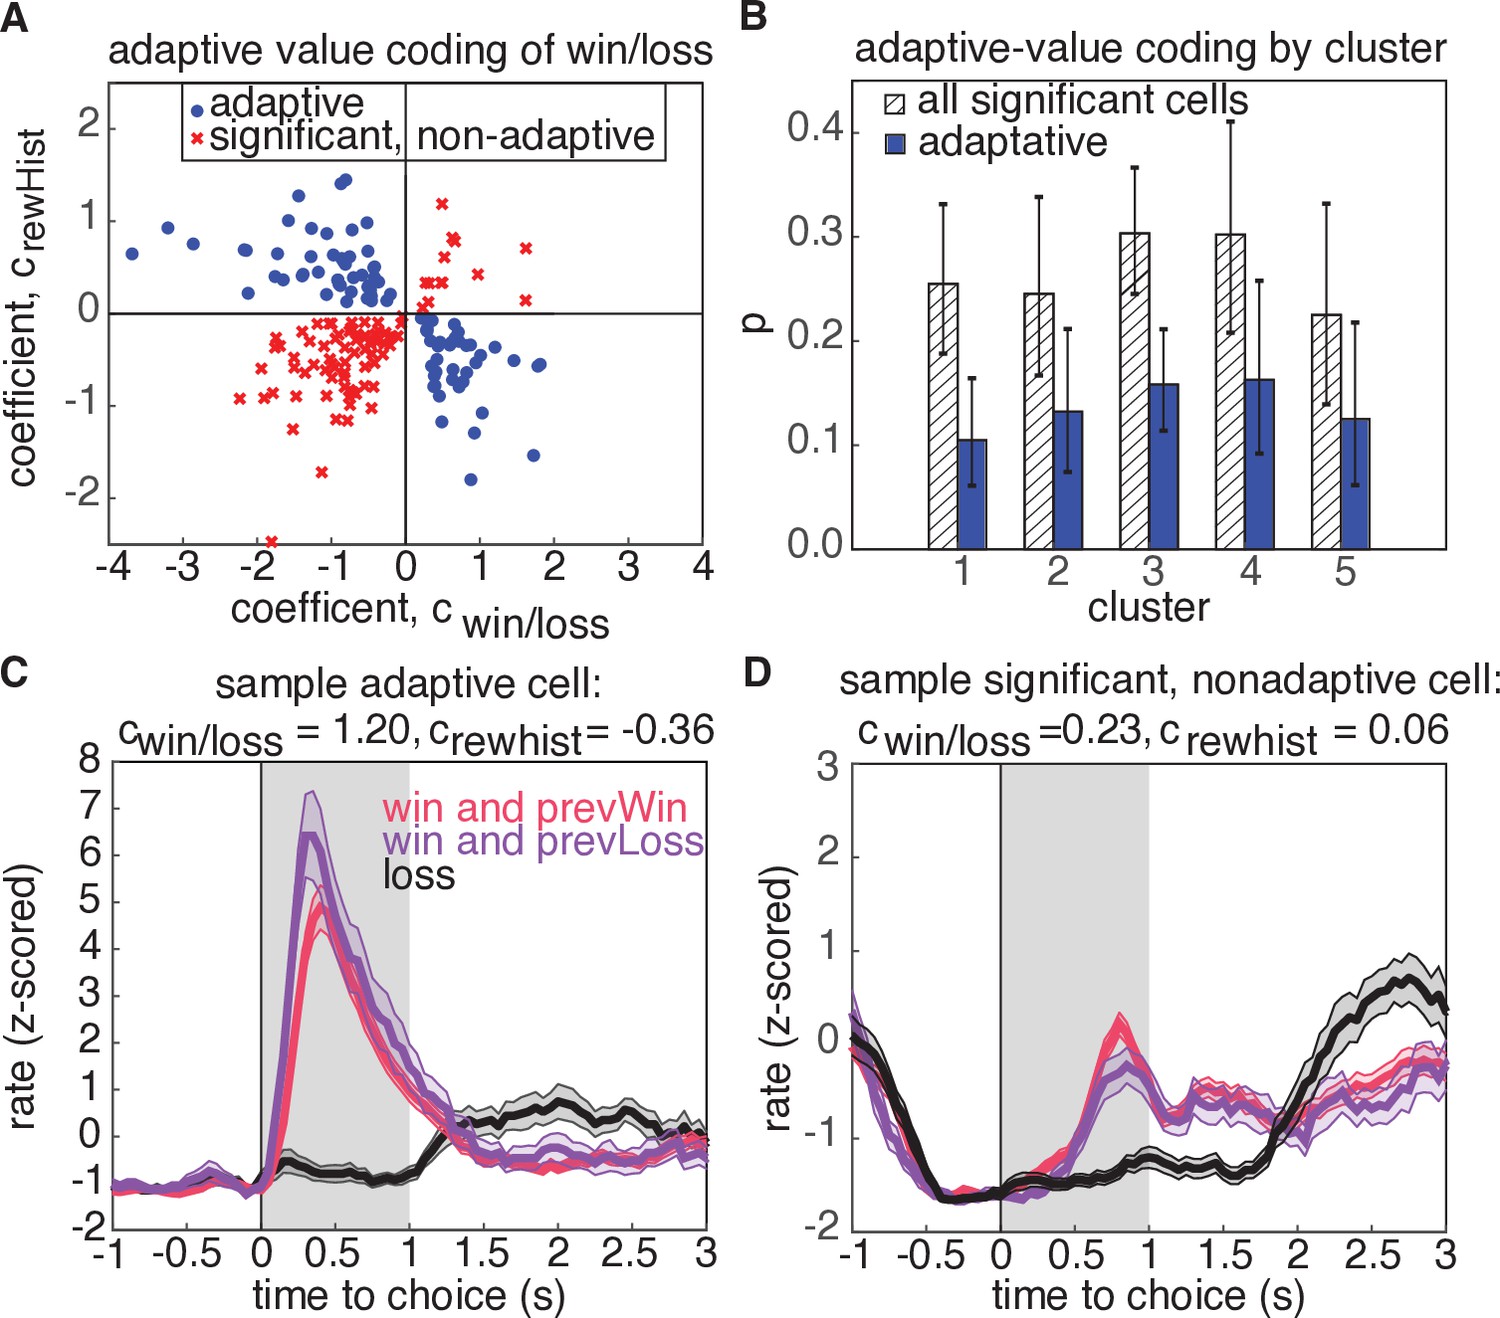
Adaptive value coding analysis using linear regression of firing rates for the 1s period following reward delivery against current and previous reward outcomes.
(A) Regression coefficients for the current reward outcome, (parameterized as win = 1, and loss=-1), and previous trial outcome, . 180 neurons had significant coefficients for both regressors (, t-test), and 81 neurons had coefficients with opposite signs, consistent with adaptive value coding (blue dots). The remaining neurons have differential responses due to reward history, but inconsistent with adaptive value coding (red crosses). (B) Probability that a model with significant regressors for both current and past reward outcome would come from a given cluster. Shaded regions denote all models from panel A, and blue bars show the probability for adaptive neurons only. Error bars are the 95% confidence interval of the mean for a binomial distribution with observed counts from each cluster. (C) Example cell demonstrating adaptive value coding. Shaded gray region denotes time window used to compute mean firing rate for the regression. (D) Sample cell demonstrating significant modulation due to reward history, but with a relationship inconsistent with adaptive value coding.
Figure 6—figure supplement 1
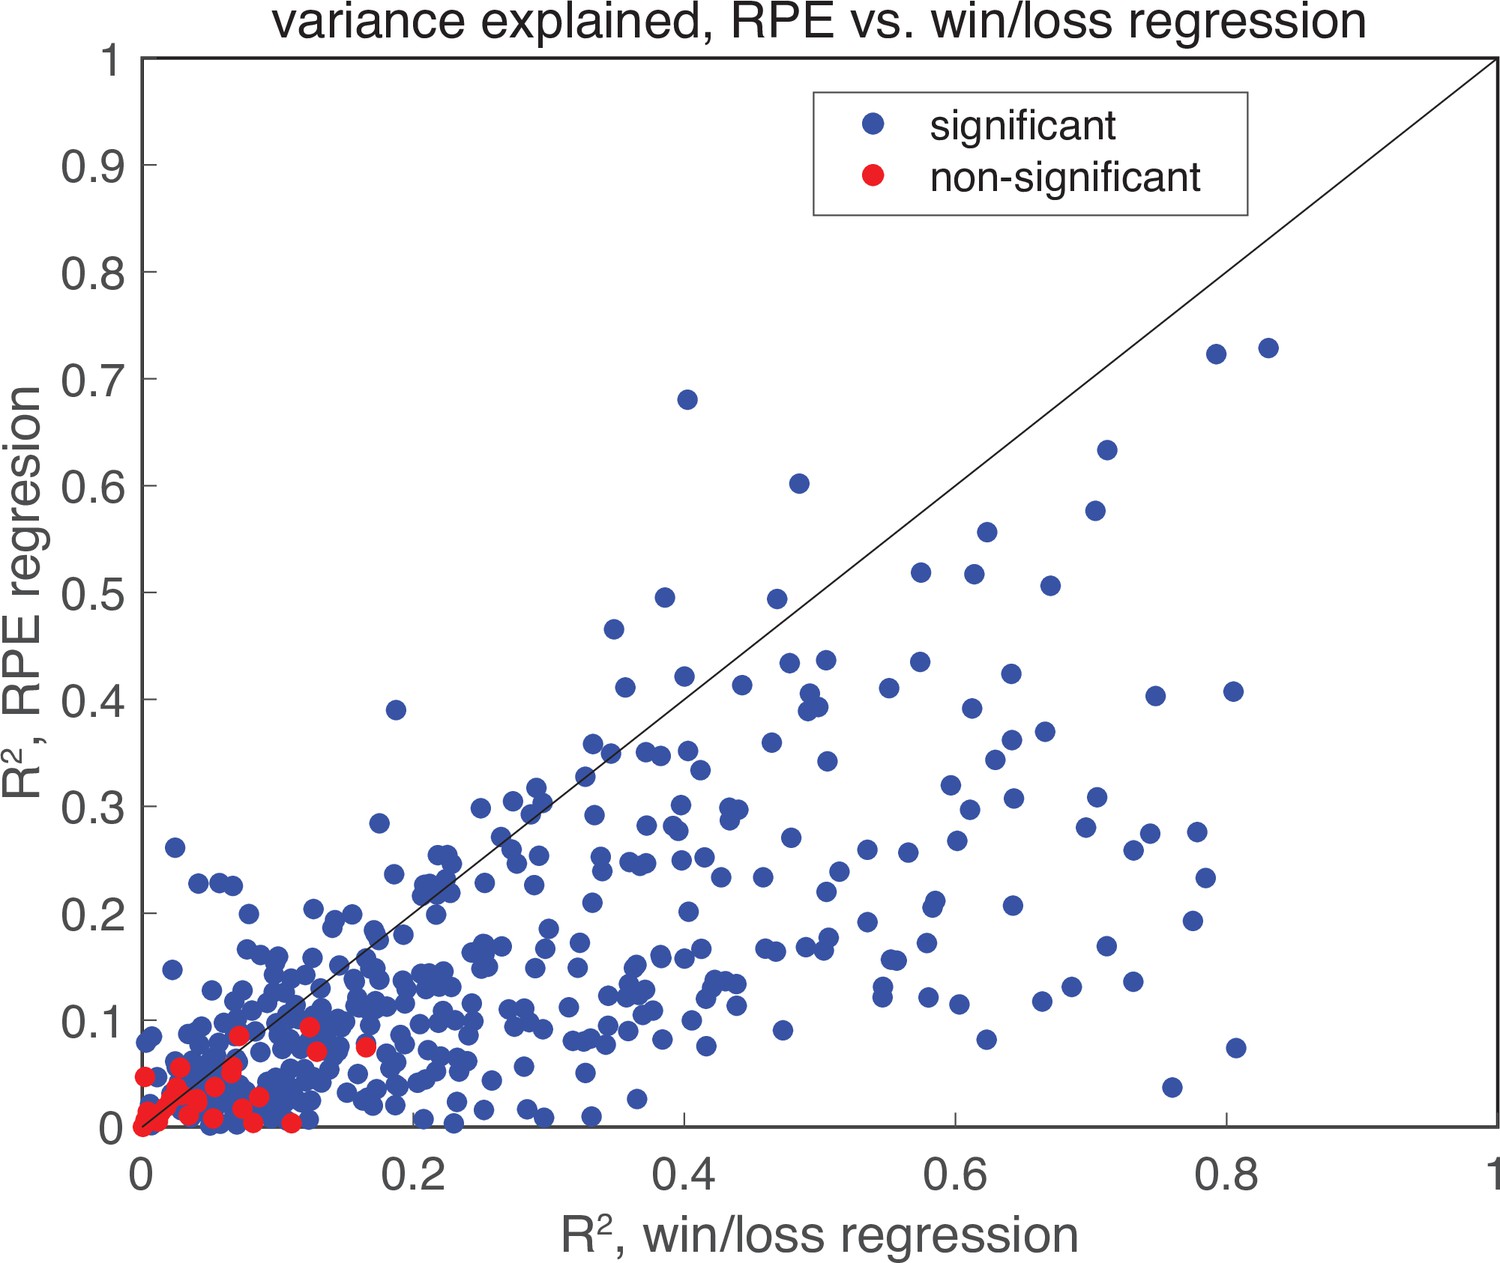
Linear regression of RPE.
Linear regression of RPE in the post-choice epoch indicates that no RPE is present. Plotted is the variance explained for each neuron for two separate models: the binary win/loss model analyzed in Figure 6, and an equivalent model that replaces the current trial win/loss and past trial win/loss regressors with an RPE regressor. Blue dots indicate models with significant linear models, while red dots indicate non-significant models (threshold , F-test). The binary win/loss model captures more variance than the RPE model, indicating that wins and losses better explain that data. Further, model comparison between the two models by held out data log-likelihood reveals that the win/loss model is a better model (median , , Wilcoxon signed rank test). The large proportion of RPE models that are significant is likely a reflection of the high correlation between RPE and win/loss regressors (.
Figure 6—figure supplement 2
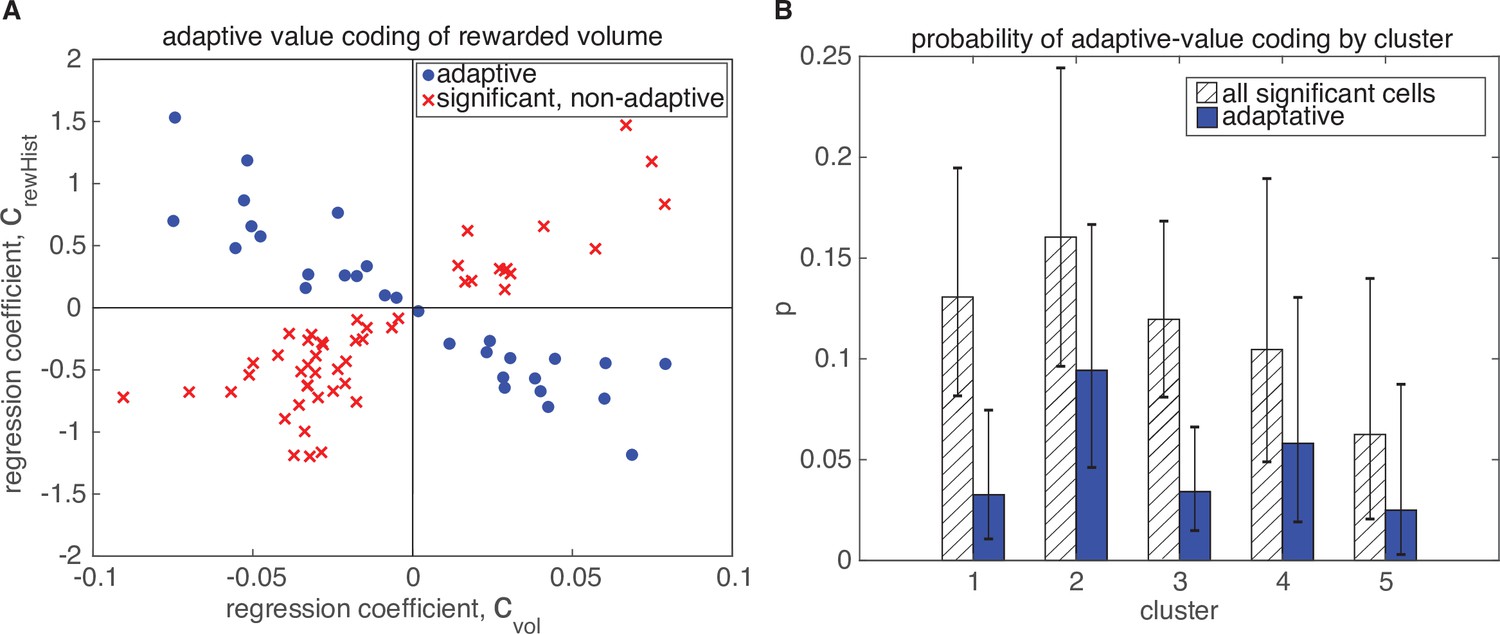
Adaptive value coding of rewarded volume.
Adaptation of rewarded volume representation is present in fewer neurons than the reward outcome representation, but is still distributed across all clusters. Figure convention is similar to Figure 6.
Figure 7
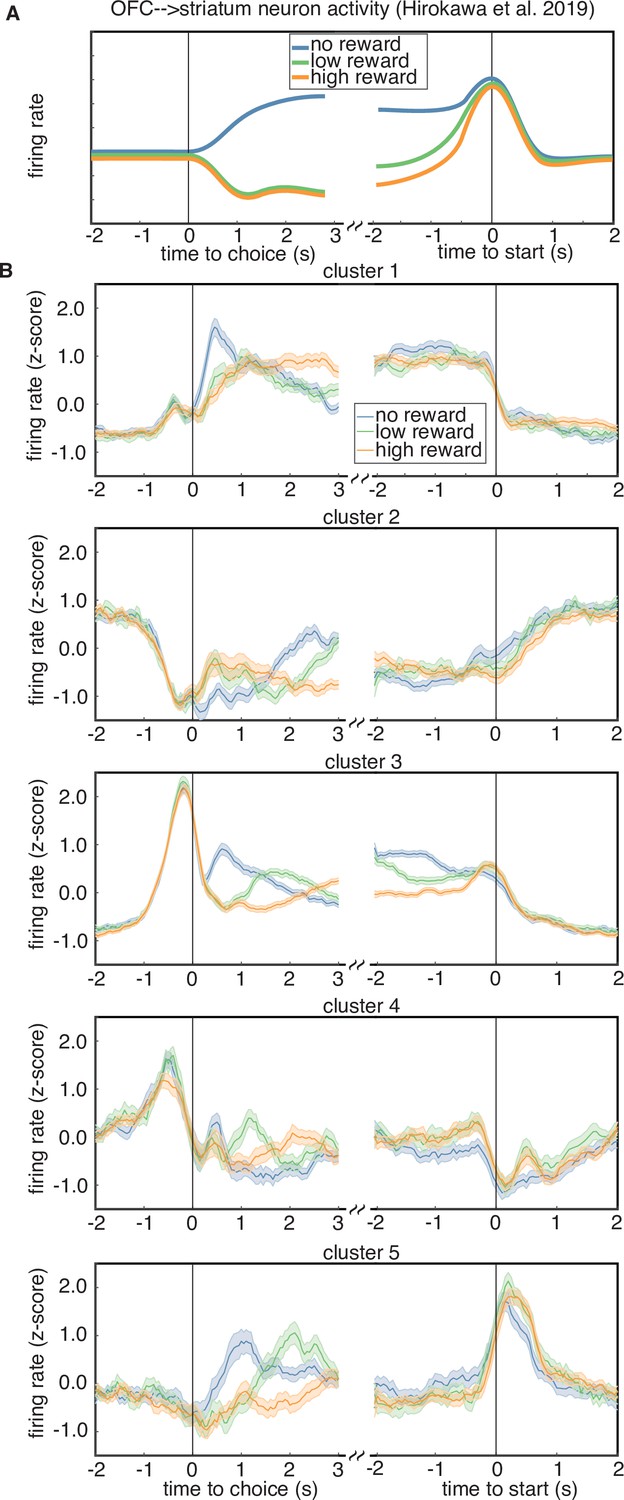
Rewarded volume encoding by cluster.
(A) Schematic of the encoding properties of a cluster of putative corticostriatal projection neurons from Hirokawa et al., 2019. Neurons from this cluster encode the outcome of a trial just after choice, as well as negative (i.e. inverted) integrated value during the intertrial interval, until the start of the next trial. (B) Cluster-averaged response to rewarded volume magnitude. Each sub-panel shows the average response to either a trial loss (blue), a low reward (6 or 12 µl, green), or a high reward (24 or 48 µl, orange).
Additional files
Download links
A two-part list of links to download the article, or parts of the article, in various formats.
Downloads (link to download the article as PDF)
Open citations (links to open the citations from this article in various online reference manager services)
Cite this article (links to download the citations from this article in formats compatible with various reference manager tools)
Subpopulations of neurons in lOFC encode previous and current rewards at time of choice
eLife 10:e70129.
https://doi.org/10.7554/eLife.70129


