Early prediction of clinical response to checkpoint inhibitor therapy in human solid tumors through mathematical modeling
- Mathematics in Medicine Program, Houston Methodist Research Institute, United States
- Department of Radiation Oncology, The University of Texas M.D. Anderson Cancer Center, United States
- Department of Imaging Physics, The University of Texas M.D. Anderson Cancer Center, United States
- Department of Nanomedicine, Houston Methodist Research Institute, United States
- Swansea University Medical School, Singleton Park, United Kingdom
- Department of Surgery, Houston Methodist Cancer Center, United States
- Department of Investigational Cancer Therapeutics, The University of Texas M.D. Anderson Cancer Center, United States
- University of Texas Health Science Center (UTHealth), McGovern Medical School, United States
- Breast Oncology Program, Dana Farber/Brigham and Women's Cancer Center, United States
- Michael E. DeBakey Department of Surgery, Baylor College of Medicine, United States
- Immunotherapy Research Center, Houston Methodist Research Institute, United States
- Cancer Center, Houston Methodist Research Institute, United States
- Rutgers Cancer Institute of New Jersey, United States
- Department of Surgery, Rutgers Robert Wood Johnson Medical School, United States
- Department of Neurology, Harvard Medical School, United States
- Division of Cancer Biology, Department of Radiation Oncology, Rutgers New Jersey Medical School, United States
- Division of Hematology/Oncology, Department of Medicine, Rutgers New Jersey Medical School, United States
Figures
Figure 1

Schematic representation of biological mechanisms included in the mathematical model.
These processes are described by four partial differential equations, which are solved to obtain Equation (1). Briefly, the checkpoint inhibitor enters the tumor via diffusion (Da) leading to time-dependent drug concentration (σ), which then binds to the conjugate receptor on immune cells at rate λ. Immune cells (ψk) are drawn into the tumor microenvironment via cytokine-mediated chemotaxis (χ), resulting in immune checkpoint inhibitor-mediated cancer cell kill at rate λp. The full mathematical model derivation and its underlying assumptions are provided in a recent modeling and analysis report (Butner et al., 2020).
Figure 2
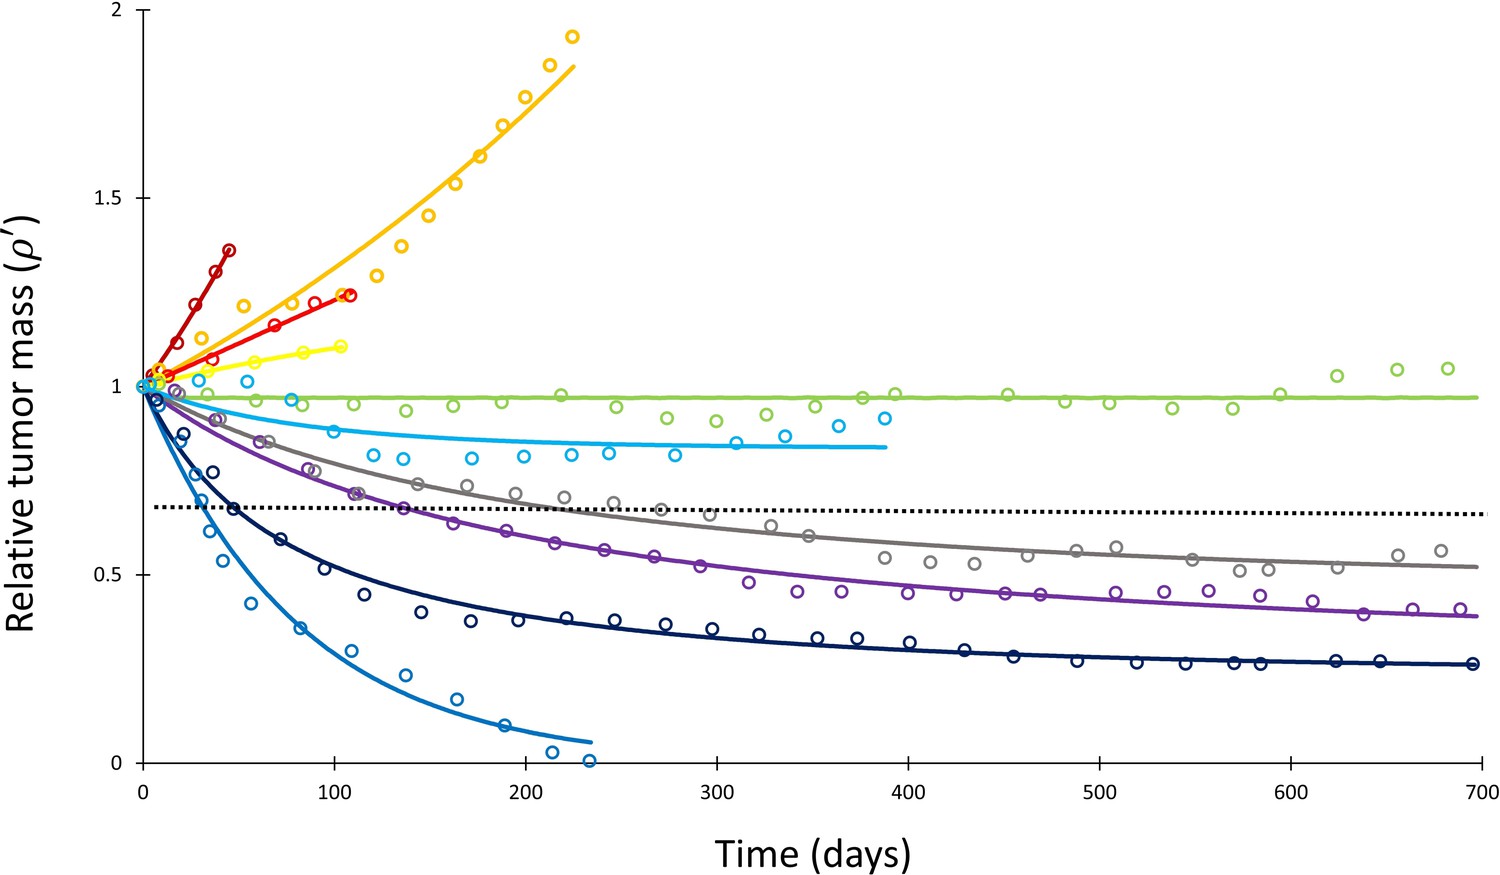
Mathematical model fit to individual responses to immune checkpoint inhibition.
Open circles represent data points of clinical response in 10 patients extracted from Topalian et al., 2012, while solid lines represent best curve fits of Equation (1) to those data (with α–1 = 144 days). Each color represents a different patient. Immunotherapy was begun at t = 0, and tumor volume was designated as the relative change in volume from t = 0 (i.e., tumor volume of 1 at t = 0). The dashed line depicts the cutoff used for classifying patients deemed as responders (partial or complete response) versus nonresponders (stable disease or disease progression) according to the RECIST v1.1 criteria.
Figure 3
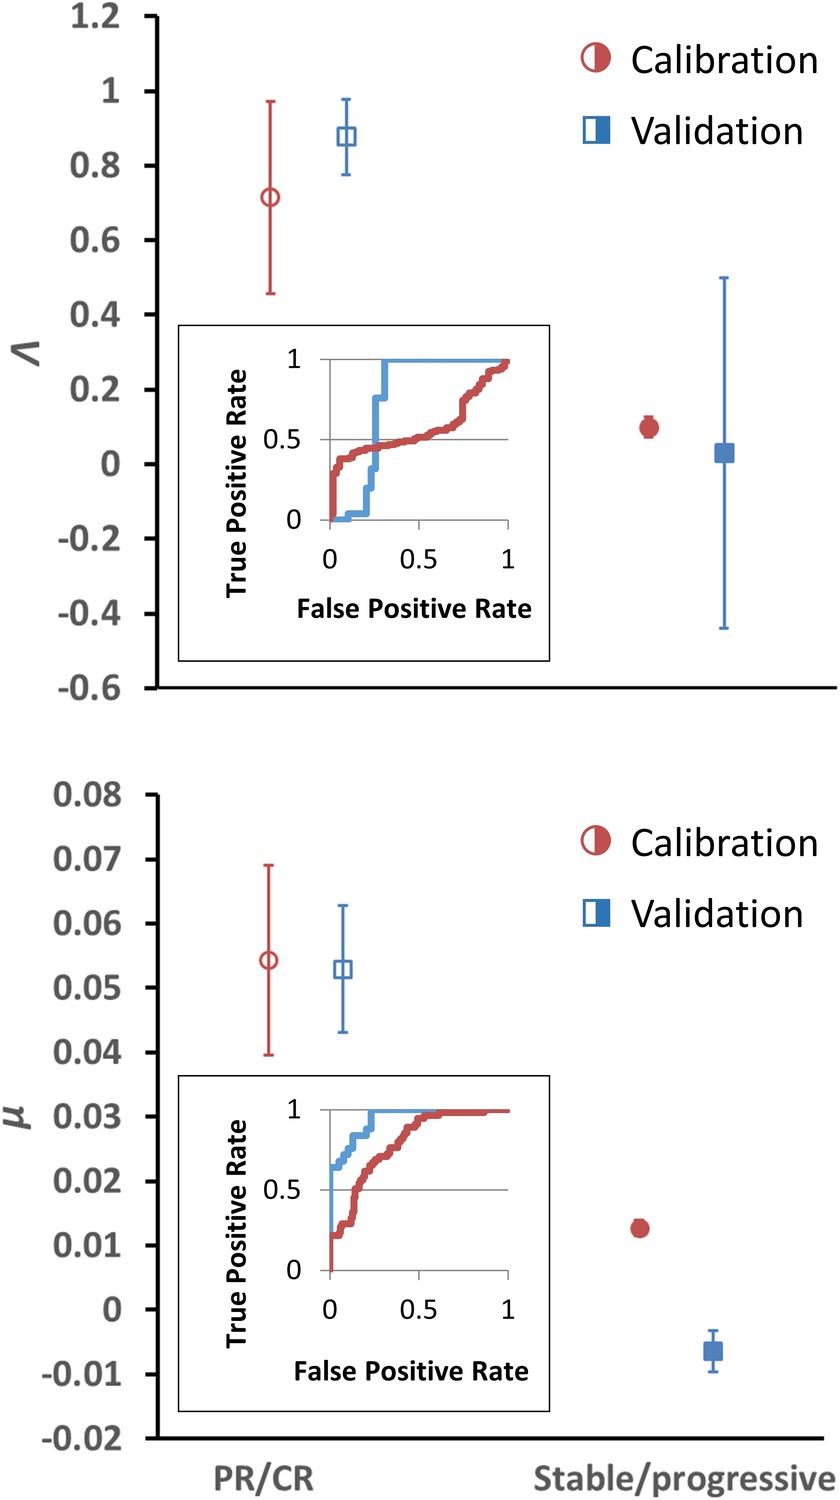
Depiction of average Λ and μ values in patients with response (n = 55) versus nonresponse (n = 134) in the calibration cohort (circular markers), while n = 25 patients had objective response and 39 patients demonstrated stable/progressive disease in the validation cohort (square markers) as determined by RECIST v1.1 criteria.
Open markers represent the average values of patients with response, and solid markers represent patients with stable/progressive disease. Error bars represent the standard error of the mean (SEM). p-Values of separation between groups by Wilcoxon rank sum (two tails): Λ, p=0.119 and p<0.001 for literature (calibration) and non-small cell lung cancer (NSCLC) (validation) cohorts, respectively; μ, p<0.001 for both literature (calibration) and NSCLC (validation) cohorts. Insets: receiver-operator characteristic (ROC) curves for patient response versus model parameters for both cohorts; Λ, literature cohort: sensitivity = 0.381, specificity = 0.945, accuracy = 545; μ, literature cohort: sensitivity = 0.891, specificity = 0.567, accuracy = 0.661; Λ, NSCLC clinical cohort: sensitivity = 0.600, specificity = 0.744, accuracy = 0.688; μ, NSCLC clinical cohort: sensitivity = 0.960, specificity = 0.769, accuracy = 0.844. PR, partial response; CR, complete response. Examples of cancer drug-specific parameter values may be found in Butner et al., 2020.
-
Figure 3—source data 1
Numerical data for Figure 3.
- https://cdn.elifesciences.org/articles/70130/elife-70130-fig3-data1-v2.xlsx
Figure 4
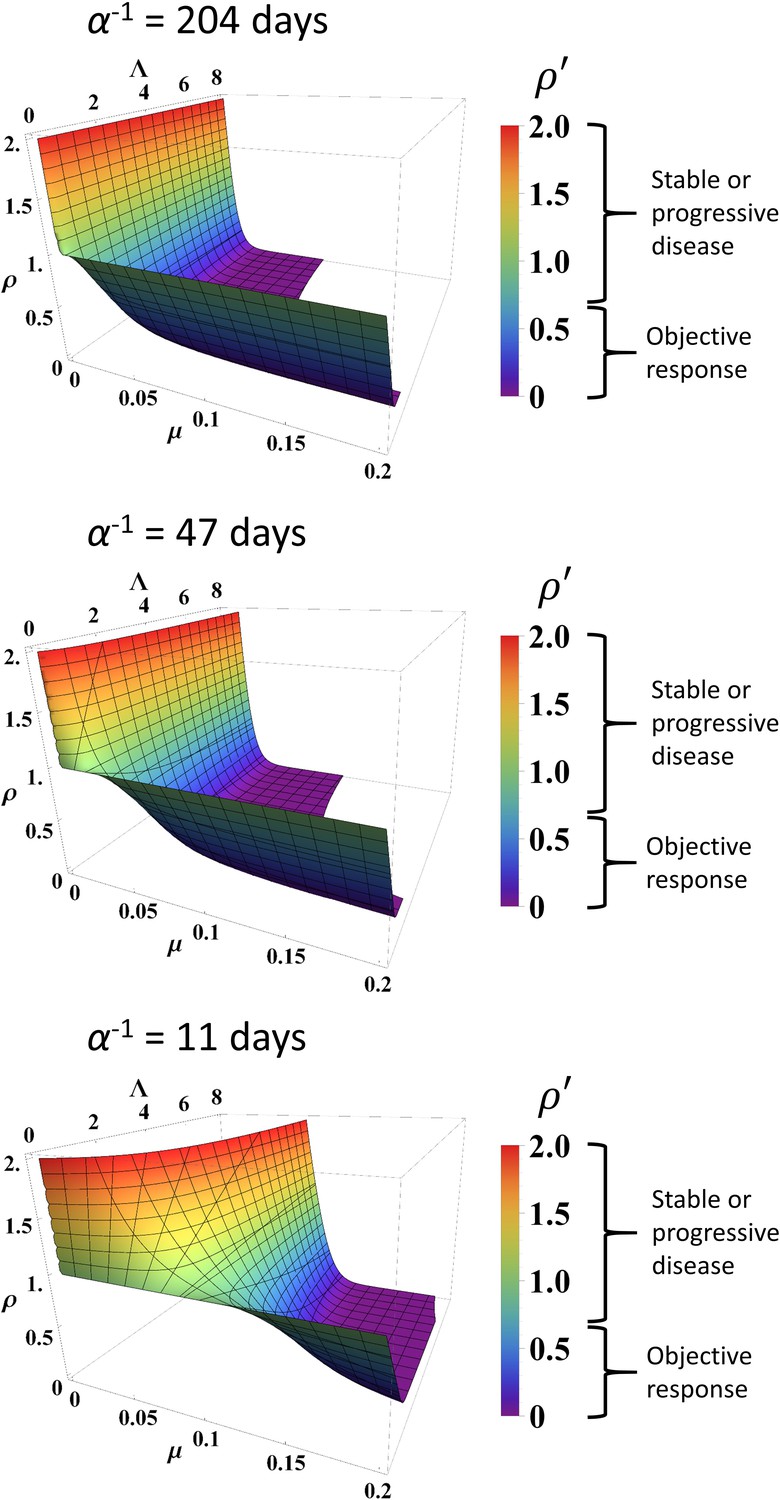
Simulated response to immune checkpoint inhibition at different values of α, Λ, and µ.
Data are obtained from Equation (1). Normalized tumor volume () was determined at t = 200 days. Three different α values were used that represent the minimum, average, and maximum values derived from fitting the calibration cohort, as described in the text. Λ and µ were varied continuously over their respective ranges. Colors also correspond with as per color map on the right. RECIST v1.1 criteria of response are listed to the right of the color bars.
Figure 5
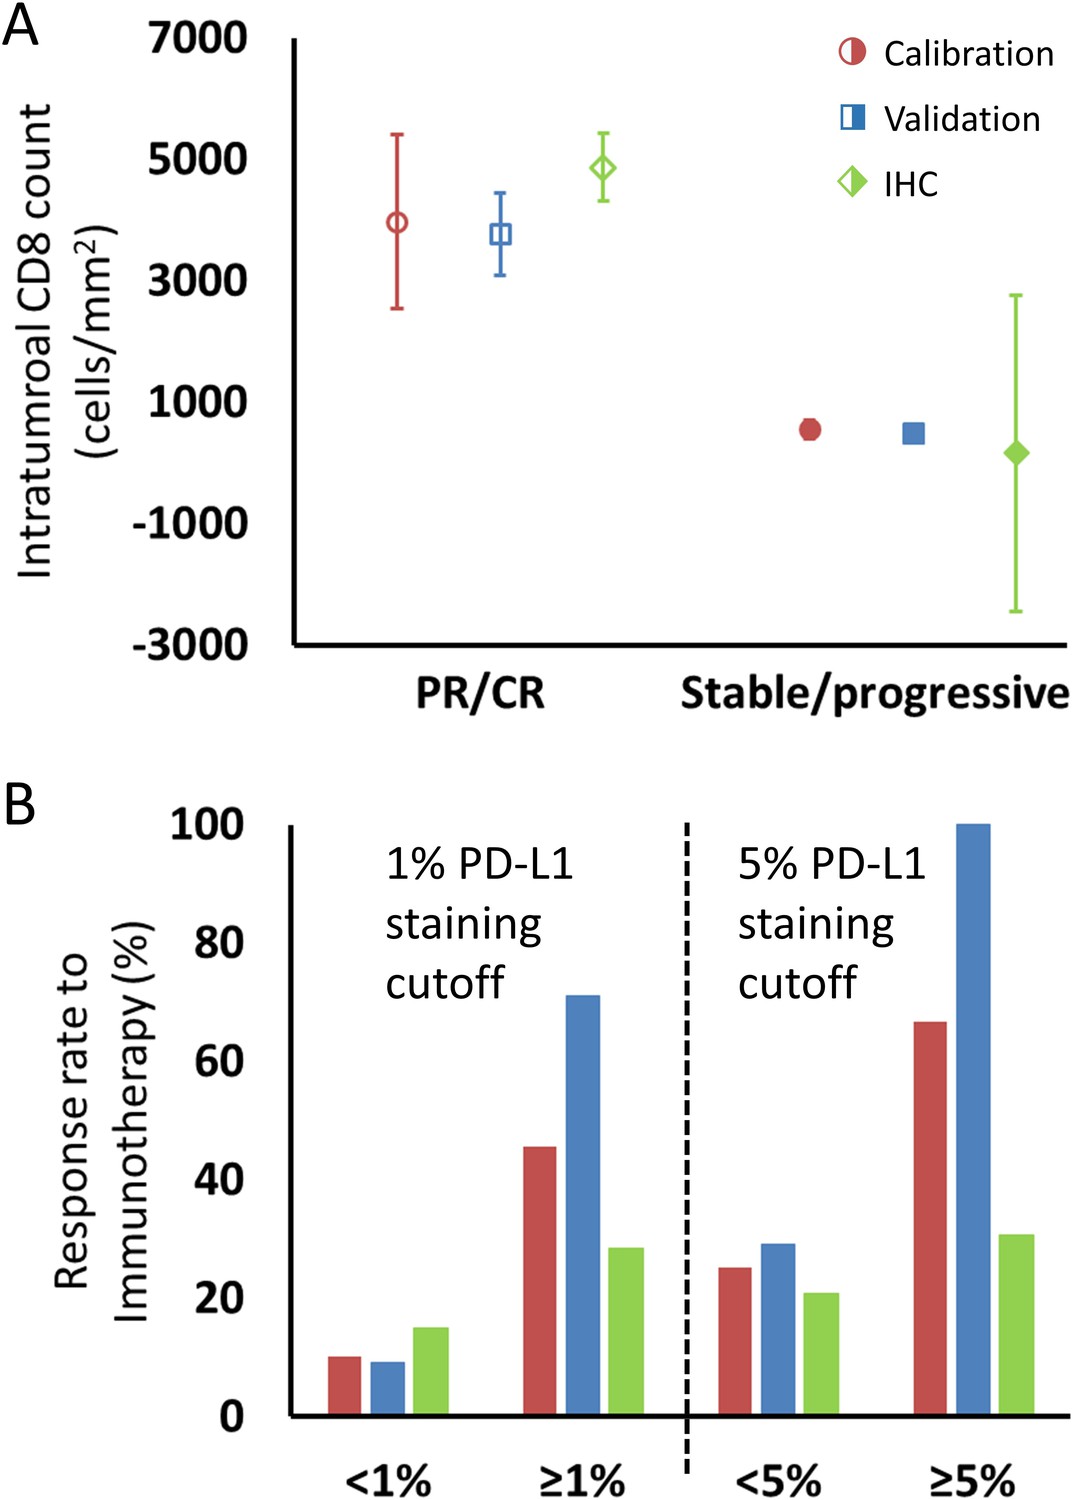
Comparison of intratumoral CD8+ T cell count and tumor PD-L1 staining derived from fitting the model to clinical data and values reported in the literature, as described in the text.
(A) Model intratumoral CD8+ T cell count (circles: calibration cohort, p=0.119 [Wilcoxon, two-tail]; squares: validation cohort, p<0.001) was derived from Λ and literature CD8 intratumoral count was taken from immunohistochemical (IHC) staining in Tumeh et al., 2014 in melanoma (diamonds; average CD8 counts including on-treatment values [n = 23]). CD8+ T cell counts from pretreatment biopsies only (n = 46) demonstrated mean values (± SEM) of 2632 ± 518 cells/mm2 in patients with response to immunotherapy and 322 ± 133 cells/mm2 in nonresponding patients, respectively. Values for CD8+ T cell counts are plotted as averages with error bars representing the standard error. (B) Patient response rates to immunotherapy stratified by PD-L1 staining were derived from µ from the model (calibration: red; validation: blue) and from references (Borghaei et al., 2015; Robert et al., 2015b; Brahmer et al., 2012; Tumeh et al., 2014; Motzer et al., 2015; Powles et al., 2014; Topalian et al., 2012; Garon et al., 2015; Herbst et al., 2014; Kefford et al., 2014; Spira et al., 2015; Taube et al., 2014; Weber et al., 2015) for the literature data (green; n = 975 for 1% cutoff, n = 1492 for 5% cutoff; see Appendix 1—table 1). Response to immune checkpoint inhibition was determined by RECIST v1.1 criteria. PR, partial response; CR, complete response.
-
Figure 5—source data 1
Numerical data for Figure 5.
- https://cdn.elifesciences.org/articles/70130/elife-70130-fig5-data1-v2.xlsx
Appendix 1—figure 1
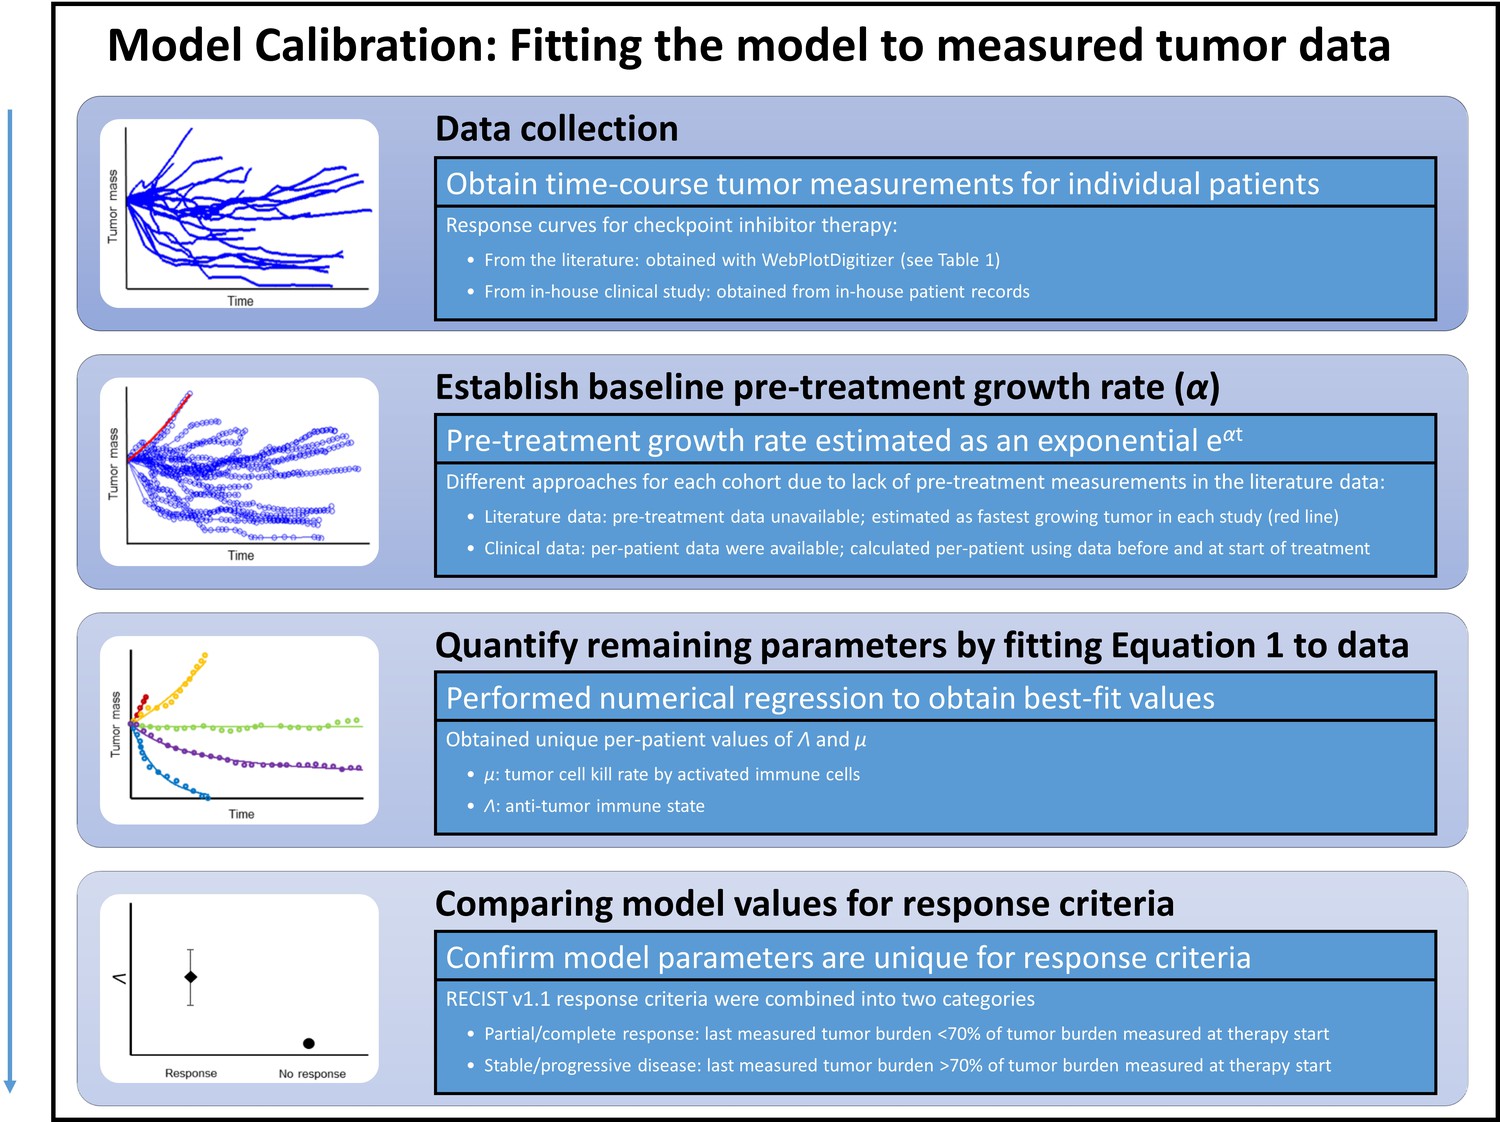
Steps for calibration of the mathematical model with clinical data.
First, checkpoint inhibitor response curves were extracted from the literature. In all cases, immunotherapy treatment began at time t = 0. Second, a tumor-specific proliferation constant (α) was determined for each cancer type by fitting exponential function ( to fastest progressing patient in each clinical trial [red line]). Third, individual patient response data were fit to Equation (1) by using the respective α to determine Λ and µ. Λ and µ values were then with compared in patients with partial/complete response versus patients with stable/progressive disease after immunotherapy by using the RECIST v1.1 criteria.
Appendix 1—figure 2
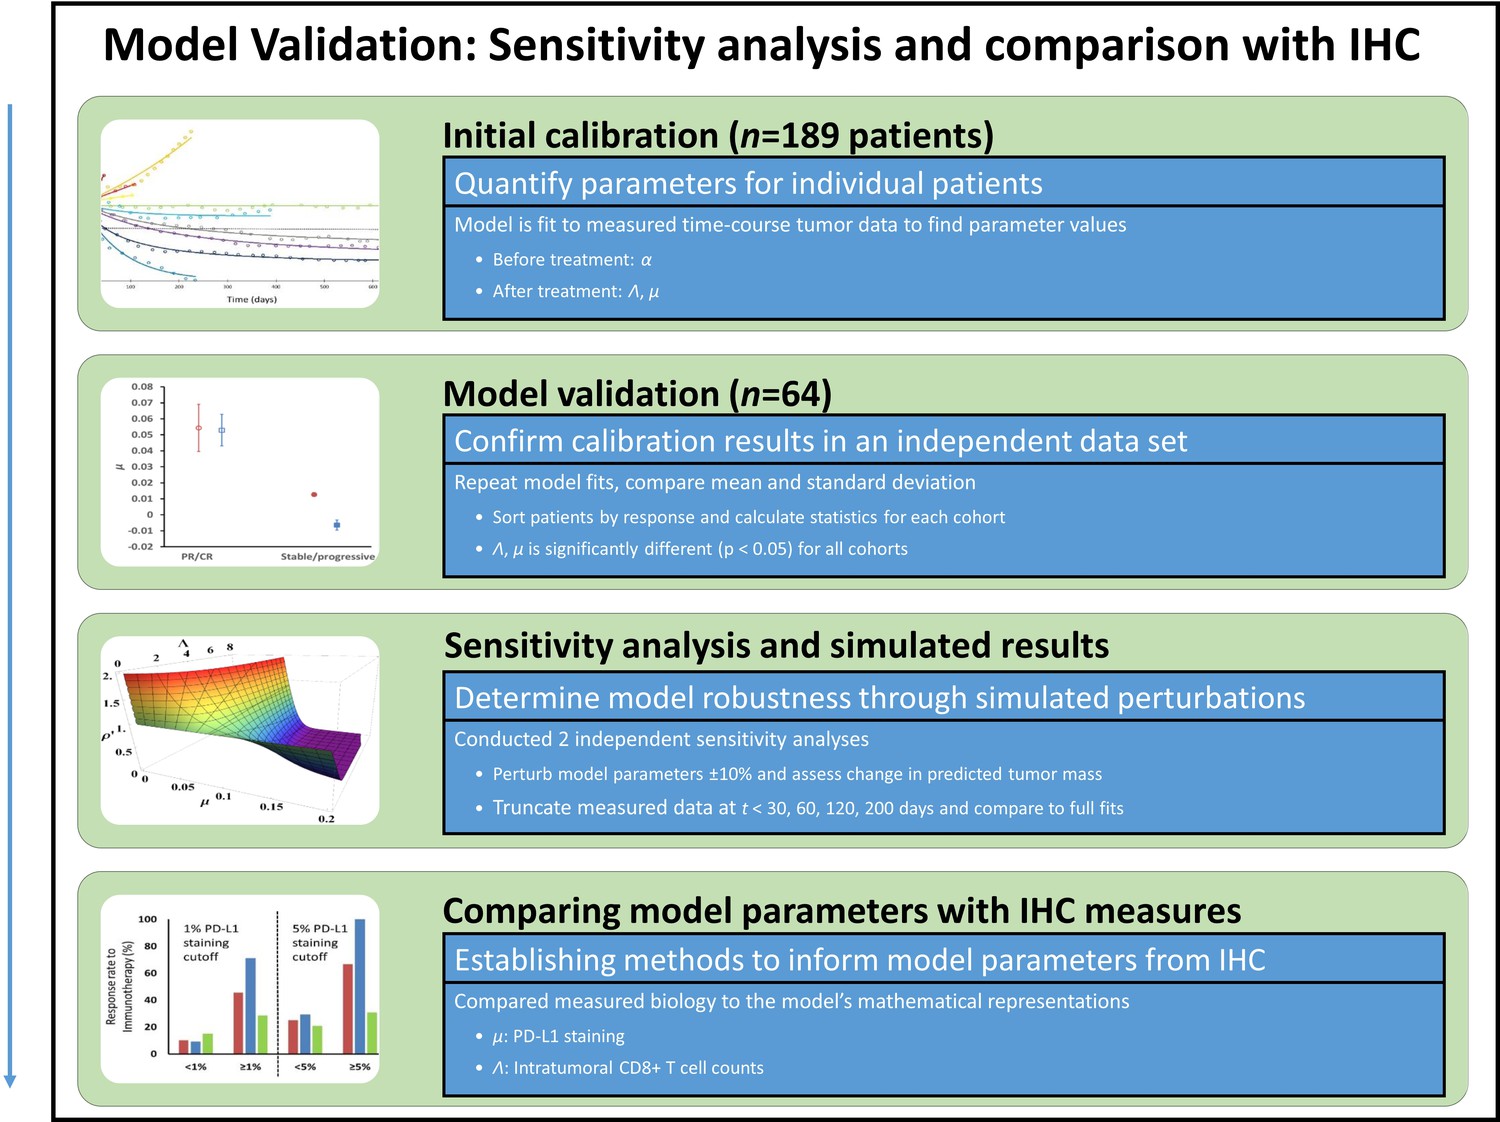
Model validation, sensitivity studies, and comparison of model parameters to immunohistochemical (IHC) measures.
Model parameters were obtained from a second in-house patient cohort of patients with non-small cell lung cancer (NSCLC) (n = 64), which were compared to values obtained in the calibration cohort in a validation study. To study the sensitivity of the model to changes in model parameter values, key parameters were perturbed ±10% and the resultant simulated expected tumor burden was compared to measured values pre-perturbation. Tumor burden measures were also truncated, and results of truncated and full dataset model fits were compared. Lastly, the full parameter space of the model was examined. In order to compare model parameters to the underlying biology, model parameters were converted to intratumoral CD8+ lymphocyte counts (for Λ) and PD-L1 staining (for μ), which were compared to IHC measures obtained from the literature.
Appendix 1—figure 3
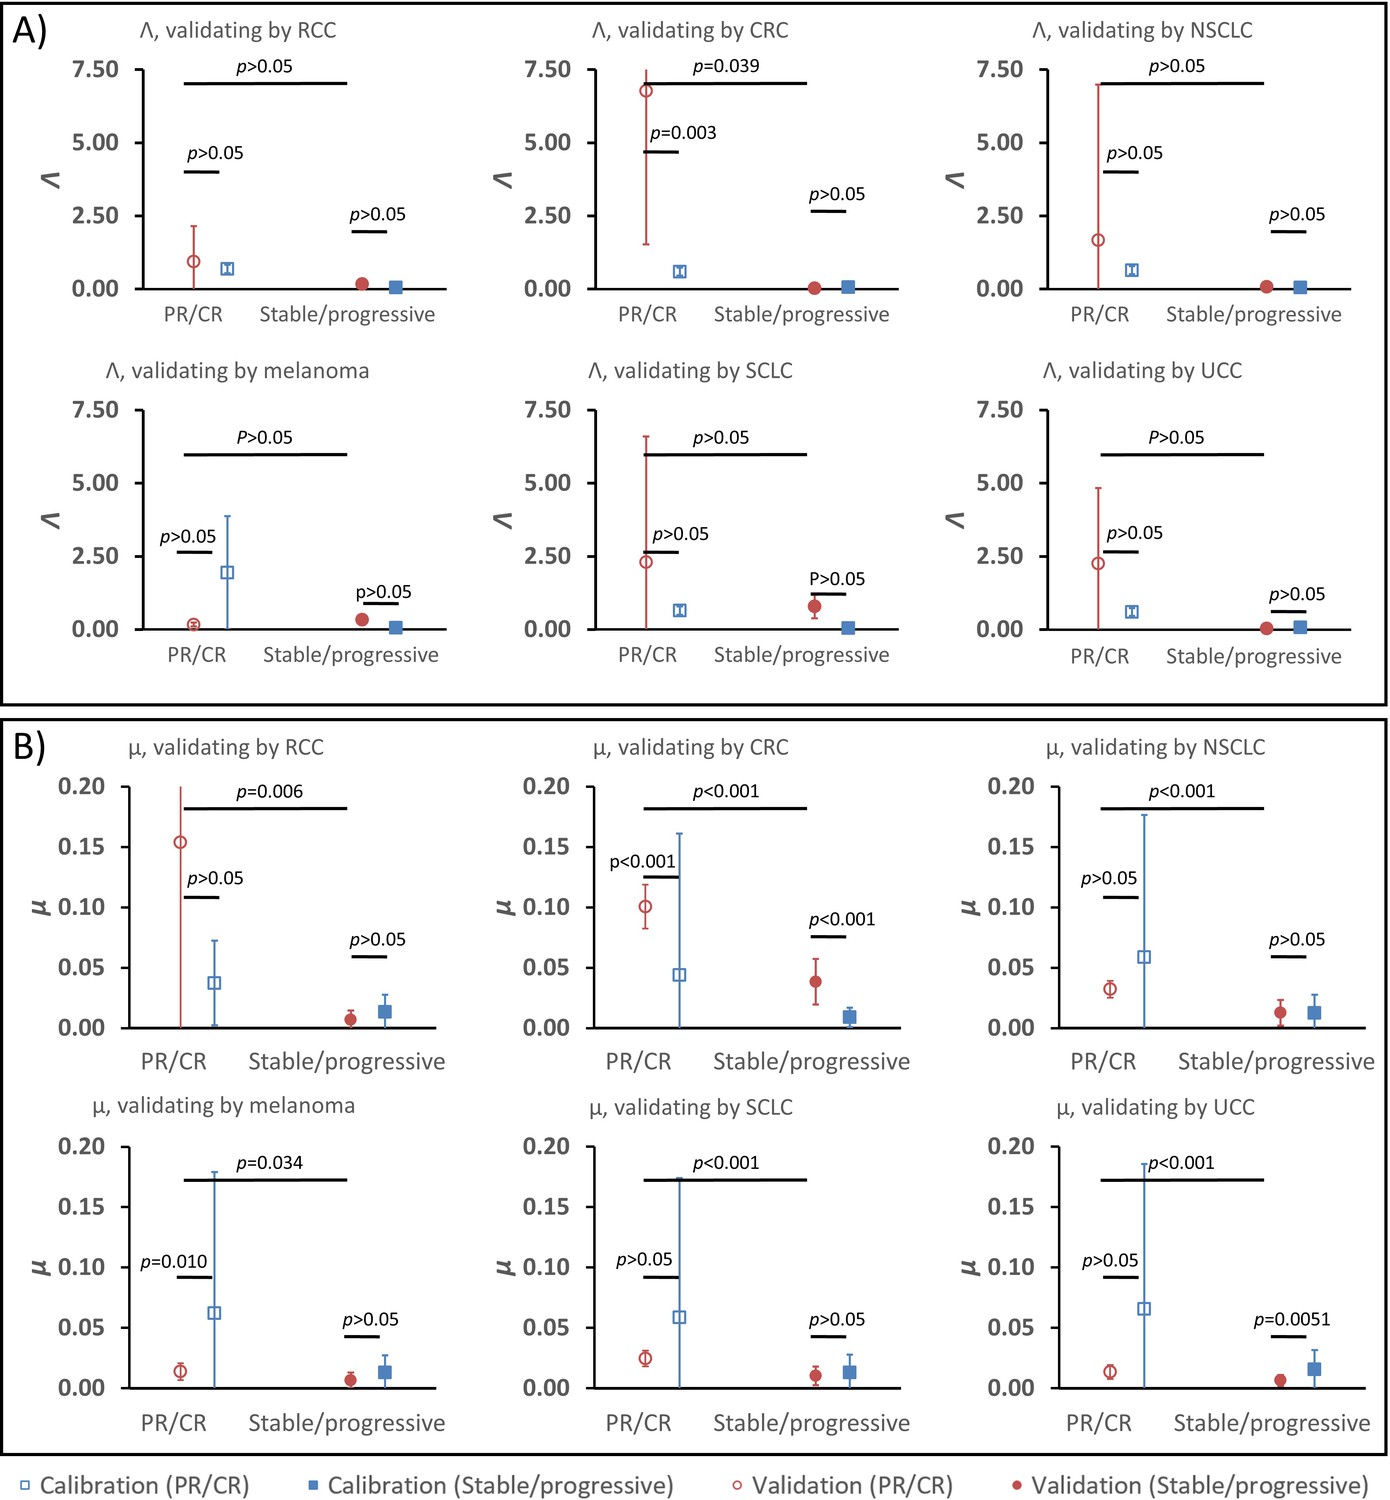
Parameter validation analysis within the calibration cohort.
In order to examine the robustness of ranges for (A) parameter Λ and (B) parameter μ between partial and complete response (PR/CR) versus stable/progressive disease among different cancer types, a validation study was performed where one cancer type was removed from the calibration cohort and used as validation against the parameter ranges in the reduced calibration set obtained from Borghaei et al., 2015; Antonia et al., 2015; Le et al., 2015; Motzer et al., 2015; Powles et al., 2014; and Topalian et al., 2012. Analysis was repeated once for each cancer type, and results are shown as mean ± standard deviation (error bars). Parameter ranges were found to vary between individual cancer types, and with μ showing more consistent significant difference between response categories relative to Λ (these results are consistent with results shown in Butner et al., 2020).
-
Appendix 1—figure 3—source data 1
Numerical data for Appendix 1—figure 3.
- https://cdn.elifesciences.org/articles/70130/elife-70130-app1-fig3-data1-v2.xlsx
Tables
Table 1
Clinical trials with checkpoint inhibitors used to fit the mathematical model and derived values of tumor proliferation constant, α.
| Reference | Tumor type histopathology | Checkpoint inhibitor monoclonal antibody | Constantα (days–1) | Calculated tumor doubling time (α–1, days) |
|---|---|---|---|---|
| Le et al., 2015 | CRC | Pembrolizumab (anti-PD1) | 0.0622 | 11 |
| Powles et al., 2014 | UCC | Atezolizumab (anti-PD-L1) | 0.016 | 43 |
| Antonia et al., 2015 | SCLC | Nivolumab (anti-PD1) | 0.014 | 50 |
| Topalian et al., 2012 | MM | Nivolumab (anti-PD1) | 0.0069 | 100 |
| Borghaei et al., 2015 | NSCLC | Nivolumab (anti-PD1) | 0.0069 | 100 |
| Motzer et al., 2015 | RCC | Nivolumab (anti-PD1) | 0.0034 | 204 |
-
CRC, colorectal carcinoma; UCC, urothelial cell carcinoma; SCLC, small cell lung cancer;MM, malignant melanoma; NSCLC, non-small lung cancer; RCC, renal cell carcinoma.
Table 2
Spearman correlation coefficients between Λ and µ derived from fitting truncated datasets versus full dataset.
t: days. Note that values of 1.000 are due to only a small number of patients (n = 4) that were imaged before t = 30 days in the validation cohort; these either did not have lesion volumes reassessed before the next reported time threshold (t = 60 days) or did not observe a change in monotonic relationships within this timeframe (t = 30–120 days).
| Calibration cohort | Validation cohort | ||||||||
|---|---|---|---|---|---|---|---|---|---|
| Λ | t < 60 | t < 120 | t < 200 | t = all days | Λ | t < 60 | t < 120 | t < 200 | t = all days |
| t < 30 | 0.476 | 0.162 | 0.080 | 0.071 | t < 30 | 1.000 | 1.000 | 0.800 | 0.800 |
| t < 60 | 0.416 | 0.309 | 0.306 | t < 60 | 0.812 | 0.658 | 0.823 | ||
| t < 120 | 0.668 | 0.599 | t < 120 | 0.676 | 0.750 | ||||
| t < 200 | 0.730 | t < 200 | 0.771 | ||||||
| µ | t < 60 | t < 120 | t < 200 | t = all days | µ | t < 60 | t < 120 | t < 200 | t = all days |
| t < 30 | 0.942 | 0.928 | 0.922 | 0.910 | t < 30 | 1.000 | 0.800 | 0.800 | 0.800 |
| t < 60 | 0.968 | 0.941 | 0.946 | t < 60 | 0.974 | 0.960 | 0.963 | ||
| t < 120 | 0.946 | 0.922 | t < 120 | 0.971 | 0.961 | ||||
| t < 200 | 0.921 | t < 200 | 0.989 | ||||||
Appendix 1—table 1
Studies used for derivation of pathological markers of immunotherapy response.
| Reference (see main text) | Tumor type | Checkpoint inhibitor | Pathological biomarker | PD-L1 staining cutoff |
|---|---|---|---|---|
| Tumeh et al., 2014 | Melanoma | Pembrolizumab | CD8+ TILs | N/A |
| Kefford et al., 2014 | Melanoma | Pembrolizumab | PD-L1 | 1% |
| Powles et al., 2014 | UCC | Atezolizumab | PD-L1 | 1%, 5%, 10% |
| Herbst et al., 2014 | NSCLC, RCC, melanoma, HNSCC, CRC, gastric and pancreatic cancer | Atezolizumab | PD-L1 | 1%, 5%, 10% |
| Robert et al., 2015b | Melanoma | Nivolumab | PD-L1 | 5% |
| Motzer et al., 2015 | RCC | Nivolumab | PD-L1 | 5% |
| Taube et al., 2014 | NSCLC, RCC, melanoma, PC, CRC | Nivolumab | PD-L1 | 5% |
| Spira et al., 2015 | NSCLC | Atezolizumab | PD-L1 | 1%, 5%, 10% |
| Brahmer et al., 2012 | NSCLC | Nivolumab | PD-L1 | 1%, 5%, 10% |
| Borghaei et al., 2015 | NSCLC | Nivolumab | PD-L1 | 1%, 5%, 10% |
| Weber et al., 2015 | Melanoma | Nivolumab | PD-L1 | 5% |
| Topalian et al., 2012 | Melanoma, RCC, NSCLC, CRC, PC | Nivolumab | PD-L1 | 5% |
| Garon et al., 2015 | NSCLC | Pembrolizumab | PD-L1 | 1%, 50% |
-
RCC: renal cell; UCC: urothelial cell carcinoma; CRC: colorectal carcinoma; NSCLC: non-small lung carcinoma; HNSCC: head and neck squamous cell carcinoma; PC: prostate carcinoma; TIL: tumor-infiltrating lymphocytes
Additional files
-
Transparent reporting form
- https://cdn.elifesciences.org/articles/70130/elife-70130-transrepform1-v2.pdf
-
Appendix 1—figure 3—source data 1
Numerical data for Appendix 1—figure 3.
- https://cdn.elifesciences.org/articles/70130/elife-70130-app1-fig3-data1-v2.xlsx
Download links
A two-part list of links to download the article, or parts of the article, in various formats.
Downloads (link to download the article as PDF)
Open citations (links to open the citations from this article in various online reference manager services)
Cite this article (links to download the citations from this article in formats compatible with various reference manager tools)
Early prediction of clinical response to checkpoint inhibitor therapy in human solid tumors through mathematical modeling
eLife 10:e70130.
https://doi.org/10.7554/eLife.70130


