A zebrafish embryo screen utilizing gastrulation identifies the HTR2C inhibitor pizotifen as a suppressor of EMT-mediated metastasis
- Department of Biological Science, National University of Singapore, Singapore
- Cancer Science Institute of Singapore, National University of Singapore, Singapore
- Tsuruoka Metabolomics Laboratory, National Cancer Center, Japan
- Shonai Regional Industry Promotion Center, Japan
- Institute of Bioengineering and Nanotechnology, Singapore
- Division of Translational Research, Exploratory Oncology Research and Clinical Trial Center, National Cancer Center, Japan
Figures
Figure 1 with 2 supplements

A chemical screen for identification of epiboly-interrupting drugs.
(A) Cumulative results of the chemical screen in which each drug was used at either 10 µM (left) or 50 µM (right) concentrations. 1280 FDA, EMA, or other agencies-approved drugs were subjected to this screening. Positive ‘hit’ drugs were those that interrupted epiboly progression. (B) Representative samples of the embryos that were treated with indicated drugs.
Figure 1—figure supplement 1
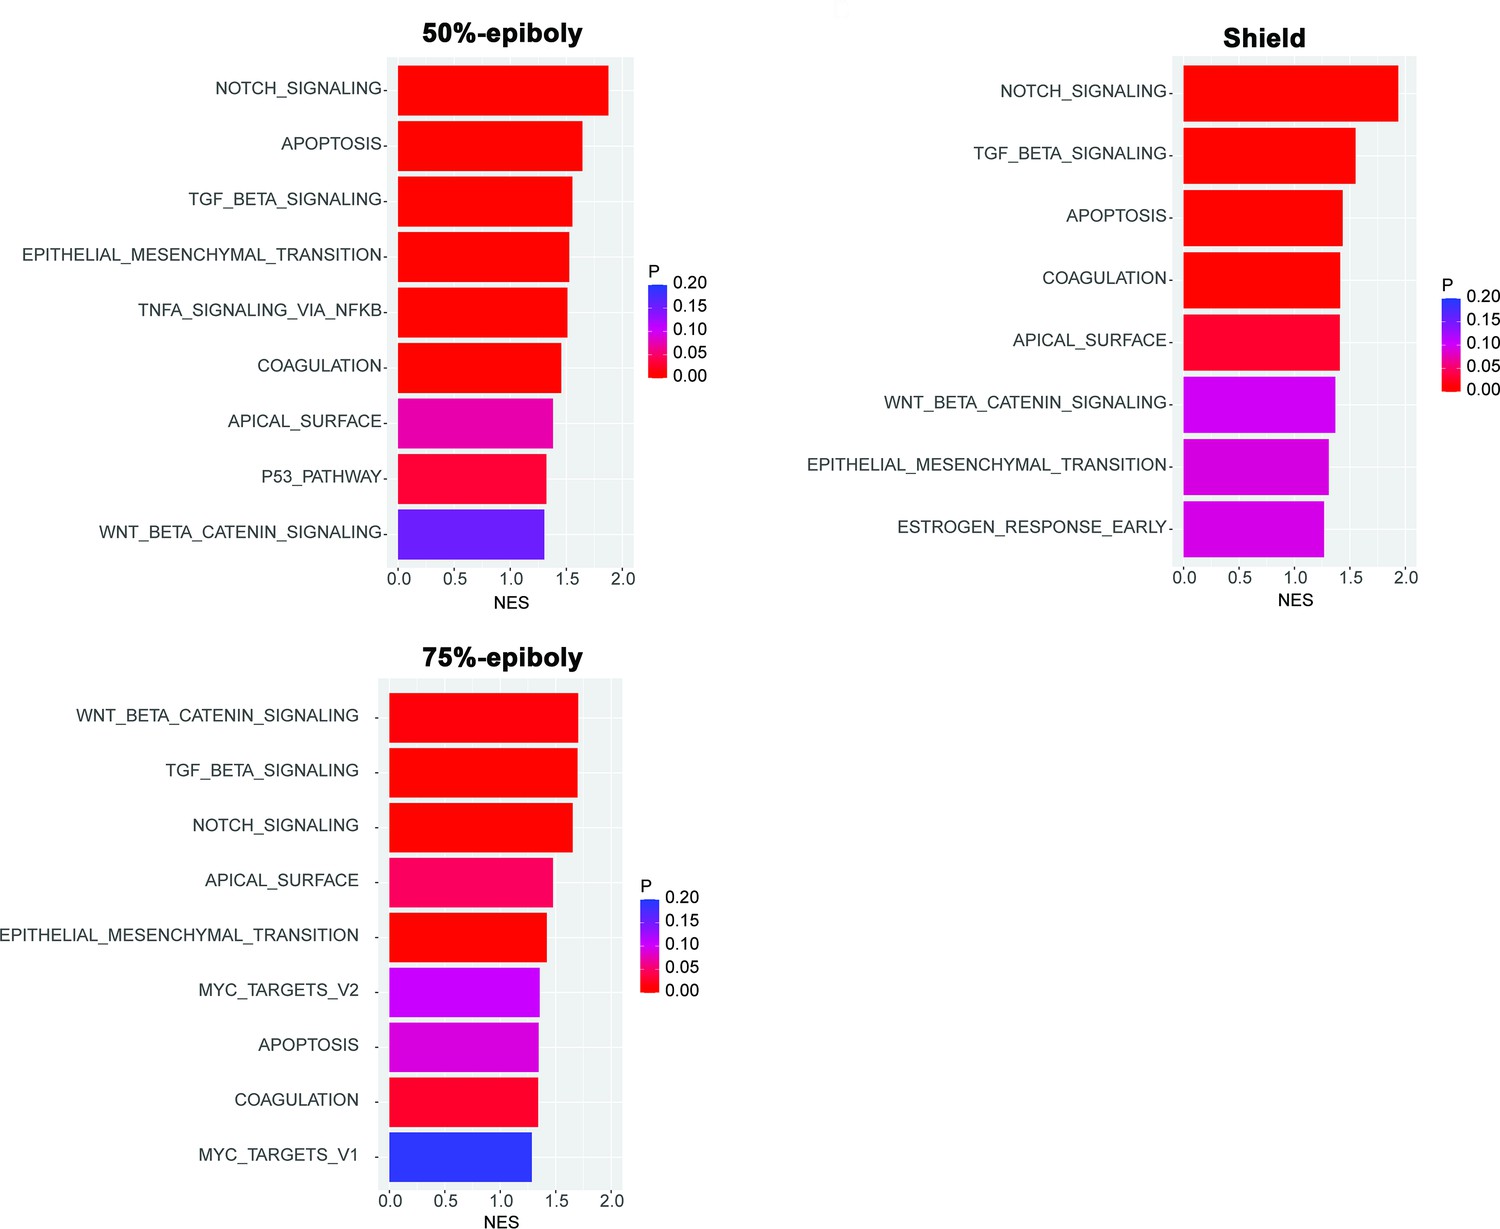
Gene expression profiles obtained from zebrafish embryos at either 50%-epiboly (top left), shield (top right), or 75%-epiboly stage (bottom left) were analyzed based on the hallmark gene sets derived from the Molecular Signatures Database (MSigDB) (Liberzon et al., 2015).
The zebrafish transcriptomic data was sourced from White et al., 2017 eLife (Subramanian et al., 2005). Gene sets that were significantly enriched (FDR < 0.25) were presented with the normalized enrichment score (NES) and nominal p value. Source data files for analysis of either gene expression and enriched pathways are uploaded as gene set enrichment analysis (GSEA) Source data 1 and 2, respectively.
Figure 1—figure supplement 2
Epiboly could serve as a marker for this screening.
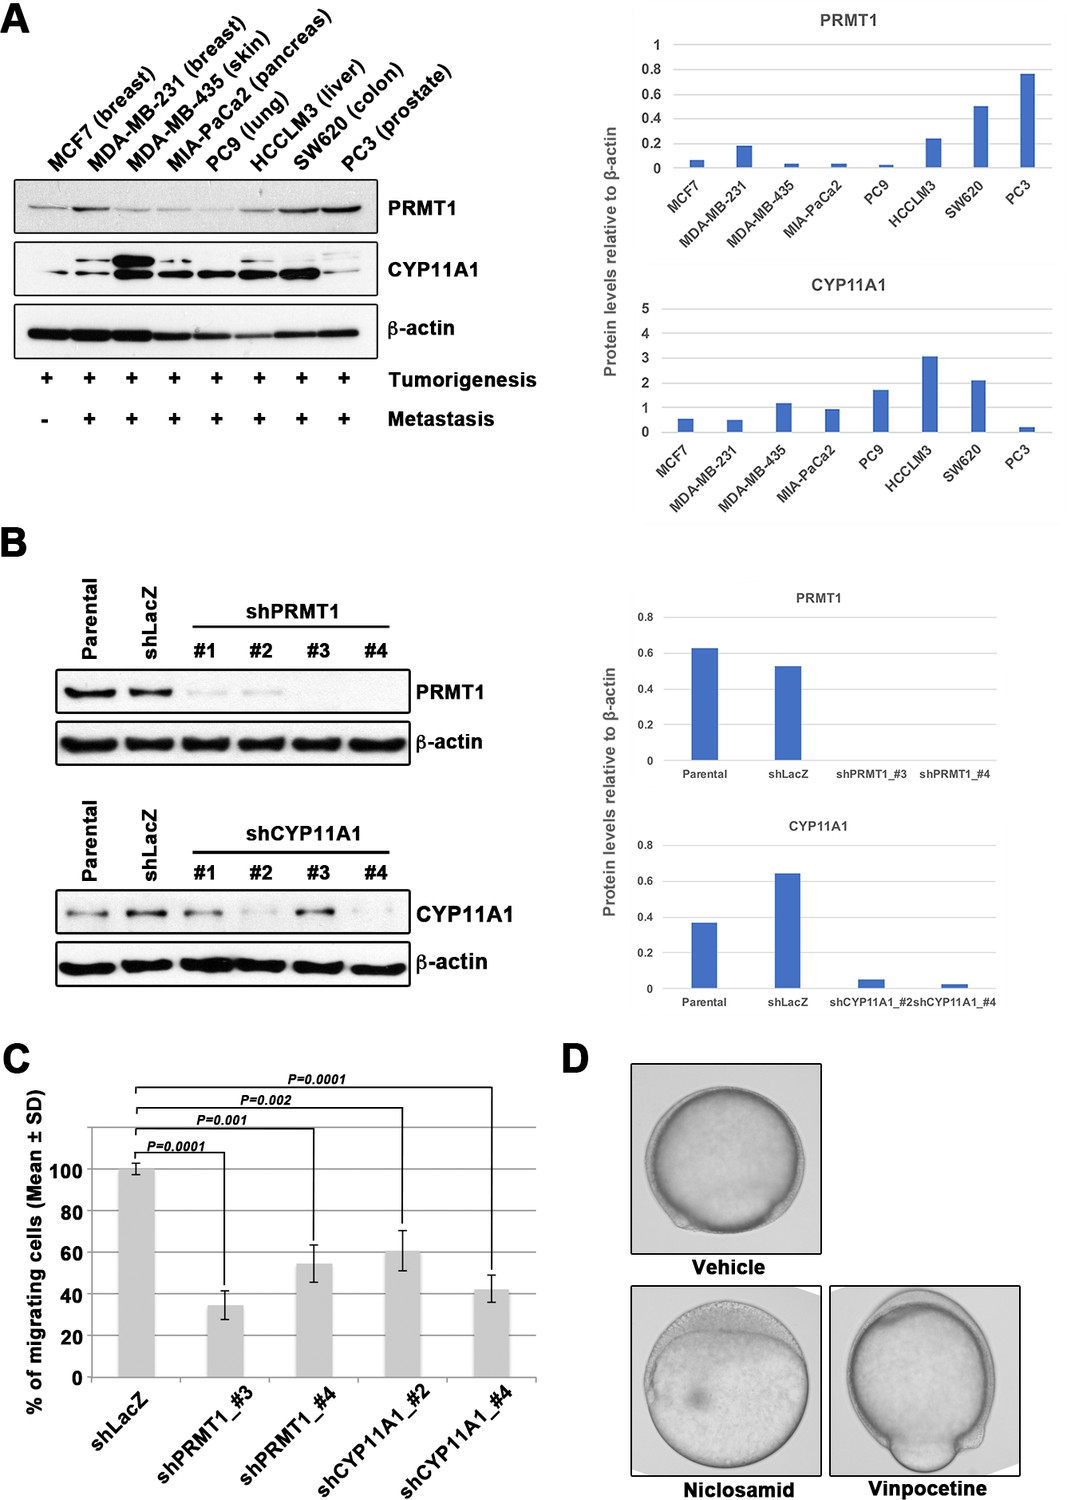
(A) Western blot analysis of protein arginine methyltransferase 1 (PRMT1) (upper left) and cytochrome P450 family 11 (CYP11A1) (middle left) protein levels in non-metastatic human cancer cell line (MCF7) and highly metastatic human cancer cell lines (MDA-MB-231, MDA-MB-435, MIA-PaCa2, PC9, HCCLM3, PC3, and SW620); β-actin loading control is shown (bottom left). Preliminary experiments confirmed that epiboly could serve as a marker for this screening assay. Quantification analyses of western blotting bands. The analyses were performed by ImageJ. Signal strength of bands of PRMT1 (Top right) and CYP11A1 (bottom right) was normalized by that of β-actin. (B) Knockdown of PRMT1 or CYP11A1 in MDA-MB-231 cells. MBA-MB-231 cells were transfected with a control short hairpin RNA (shRNA) targeting LacZ, and one of four independent shRNAs targeting PRMT1 (clones #1 to #4), or one of two independent shRNAs targeting CYP11A1 (clones #1 to #4). Reduced PRMT1 and CYP11A1 expression, determined by western blot, in sub-cell lines of MDA-MB-231 cells expressing PRMT1 shRNA (clones #3 and #4) or CYP11A1 (clones #2 and #4), compared with controls (parental cell line MDA-MB-231 and control shRNA cells); β-actin levels shown as a loading control. Quantification analyses of western blotting bands. The analyses were performed by ImageJ. Signal strength of bands of PRMT1 (top right) and CYP11A1 (bottom right) was normalized by that of β-actin. (C) Effect of shRNAs targeting either PRMT1 or CYP11A1 on cell motility and invasion of MBA-MB-231 cells. Parental MDA-MB-231 cells and four sub-cell lines of MDA-MB-231 cells that were transfected with either shRNA targeting either LacZ, two independent shRNAs targeting PRMT1 (clones #3 and #4) or two independent shRNAs targeting CYP11A1 (clones #2 and #4) were subjected to Boyden chamber assays. (D) Zebrafish embryos treated with either vehicle (DMSO), 10 μM niclosamide, or 50 µM vinpocetine. Approximately 20 embryos were treated with either DMSO as a vehicle control, niclosamide, or vinpocetine. The treatment was started at 4 hours post fertilization (hpf) when all of embryos reached sphere stage and ended at 9 hpf when control embryos reached 80–90% epiboly stage. Each experiment was performed at least twice. Statistical analysis was determined by Student’s t test.
Figure 2 with 2 supplements
Pizotifen, one of epiboly-interrupting drugs, suppressed metastatic dissemination of human cancer cells lines in vivo and vitro.
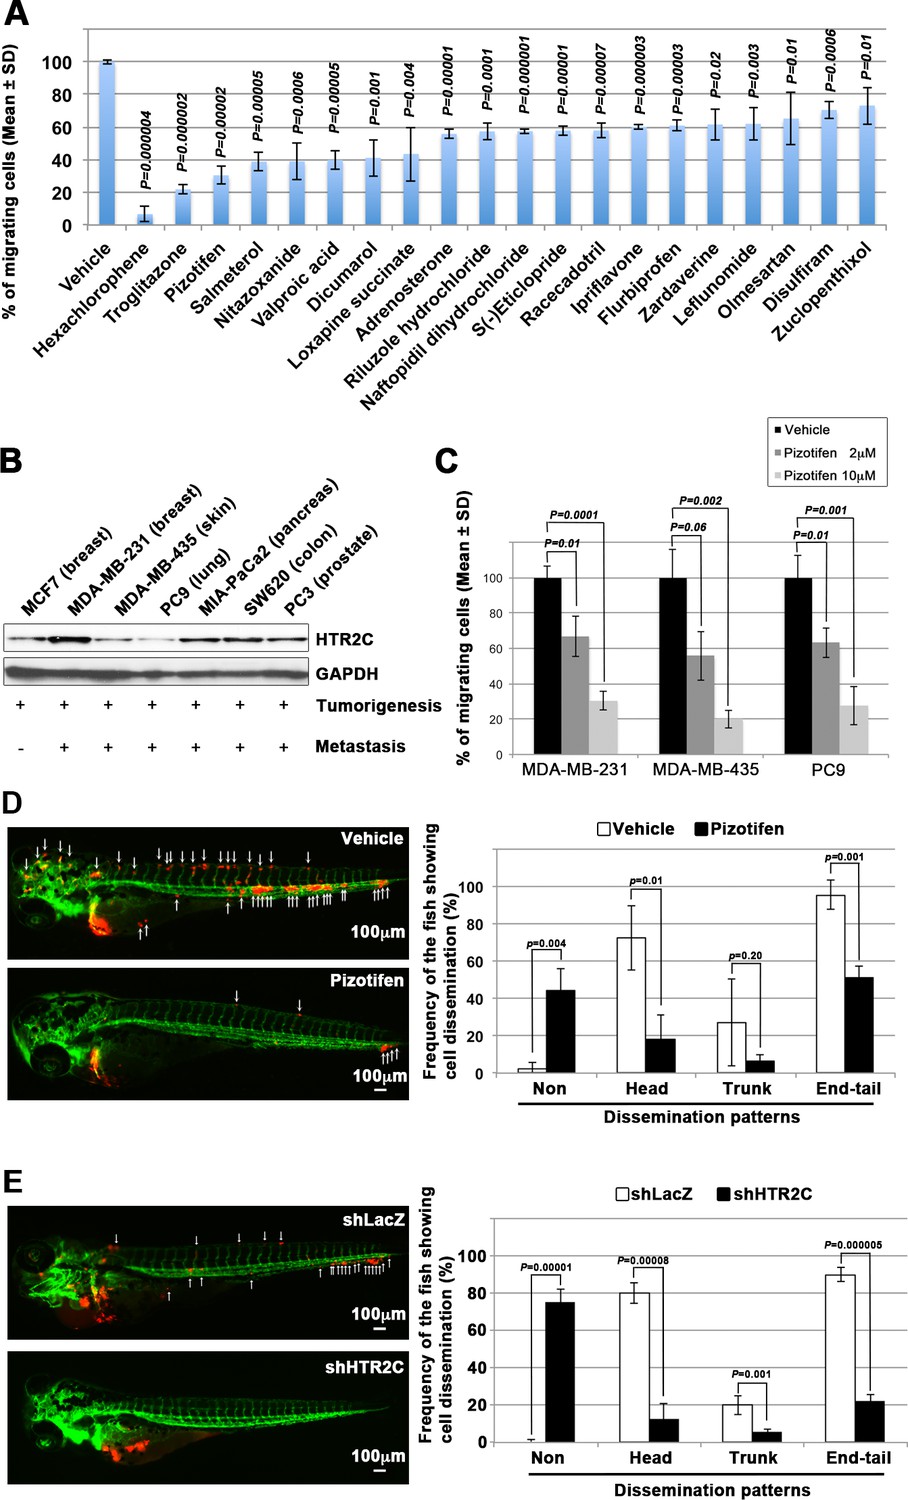
(A) Effect of the epiboly-interrupting drugs on cell motility and invasion of MBA-MB-231 cells. MBA-MB-231 cells were treated with vehicle or each of the epiboly-interrupting drugs and then subjected to Boyden chamber assays. Fetal bovine serum (1% v/v) was used as the chemoattractant in both assays. Each experiment was performed at least twice. (B) Western blot analysis of HTR2C levels (top) in a non-metastatic human cancer cell line, MCF7 (breast) and highly metastatic human cancer cell lines, MDA-MB-231 (breast), MDA-MB-435 (melanoma), PC9 (lung), MIA-PaCa2 (pancreas), PC3 (prostate), and SW620 (colon); GAPDH loading control is shown (bottom). (C) Effect of pizotifen on cell motility and invasion of MBA-MB-231, MDA-MB-435, and PC9 cells. Either vehicle or pizotifen treated the cells were subjected to Boyden chamber assays. Fetal bovine serum (1% v/v) was used as the chemoattractant in both assays. Each experiment was performed at least twice. (D) and (E) Representative images of dissemination of 231R, shLacZ 231R or shHTR2C 231R cells in zebrafish xenotransplantation model. The fish larvae that were inoculated with 231R cells were treated with either vehicle (top left) or the drug (lower left) (D). The fish larvae that were inoculated with either shLacZ 231R or shHTR2C 231R cells (lower left) (E). White arrows head indicate disseminated 231R cells. The images were shown in 4× magnification. Scale bar, 100 µm. The mean frequencies of the fish showing head, trunk, or end-tail dissemination were counted (graph on right). Each value is indicated as the mean ± SEM of two independent experiments. Statistical analysis was determined by Student’s t test.
Figure 2—figure supplement 1
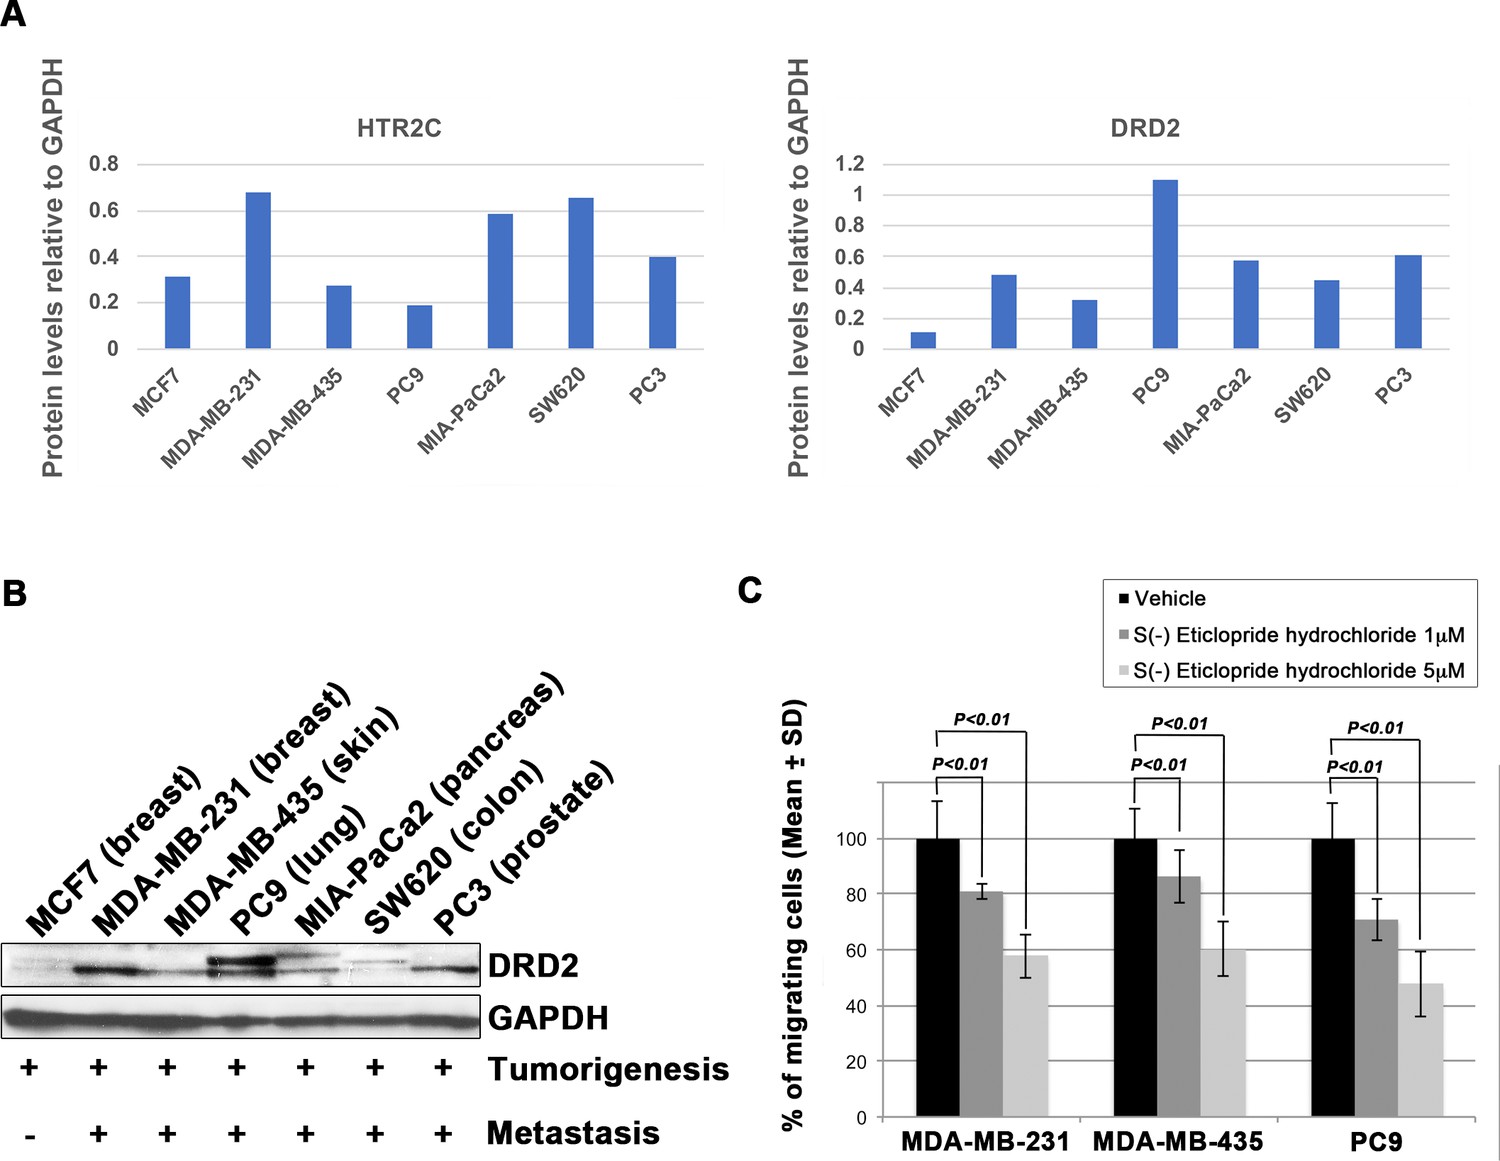
Blocking Dopamine receptor D2 with S(-) Eticlopride hydrochloride suppressed cell motility and invasion of highly metastatic human cancer cells in a dose-dependent manner.
(A) Quantification analyses of western blotting bands in Figure 2B. The analyses were performed by ImageJ. Signal strength of bands of HTR2C (left) and DRD2 (right) was normalized by that of GAPDH. (B) Western blot analysis of DRD2 levels in non-metastatic human cancer cell line, MCF7 (breast) and highly metastatic human cancer cell lines, MDA-MB-231 (breast), MDA-MB-435 (melanoma), MIA-PaCa2 (pancreas), PC3 (prostate), and SW620 (colon); GAPDH loading control is shown (bottom). GAPDH control was obtained in the same experiment from Figure 2B. (C) Effect of S(-)eticlopride hydrochloride on cell motility and invasion of MBA-MB-231, MDA-MB-435, and PC9 cells. Either vehicle- or pizotifen-treated cells were subjected to Boyden chamber assays. Fetal bovine serum (1% v/v) was used as the chemoattractant in both assays. Each experiment was performed at least twice. Statistical analysis was determined by Student’s t test.
Figure 2—figure supplement 2

Pizotifen suppressed metastatic dissemination of MDA-MB-231 and MIA-PaCa2 cells in a zebrafish xenotransplantation model.
(A) Representative images of dissemination of 231R cells in zebrafish xenotransplantation model. The fish larvae that were inoculated with 231R cells were treated with either vehicle (top left, bottom left) or pizotifen (top right, bottom right). (B) Representative images of dissemination of MIA-PaCa2 cells in zebrafish xenotransplantation model. The fish were inoculated with MIA-PaCa2 cells, and treated with either vehicle (top left) or drug (lower left). White arrow heads indicate disseminated MIA-PaCa2 cells. The images were shown in 4× magnification. Scale bar, 100 μm. The mean frequencies of the fish showing head, trunk, or end-tail dissemination were tabulated (right). Each value is indicated as the mean ± SEM of two independent experiments. Statistical analysis was determined by Student’s t test.
Figure 3 with 1 supplement
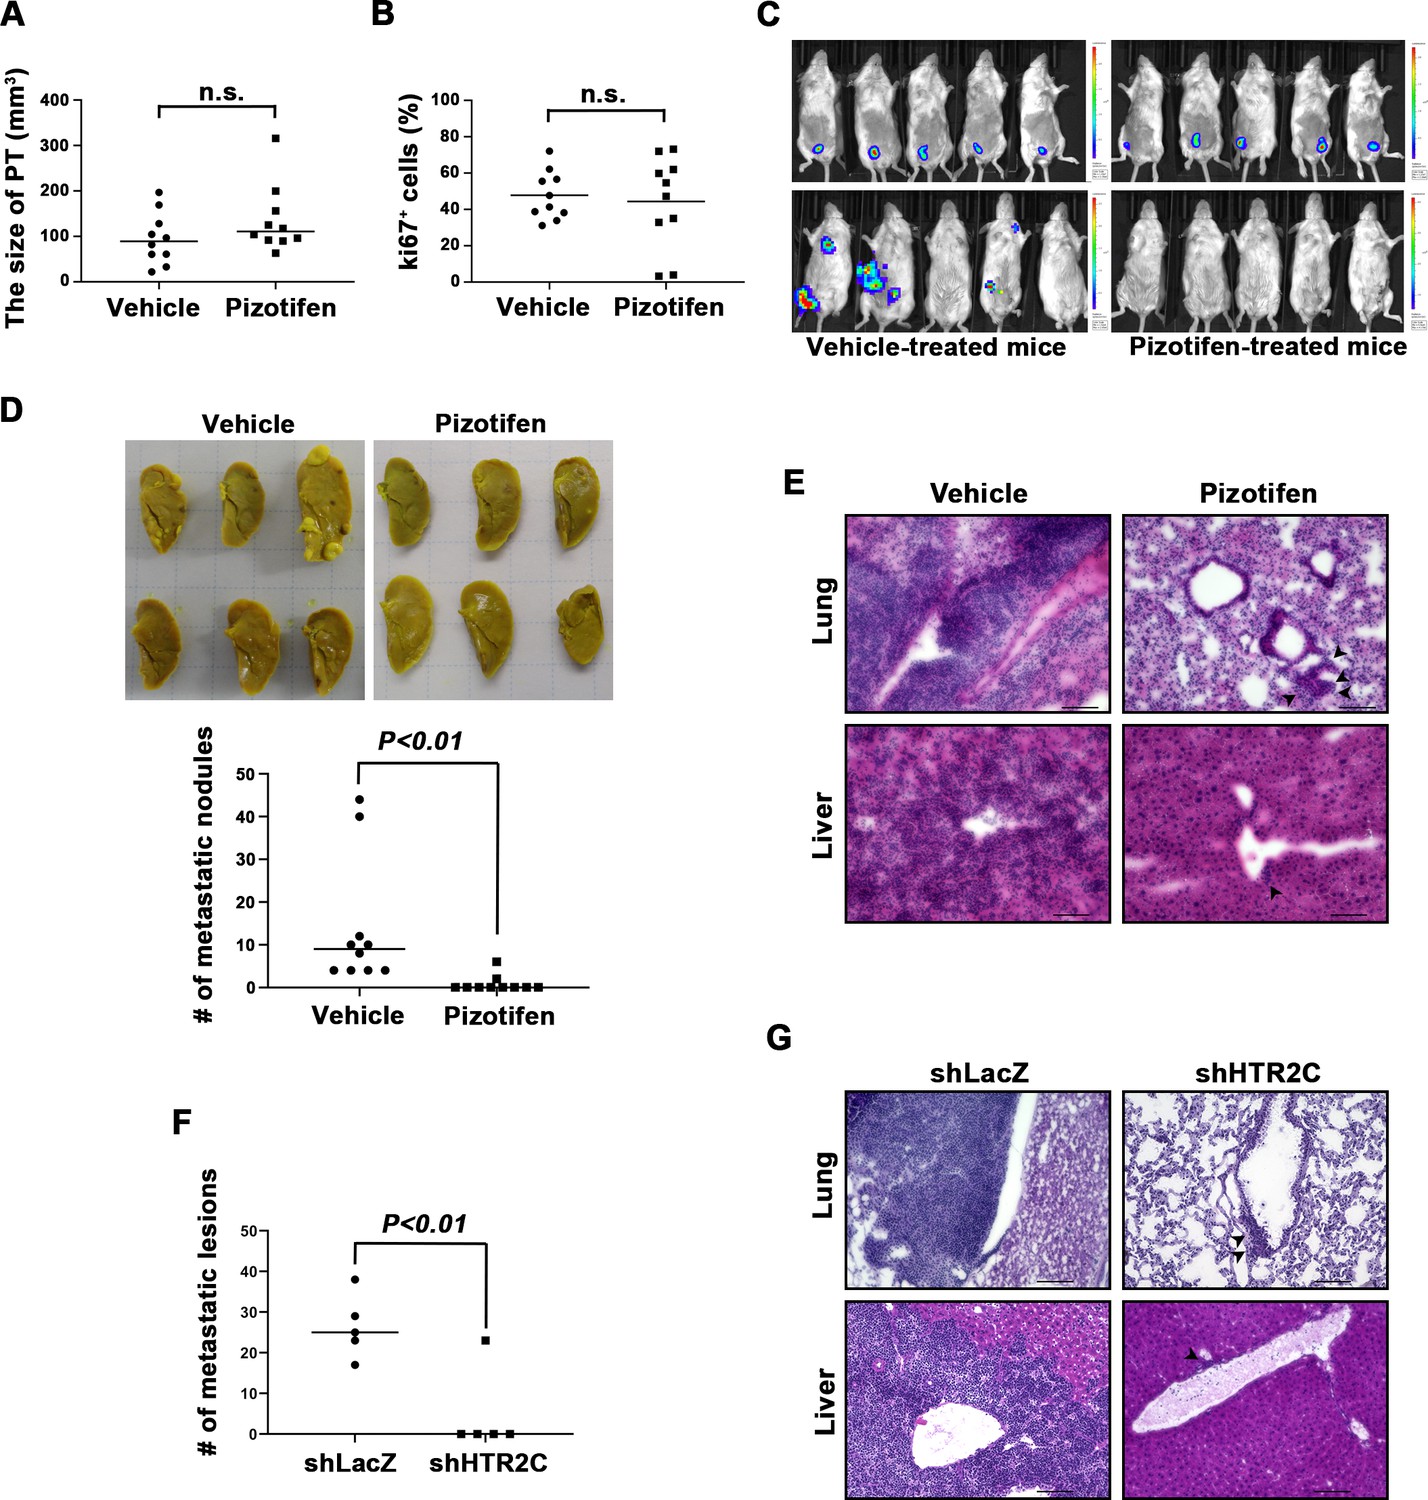
Pizotifen suppressed metastatic progression in a mouse model of metastasis.
(A) Mean volumes (n = 10 per group) of 4T1 primary tumors formed in the mammary fat pad of either vehicle- or pizotifen-treated mice at day 10 post injection. (B) Ki67 expression level in 4T1 primary tumors formed in the mammary fat pad of either vehicle- or pizotifen-treated mice at day 10 post injection. The mean expression levels of Ki67 (n = 10 mice per group) were determined and were calculated as the mean ration of Ki67-positive cells to 4’,6-diamidino-2-phenylindole (DAPI) area. (C) Representative images of primary tumors on day 10 post injection (top panels) and metastatic burden on day 70 post injection (bottom panels) taken using an IVIS Imaging System. (D) Representative images of the lungs from either vehicle- (top) or pizotifen-treated mice (bottom) at 70 days post tumor inoculation. Number of metastatic nodules in the lung of either vehicle- or pizotifen-treated mice (right). (E) Representative hematoxylin and eosin (H&E) staining of the lung (top) and liver (bottom) from either vehicle- or pizotifen-treated mice. Black arrow heads indicate metastatic 4T1 cells. (F) The mean number of metastatic lesions in step sections of the lungs from the mice that were inoculated with 4T1-12B cells expressing short hairpin RNA (shRNA) targeting for either LacZ or HTR2C. (G) Representative H&E staining of the lung and liver from the mice that were inoculated with 4T1-12B cells expressing shRNA targeting for either LacZ or HTR2C. Black arrow heads indicate metastatic 4T1 cells. Each value is indicated as the mean ± SEM. Statistical analysis was determined by Student’s t test.
Figure 3—figure supplement 1

Cleaved caspase 3 expression level in 4T1 primary tumors formed in the mammary fat pad of either vehicle- or pizotifen-treated mice at day 10 post injection.
Figure 4 with 1 supplement
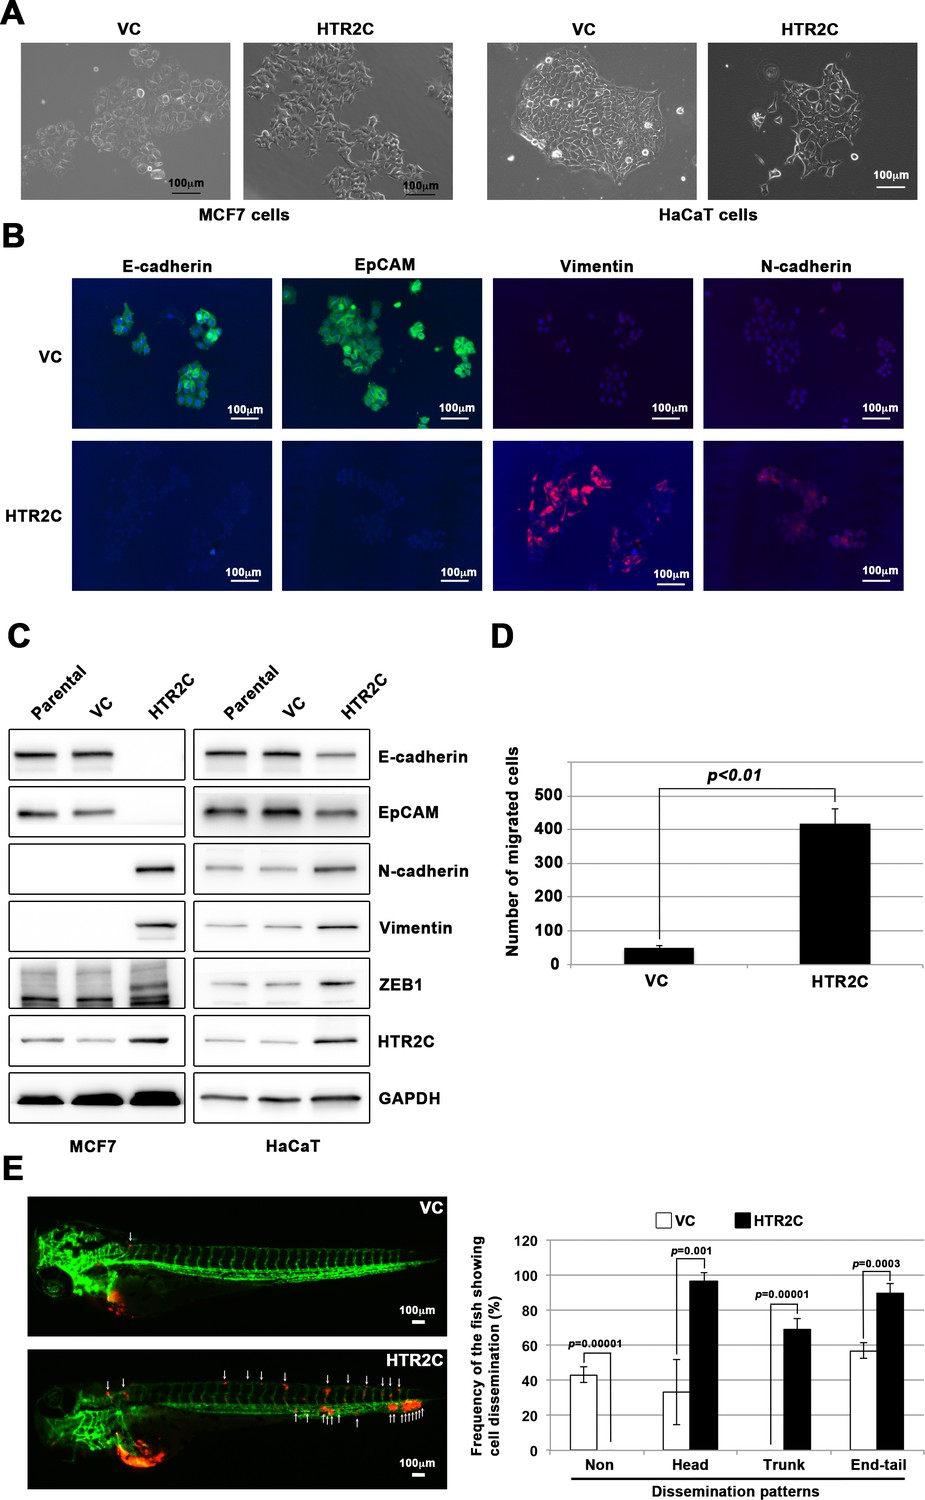
HTR2C induced epithelial-to-mesenchymal transition (EMT)-mediated metastatic dissemination of human cancer cells.
(A) The morphologies of the MCF7 and HaCaT cells expressing either the control vector or HTR2C were revealed by phase contrast microscopy. (B) Immunofluorescence staining of E-cadherin, EpCAM, vimentin, and N-cadherin expressions in the MCF7 cells from A. (C) Expression of E-cadherin, EpCAM, vimentin, N-cadherin, and HTR2C was examined by western blotting in the MCF7 and HaCaT cells; GAPDH loading control is shown (bottom). (D) Effect of HTR2C on cell motility and invasion of MCF7 cells. MCF7 cells were subjected to Boyden chamber assays. Fetal bovine serum (1% v/v) was used as the chemoattractant in both assays. Each experiment was performed at least twice. (E) Representative images of dissemination patterns of MCF7 cells expressing either the control vector (top left) or HTR2C (lower left) in a zebrafish xenotransplantation model. White arrow heads indicate disseminated MCF7 cells. The mean frequencies of the fish showing head, trunk, or end-tail dissemination tabulated (right). Each value is indicated as the mean ± SEM of two independent experiments. Statistical analysis was determined by Student’s t test.
Figure 4—figure supplement 1
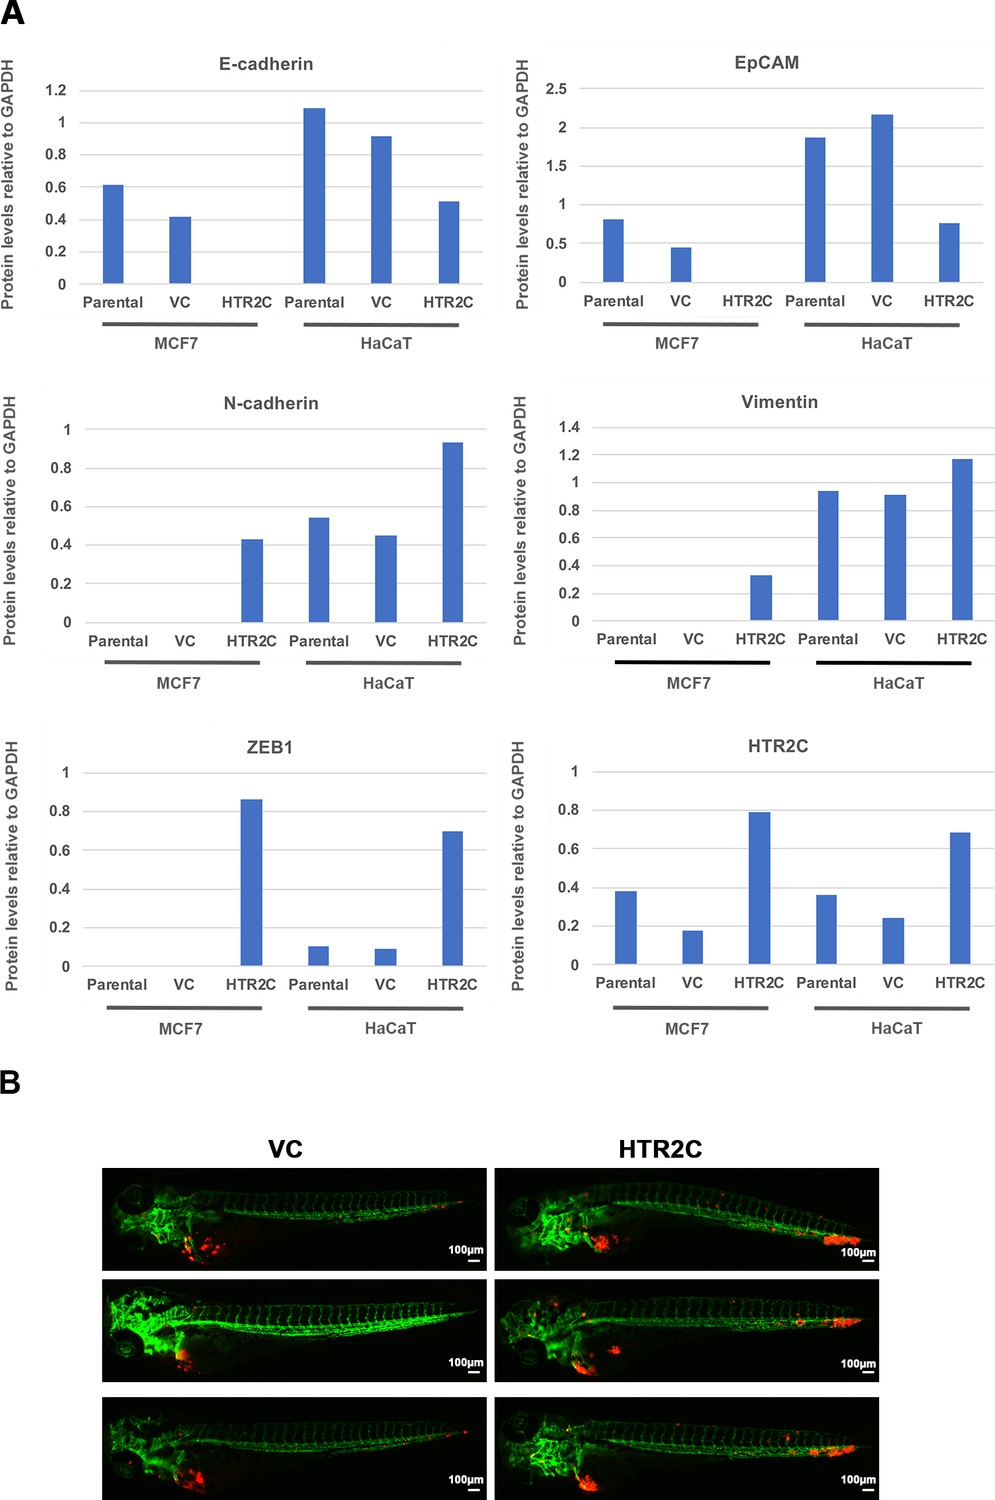
HTR2C promoted EMT-mediated metastatic dissemination of poorly metastatic human cancer cells in a zebrafish xenotransplantation model.
(A) Quantification analyses of western blotting bands in Figure 4C. The analyses were performed by ImageJ. Signal strength of bands of E-cadherin, EpCAM, N-cadherin, vimentin, ZEB1, and HTR2C was normalized by that of GAPDH. (B) Representative images of dissemination patterns of MCF7 cells expressing either the control vector (top left, middle left, bottom left) or HTR2C (top right, middle right, bottom right) in a zebrafish xenotransplantation model.
Figure 5 with 5 supplements
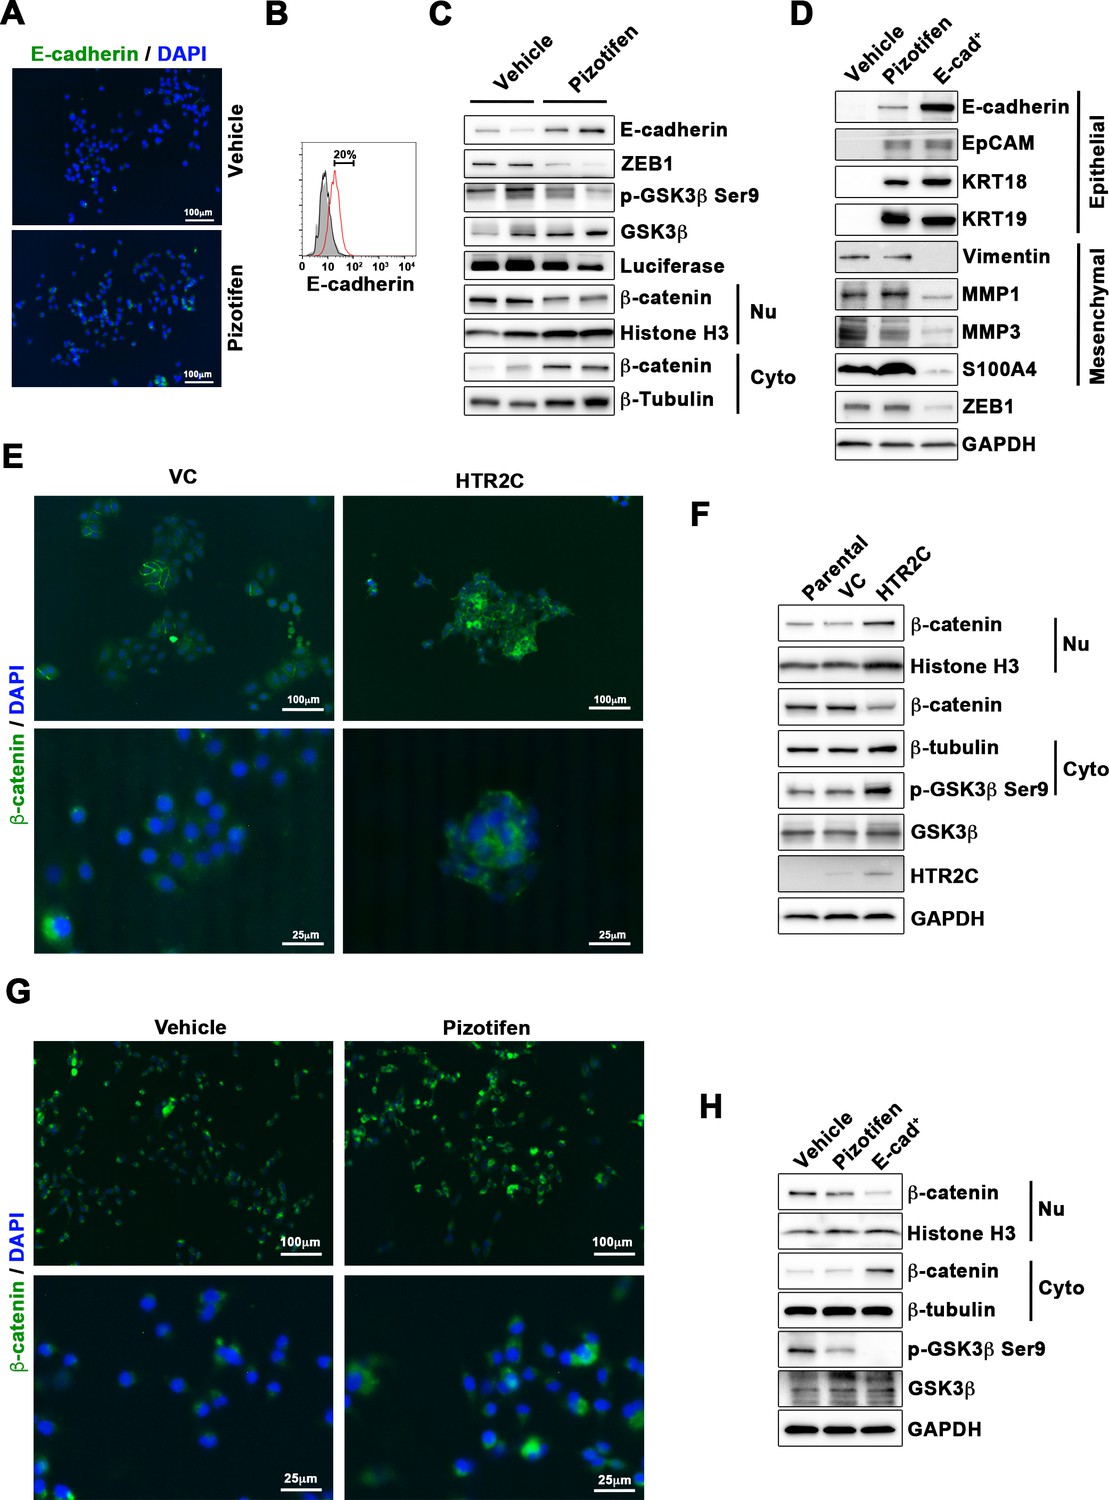
Pizotifen restored mesenchymal-like traits of MDA-MB-231 cells into epithelial traits through blocking nuclear accumulation of β-catenin.
(A) Immunofluorescence (IF) staining of E-cadherin in either vehicle- or pizotifen-treated MDA-MB-231 cells. (B) Surface expression of E-cadherin in either vehicle (black)- or pizotifen (red)-treated MDA-MB-231 cells by FACS analysis. Non-stained controls are shown in gray. (C) Protein expressions levels of E-cadherin, ZEB1, and β-catenin in the cytoplasm and nucleus of 4T1 primary tumors from either vehicle- or pizotifen-treated mice are shown; Luciferase, histone H3, and β-tubulin are used as loading control for whole cell, nuclear, or cytoplasmic lysate, respectively. (D) Protein expression levels of epithelial and mesenchymal markers and ZEB1 in either vehicle- or pizotifen-treated MDA-MB-231 cells or E-cadherin-positive (E-cad+) cells in pizotifen-treated MDA-MB-231 cells are shown. (E) IF staining of β-catenin in the MCF7 cells expressing either vector control (top left, bottom left) or HTR2C (top right, bottom right). (F) Expressions of β-catenin in the cytoplasm and nucleus of MCF7 cells. (G) IF staining of β-catenin in either vehicle (top left, bottom left) or pizotifen-treated MDA-MB-231 cells (top right, bottom right). (H) Expressions of β-catenin in the cytoplasm and nucleus of MDA-MB-231 cells and the E-cad+ cells.
Figure 5—figure supplement 1
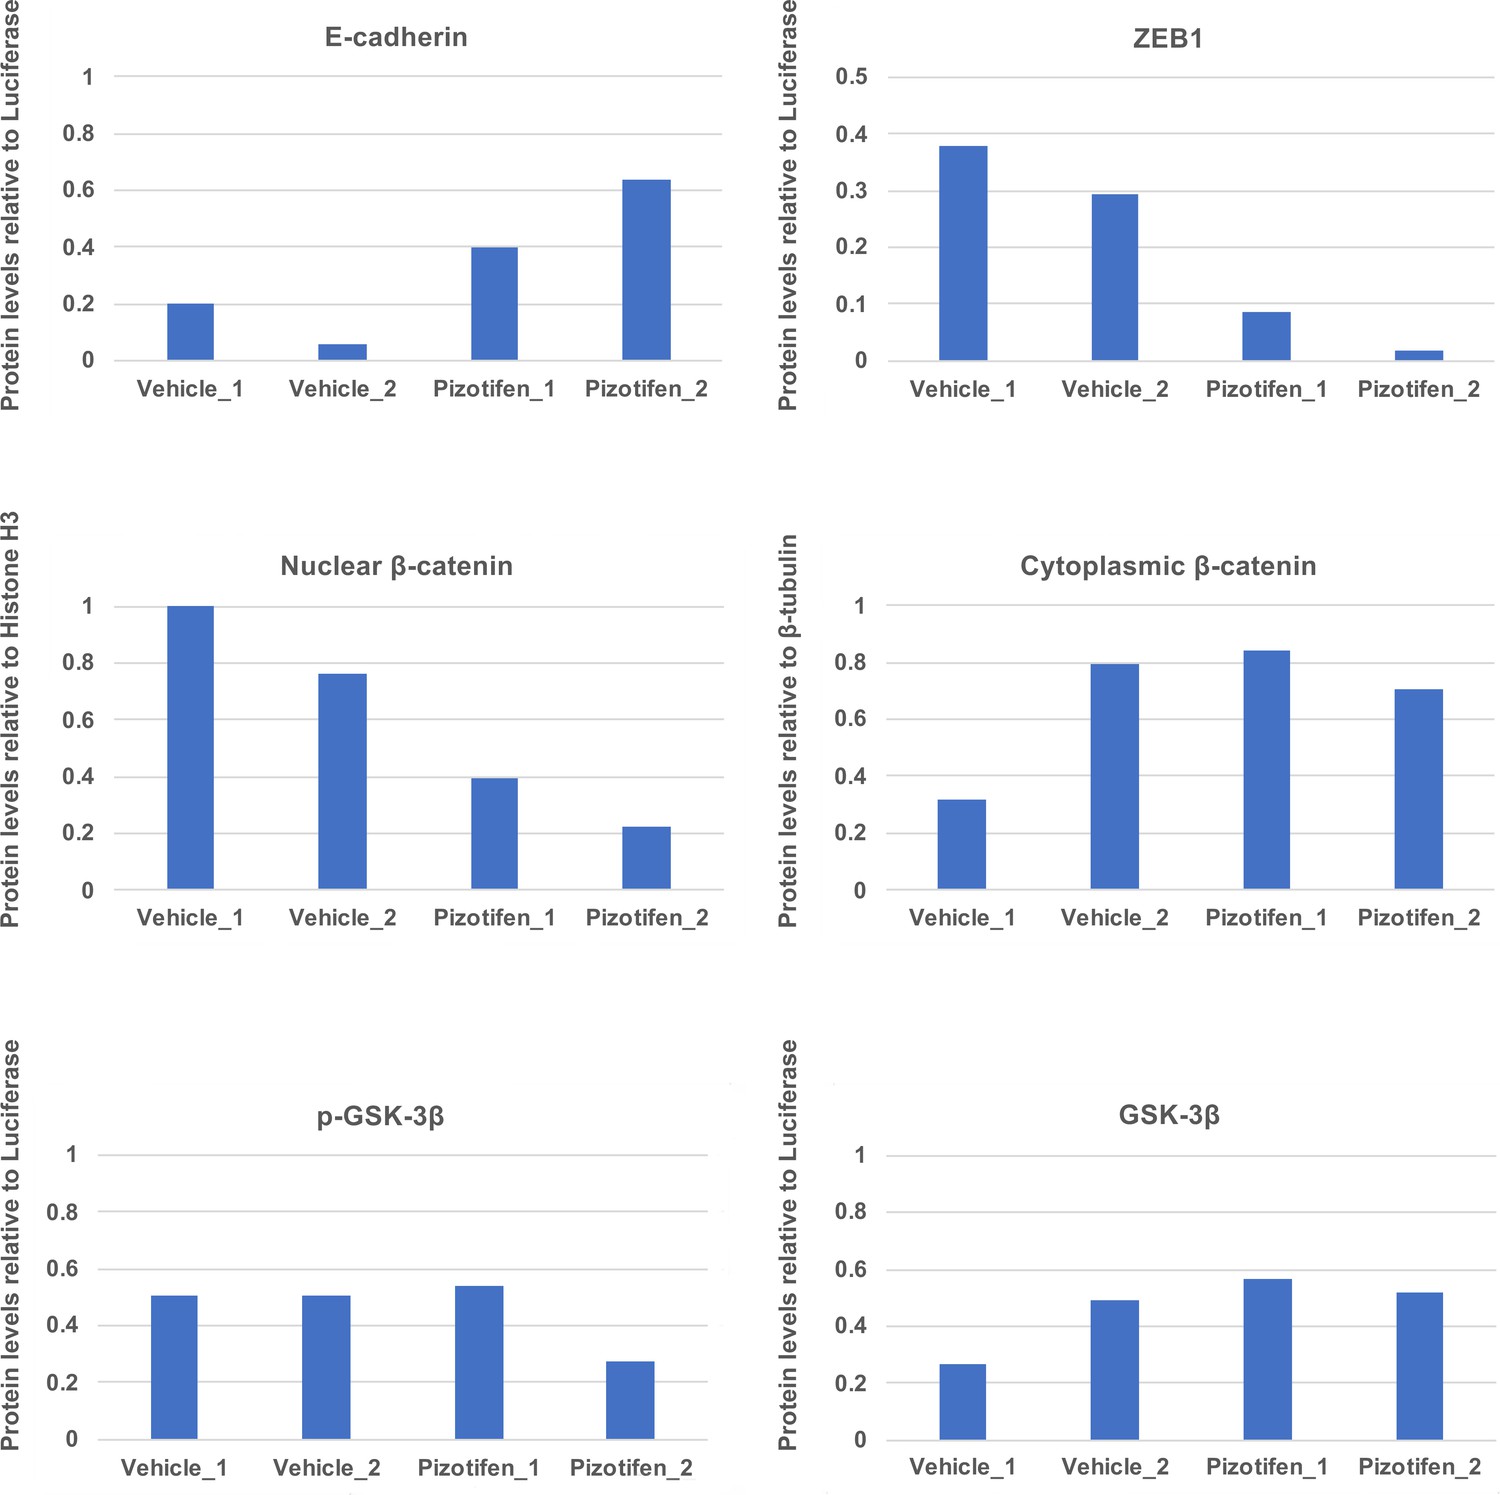
Quantification analyses of western blotting bands in Figure 5C.
The analyses were performed by ImageJ. Signal strength of bands of E-cadherin, EpCAM, p-GSK-3β, GSK-3β were normalized by that of luciferase. Signal strength of bands of nuclear and cytoplasmic β-catenin was normalized by that of histone H3 and β-tubulin, respectively.
Figure 5—figure supplement 2
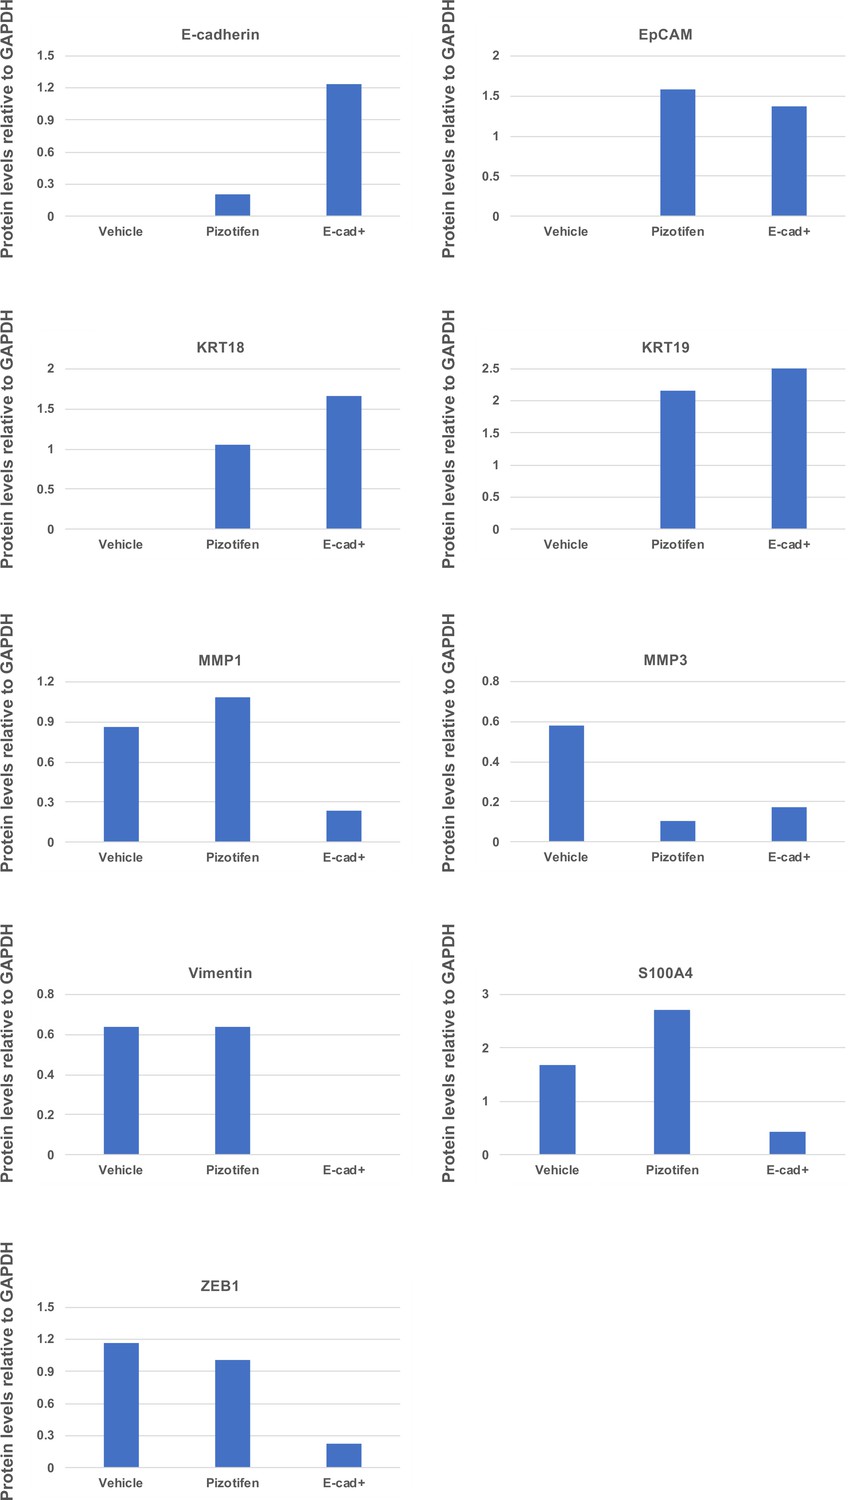
Quantification analyses of western blotting bands in Figure 5D.
The analyses were performed by ImageJ. Signal strength of bands of E-cadherin, EpCAM, KRT18, KRT19, MMP1, MMP3, vimentin, and S100A4 was normalized by that of GAPDH.
Figure 5—figure supplement 3
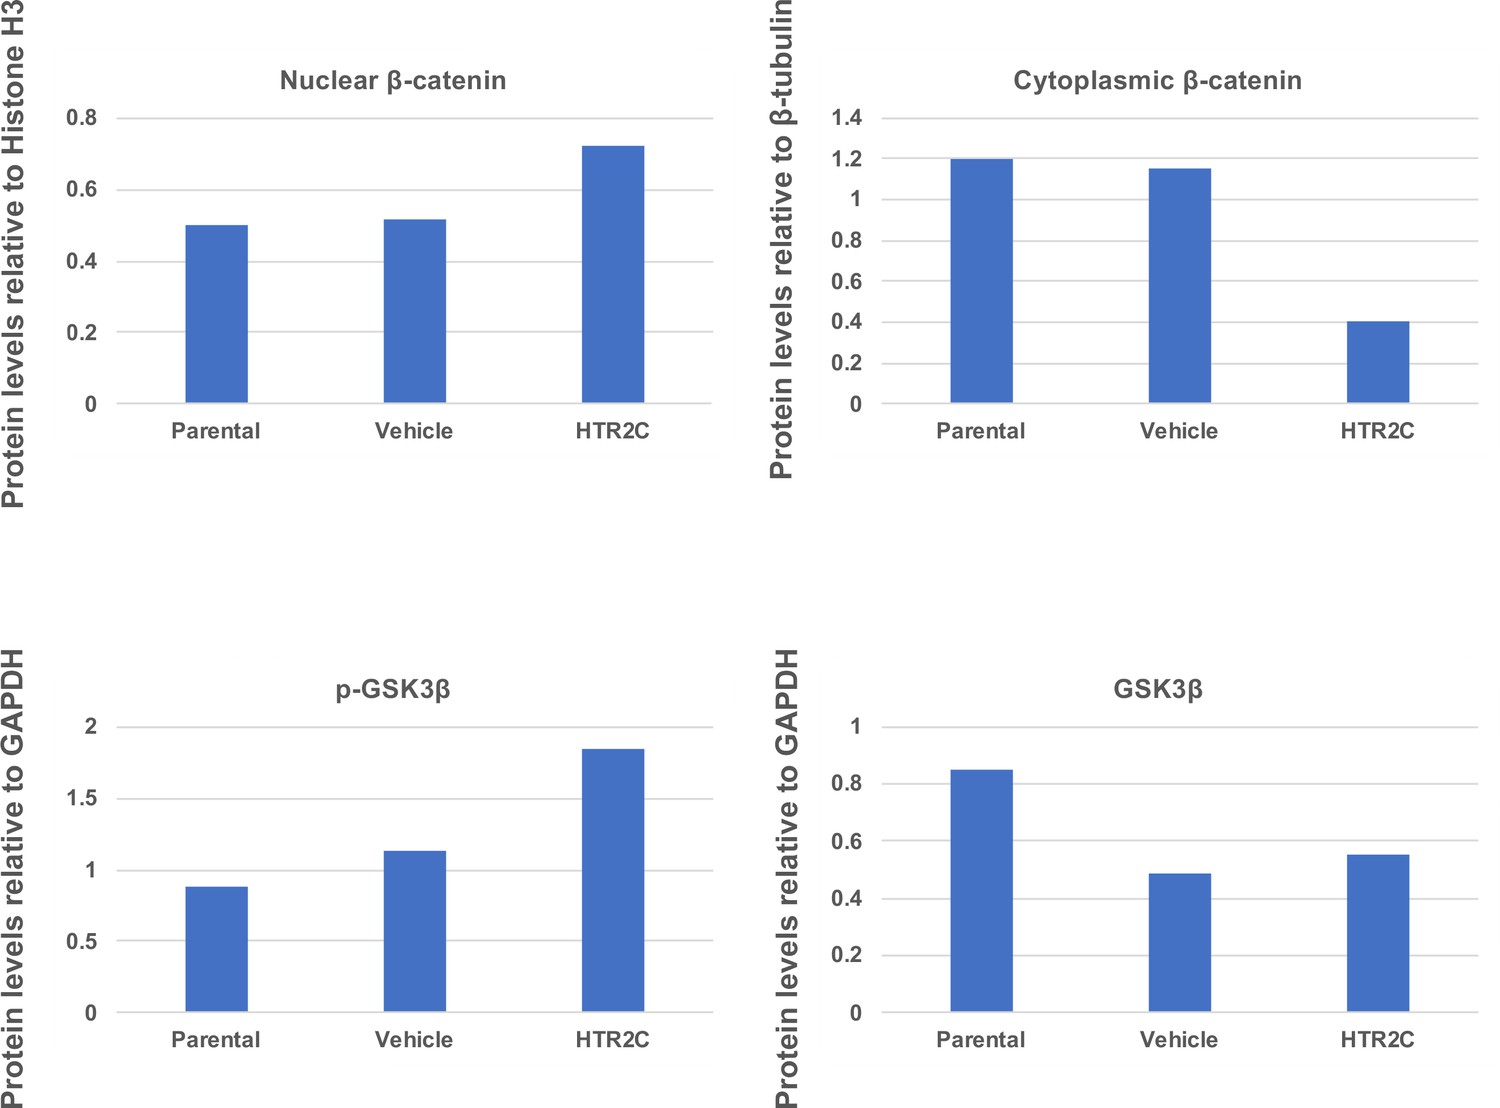
Quantification analyses of western blotting bands in Figure 5F.
The analyses were performed by ImageJ. Signal strength of bands of nuclear and cytoplasmic β-catenin was normalized by that of histone H3 and β-tubulin, respectively. Signal strength of bands of p-GSK-3β and GSK-3β was normalized by that of GAPDH.
Figure 5—figure supplement 4
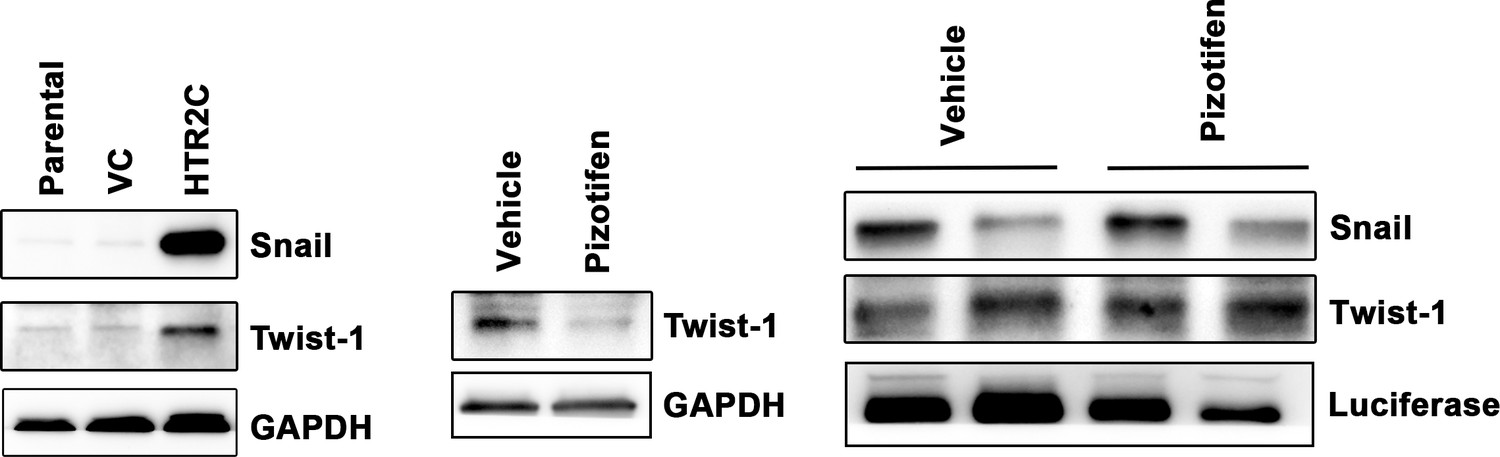
Expression of Snail and Twist1 was examined by western blotting in the MCF7 cells (left); GAPDH loading control is shown (bottom).
GAPDH band is the same as one from Figure 4C since GAPDH bands in Figure 4C (bottom left) and Figure 5—figure supplement 4 (bottom left) were obtained in the same experiment. Protein expression levels of Twist1 in either vehicle- or pizotifen-treated MDA-MB-231 cells are shown (middle): GAPDH loading control is shown (bottom). Protein expression levels of Snail and Twist1 of 4T1 primary tumors from either vehicle- or pizotifen-treated mice are shown (right); luciferase is used as loading control for whole cell. Luciferase control was obtained in the same experiment from Figure 5C.
Figure 5—figure supplement 5
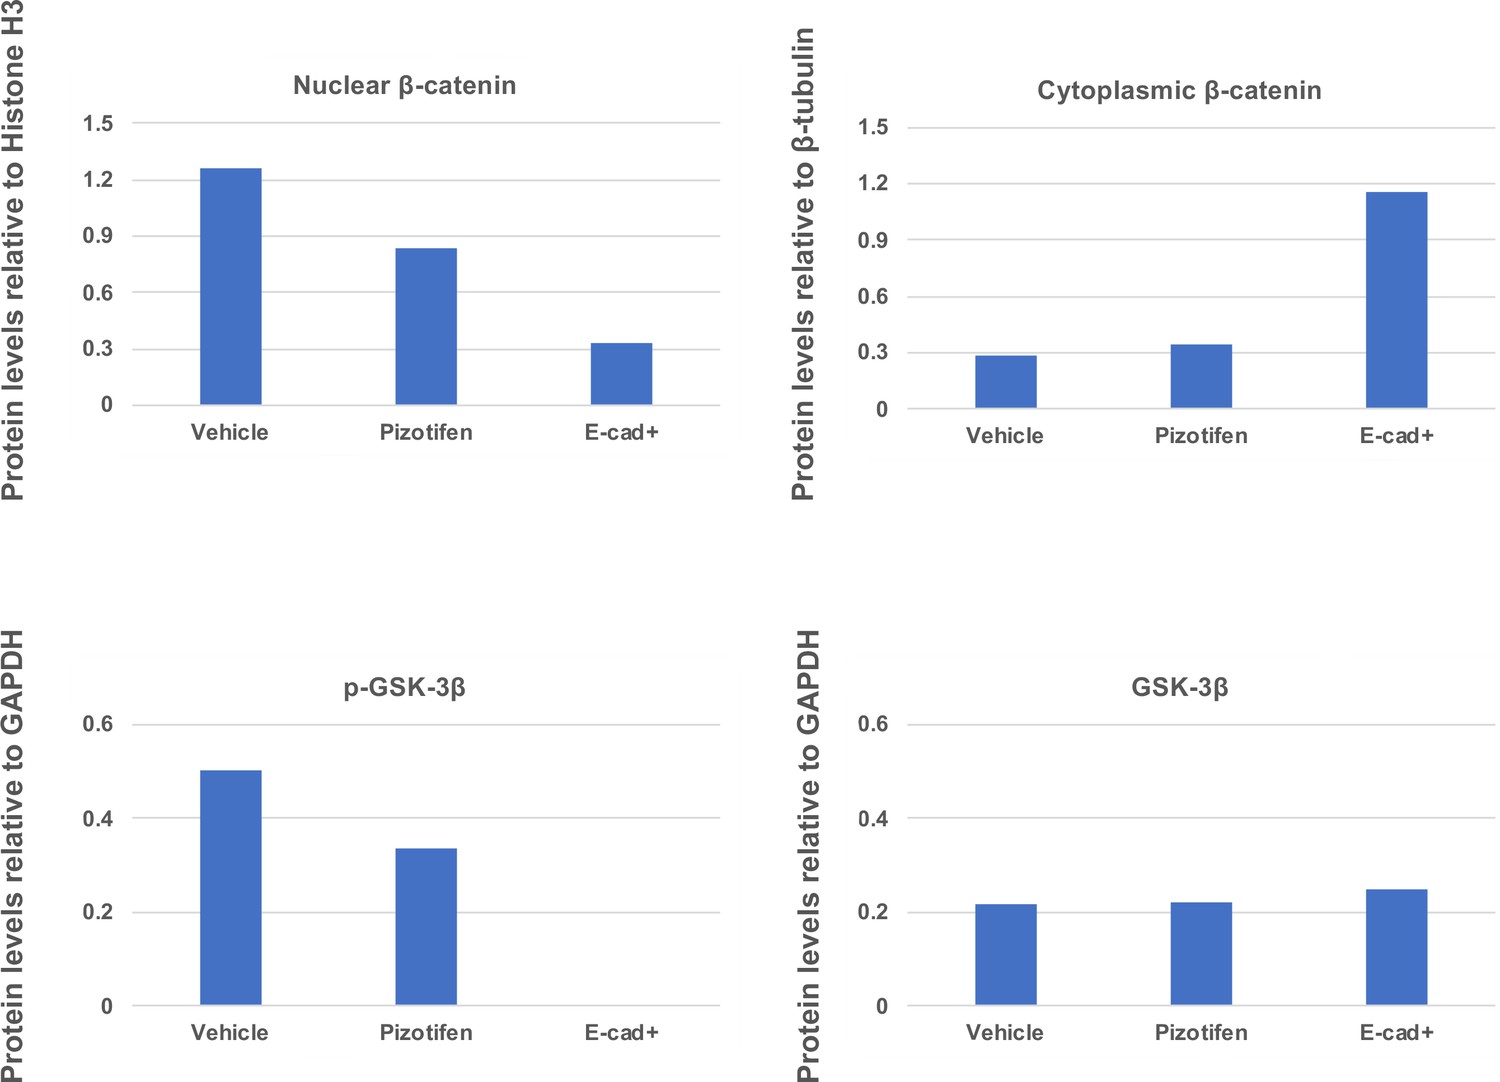
Quantification analyses of western blotting bands in Figure 5H.
The analyses were performed by ImageJ. Signal strength of bands of nuclear and cytoplasmic β-catenin was normalized by that of histone H3 and β-tubulin, respectively. Signal strength of bands of p-GSK-3β and GSK-3β was normalized by that of GAPDH.
Tables
Table 1
A list of the genes that are involved between gastrulation and metastasis progression.
A list of the 50 genes that play essential role in governing both metastasis and gastrulation progression. The gastrulation defects in Xenopus or zebrafish that are induced by knockdown of each of these genes were indicated. The molecular mechanism in metastasis that is inhibited by knockdown of each of the same genes was indicated.
| Genes | Gastrulation defects | Ref | Effects in metastasis | Ref |
|---|---|---|---|---|
| BMP | Convergence and extension | Kondo, 2007 | EMT | Katsuno et al., 2008 |
| WNT | Convergence and extension | Tada and Smith, 2000 | Migration and invasion | Vincan and Barker, 2008 |
| FGF | Convergence and extension | Yang et al., 2002 | Invision | Nomura et al., 2008 |
| EGF | Epiboly | Song et al., 2013 | Migration | Lu et al., 2001 |
| PDGF | Convergence and extension | Damm and Winklbauer, 2011 | EMT | Jechlinger et al., 2006 |
| CXCL12 | Migration of endodermal cells | Mizoguchi et al., 2008 | Migration and invasion | Shen et al., 2013 |
| CXCR4 | Migration of endodermal cells | Mizoguchi et al., 2008 | Migration and invasion | Shen et al., 2013 |
| PIK3CA | Convergence and extension | Montero et al., 2003 | Migration and invasion | Wander et al., 2013 |
| YES | Epiboly | Tsai et al., 2005 | Migration | Barraclough et al., 2007 |
| FYN | Epiboly | Sharma et al., 2005 | Migration and invasion | Yadav and Denning, 2011 |
| MAPK1 | Epiboly | Krens et al., 2008 | Migration | Radtke et al., 2013 |
| SHP2 | Convergence and extension | Jopling et al., 2007 | Migration | Wang et al., 2005 |
| SNAI1 | Convergence and extension | Ip and Gridley, 2002 | EMT | Batlle et al., 2000 |
| SNAI2 | Mesoderm and neural crest formation | Shi et al., 2011 | EMT | Medici et al., 2008 |
| TWIST1 | Mesoderm formation | Castanon and Baylies, 2002 | EMT | Yang et al., 2004 |
| TBXT | Convergence and extension | Tada and Smith, 2000 | EMT | Fernando et al., 2010 |
| ZEB1 | Epiboly | Vannier et al., 2013 | EMT | Spaderna et al., 2008 |
| GSC | Mesodermal patterning | Sander et al., 2007 | EMT | Hartwell et al., 2006 |
| FOXC2 | Unclear, defects in gastrulation | Wilm et al., 2004 | EMT | Mani et al., 2007 |
| STAT3 | Convergence and extension | Miyagi et al., 2004 | Migration | Abdulghani et al., 2008 |
| POU5F1 | Epiboly | Lachnit et al., 2008 | EMT | Dai et al., 2013 |
| EZH2 | Unclear, defects in gastrulation | O’Carroll et al., 2001 | Invasion | Ren et al., 2012 |
| EHMT2 | Defects in neurogenesis | Lin et al., 2005 | Migration and invasion | Chen et al., 2010 |
| BMI1 | Defects in skeleton formation | van der Lugt et al., 1994 | EMT | Guo et al., 2011 |
| RHOA | Convergence and extension | Zhu et al., 2006 | Migration and invasion | Yoshioka et al., 1999 |
| CDC42 | Convergence and extension | Choi and Han, 2002 | Migration and invasion | Reymond et al., 2012 |
| RAC1 | Convergence and extension | Habas et al., 2003 | Migration and invasion | Vega and Ridley, 2008 |
| ROCK2 | Convergence and extension | Marlow et al., 2002 | Migration and invasion | Itoh et al., 1999 |
| PAR1 | Convergence and extension | Kusakabe and Nishida, 2004 | Migration | Shi et al., 2004 |
| PRKCI | Convergence and extension | Kusakabe and Nishida, 2004 | EMT | Gunaratne et al., 2013 |
| CAP1 | Convergence and extension | Seifert et al., 2009 | Migration | Yamazaki et al., 2009 |
| EZR | Epiboly | Link et al., 2006 | Migration | Khanna et al., 2004 |
| EPCAM | Epiboly | Slanchev et al., 2009 | Migration and invasion | Ni et al., 2012 |
| ITGB1/ ITA5 | Mesodermal migration | Skalski et al., 1998 | Migration and invasion | Felding-Habermann, 2003 |
| FN1 | Convergence and extension | Marsden and DeSimone, 2003 | Invasion | Malik et al., 2010 |
| HAS2 | Dorsal migration of lateral cells | Bakkers et al., 2004 | Invasion | Kim et al., 2004 |
| MMP14 | Convergence and extension | Coyle et al., 2008 | Invasion | Perentes et al., 2011 |
| COX1 | Epiboly | Cha et al., 2006 | Invasion | Kundu and Fulton, 2002 |
| PTGES | Convergence and extension | Speirs et al., 2010 | Invasion | Wang and Dubois, 2006 |
| SLC39A6 | Anterior migration | Yamashita et al., 2004 | EMT | Lue et al., 2011 |
| GNA12 /13 | Convergence and extension | Lin et al., 2005 | Migration and invasion | Yagi et al., 2011 |
| OGT | Epiboly | Webster et al., 2009 | Migration and invasion | Lynch et al., 2012 |
| CCN1 | Cell movement | Latinkic et al., 2003 | Migration and invasion | Lin et al., 2012 |
| TRPM7 | Convergence and extension | Liu et al., 2011 | Migration | Middelbeek et al., 2012 |
| MAPKAPK2 | Epiboly | Holloway et al., 2009 | Migration | Kumar et al., 2010 |
| B4GALT1 | Convergence and extension | Machingo et al., 2006 | Invasion | Zhu et al., 2005 |
| IER2 | Convergence and extension | Hong et al., 2011 | Migration | Neeb et al., 2012 |
| TIP1 | Convergence and extension | Besser et al., 2007 | Migration and invasion | Han et al., 2012 |
| PAK5 | Convergence and extension | Faure et al., 2005 | Migration | Gong et al., 2009 |
| MARCKS | Convergence and extension | Iioka et al., 2004 | Migration and invasion | Rombouts et al., 2013 |
Table 2
A list of the drugs that interfere with epiboly progression in zebrafish.
Related to Figure 1. A list of positive ‘hit’ drugs that interfered with epiboly progression. Gastrulation defects or status of each of the zebrafish embryos that were treated with either 10 or 50 μM concentrations are indicated.
| Chemical name | Chemical formula | Effect of 10 µM | Effect of 50 µM |
|---|---|---|---|
| Acitretin | C21H26O3 | Delayed | Delayed |
| Adrenosterone | C19H24O3 | Delayed | Delayed |
| Albendazole | C12H15N3O2S | Severe delayed | Severe delayed |
| Alfadolone acetate | C23H34O5 | Delayed | Delayed |
| Alfaxalone | C21H32O3 | Delayed | Delayed |
| Alprostadil | C20H34O5 | Delayed | Delayed |
| Altrenogest | C21H26O2 | Slightly delayed | Delayed |
| Ampiroxicam | C20H21N3O7S | Non-effect | Delayed |
| Anethole-trithione | C10H8OS3 | Delayed | Delayed |
| Antimycin A | C28H40N2O9 | Delayed | Delayed |
| Avobenzone | C20H22O3 | Delayed | Delayed |
| Benzoxiquine | C16H11NO2 | Non-effect | Delayed |
| Bosentan | C27H29N5O6S | Delayed | Delayed |
| Butoconazole nitrate | C19H18Cl3N3O3S | Delayed | Toxic lethal |
| Camptothecine (S,+) | C20H16N2O4 | Severe delayed | Severe delayed |
| Carbenoxolone disodium salt | C34H48Na2O7 | Delayed | Toxic lethal |
| Carmofur | C11H16FN3O3 | Slightly delayed | Delayed |
| Carprofen | C15H12ClNO2 | Severe delayed | Toxic lethal |
| Cefdinir | C14H13N5O5S2 | Delayed | Delayed |
| Celecoxib | C17H14F3N3O2S | Delayed | Delayed |
| Chlorambucil | C14H19Cl2NO2 | Slightly delayed | Delayed |
| Chlorhexidine | C22H30Cl2N10 | Non-effect | Toxic lethal |
| Ciclopirox ethanolamine | C14H24N2O3 | Delayed | Severe delayed |
| Cinoxacin | C12H10N2O5 | Delayed | Severe delayed |
| Clofibrate | C12H15ClO3 | Non-effect | Severe delayed |
| Clopidogrel | C16H16ClNO2S | Non-effect | Delayed |
| Clorgyline hydrochloride | C13H16Cl3NO | Delayed | Delayed |
| Colchicine | C22H25NO6 | Non-effect | Delayed |
| Deptropine citrate | C29H35NO8 | Delayed | Delayed |
| Desipramine hydrochloride | C18H23ClN2 | Delayed | Delayed |
| Diclofenac sodium | C14H10Cl2NNaO2 | Delayed | Severe delayed |
| Dicumarol | C19H12O6 | Delayed | Severe delayed |
| Diethylstilbestrol | C18H20O2 | Delayed | Toxic lethal |
| Dimaprit dihydrochloride | C6H17Cl2N3S | Slightly delayed | Delayed |
| Disulfiram | C10H20N2S4 | Delayed | Delayed |
| Dopamine hydrochloride | C8H12ClNO2 | Delayed | Delayed |
| Eburnamonine (-) | C19H22N2O | Delayed | Delayed |
| Ethaverine hydrochloride | C24H30ClNO4 | Delayed | Delayed |
| Ethinylestradiol | C20H24O2 | Delayed | Severe delayed |
| Ethopropazine hydrochloride | C19H25ClN2S | Delayed | Delayed |
| Ethoxyquin | C14H19NO | Non-effect | Delayed |
| Exemestane | C20H24O2 | Slightly delayed | Delayed |
| Ezetimibe | C24H21F2NO3 | Slightly delayed | Delayed |
| Fenbendazole | C15H13N3O2S | Non-effect | Delayed |
| Fenoprofen calcium salt dihydrate | C30H30CaO8 | Slightly delayed | Delayed |
| Fentiazac | C17H12ClNO2S | Toxic lethal | Toxic lethal |
| Floxuridine | C9H11FN2O5 | Delayed | Toxic lethal |
| Flunixin meglumine | C21H28F3N3O7 | Delayed | Toxic lethal |
| Flutamide | C11H11F3N2O3 | Delayed | Toxic lethal |
| Fluticasone propionate | C25H31F3O5S | Non-effect | Delayed |
| Furosemide | C12H11ClN2O5S | Delayed | Delayed |
| Gatifloxacin | C19H22FN3O4 | Delayed | Delayed |
| Gemcitabine | C9H11F2N3O4 | Delayed | Delayed |
| Gemfibrozil | C15H22O3 | Delayed | Toxic lethal |
| Gestrinone | C21H24O2 | Delayed | Delayed |
| Haloprogin | C9H4Cl3IO | Delayed | Toxic lethal |
| Hexachlorophene | C13H6Cl6O2 | Delayed | Severe delayed |
| Hexestrol | C18H22O2 | Slightly delayed | Delayed |
| Ibudilast | C14H18N2O | Non-effect | Delayed |
| Idazoxan hydrochloride | C11H13ClN2O2 | Slightly delayed | Delayed |
| Idazoxan hydrochloride | C11H13ClN2O2 | Non-effect | Delayed |
| Idebenone | C19H30O5 | Severe delayed | Toxic lethal |
| Indomethacin | C19H16ClNO4 | Non-effect | Delayed |
| Ipriflavone | C18H16O3 | Delayed | Severe delayed |
| Isotretinoin | C20H28O2 | Non-effect | Severe delayed |
| Isradipine | C19H21N3O5 | Non-effect | Delayed |
| Lansoprazole | C16H14F3N3O2S | Slightly delayed | Delayed |
| Latanoprost | C26H40O5 | Non-effect | Delayed |
| Leflunomide | C12H9F3N2O2 | Delayed | Severe delayed |
| Letrozole | C17H11N5 | Non-effect | Delayed |
| Lithocholic acid | C24H40O3 | Non-effect | Delayed |
| Lodoxamide | C11H6ClN3O6 | Non-effect | Delayed |
| Lofepramine | C26H27ClN2O | Non-effect | Delayed |
| Loratadine | C22H23ClN2O2 | Delayed | Delayed |
| Loxapine succinate | C22H24ClN3O5 | Delayed | Delayed |
| Mebendazole | C16H13N3O3 | Severe delayed | Severe delayed |
| Mebendazole | C22H26N2O2 | Non-effect | Delayed |
| Meloxicam | C14H13N3O4S2 | Delayed | Toxic lethal |
| Methiazole | C12H15N3O2S | Delayed | Delayed |
| Mevastatin | C23H34O5 | Non-effect | Delayed |
| MK 801 hydrogen maleate | C20H19NO4 | Slightly delayed | Delayed |
| Nabumetone | C15H16O2 | Non-effect | Severe delayed |
| Naftopidil dihydrochloride | C24H30Cl2N2O3 | Slightly delayed | Delayed |
| Nandrolone | C18H26O2 | Delayed | Delayed |
| Naproxen sodium salt | C14H13NaO3 | Delayed | Delayed |
| Niclosamide | C13H8Cl2N2O4 | Delayed | Delayed |
| Nifekalant | C19H27N5O5 | Delayed | Delayed |
| Niflumic acid | C13H9F3N2O2 | Delayed | Delayed |
| Nimesulide | C13H12N2O5S | Non-effect | Delayed |
| Nisoldipine | C20H24N2O6 | Delayed | Toxic lethal |
| Nitazoxanide | C12H9N3O5S | Severe delayed | Severe delayed |
| Norethindrone | C20H26O2 | Non-effect | Delayed |
| Norgestimate | C23H31NO3 | Slightly delayed | Delayed |
| Oxfendazol | C15H13N3O3S | Slightly delayed | Delayed |
| Oxibendazol | C12H15N3O3 | Severe delayed | Severe delayed |
| Oxymetholone | C21H32O3 | Slightly delayed | Delayed |
| Parbendazole | C13H17N3O2 | Severe delayed | Severe delayed |
| Parthenolide | C15H20O3 | Non-effect | Delayed |
| Penciclovir | C10H15N5O3 | Non-effect | Delayed |
| Pentobarbital | C11H18N2O3 | Non-effect | Delayed |
| Phenazopyridine hydrochloride | C11H12ClN5 | Delayed | Toxic lethal |
| Phenothiazine | C12H9NS | Non-effect | Delayed |
| Phenoxybenzamine hydrochloride | C18H23Cl2NO | Non-effect | Delayed |
| Pizotifen malate | C23H27NO5S | Delayed | Severe delayed |
| Pramoxine hydrochloride | C17H28ClNO3 | Slightly delayed | Delayed |
| Prilocaine hydrochloride | C13H21ClN2O | Non-effect | Delayed |
| Primidone | C12H14N2O2 | Slightly delayed | Delayed |
| Racecadotril | C21H23NO4S | Slightly delayed | Delayed |
| Riluzole hydrochloride | C8H6ClF3N2OS | Non-effect | Delayed |
| Ritonavir | C37H48N6O5S2 | Non-effect | Severe delayed |
| S(-)Eticlopride hydrochloride | C17H26Cl2N2O3 | Delayed | Delayed |
| Salmeterol | C25H37NO4 | Non-effect | Delayed |
| Streptomycin sulfate | C42H84N14O36S3 | Non-effect | Delayed |
| Sulconazole nitrate | C18H16Cl3N3O3S | Delayed | Delayed |
| Tegafur | C8H9FN2O3 | Delayed | Delayed |
| Telmisartan | C33H30N4O2 | Severe delayed | Toxic lethal |
| Tenatoprazole | C16H18N4O3S | Non-effect | Delayed |
| Terbinafine | C21H25N | Non-effect | Delayed |
| Thimerosal | C9H9HgNaO2S | Non-effect | Delayed |
| Thiorphan | C12H15NO3S | Delayed | Delayed |
| Tolcapone | C14H11NO5 | Severe delayed | Severe delayed |
| Topotecan | C23H23N3O5 | Delayed | Delayed |
| Tracazolate hydrochloride | C16H25ClN4O2 | Severe delayed | Delayed |
| Tribenoside | C29H34O6 | Delayed | Delayed |
| Triclabendazole | C14H9Cl3N2OS | Delayed | Delayed |
| Triclosan | C12H7Cl3O2 | Delayed | Severe delayed |
| Trioxsalen | C14H12O3 | Delayed | Delayed |
| Troglitazone | C24H27NO5S | Severe delayed | Toxic lethal |
| Valproic acid | C8H16O2 | Non-effect | Delayed |
| Voriconazole | C16H14F3N5O | Non-effect | Delayed |
| Zardaverine | C12H10F2N2O3 | Slightly delayed | Delayed |
| Zuclopenthixol dihydrochloride | C22H27Cl3N2OS | Delayed | Delayed |
Table 3
Primary targets of the identified drugs.
| The identified drugs | Primary targets of the identified drugs |
|---|---|
| Hexachlorophene | D-Lactate dehydrogenase (D-LDH), not expressed in mammalian cells |
| Troglitazone | Agonist for peroxisome proliferator-activated receptor α and γ (PPARα and -γ) |
| Pizotifen malate | 5-Hydroxytryptamine receptor 2C (HTR2C) |
| Salmeterol | Adrenergic receptor beta 2 (ADRB2) |
| Nitazoxanide | Pyruvate ferredoxin oxidoreductase (PFOR), not expressed in mammalian cells |
| Valproic acid | Histone deacetylases (HDACs) |
| Dicumarol | NAD(P)H dehydrogenase quinone 1 (NQO1) |
| Loxapine succinate | Dopamine receptor D2 and D4 (DRD2 and DRD4) |
| Adrenosterone | Hydroxysteroid (11-beta) dehydrogenase 1 (HSD11β1) |
| Riluzole hydrochloride | Glutamate R and voltage-dependent Na+ channel |
| Naftopidil dihydrochloride | 5-Hydroxytryptamine receptor 1A (HTR1A) and α1-adrenergic receptor (AR) |
| S(-)Eticlopride hydrochloride | Dopamine receptor D2 (DRD2) |
| Racecadotril | Membrane metallo-endopeptidase (MME) |
| Ipriflavone | Unknown |
| Flurbiprofen | Cyclooxygenase 1 and 2 (Cox1 and -2) |
| Zardaverine | Phosphodiesterase III/IV (PDE3/4) |
| Leflunomide | Dihydroorotate dehydrogenase (DHODH) |
| Olmesartan | Angiotensin II receptor alpha |
| Disulfiram | Aldehyde dehydrogenase (ALDH) Dopamine β-hydroxylase (DBH) |
| Zuclopenthixol dihydrochloride | Dopamine receptors D1 and D2 (DRD1 and -2) |
Table 4
Effects of pharmacological inhibition of HTR2C on metastatic dissemination of MDA-MB-231 cells in zebrafish xenografted models.
Related to Figure 2D. The numbers and frequencies of the fish showing the dissemination patterns in vehicle- or pizotifen-treated group were indicated. The fish showed both patterns of dissemination were redundantly counted in this analysis.
| Experiment_#1 | Experiment_#2 | Experiment_#3 | Average of experiments | ||
|---|---|---|---|---|---|
| Drug: Vehicle Cell: MDA-MB-231 | Non-dissemination | 0% n1 = 0/17 | 0% n2 = 0/12 | 6.66% n3 = 1/15 | 2.22% ± 3.84% |
| Head | 58.82% n1 = 10/17 | 91.66% n2 = 11/12 | 6.66% n3 = 1/15 | 72.38% ± 17.15% | |
| Trunk | 52.94% n1 = 9/17 | 8.33% n2 = 1/12 | 20% n3 = 2/15 | 27.09% ± 23.13% | |
| End-tail | 100% n1 = 17/17 | 100% n2 = 12/12 | 86.66% n3 = 13/15 | 95.55% ± 7.69% | |
| Drug: Pizotifen Cell: MDA-MB-231 | Non-dissemination | 55% n1 = 11/20 | 31.57% n2 = 6/19 | 45.45 % n3 = 10/22 | 44.01% ± 11.77% |
| Head | 5% n1 = 1/20 | 31.57% n2 = 6/19 | 18.18% n3 = 4/22 | 18.25% ± 13.28% | |
| Trunk | 5% n1 = 1/20 | 10.52% n2 = 2/19 | 4.45% n3 = 1/22 | 6.69% ± 3.32% | |
| End-tail | 45% n1 = 9/20 | 57.89% n2 = 11/19 | 50% n3 = 11/22 | 50.96% ± 6.50% |
Table 5
Effects of pharmacological inhibition of HTR2C on metastatic dissemination of Mia-PaCa2 cells in zebrafish xenografted models.
Related to Figure 4. The numbers and frequencies of the fish showing the dissemination patterns in vehicle- or pizotifen-treated group were indicated. The fish showed both patterns of dissemination were redundantly counted in this analysis.
| Experiment_#1 | Experiment_#2 | Average of experiments | ||
|---|---|---|---|---|
| Drug: Vehicle Cell: MIA-PaCa2 | Non-dissemination | 17.64% n1 = 3/17 | 16.66% n2 = 2/12 | 17.15% + 0.69% |
| Head | 82.35% n1 = 14/17 | 66.66% n2 = 8/12 | 74.50% + 11.09% | |
| Trunk | 29.41% n1 = 5/17 | 8.33% n2 = 1/12 | 18.87% + 14.90% | |
| End-tail | 70.58% n1 = 12/17 | 83.33% n2 = 10/17 | 76.96% + 9.01 | |
| Drug: Pizotifen Cell: MIA-PaCa2 | Non-dissemination | 40% n1 = 4/10 | 52.63% n2 = 10/19 | 46.31% + 8.93% |
| Head | 20% n1 = 2/10 | 10.52% n2 = 2/19 | 15.26% + 6.69% | |
| Trunk | 10% n1 = 1/10 | 5.26% n2 = 1/19 | 7.63% + 3.34% | |
| End-tail | 40% n1 = 4/10 | 42.05% n2 = 8/19 | 41.4% + 1.48% |
Table 6
Effects of genetic inhibition of HTR2C on metastatic dissemination of MDA-MB-231 cells in zebrafish xenografted models.
Related to Figure 2E. The numbers and frequencies of the fish showing the dissemination patterns in the zebrafish that were inoculated with either shLacZ or shHTR2C MDA-MB-231 cells were indicated. The fish showed both patterns of dissemination were redundantly counted in this analysis.
| Experiment_#1 | Experiment_#2 | Average of experiments | ||
|---|---|---|---|---|
| shLacZ | Non-dissemination | 0% n1 = 0/10 | 0% n2 = 0/10 | 0% |
| Head | 60% n1 = 6/10 | 100% n2 = 10/10 | 80% ± 28.28% | |
| Trunk | 30% n1 = 3/10 | 10% n2 = 1/10 | 20% ± 14.14% | |
| End-tail | 80% n1 = 8/10 | 100% n2 = 10/10 | 90% ± 14.14 | |
| shHTR2C | Non-dissemination | 80% n1 = 12/15 | 76.84% n2 = 14/19 | 76.84 ± 4.46% |
| Head | 6.66% n1 = 1/15 | 15.78% n2 = 3/19 | 11.22% ± 6.45% | |
| Trunk | 6.66% n1 = 1/15 | 5.26% n2 = 1/19 | 5.96% ± 0.99% | |
| End-tail | 20% n1 = 3/15 | 26.31% n2 = 5/19 | 23.15% ± 4.46% |
Table 7
Effects of HTR2C overexpression on metastatic dissemination of MCF7 cells in zebrafish xenografted models.
Related to Figure 4E. The numbers and frequencies of the fish showing the dissemination patterns in the zebrafish that were inoculated with MCF7 cells expressing either vector control (VC) or HTR2C were indicated. The fish showed both patterns of dissemination were redundantly counted in this analysis.
| Experiment_#1 | Experiment_#2 | Average of experiments | ||
|---|---|---|---|---|
| VC | Non-dissemination | 46.15% n1 = 6/13 | 40% n2 = 4/10 | 43.07% ± 4.35% |
| Head | 46.15% n1 = 6/13 | 20% n2 = 2/10 | 33.07% ± 18.49% | |
| Trunk | 0% n1 = 0/13 | 0% n2 = 0/10 | 0% | |
| End-tail | 53.84% n1 = 7/13 | 60% n2 = 6/10 | 56.92% ± 4.35% | |
| HTR2C | Non-dissemination | 0% n1 = 0/14 | 0% n2 = 0/15 | 0% |
| Head | 100% n1 = 14/14 | 93.33% n2 = 14/15 | 96.66% ± 4.71% | |
| Trunk | 64.28% n1 = 9/14 | 73.33% n2 = 11/15 | 68.80% ± 6.39% | |
| End-tail | 85.71% n1 = 12/14 | 93.33% n2 = 14/15 | 89.52% ± 5.38% |
Key resources table
| Reagent type (species) or resource | Designation | Source or reference | Identifiers | Additional information |
|---|---|---|---|---|
| Strain, strain background (Zebrafish) | AB line | National University of Singapore | ||
| Strain, strain background (Zebrafish) | Tg (kdrl:eGFP) zebrafish | Provided by Dr Stainier | ||
| Strain, strain background (Mus musculus) | BALB/c | Charles River Laboratories | ||
| Cell line (Homo sapiens) | MDA-MB-231 | ATCC | HTB-26 | |
| Cell line (Homo sapiens) | MCF7 | ATCC | HTB-22 | |
| Cell line (Homo sapiens) | MDA-MB-435 | ATCC | HTB-129 | |
| Cell line (Homo sapiens) | MIA-PaCa2 | ATCC | CRM-CRL-1420 | |
| Cell line (Homo sapiens) | PC3 | ATCC | CRL-3471 | |
| Cell line (Homo sapiens) | SW620 | ATCC | CCL-227 | |
| Cell line (Homo sapiens) | PC9 | RIKEN BRC | RCB0446 | |
| Cell line (Homo sapiens) | HaCaT | CLI | 300493 | |
| Cell line (BALB/c Mus) | 4T1-12B | Provided from Dr Gary Sahagian | ||
| Antibody | PRMT1 (A33) (Rabbit polyclonal) | Cell Signaling Technology | Cat#_2449 | WB (1:1000) |
| Antibody | CYP11A1 (D8F4F) (Rabbit polyclonal) | Cell Signaling Technology | Cat#_14217 | WB (1:1000) |
| Antibody | E-cadherin (4A2) (Mouse monoclonal) | Cell Signaling Technology | Cat#_14472 | WB (1:1000) IF (1:100) |
| Antibody | EpCAM (VU1D9) (Mouse monoclonal) | Cell Signaling Technology | Cat#_2929 | WB (1:1000) IF (1:100) |
| Antibody | Vimentin (D21H3) (Rabbit polyclonal) | Cell Signaling Technology | Cat#_5741 | WB (1:1000) IF (1:100) |
| Antibody | N-cadherin (D4R1H) (Rabbit polyclonal) | Cell Signaling Technology | Cat#_13116 | WB (1:1000) IF (1:100) |
| Antibody | ZEB1 (D80D3) (Rabbit polyclonal) | Cell Signaling Technology | Cat#_3396 | WB (1:1000) |
| Antibody | Histone H3 (D1H2) (Rabbit polyclonal) | Cell Signaling Technology | Cat#_4499 | WB (1:1000) |
| Antibody | β-Tubulin (9F3) (Rabbit polyclonal) | Cell Signaling Technology | Cat#_2128 | WB (1:1000) |
| Antibody | GAPDH (14C10) (Rabbit polyclonal) | Cell Signaling Technology | Cat#_2118 | WB (1:1000) |
| Antibody | HTR2C (ab133570) (Rabbit polyclonal) | Abcam | Cat#_ab133570 | WB (1:1000) |
| Antibody | DRD2 (ab85367) (Rabbit polyclonal) | Abcam | Cat#_ab85367 | WB (1:1000) |
| Antibody | Phospho-GSK3β (Ser9) (F-2) (Mouse monoclonal) | Santa Cruz Biotechnology | Cat#_sc-373800 | WB (1:1000) |
| Antibody | GSK3β (1F7) (Mouse monoclonal) | Santa Cruz Biotechnology | Cat#_sc-53931 | WB (1:1000) |
| Antibody | KRT18 (DC-10) (Mouse monoclonal) | Santa Cruz Biotechnology | Cat#_sc-6259 | WB (1:1000) |
| Antibody | KRT19 (A53-B/A2) (Mouse monoclonal) | Santa Cruz Biotechnology | Cat#_sc-6278 | WB (1:1000) |
| Antibody | MMP1 (3B6) (Mouse monoclonal) | Santa Cruz Biotechnology | Cat#_sc-21731 | WB (1:1000) |
| Antibody | MMP2 (8B4) (Mouse monoclonal) | Santa Cruz Biotechnology | Cat#_sc-13595 | WB (1:1000) |
| Antibody | S100A4 (A-7) (Mouse monoclonal) | Santa Cruz Biotechnology | Cat#_sc-377059 | WB (1:1000) |
| Antibody | Luciferase (C-12) (Mouse monoclonal) | Santa Cruz Biotechnology | Cat#_sc-74548 | WB (1:1000) |
| Antibody | ki67 (ki-67) (Mouse monoclonal) | Santa Cruz Biotechnology | Cat#_sc-23900 | WB (1:1000) |
| Antibody | β-Catenin (E-5) (Mouse monoclonal) | Santa Cruz Biotechnology | Cat#_sc-7963 | WB (1:1000) IF (1:100) |
| Antibody | FITC-conjugated E-cadherin antibody (67A4) | Biolegend | Cat#_324104 | FACS (1:100) |
| Antibody | Anti-mouse anti-rabbit immunoglobulin G (IgG) antibodies conjugated to Alexa Fluor 488 | Life Technologies | A-11029 | IF (1:100) |
| Antibody | Anti-goat anti-rabbit immunoglobulin G (IgG) antibodies conjugated to Alexa Fluor 488 | Life Technologies | A-11034 | IF (1:100) |
| Recombinant DNA reagent | pLVX-shRNA1 | Clontech | Cat#_ 632,177 | |
| Recombinant DNA reagent | pCDH-CMV-MCS-EF1α-Hygro | System Biosciences | Cat#_CD515B-1 | Gene expression vector |
| Recombinant DNA reagent | pMDLg/pRRE | Addgene | Addgene Plasmid #12251 RRID:Addgene_12251 | Lentivirus packaging vector |
| Recombinant DNA reagent | pRSV-rev | Addgene | Addgene Plasmid #12253 RRID:Addgene_12253 | Lentivirus packaging vector |
| Recombinant DNA reagent | pMD2.G | Addgene | Addgene Plasmid #12259 RRID:Addgene_12259 | Lentivirus packaging vector |
| Recombinant DNA reagent | Providing pCMV-h5TH2C-VSV | Provided from Dr Herrick | ||
| Chemical compound, drug | FDA-approved chemical libraries | Prestwick Chemical | ||
| Chemical compound, drug | Pizotifen | Santa Cruz Biotechnology | Cat#_sc-201143 | |
| Chemical compound, drug | S(-)Eticlopride hydrochloride | Santa Cruz Biotechnology | Cat#_E101 | |
| Software, algorithm | GraphPad Prism7 | GraphPad Software Inc | RRID:SCR_002798 | Data analysis |
| Software, algorithm | FlowJo | BD Biosciences | RRID:SCR_008520 | FACS data analysis |
Additional files
-
Transparent reporting form
- https://cdn.elifesciences.org/articles/70151/elife-70151-transrepform1-v4.docx
-
Source data 1
GSEA analysis of zebrafish embryos at either 50%-epiboly, shield or 75%-epiboly stage.
- https://cdn.elifesciences.org/articles/70151/elife-70151-data1-v4.xlsx
-
Source data 2
Enriched pathways of zebrafish embryos at either 50%-epiboly, shield or 75%-epiboly stage.
- https://cdn.elifesciences.org/articles/70151/elife-70151-data2-v4.xlsx
-
Source data 3
Raw data of western-blotting analysis.
- https://cdn.elifesciences.org/articles/70151/elife-70151-data3-v4.zip
-
Source data 4
Raw data of western-blotting analysis with legends.
- https://cdn.elifesciences.org/articles/70151/elife-70151-data4-v4.docx
Download links
A two-part list of links to download the article, or parts of the article, in various formats.
Downloads (link to download the article as PDF)
Open citations (links to open the citations from this article in various online reference manager services)
Cite this article (links to download the citations from this article in formats compatible with various reference manager tools)
A zebrafish embryo screen utilizing gastrulation identifies the HTR2C inhibitor pizotifen as a suppressor of EMT-mediated metastasis
eLife 10:e70151.
https://doi.org/10.7554/eLife.70151


