Intrinsic mechanisms in the gating of resurgent Na+ currents
- Departments of Medicine, Cardiovascular Division, Washington University, United States
- Developmental Biomedical Engineering, Washington University, United States
- Developmental Biology, Washington University, United States
Figures
Figure 1
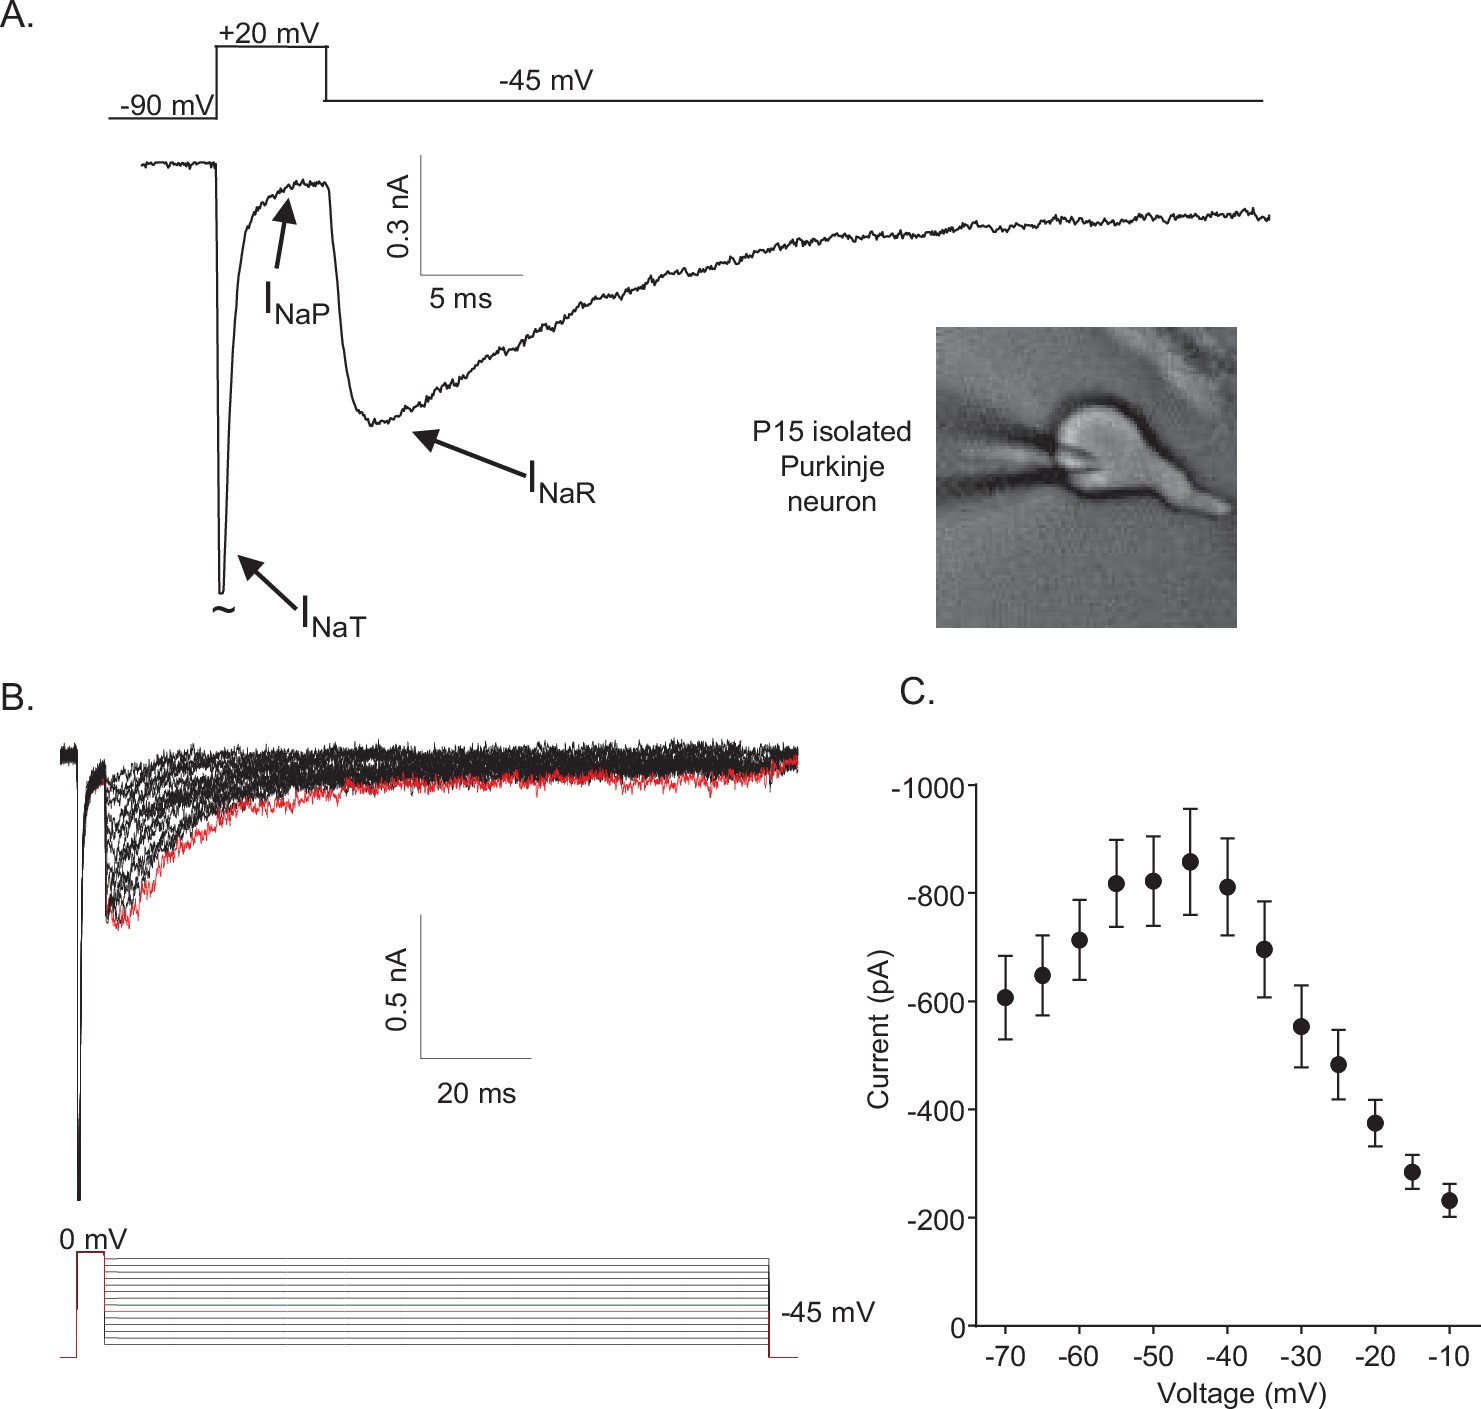
Mouse cerebellar Purkinje neurons express three voltage-gated sodium (Nav) current components.
(A) Representative recording of the transient (INaT), persistent (INaP), and resurgent (INaR) components of the Nav currents in an isolated neonatal mouse cerebellar Purkinje neuron. The voltage-clamp paradigm is displayed above the current record, and the labelled arrows indicate the three Nav current components. (B) INaR waveforms, recorded during hyperpolarizing voltage steps to various potentials ranging from –70 to –10 mV, following 5 ms depolarizing voltage steps to 0 mV from a holding potential (HP) of –80 mV; the voltage-clamp paradigm is shown below the current records. The current record highlighted in red was recorded during the –45 mV hyperpolarizing voltage step (also indicated in red in the illustrated voltage-clamp paradigm). (C) Mean ± SEM (n = 15) peak INaR amplitudes are plotted as a function of the hyperpolarizing test potential; the peak INaR is recorded at approximately –45 mV.
Figure 2
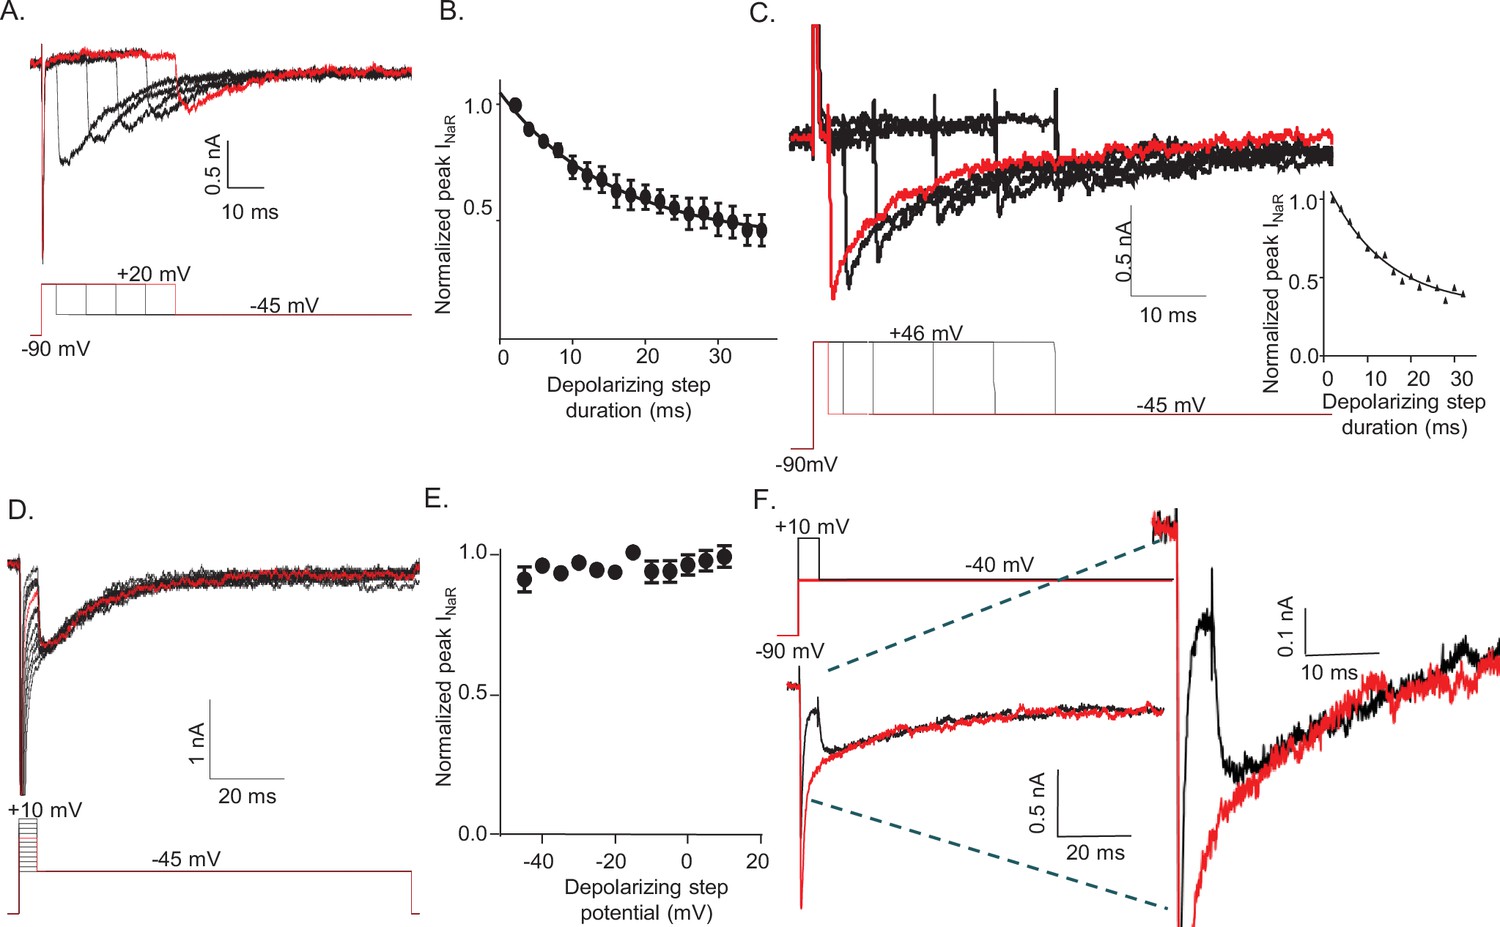
The amplitude of resurgent voltage-gated sodium current (INaR) is determined by the duration of the prior membrane depolarization.
(A) In a neonatal mouse cerebellar Purkinje neuron, INaR was revealed on membrane hyperpolarizations following depolarizing voltage steps to +20 mV of varying durations; the voltage-clamp paradigm is shown below the current records. (B) Peak INaR amplitudes, evoked at –45 mV following each depolarizing voltage step to +20 mV, were measured and normalized to the maximal peak INaR (measured in the same cell). The mean ± SEM (n = 12) normalized peak INaR amplitudes are plotted as a function of the duration of the depolarizing voltage step. The attenuation of peak INaR as a function of the duration of the depolarizing voltage step was well described by a single exponential with a mean ± SEM time constant of 15.5 ± 0.5 ms (n = 12). (C) The dependence of INaR on the duration of the depolarizing voltage step was also measured with reduced (50 mM) extracellular and increased intracellular (15 mM) sodium, resulting in a Na+ reversal potential of +30 mV. Under these conditions, depolarizing voltage steps to +46 mV evoked outward INaT. Peak INaR amplitudes, revealed during hyperpolarizing voltage steps to –45 mV, however, were also found to vary as a function of the duration of the depolarizing voltage step, revealing that INaR and the time-dependent attenuation of INaR are not affected by the direction (inward versus outward) of Na+ flux during the depolarizing voltage step. The peak amplitudes of INaR, evoked at –45 mV following each depolarizing voltage step, were measured in each cell and normalized to the maximal INaR amplitude (in the same cell). As is evident from the representative records and the plot of normalized peak INaR amplitudes (on the right), the attenuation of INaR as a function of the duration of the depolarizing voltage steps to +46 mV is also well described by a single exponential with a mean ± SEM time constant of 13.8 ± 1.1 ms (n = 6), a value similar to that observed when INaT was inward (B). (D) Representative INaR waveforms, recorded directly on repolarizations to –45 mv following 5 ms depolarizations to various membrane potentials from a –90 mV HP, are shown; the voltage-clamp protocol is shown below the current records. (E) The mean ± SEM (n = 6) normalized peak INaR amplitudes are plotted as a function of potential of the depolarizing voltage step. (F) Representative voltage-clamp recordings of Nav currents evoked (in the same cell) on direct depolarization to –40 mV from an HP of –90 mV (red) and on hyperpolarization to –40 mV following a 5 ms depolarizing voltage step to +10 mV (black) from the same HP; the voltage-clamp protocols are shown above the current records and the currents are shown on an expanded scale on the right. In panels A, C, D, and F, the currents in red were recorded during the voltage-clamp paradigms (shown below or above) depicted in red.
Figure 3
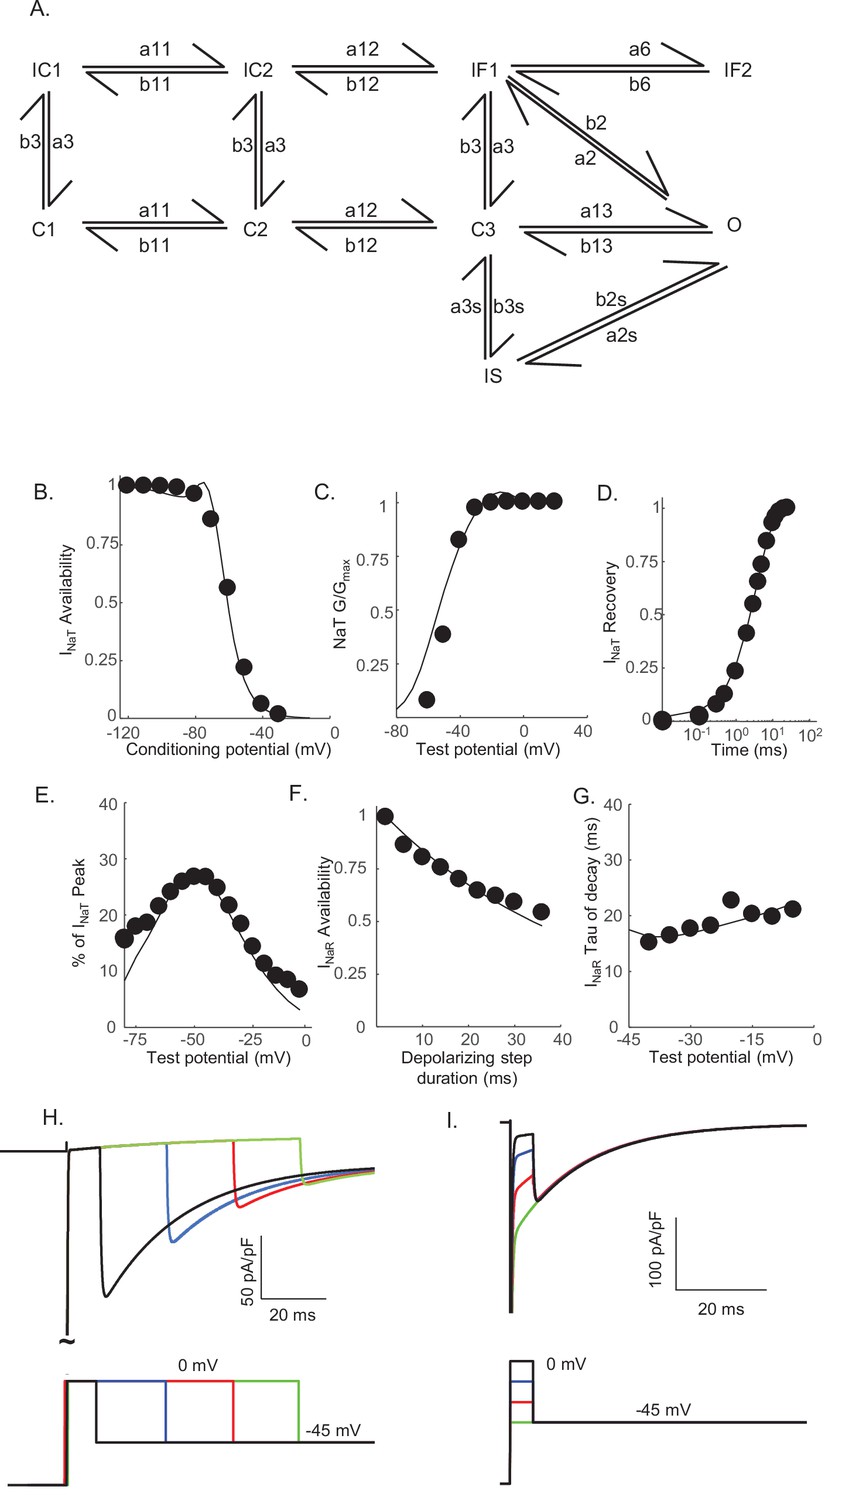
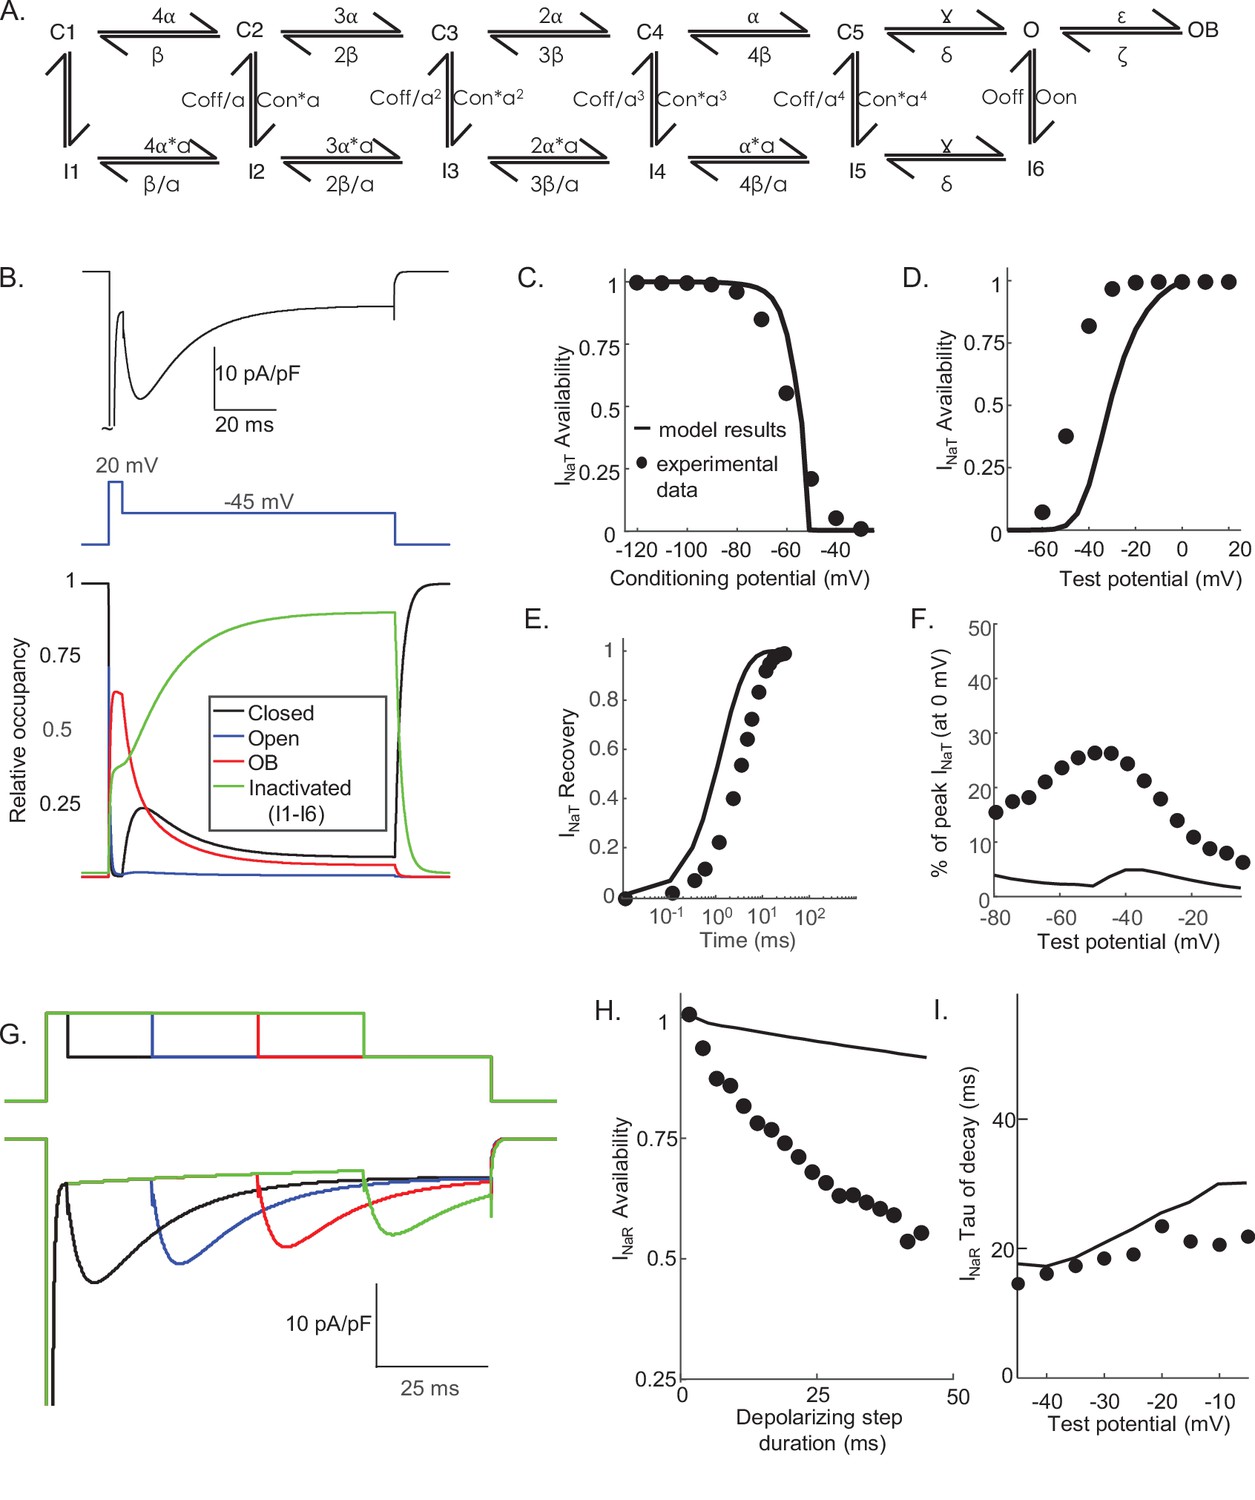
Novel Markov kinetic state model of voltage-gated sodium (Nav) channel gating in cerebellar Purkinje neurons.
A novel Markov kinetic state model was developed with parallel fast inactivating (IF1, IF2) and slow inactivating (IS) gating pathways (A). The model was numerically optimized (see Materials and methods) by simulating the data generated using voltage-clamp protocols identical to those used in the experiments to determine the detailed time- and voltage-dependent properties of the Nav currents in cerebellar Purkinje neurons. The various rate constants in the model were numerically optimized to recapitulate the measured properties of INaT, INaP, and INaR including the voltage dependences of steady-state inactivation (B) and activation (C) of INaT, and the kinetics of INaT recovery from inactivation (D). The model also reproduces the measured properties of INaR, including the magnitude of INaR relative to INaT (E), the attenuation of the peak INaR amplitude as a function of the duration of the depolarizing voltage steps (F), and the kinetics of the decay (inactivation) of peak INaR amplitudes (G). Filled circles represent the mean experimental data and the lines represent the results of the simulation. The model successfully reproduces the observed, time-dependent attenuation of peak INaR amplitudes that is evident experimentally on membrane hyperpolarizations following depolarizing voltage steps of varying durations (H), and the finding that the peak amplitude of INaR is not affected by the potential of the depolarizing voltage step (I).
Figure 4 with 1 supplement
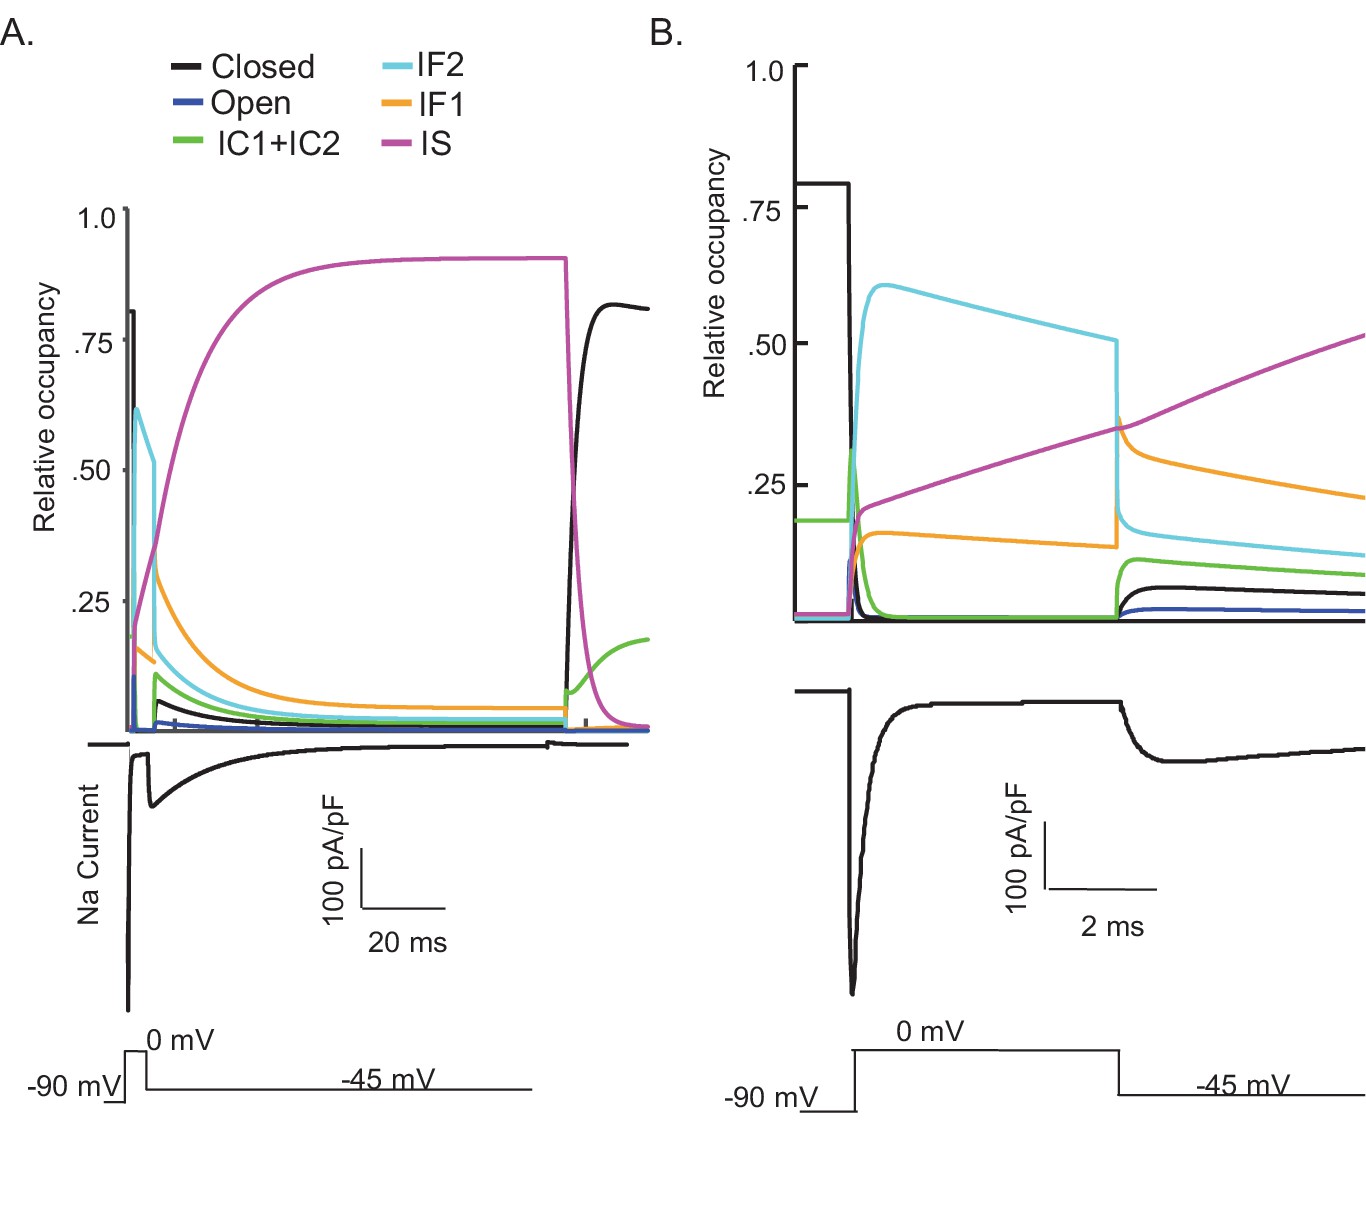
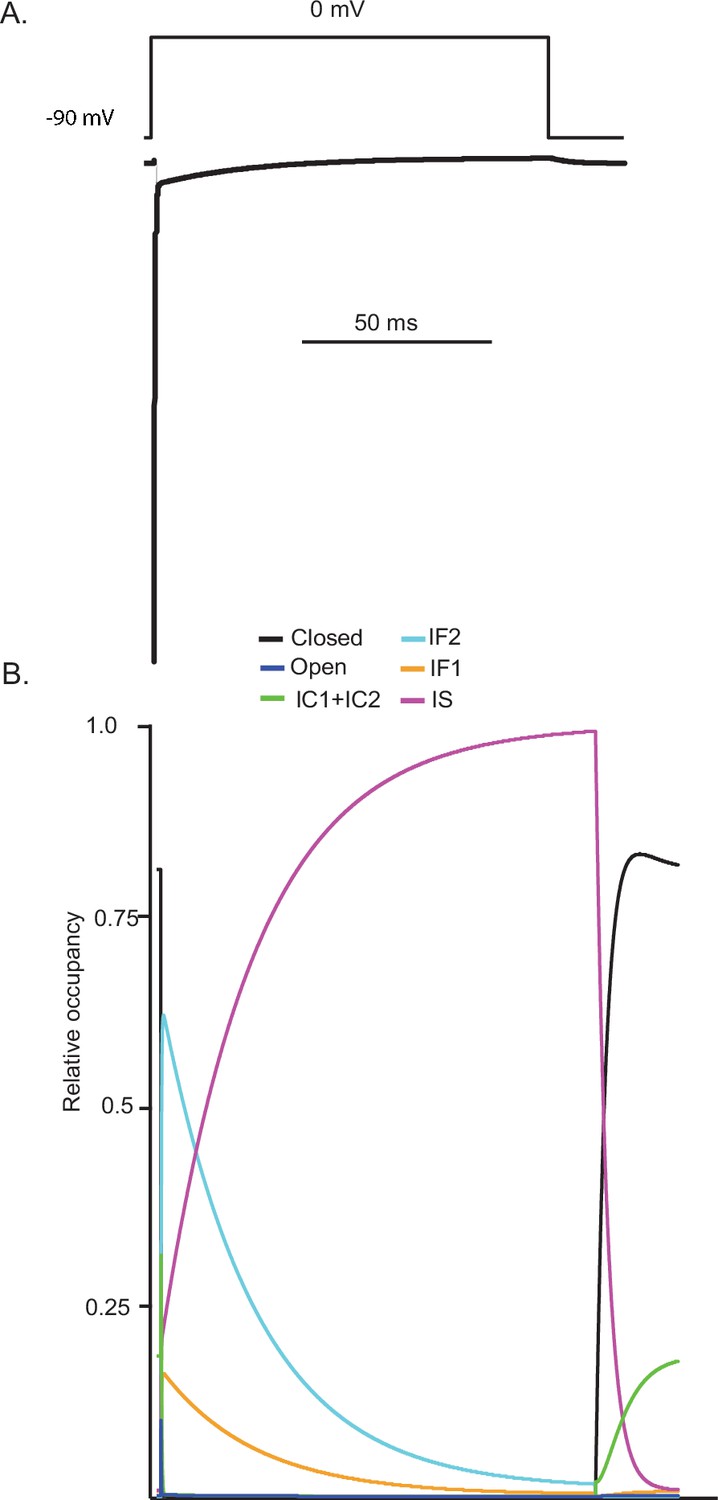
Kinetic state transitions during voltage-clamp simulations that evoke voltage-gated sodium current (INaR).
There are two parallel pathways of voltage-gated sodium (Nav) channel inactivation (IF1/IF2 and IS) in the novel Markov kinetic state model developed here (Figure 3). The occupancies of these states and of the other (i.e., closed, open, etc.) channel gating states during a simulated voltage-clamp protocol, in which INaR is revealed on membrane hyperpolarization to –45 mV following a brief (5 ms) depolarizing voltage step to 0 mV from a holding potential of –90 mV, are plotted as a function of time in (A). The simulated voltage-clamp records and the experimental paradigm are illustrated below the gating state occupancy plot. Expanded (in time) views of the gating state occupancies and the simulated Nav currents are presented in (B). In the gating state occupancy plots, black represents the closed state, blue represents the open state, green represents the IC1+ IC2 states, aqua represents the IF2 state, orange represents the IF1 state, and purple represents the IS state.
Figure 4—figure supplement 1
Simulations reveal that, similar to hyperpolarizing voltage steps, prolonged depolarization results in the accumulation of voltage-gated sodium (Nav) channels in the IS state.
Using the novel Markov model developed here (Figure 3A), a prolonged depolarizing voltage step to 0 mV produces a rapidly activating Nav current with two kinetically distinct inactivating components (A). The gating state occupancy plot (B) reveals that Nav channels transition first into the IF2 state (aqua) and subsequently into the IS state (orange).
Figure 5
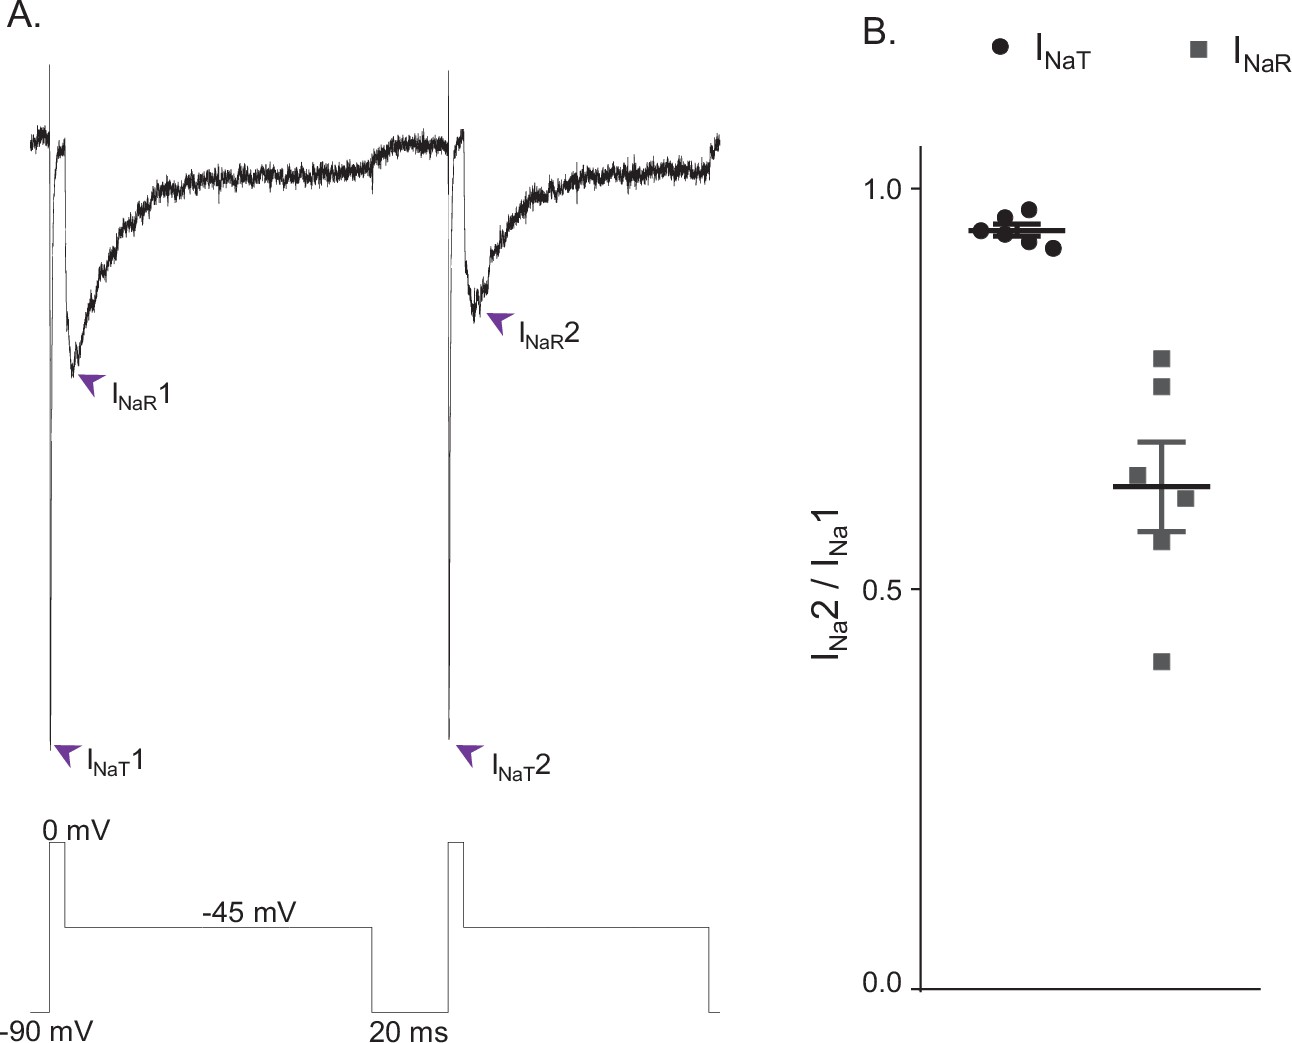
INaR and INaT display distinct rates of recovery from inactivation.
(A) Representative voltage-gated sodium (Nav) currents recorded in a mouse cerebellar Purkinje neuron during a voltage-clamp paradigm designed to determine if the relative rates of recovery from inactivation of INaT and INaR are distinct. Inward Nav currents were recorded during sequential and identical voltage-clamp steps (to 0 mV for 5 ms and to –45 mV for 100 ms), separated by a brief (20 ms) hyperpolarizing step to –90 mV; the voltage-clamp paradigm is shown below the current records. As is evident, the amplitude of INaR (at –45 mV) during the second voltage-clamp step to –45 mV was attenuated more than INaT (during the second step to 0 mV). Similar results were obtained in five additional Purkinje neurons using the voltage-clamp paradigm shown. (B) Plot of the relative peak INaT (circles) and peak INaR (squares) amplitudes measured during the second voltage-clamp steps (to 0 and –45 mV), compared with the first. As is evident, the relative amplitude of INaR is reduced (0.63 ± .05; n = 6) to a greater extent (paired Student’s t-test; p = .00039) than INaT (0.95 ± 0.01; n = 6). The mean ± SEM (n = 6) relative INaT and INaR amplitudes are also indicated.
Figure 6

Voltage dependences of activation of INaR and INaP are indistinguishable.
(A) To test the hypothesis that non-inactivating voltage-gated sodium (Nav) channels underlie INaR, a depolarizing voltage ramp (blue) protocol (from –100 to 0 mV at 0.12 mV/ms) and a steady-state voltage step (green) protocol (with depolarizations from a holding potential of –100 mV to test potentials ranging from –75 to 10 mV in 5 mV increments) were used to reveal the magnitude and voltage-dependent properties of the non-inactivating (persistent) component of the Nav current, INaP. In addition, a hyperpolarizing voltage ramp (from 0 to –100 mV at 0.12 mV/ms or dV/dt) was used to reveal both INaR and INaP. Note that as INaR decays (see Figure 2B) during the hyperpolarizing voltage-ramp, the relative amplitudes of INaR and INaP vary during the ramp; the sum of the two current components, not the amplitudes of the individual components, therefore, are measured. The three representative records shown were obtained from the same Purkinje neuron. (B) The current-voltage relationships, derived from the records presented in (A) are plotted (in the corresponding color). From the records shown in the lowest panel of (A), the amplitudes of the steady-state inward currents at 25 ms at each test potential are plotted as points (green); the current amplitudes determined (at 2 ms intervals) from the ramp protocols (red and blue traces) are also plotted. As is evident, the current-voltage relations of the Nav currents recorded using the three different voltage-clamp protocols overlap; the magnitudes of the inward Nav currents are also indistinguishable. Similar results were obtained in four additional Purkinje neurons.
Figure 7
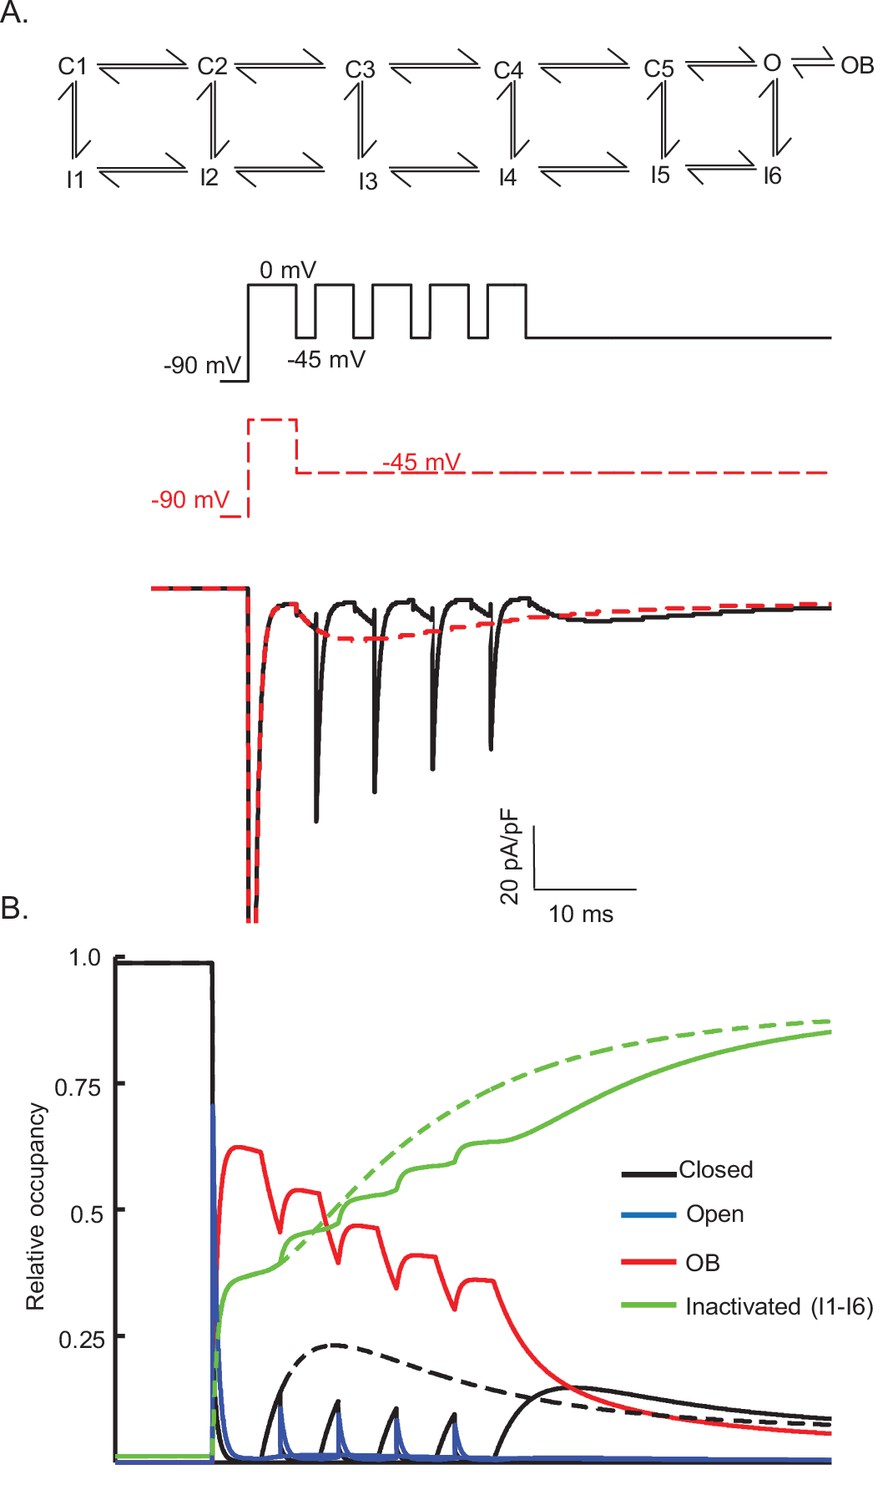
Simulations using the Raman-Bean model of voltage-gated sodium (Nav) channel gating do not recapitulate the acquired voltage-clamp data.
(A) The previously described Markov kinetic state model of Nav channel gating in mouse cerebellar Purkinje neurons (Raman and Bean, 2001) is illustrated. (B) Representative simulated inward Nav current waveforms, produced by this (A) model using the voltage-clamp paradigm shown below the current records, are presented. The time-matched normalized occupancies of the combined closed (C1–C5, shown in black), open (O, shown in blue), open-blocked (OB, shown in red), and combined inactivated (I1–I6, shown in green) gating states are plotted below the voltage protocol. (C–E) Comparisons of the time- and voltage-dependent properties of INaT derived from simulations using the model in (A) with (our) experimental data obtained in recordings from mouse cerebellar Purkinje neurons (the same data as were used to generate the results in Figure 3); filled circles represent the mean experimental data and the lines represent the results of the simulations. (F) Relative INaR amplitudes (normalized to peak INaT at 0 mV) are plotted as a function of the hyperpolarizing test potential. (G) Simulated INaR waveforms, produced on membrane hyperpolarizations to –45 mV following depolarizing voltage steps to +20 mV of varying durations, are shown. (H) Peak normalized INaR amplitudes (at –45 mV), derived from the simulations in (G), are plotted as a function of the duration of the prior +20 mV depolarizing voltage step (solid line), together with the mean experimental data (filled circles) obtained in recordings from mouse cerebellar Purkinje neurons (the same data as used to generate the results in Figure 3). (I) The kinetics of INaR decay, derived from single exponential fits to the decay phases of the currents recorded at various membrane potentials, are presented in (I); the solid lines indicate the results of the simulations, and the filled circles are the mean experimental data obtained in recordings from mouse cerebellar Purkinje neurons (the same data as used to generate the results in Figure 3).
Figure 8 with 1 supplement
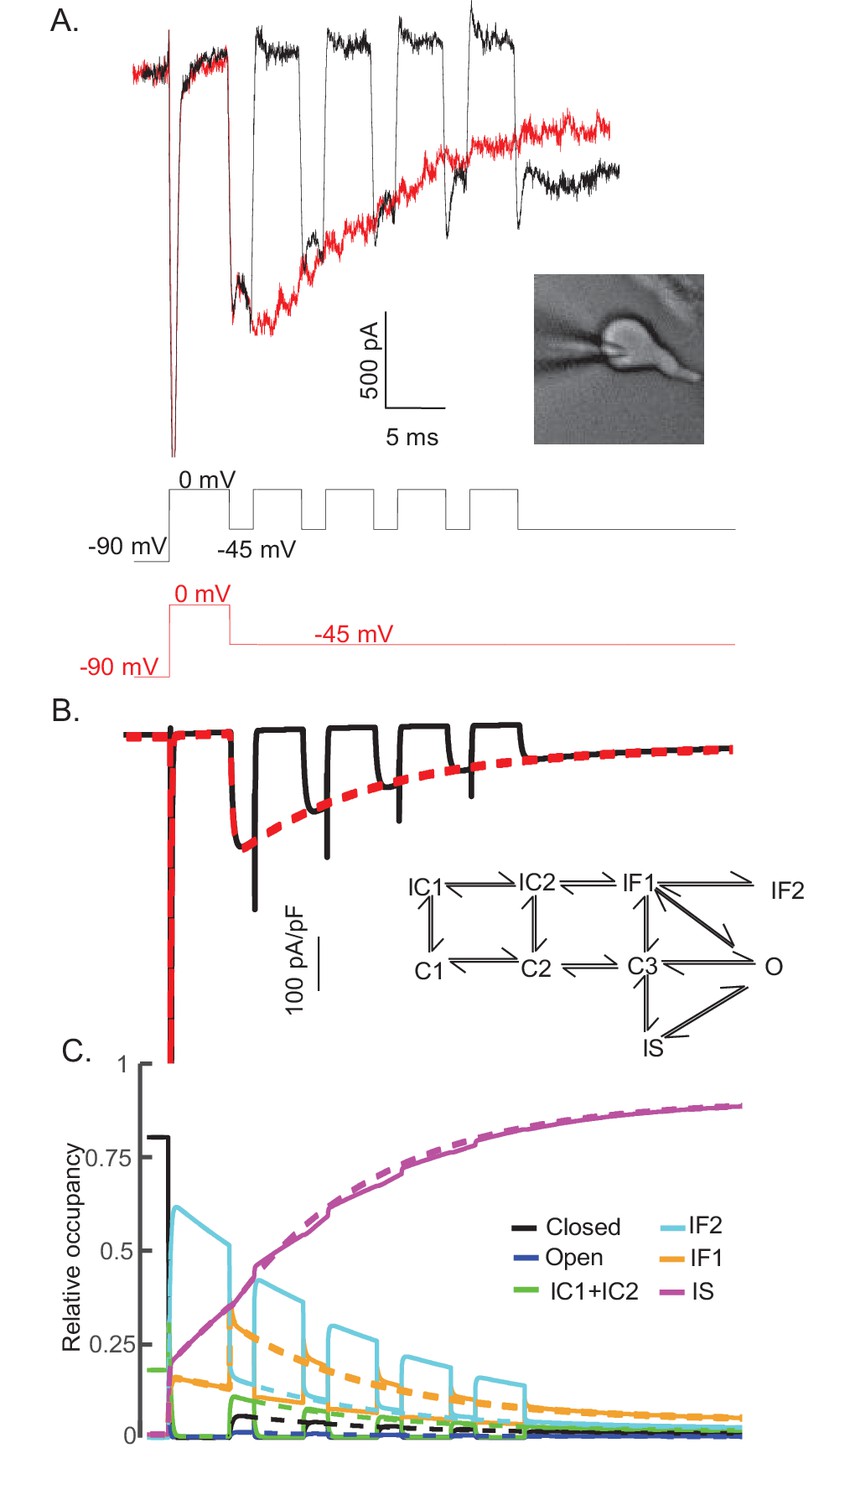
The time course and amplitude of INaR are recapitulated during repetitive brief depolarizing steps.
To determine if two competing inactivation states underlie the observed differences in INaT and INaR recovery from inactivation (illustrated in Figure 5), a protocol was developed to allow direct comparison of INaR recorded during a single (80 ms) hyperpolarizing voltage step to –45 mV (red), presented following a brief (5 ms) depolarization to 0 mV, with INaR recorded (in the same cell) at –45 mV during successive brief (2 ms) hyperpolarizing voltage steps interspersed with brief (5 ms) depolarizations to 0 mV (black). Representative records are shown in (A); the voltage-clamp paradigms are illustrated below the current records. Similar results were obtained in four additional Purkinje neurons. As is evident (A), the envelope of the currents generated using these two protocols superimpose, suggesting that the inactivation pathway responsible for INaR decay does not compete with fast inactivation. (B) Simulated current waveforms, generated using the same two voltage-clamp protocols illustrated in (A) with the novel kinetic state model presented in Figure 3A, are shown. (C) Gating state occupancies for simulated current traces are shown with black representing the closed state, blue representing the open state, green representing the IC1+ IC2 states, aqua representing the IF2 state, orange representing the IF1 state, and purple representing the IS state. For direct comparison of the results of the simulations using the voltage-clamp protocols illustrated in (A) with the Raman-Bean gating model (2001), see Figure 8—figure supplement 1.
Figure 8—figure supplement 1
Gating state occupancies/transitions produced in the Raman-Bean model (with the voltage-clamp protocols used in Figure 8).
The Raman-Bean model (presented in Figure 7A) does not reproduce the Nav currents recorded from a Purkinje neuron that is depolarized (to 0 mV) and repolarized (to –45 mV) repeatedly (see Figure 8A); the voltage-clamp protocol and the simulated currents produced are shown in (A) as solid black lines. Nav current waveforms, simulated using the Raman-Bean model, in response to a sustained hyperpolarization to –45 mV following a brief (5 ms) depolarizing voltage step to 0 mV are also shown; the voltage-clamp protocol and the simulated currents are shown in (A) as dashed red lines. The gating state occupancy plot (B), presented on the same time scale as the voltage-clamp records, is shown; colors denote the various kinetic states with black representing the closed state, blue representing the open state, red representing the open-blocked (OB) state, and green representing the inactivated (I1–I6) states. The dashed lines are the gating state transitions associated with the dashed (red) current records in (A), and the solid lines are the gating state transitions associated with the solid (black) current records in (A).
Figure 9

Promoting entry into the slow-inactivated state reduces voltage-gated sodium current (INaR) amplitudes.
(A) Mean ± SEM peak INaR amplitudes, measured on membrane hyperpolarizations following brief depolarizing voltage steps to +10 mV, in wild type (black) and Scn4b-/- (red) mouse cerebellar Purkinje neurons are plotted as a function of membrane voltage are shown (data were reproduced with permission from Ransdell et al., 2017). Peak INaR amplitudes in individual wild type and Scn4b-/- cells were also normalized to peak INaT measured (at 0 mV) in the same cell, and the mean INaR as a percentage of peak INaT in wild type (black) and Scn4b-/- (red) cells are plotted (as points) in (B); the solid line is the normalized relative INaR/INaT generated by the Scn4b-/- model. (C) Consistent with the experimental data, the kinetics of INaR are not affected measurably by the loss of Scn4b (Navβ4) in the model, whereas INaR amplitudes are reduced to ~50% of wild type INaR levels (C). A time-locked plot of the gating state transitions (D) indicates that INaR amplitudes are reduced in the Scn4b-/- model (dashed lines) due to a decrease in IF2 occupancy and an increase in IS occupancy. In this gating state occupancy plot, black represents the closed state, blue represents the open state, green represents the IC1+ IC2 states, aqua represents the IF2 state, orange represents the IF1 state, and purple represents the IS state.
Author response image 1
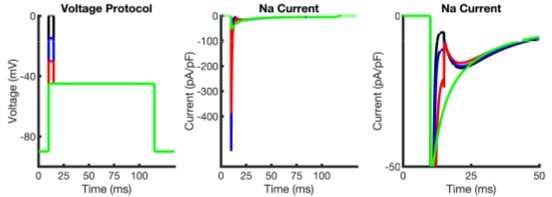
Simulations of INaR following membrane depolarizations to different voltages using the open-blocked model.
Left: voltage protocol indicating a 0 mV (black), -15 mV (blue), -30 mV (red), -45 mV (green) depolarization for 5 ms from a membrane potential of -90 mV. Middle: Simulated Nav current traces. Right: A zoomed in view of the simulated Nav currents reveals that the open-blocked model produces resurgent currents quite different from those observed experimentally (Figure 2A); compare with the results of the novel model generated here (Figure 3I). Additionally, INaR inactivation in this (open-blocked) model appears to show some voltage dependence, which is also not observed in our model (Figure 3I).
Author response image 2

Additional files
Download links
A two-part list of links to download the article, or parts of the article, in various formats.
Downloads (link to download the article as PDF)
Open citations (links to open the citations from this article in various online reference manager services)
Cite this article (links to download the citations from this article in formats compatible with various reference manager tools)
Intrinsic mechanisms in the gating of resurgent Na+ currents
eLife 11:e70173.
https://doi.org/10.7554/eLife.70173


