An improved fluorescent noncanonical amino acid for measuring conformational distributions using time-resolved transition metal ion FRET
- Department of Physiology and Biophysics, University of Washington, United States
- Department of Chemistry, University of Pennsylvania, United States
- Biochemistry and Molecular Biophysics Graduate Group, University of Pennsylvania, United States
- Department of Biochemistry and Biophysics, Oregon State University, United States
Figures
Figure 1 with 1 supplement
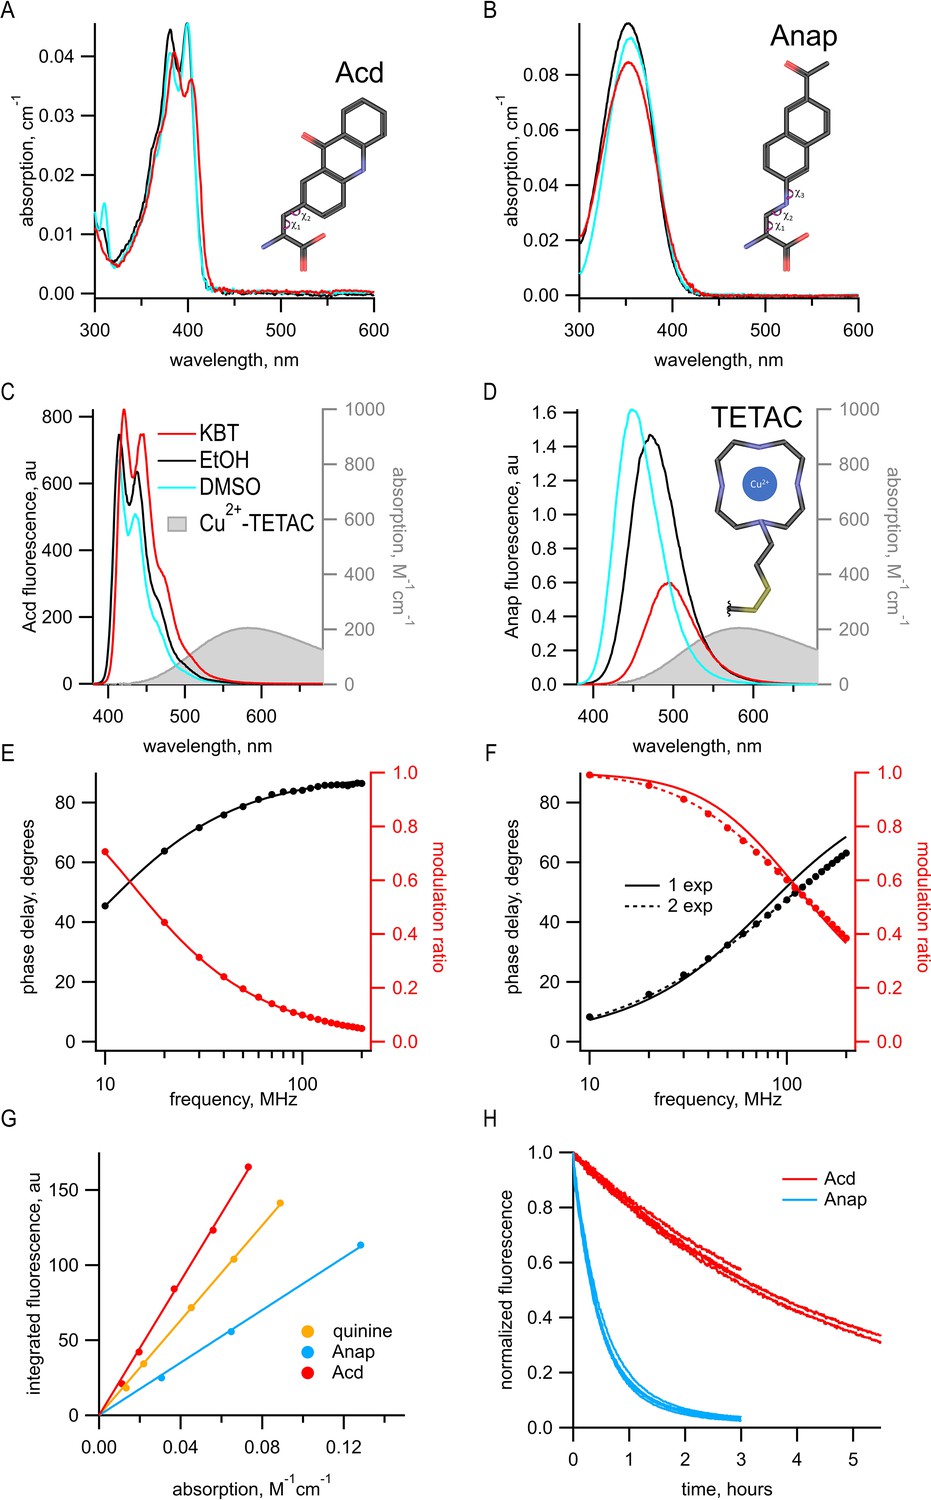
Acd has improved photophysical properties compared to Anap.
(A, B) Absorption spectra of (A) Acd and Anap (B) in aqueous solution (KBT; red), EtOH (black), and DMSO (cyan), with the structures of the amino acids, inset. (C, D). Emission spectra in response to 370 nm excitation (left axis) and absorption spectrum of Cu2+-TETAC (right axis) in KBT for Acd (C) and Anap (D). Color scheme is the same as (A), but with Cu2+-TETAC spectrum in gray. (E, F) Frequency-domain measurements of fluorescence lifetime of Acd (E) and Anap (F) measured in KBT. Black: phase delay in degrees; red: modulation ratio. Curves are fits with Equations 5 and 6 corrected by Equations 13 and 14. Fit parameters for (E) are = 16.1 ns and for (F) are = 2.0 ns for a single exponential (solid curve) and = 1.3 ns, = 3.3 ns, and α1 = 0.76 (dashed curve). See Table 1 for collected data. (G) Quantum yield for Acd (red) and Anap (blue) was determined relative to quinine in 0.5 M H2SO4 (gold), as described in Materials and methods. Solid lines are fits with a line through the origin. (H) Acd (red) is more resistant to photobleaching than Anap (blue). For Acd, excitation at 380 nm with 14.7 nm slits and emission at 450 nm with 1 nm slit. For Anap, excitation at 350 nm with 14.7 nm slits and emission at 490 nm with 1 nm slit. Note that the Acd excitation light was ~38% brighter than the Anap excitation light. For both Acd and Anap, four independent experiments were each fit with a single exponential. The mean time constants ± SEM were 18,000 ± 863 s (n = 4) for Acd and 1838 ± 52 s (n = 4) for Anap.
Figure 1—figure supplement 1
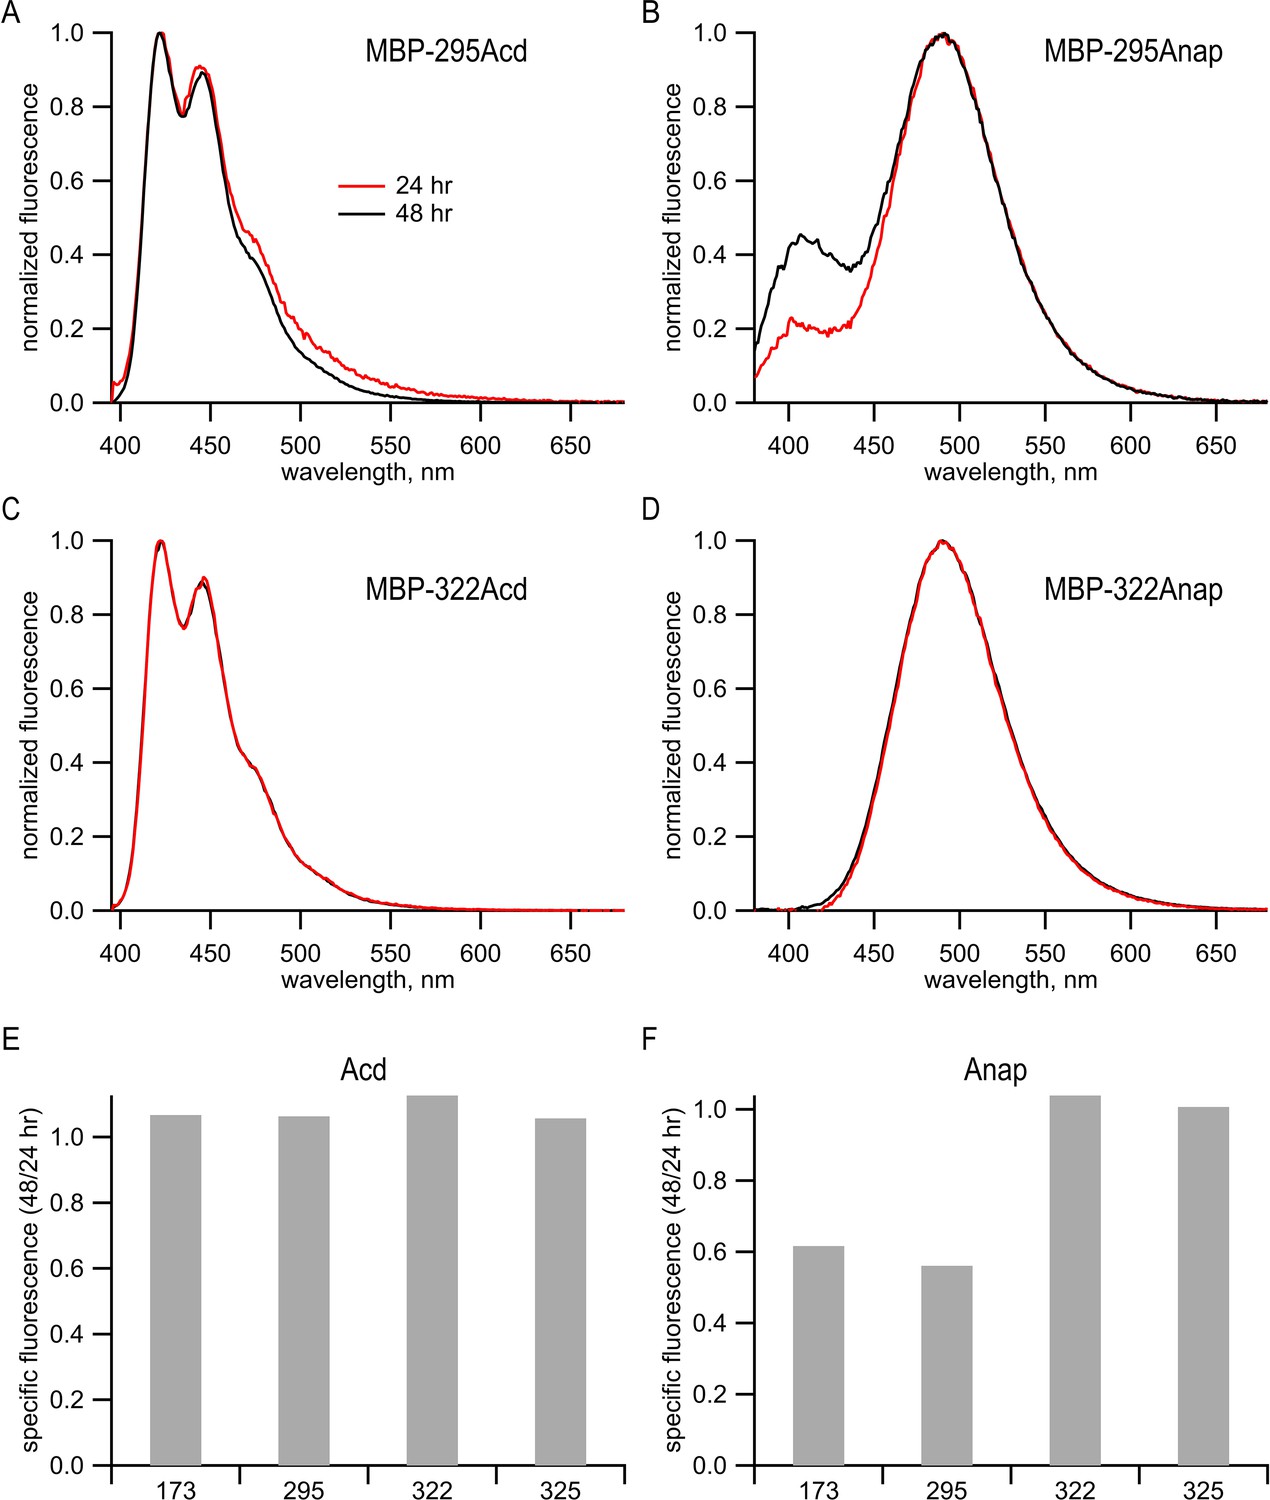
Anap, but not Acd, appeared to undergo a site-specific chemical change in cells.
(A–D) Emission spectra of purified protein recorded in 6 M guanidinium HCl in KBT for (A) MBP-295Acd, (B) MBP-295Anap, (C) MBP-322Acd, and (D) MBP-322Anap. For Acd, samples were excited at 385 nm, with 5 nm slits, and emission was recorded with 5 nm slits. For Anap, samples were excited at 350 nm with 5 nm slits and emission was recorded with 5 nm slits. Red traces represent samples harvested from cells 24 hr post-transfection, and black traces represent samples harvested from cells 48 hr post-transfection. (E, F) Peak fluorescence intensities from fluorescence size exclusion chromatography for (E) Acd or (F) Anap were normalized to the peak tryptophan absorption at 280 nm of the same protein in the same fluorescence size-exclusion chromatography run (see Figure 2G,H). Data from cells harvested at 48 hr post-transfection were normalized to the data from cells harvested at 24 hr post-transfection. The numbers under each bar represent the position of the TAG stop codon into which Acd or Anap were incorporated. It should be noted that no truncated protein was observed in the tryptophan absorption channel (see Figure 2H). Our interpretation of these data is discussed below. Analysis of the emission spectra of Acd and Anap incorporated into MBP revealed a problem with some Anap-containing proteins that were not present in Acd-containing proteins. MBP constructs containing either Acd or Anap were expressed and purified as described in Materials and methods. The Acd emission spectra of MBP-295Acd and MBP-322Acd in denaturing solution (6 M guanidine HCl) were very similar to the emission spectrum of free Acd (Figure 1A,C). However, the emission spectrum of MBP-295Anap in denaturing solution was very different from that of free Anap (compare Figure 1B,D). Whereas the emission of free Anap exhibits a single peak at 495 nm in aqueous solution, the emission of MBP-295Anap exhibits two peaks, one at 495 nm and the other at 405 nm. Furthermore, the proportion of the 405 nm peak increased with time in culture between 24 and 48 hr. (B). The altered emission spectrum persisted after protein purification and remained stable. The finding that the emission spectrum was altered even in denaturing solution and changed over the course of days in culture suggests that it was not simply due to a change in the local environment of Anap in MBP-295Anap, but due to a chemical change of the fluorophore. To further explore the nature of the problem with Anap incorporated into MBP, we determined the emission spectrum and specific fluorescence of Anap introduced into multiple sites of MBP. Unlike MBP-295Anap, MBP-322Anap had an emission spectrum in denaturing solution that was very similar to that of free Anap and was not affected by time in culture (D). For two of the four MBP sites we tested, the specific fluorescence of Anap decreased dramatically between 24 and 48 hr in culture (F). No decrease was observed for Acd incorporated into MBP at the same positions (E). Therefore, it appears that, for some Anap-containing proteins, Anap underwent a chemical change inside the cell that dramatically decreased it brightness. This is a problem not seen with Acd constructs.
Figure 2
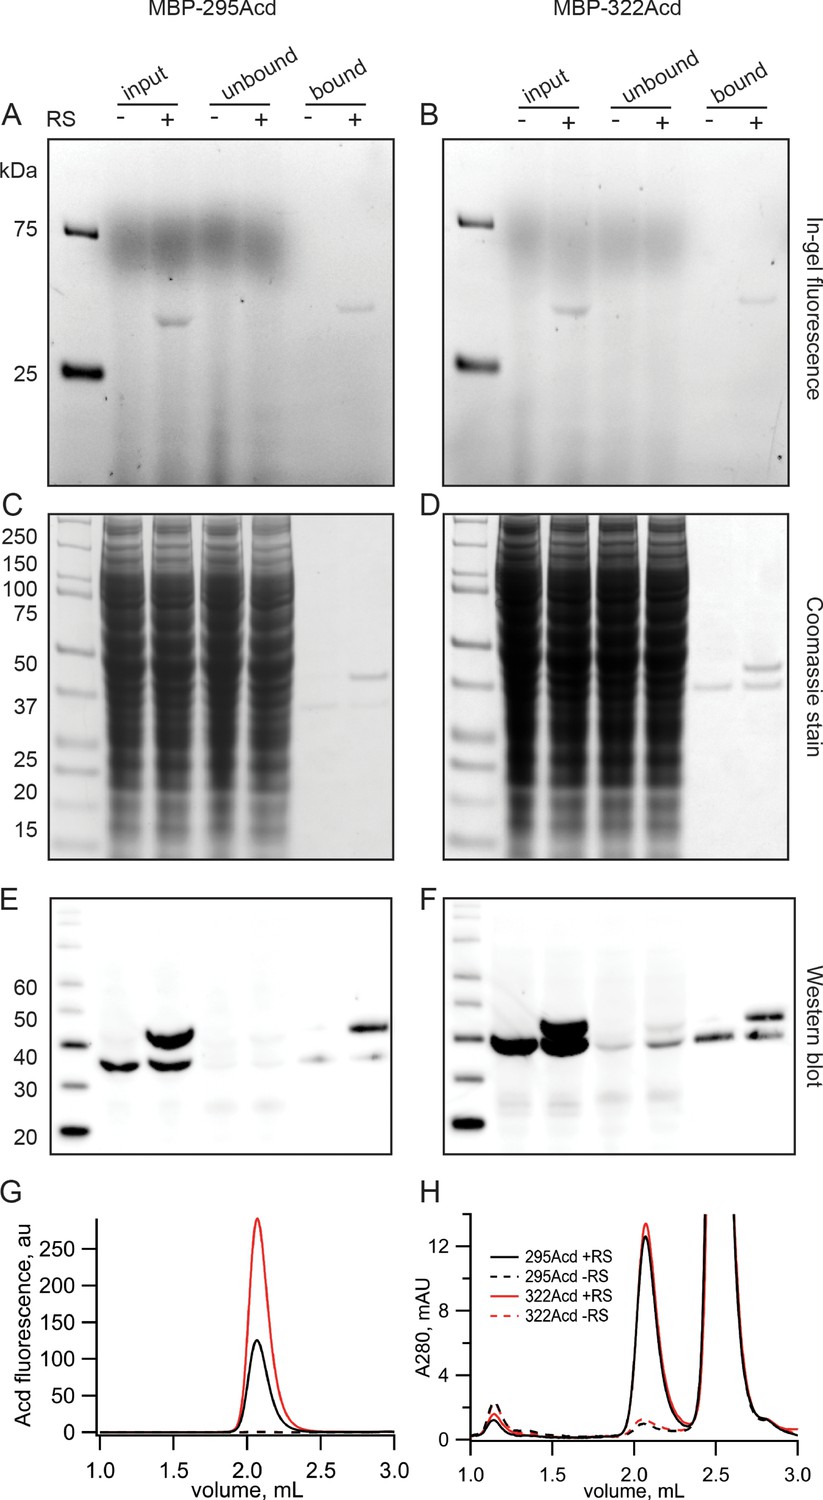
Incorporation of Acd into MBP.
(A, B) In-gel fluorescence for samples of (A) MBP-295Acd and (B) MBP-322Acd at various points during the purification process. The first lane sample is Precision Plus Dual Stain molecular weight standard. Lanes marked input represent cleared cell lysate. Lanes marked unbound represent the solution removed from the anti-FLAG affinity beads after the binding step. Lanes marked bound represent the sample eluted by FLAG peptide. The exclusion and inclusion of the amino acyl tRNA synthetase in the cell transfection is indicated by – and +, respectively. Excitation by a UV transilluminator at 354 nm was used in conjunction with a fluorescein emission filter. (C, D) The same gels as shown in (A, B) after staining with Coomassie blue. (E, F) Western blots using the same samples as (A, B) but run on a different gel. Lanes are the same as (A, B) except for the first lane in which the MagicMark XP standard was used. (G, H) Fluorescence size-exclusion chromatography of purified protein on a Superdex 200 Increase 5/150 GL column. Acd was excited at 385 nm with fluorescence recorded at 450 nm (G) and tryptophan absorption was measured at 280 nm (H). MBP eluted at 2.1 mL, and the FLAG peptide eluted at 2.5 mL.
-
Figure 2—source data 1
In Figure 2A, lane 2 is the same as lane 1 shown in the main text figure.
Black arrow indicates the size of full-length MBP-295Acd.
- https://cdn.elifesciences.org/articles/70236/elife-70236-fig2-data1-v1.tif
-
Figure 2—source data 2
In Figure 2B, lane 2 is the same as lane 1 shown in the main text figure.
Black arrow indicates the size of full-length MBP-322Acd.
- https://cdn.elifesciences.org/articles/70236/elife-70236-fig2-data2-v1.tif
-
Figure 2—source data 3
In Figure 2C, lane 2 is the same as lane 1 shown in the main text figure.
Black arrow indicates the size of full-length MBP-295Acd, and red arrow indicates the size of the truncation product.
- https://cdn.elifesciences.org/articles/70236/elife-70236-fig2-data3-v1.tif
-
Figure 2—source data 4
In Figure 2D, lane 2 is the same as lane 1 shown in the main text figure.
Black arrow indicates the size of full-length MBP-322Acd, and red arrow indicates the size of the truncation product.
- https://cdn.elifesciences.org/articles/70236/elife-70236-fig2-data4-v1.tif
-
Figure 2—source data 5
In Figure 2E, lane 2 is the same as lane 1 shown in the main text figure.
Black arrow indicates the size of full-length MBP-295Acd, and red arrow indicates the size of the truncation product.
- https://cdn.elifesciences.org/articles/70236/elife-70236-fig2-data5-v1.tif
-
Figure 2—source data 6
In Figure 2F, lane 2 is the same as lane 1 shown in the main text figure.
Black arrow indicates the size of full-length MBP-322Acd, and red arrow indicates the size of the truncation product.
- https://cdn.elifesciences.org/articles/70236/elife-70236-fig2-data6-v1.tif
Figure 3 with 2 supplements
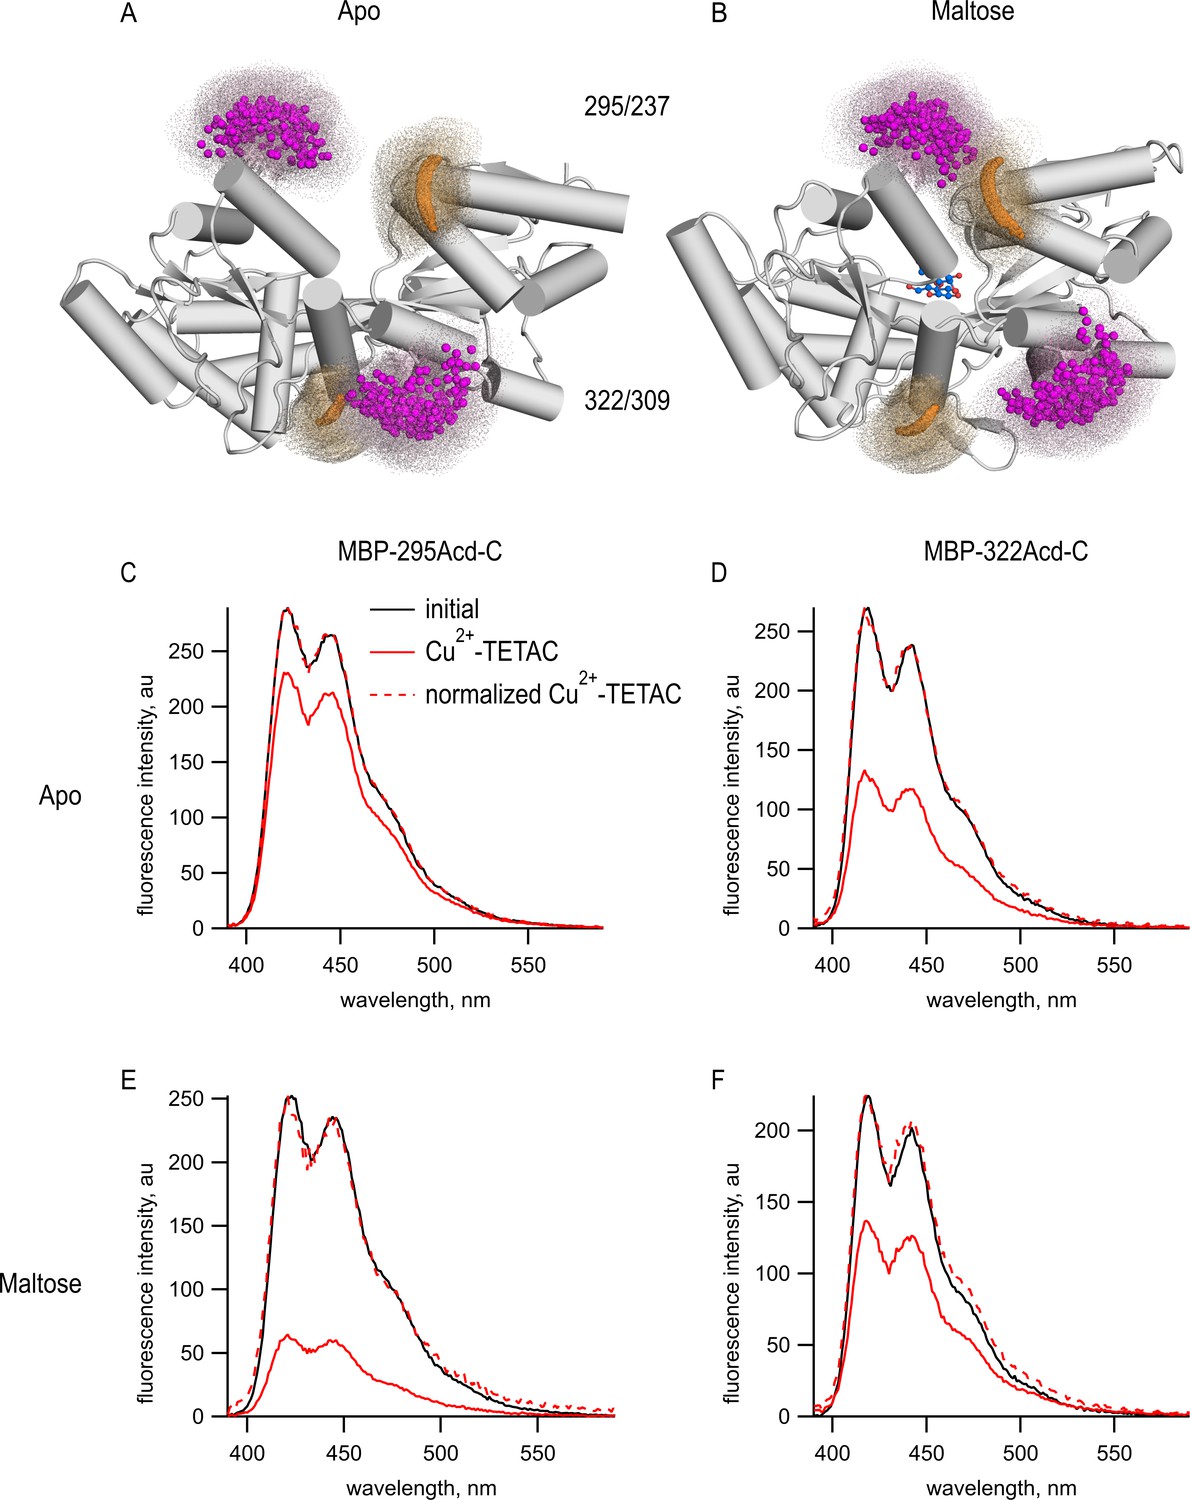
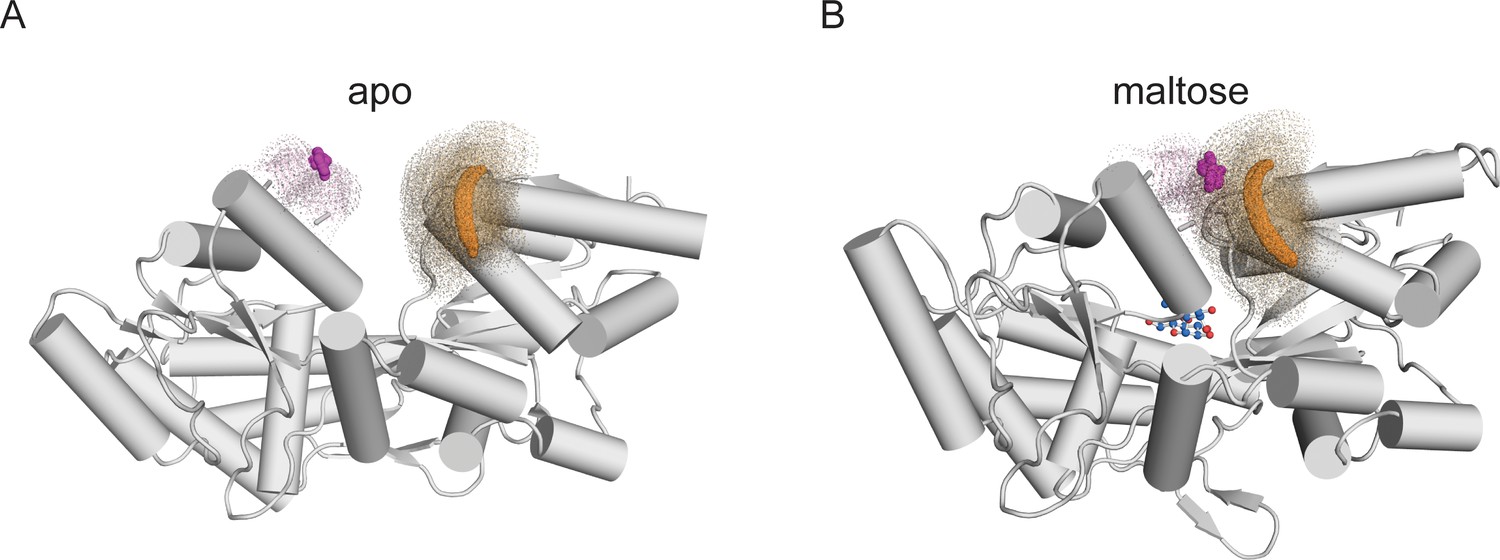
tmFRET between Acd incorporated into MBP and Cu2+-TETAC.
(A, B) Cartoon representations of MBP in the (A) apo (PDB 1OMP) and (B) holo (PDB 1ANF) conformations. The clouds represent possible conformers of Acd or Cu2+-TETAC with the carbonyl carbon of the acridone ring of Acd shown in orange and the Cu2+ ion of Cu2+-TETAC shown in magenta. Predicted donor-acceptor distances are listed in Table 2. (C–F) Emission spectra in response to 375 nm excitation, with 5 nm slits on both excitation and emission for (C, E) MBP-295Acd-C and (D, F) MBP-322Acd-C before (black) and after (red) application of Cu2+-TETAC. The dashed lines represent the Cu2+-TETAC data normalized to the peak initial data. (C, D) In the absence of maltose. (E, F) In the presence of 10 mM maltose.
Figure 3—figure supplement 1
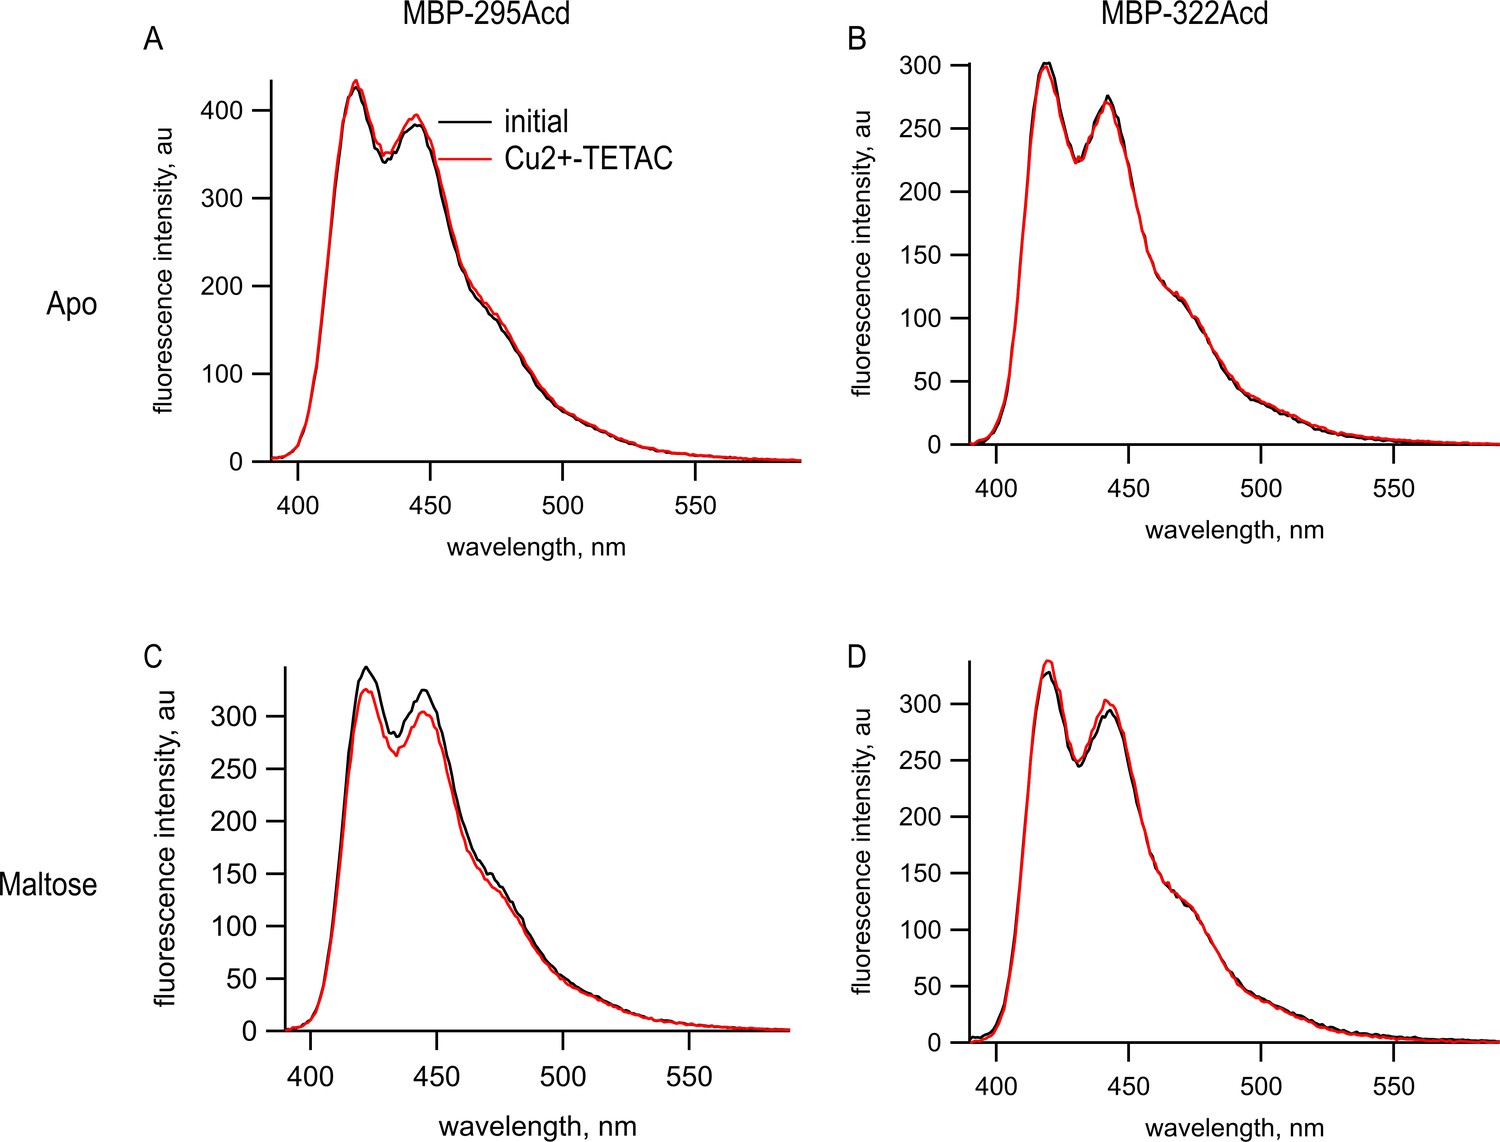
Cu2+-TETAC did not quench Acd in MBP constructs lacking the cysteine metal-binding site.
Emission spectra in response to 375 nm excitation, with 5 nm slits on both excitation and emission for (A, C) MBP-295Acd and (B, D) MBP-322Acd before (black) and after (red) application of Cu2+-TETAC. The dashed lines represent the Cu2+-TETAC data normalized to the peak initial data. (A, B) In the absence of maltose. (C, D) In the presence of 10 mM maltose.
Figure 3—figure supplement 2
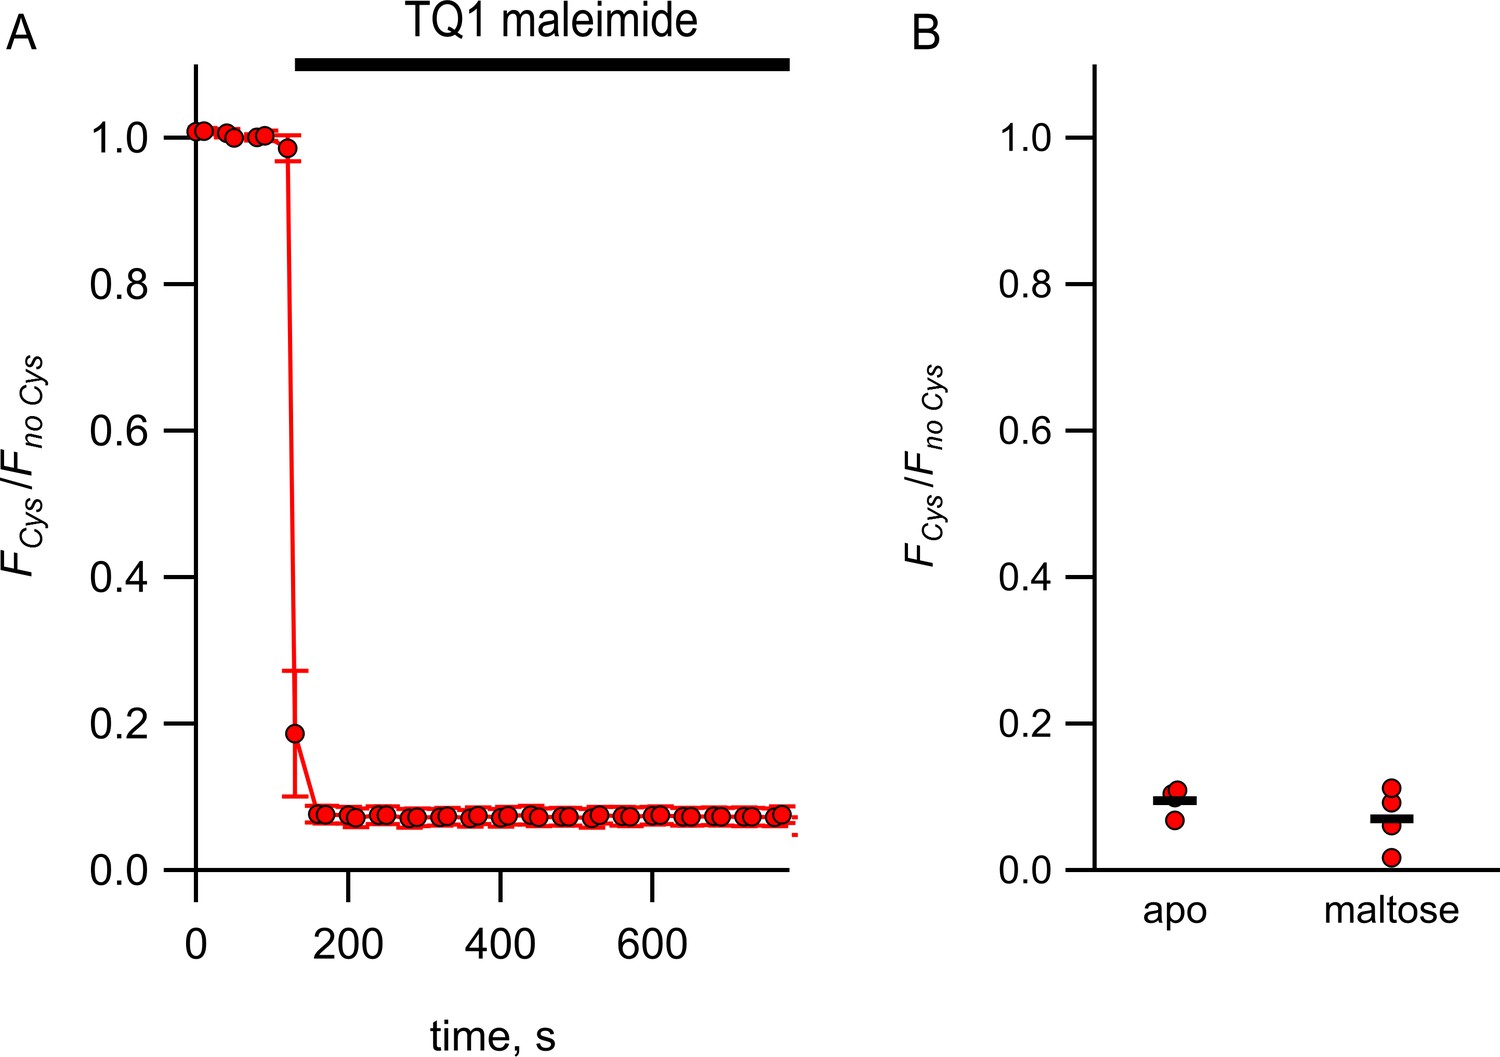
Quenching of MBP-322Acd by Tide Quencher 1 shows near-complete labeling.
(A) Quenching of MBP-322Acd-C by Tide Quencher 1 maleimide, with FCys and Fno Cys as defined in Equation 2. Data are shown as mean ± SEM for n = 8. Tide Quencher 1 maleimide was present during the time indicated by the bar. (B) Collected data showing each independent sample (circles) and the mean (line) for FCys/Fno Cys.
Figure 4 with 1 supplement
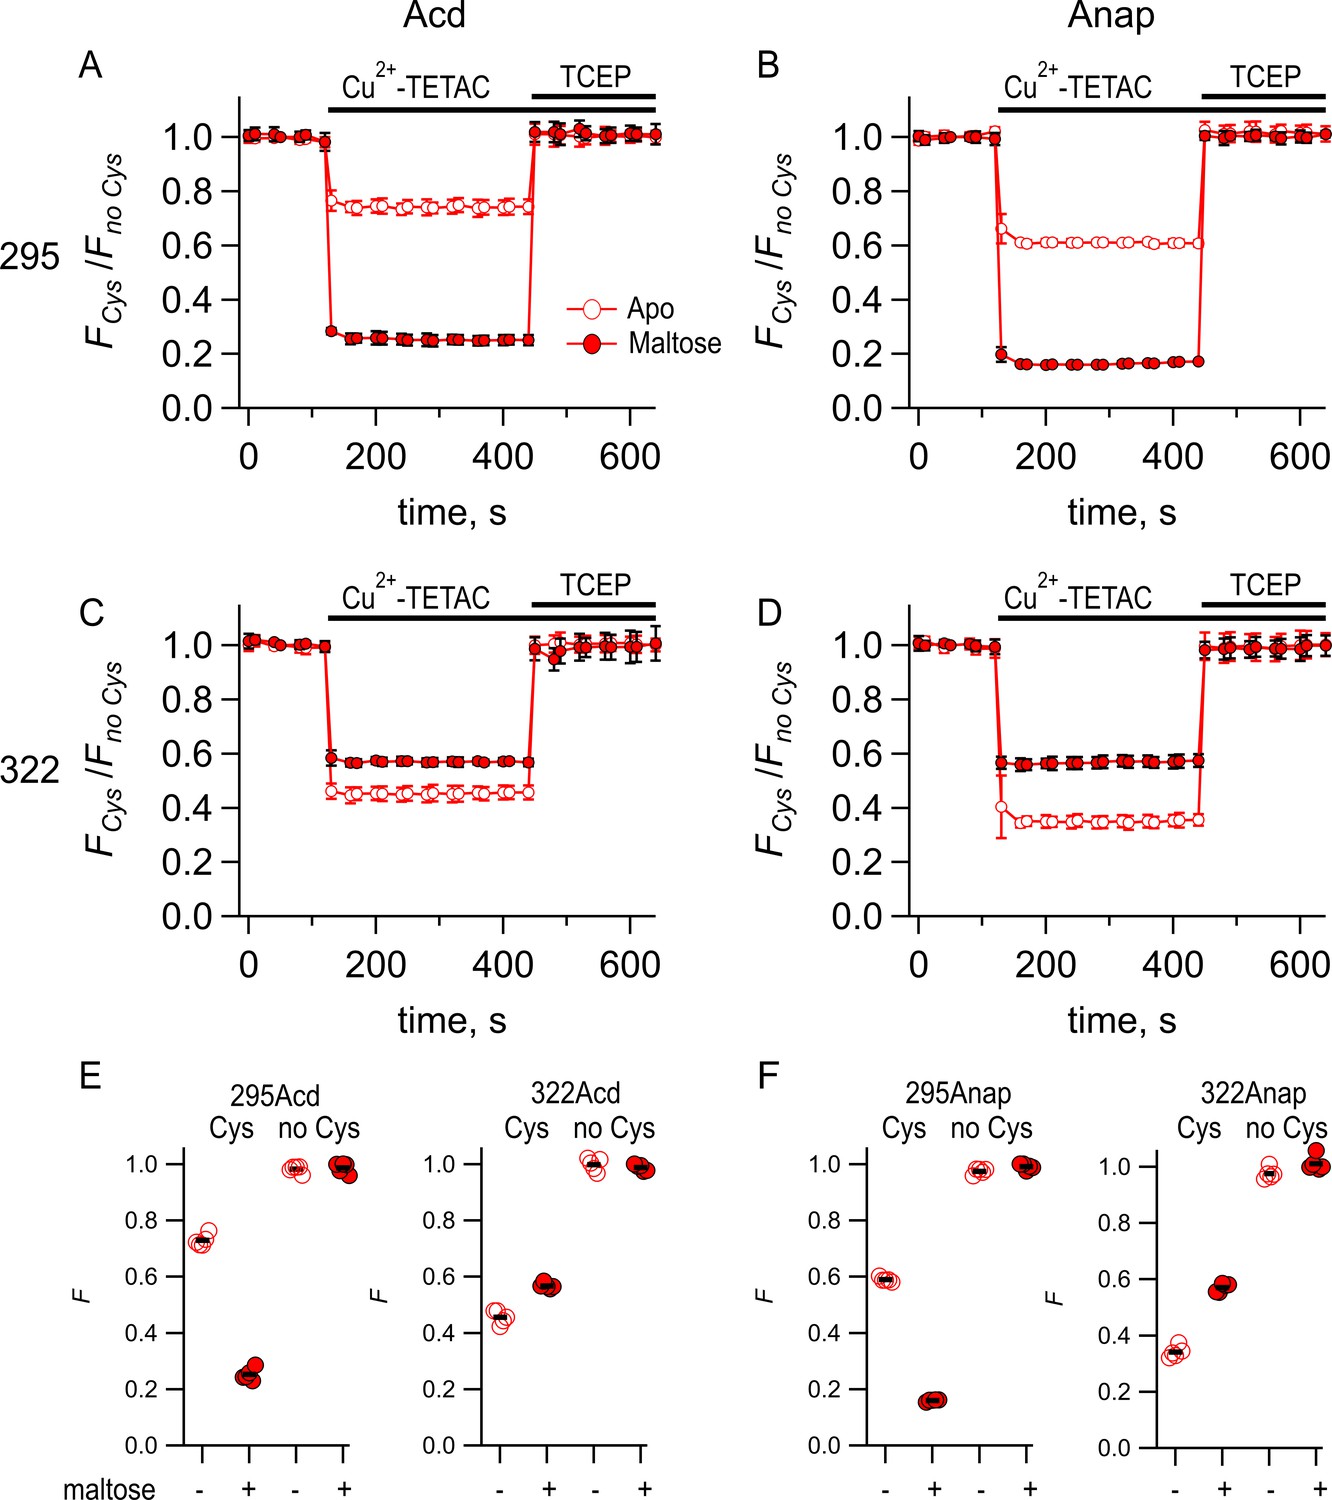
Comparing Acd and Anap as donors for transition metal ion fluorescence resonance energy transfer (tmFRET).
Quenching by Cu2+-TETAC and recovery with TCEP for (A) MBP-295Acd-C, (B) MBP-295Anap-C, (C) MBP-322Acd-C, and (D) MBP-322Anap-C, with FCys and Fno Cys as defined in Equation 2. Data are shown as mean ± SEM for n = 5. 10 µM Cu2+-TETAC and 2.5 mM TCEP were added at the times indicated by the bars. Open symbols represent data collected in the absence of maltose, and filled symbols represent data collected in the presence of 10 mM maltose. (E–F) Collected data showing each independent sample (circles) and the mean (black line) for FCys and Fno Cys for (E) MBP-295Acd-C (labeled 295Acd Cys) and MBP-295Acd (labeled 295Acd no Cys), MBP-322Acd-C (labeled 322Acd Cys) and MBP-322Acd (labeled 322Acd no Cys) and for (F) MBP-295Anap-C (labeled 295Anap Cys) and MBP-295Anap (labeled 295Anap no Cys), MBP-322Anap-C (labeled 322Anap Cys) and MBP-322Anap (labeled 322Anap no Cys). The absence and presence of 10 mM maltose are as indicated by the – and + shown beneath each data set.
Figure 4—figure supplement 1
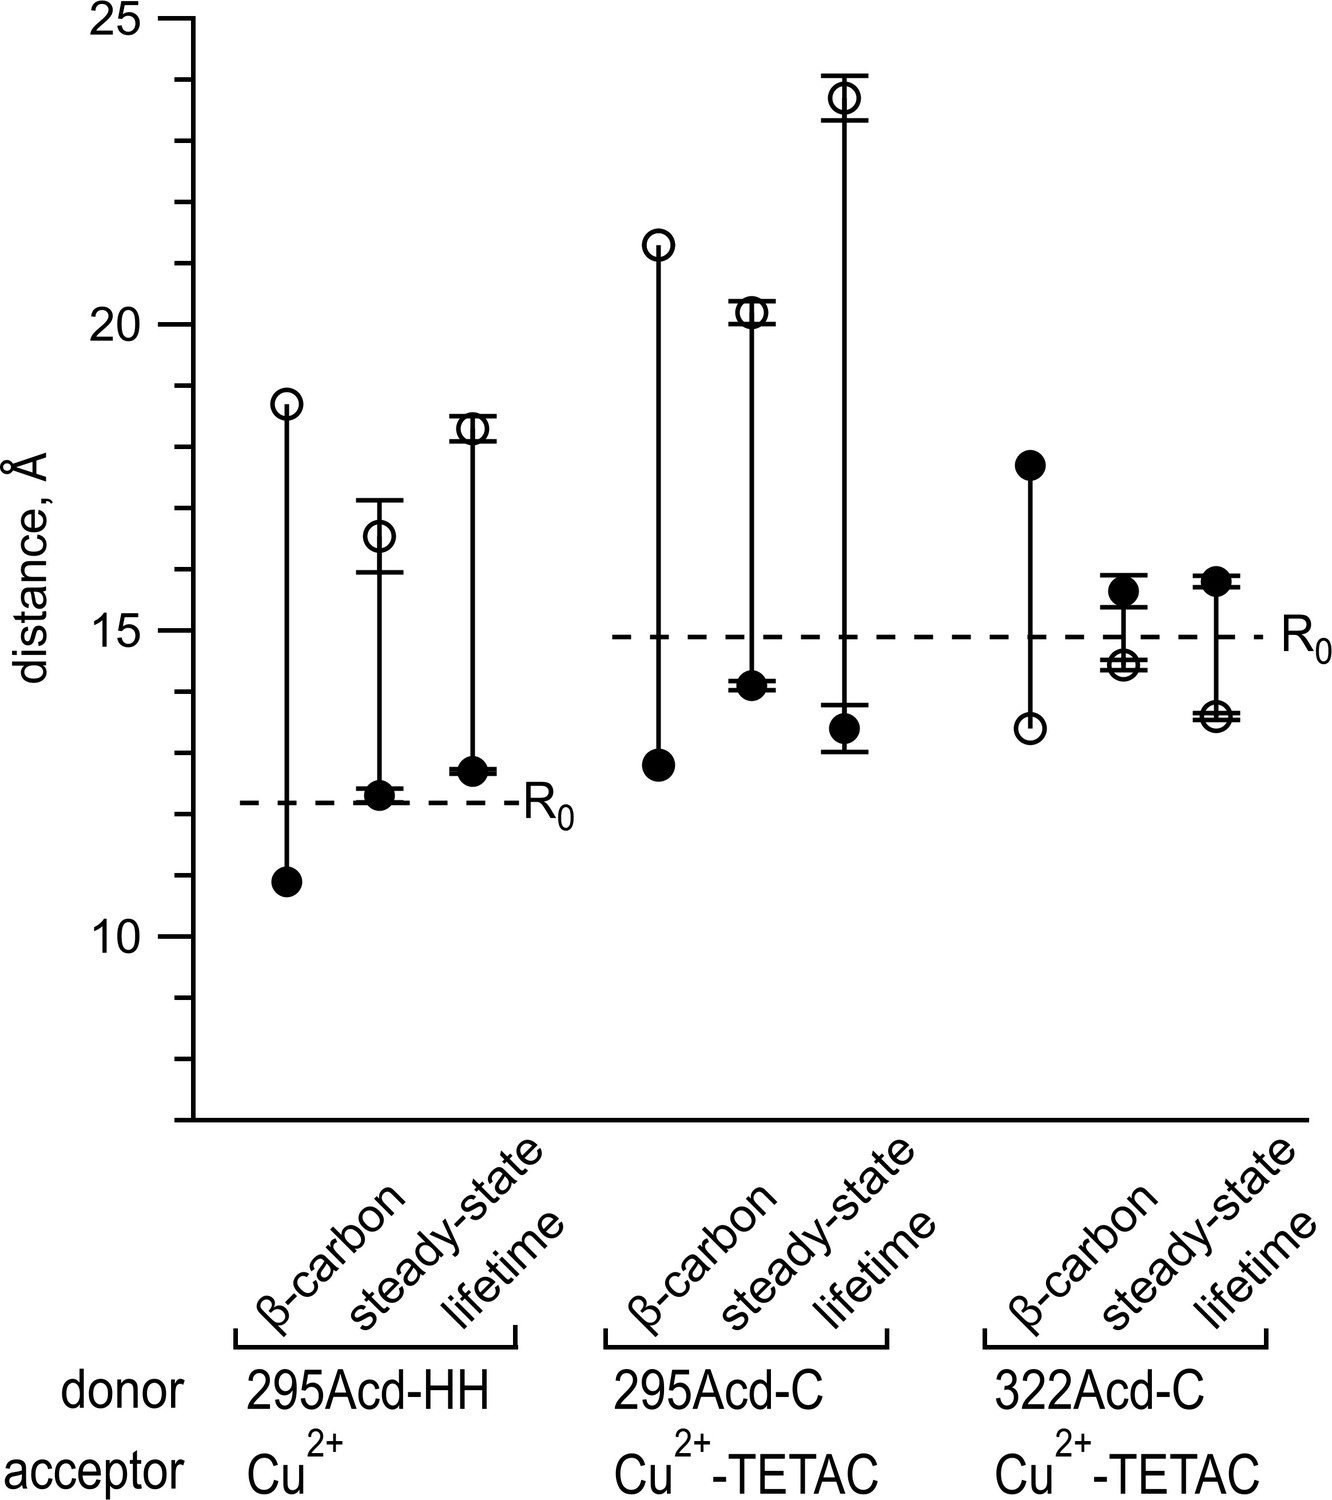
Comparing distances determined from experimental data to predicted distances from X-ray structures.
Distances in the apo state are shown as open circles, and distances in the holo state are shown as filled circles. The β-carbon distances were determined from PDB structures 1OMP and 1TNF (see also Table 2). Points labeled steady state represent means of distances calculated from steady-state fluorescence resonance energy transfer (FRET), with n = 4–5. Points labeled lifetime represent means of distances determined from fits to frequency-domain lifetime measurements, with n = 3–7 (see also Table 1). Error bars represent standard error of the mean. Dashed lines indicate the R0 values for the FRET pairs indicated in the figure.
Figure 5 with 1 supplement
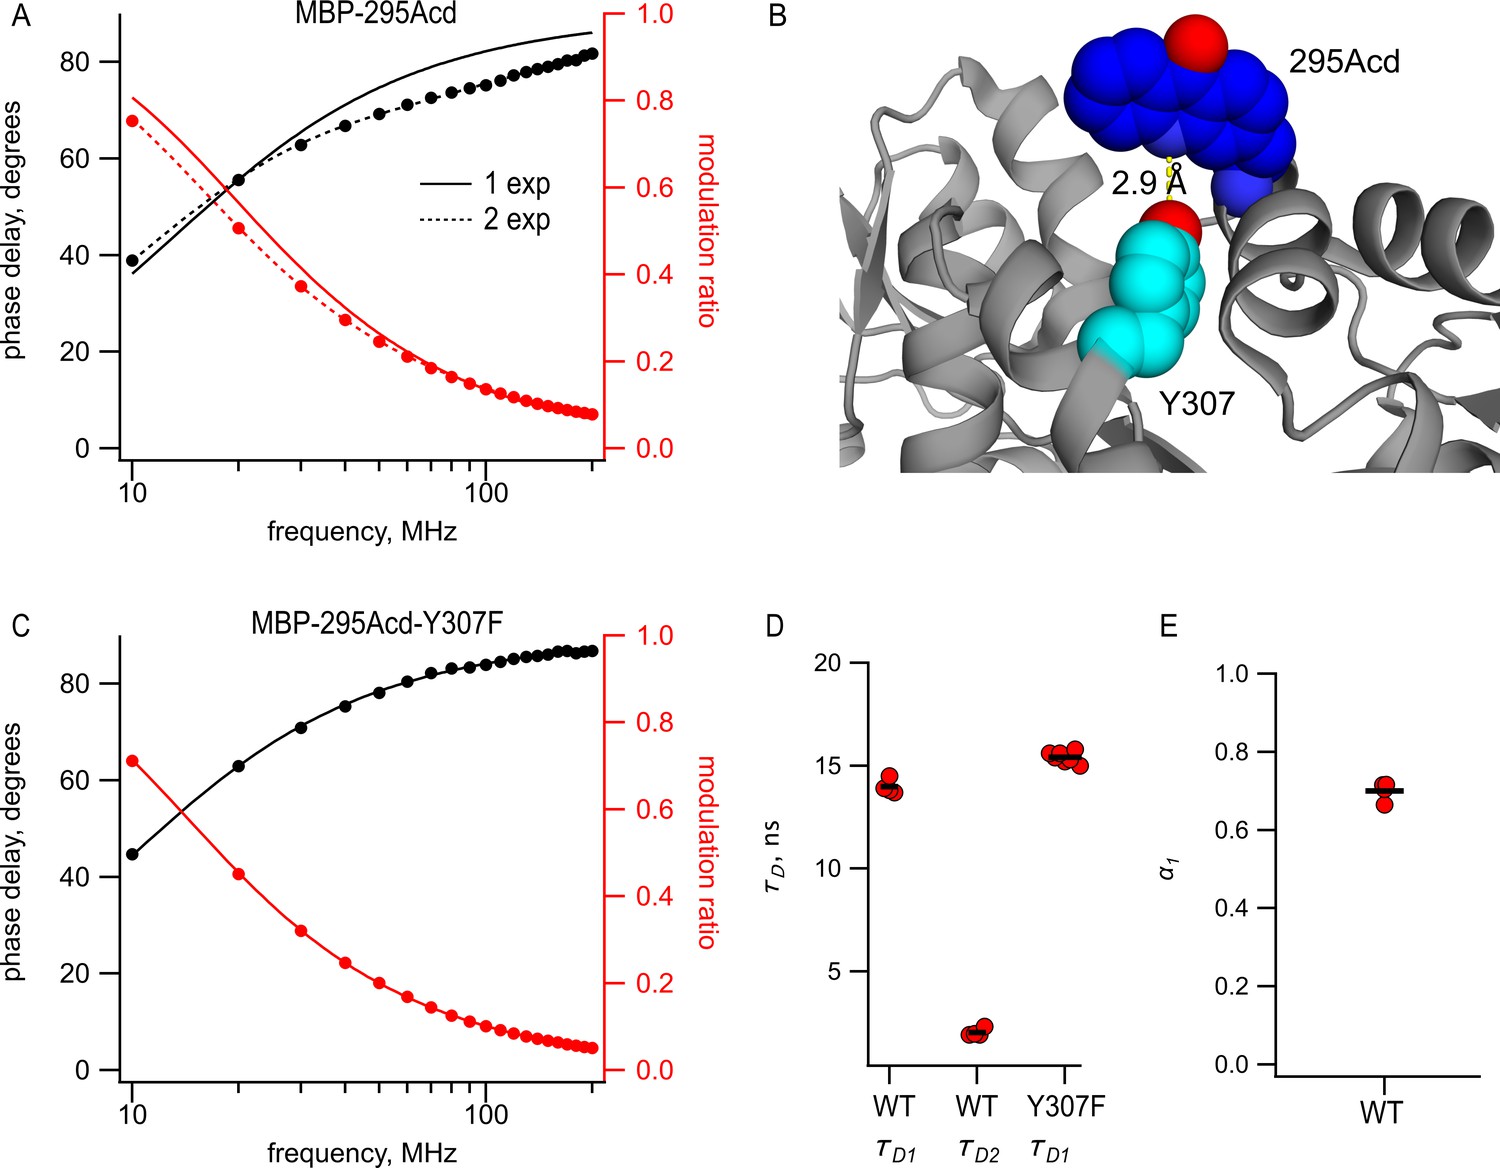
Acd in MBP-295Acd is nonexponential and introduction of the Y307F mutation increases its lifetime and makes it single exponential.
(A, C) Frequency-domain measurements of fluorescence lifetime of (A) MBP-295Acd and (C) MBP-295Acd-Y307F. Black, phase delay in degrees; red, modulation ratio. Curves are fits with Equations 5 and 6 corrected by Equations 13 and 14. Fit parameters for (A) are = 11.6 ns for a single exponential (solid curve) and = 13.9 ns, = 1.9 ns, and α1 = 0.70 Å (dashed curve) and for (C) are = 15.6 ns. (B) Cartoon representation of the proximity between Acd at position 295 and tyrosine at position 307 in the apo state. (D, E) Collected data from fits for MBP-295Acd (WT) and MBP-295Acd-Y307F, as indicated. Independent samples are shown as red circles, and the means are shown as black lines.
Figure 5—figure supplement 1
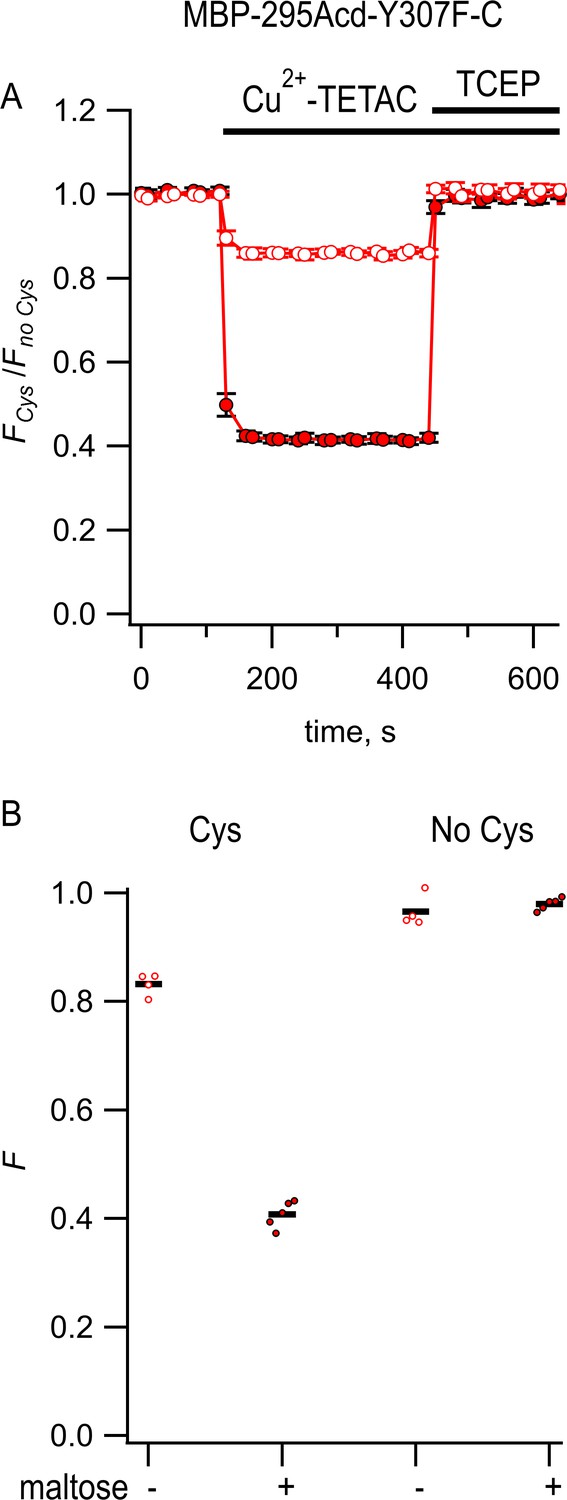
Steady-state fluorescence to measure transition metal ion fluorescence resonance energy transfer (tmFRET) between MBP-295Acd-Y307F-C and Cu2+-TETAC.
(A) Quenching by Cu2+-TETAC and recovery with TCEP for MBP-295Acd-Y307F-C, with FCys and Fno Cys as defined in Equation 2. Data are shown as mean ± SEM for n = 5. 10 µM Cu2+-TETAC and 2.5 mM TCEP were added at the times indicated by the bars. Open symbols represent data collected in the absence of maltose, and filled symbols represent data collected in the presence of 10 mM maltose. (B) Collected data showing each independent sample (circles) and the mean (red line) for FCys and Fno Cys. The absence and presence of 10 mM maltose are as indicated by the – and + shown beneath each data set.
Figure 6 with 3 supplements
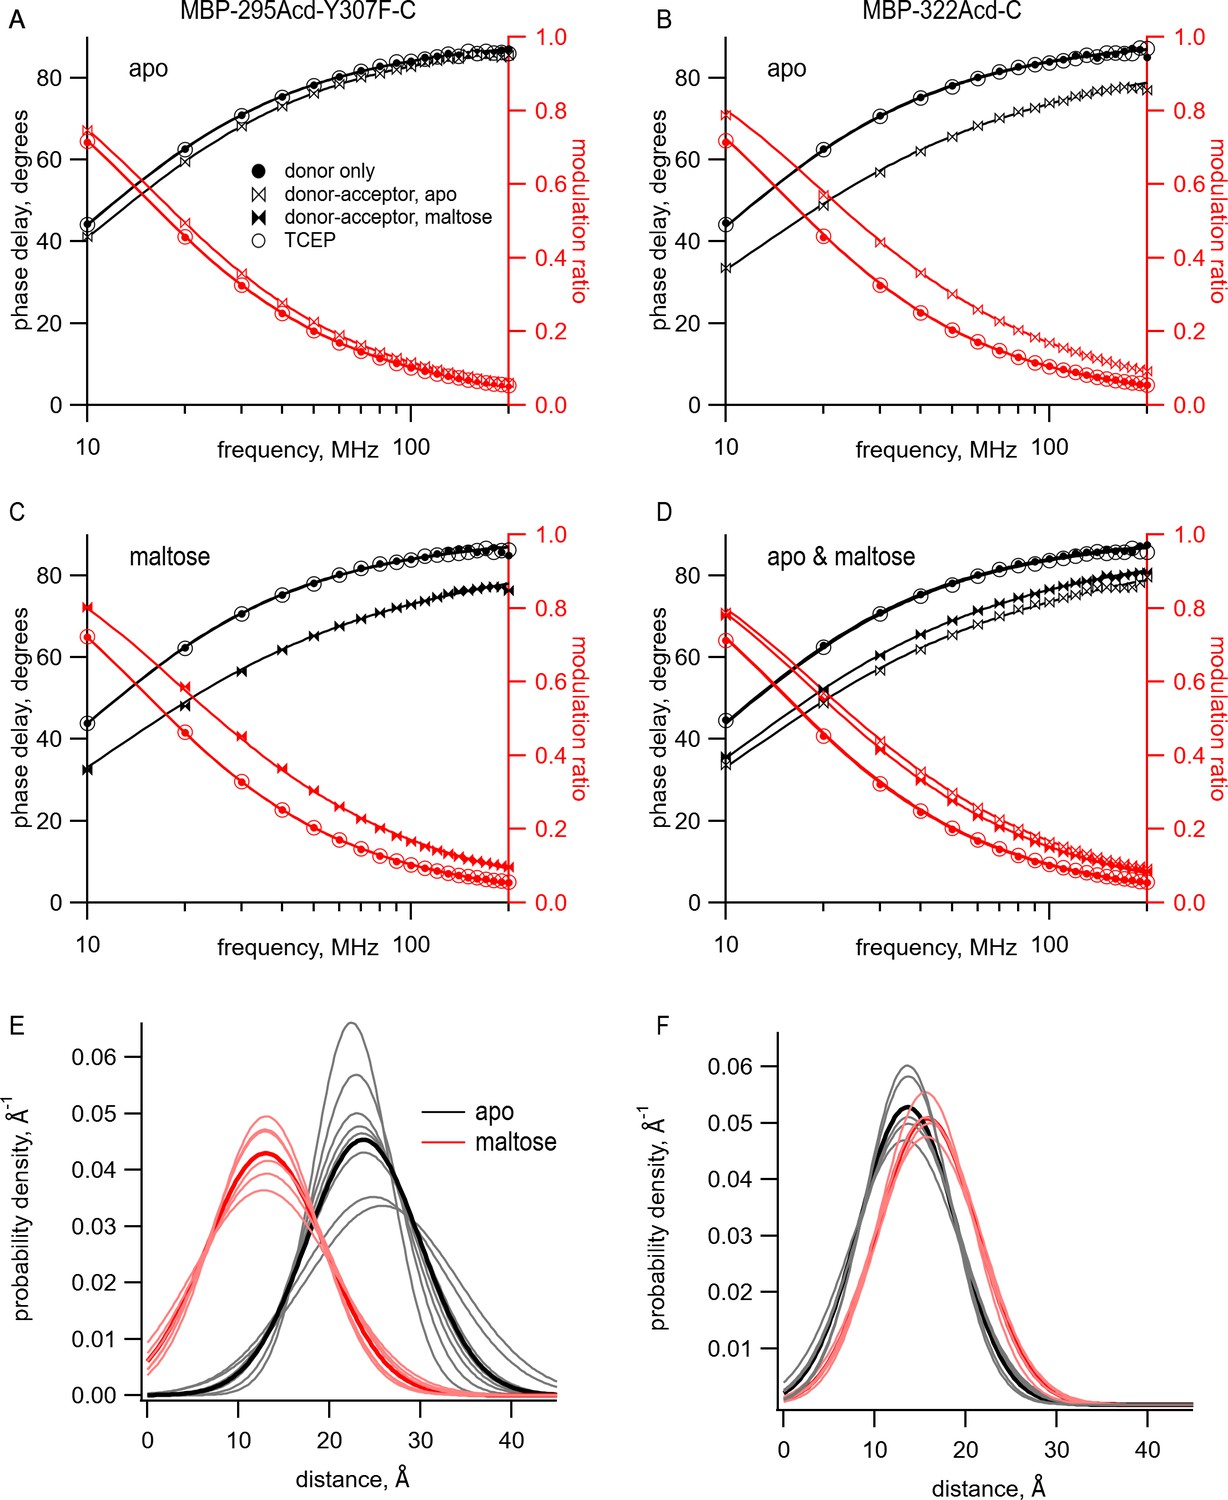
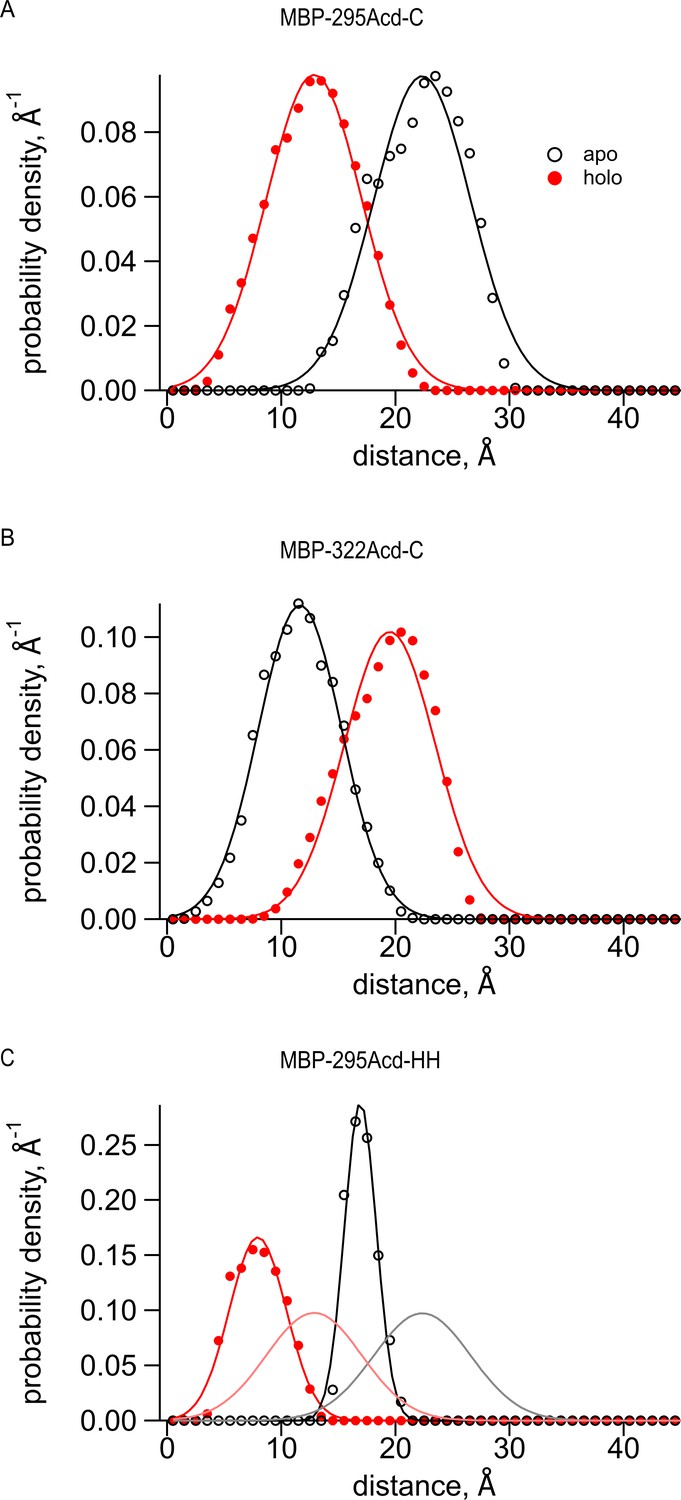
Using time-resolved transition metal ion fluorescence resonance energy transfer (tmFRET) to measure distance and distance distributions between Acd and Cu2+ bound to di-histidine in MBP.
(A–D) Frequency-domain measurements of fluorescence lifetime of (A, C) MBP-295Acd-Y307F-C and (B, D) MBP-322Acd-C. Black, phase delay in degrees; red, modulation ratio. Filled circles represent the donor-only condition at the beginning of the experiment. For (A, B, D), this was in the absence of maltose and for (C) this was in the presence of 10 mM maltose. Open bowties represent the addition of 10 µM Cu2+-TETAC in the absence of maltose. Filled bowties represent the addition of 10 µM Cu2+-TETAC in the presence of 10 mM maltose. Open circles represent data collected after sequential addition of TCEP. Solid curves represent fits to the data with Equations 5 and 6 and then corrected using Equations 13 and 14. The parameters for the fits shown in the figure are as follows: (A) (B) (C) and (D) (E, F) Spaghetti plots representing the center and width of the Gaussians used to fit the distance distributions for each experiment (thin curves) and the average of all fits (thick curves) for (E) MBP-295Acd-Y307F-C and (F) MBP-322Acd-C in either the absence (black) or presence (red) of 10 mM maltose.
Figure 6—figure supplement 1
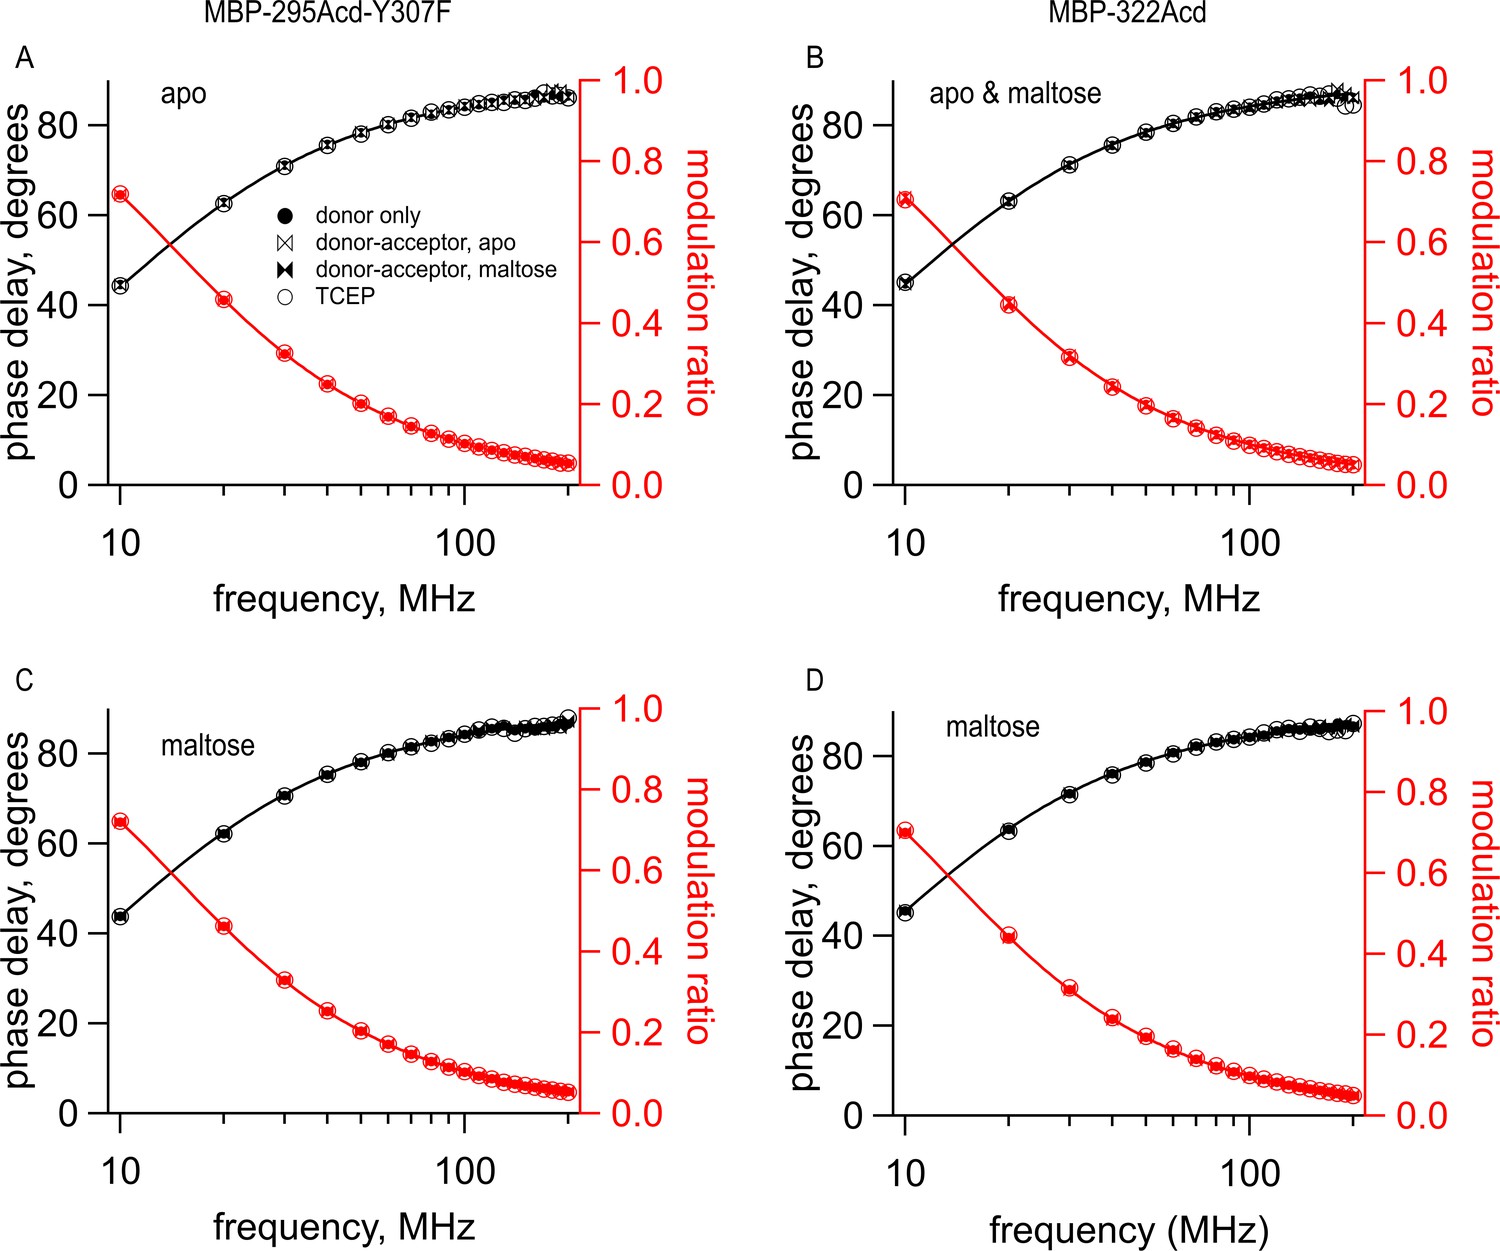
Cu2+-TETAC did not alter the lifetimes of constructs that did not contain the metal-binding site.
Frequency-domain measurements of fluorescence lifetime of (A, C) MBP-295Acd-Y307F and (B, D) MBP-322Acd in (A,B ) the absence and (B–D) presence of 10 mM maltose. Black, phase delay in degrees; red, modulation ratio. Fits are shown as solid curves with the following parameters: (A) (B) (C) and (D) Symbols are as indicated in the legend and are the same as in Figure 6.
Figure 6—figure supplement 2
Predictions of distance distributions from mtsslWizard.
(A–C) Black open symbols represent distances from the apo structure (PDB 10MP), filled red symbols represent distances from the holo structure (PDB ANF1), and curves represent fits to the distances with a Gaussian. (A) MBP-295-Acd-C with Cu2+-TETAC conjugated to the cysteine fit with the following parameters: (B) MBP-322-Acd-C with Cu2+-TETAC conjugated to the cysteine fit with the following parameters: (C) MBP-295-Acd-HH bound to Cu2+ fit with the following parameters: The apo parameters are and σ1, and the holo parameters are and σ2. The gray and pink curves represent the black and red fits, respectively, from (A) and demonstrate the expected differences in donor-acceptor distances when using Cu2+-di-His vs. Cu2+-TETAC as the acceptor.
Figure 6—figure supplement 3
Illustrations of distance distributions from mtsslWizard.
Cartoon representations of MBP-295Acd-HH in (A) the apo (PDB 10MP) and (B) the holo (PDB 1ANF) conformations. The clouds represent possible conformers of Acd or Cu2+-di-histidine with the carbonyl carbon of the acridone ring of Acd shown in orange and the Cu2+ ion shown in magenta. Donor-acceptor distances are listed in Table 2.
Figure 7 with 1 supplement
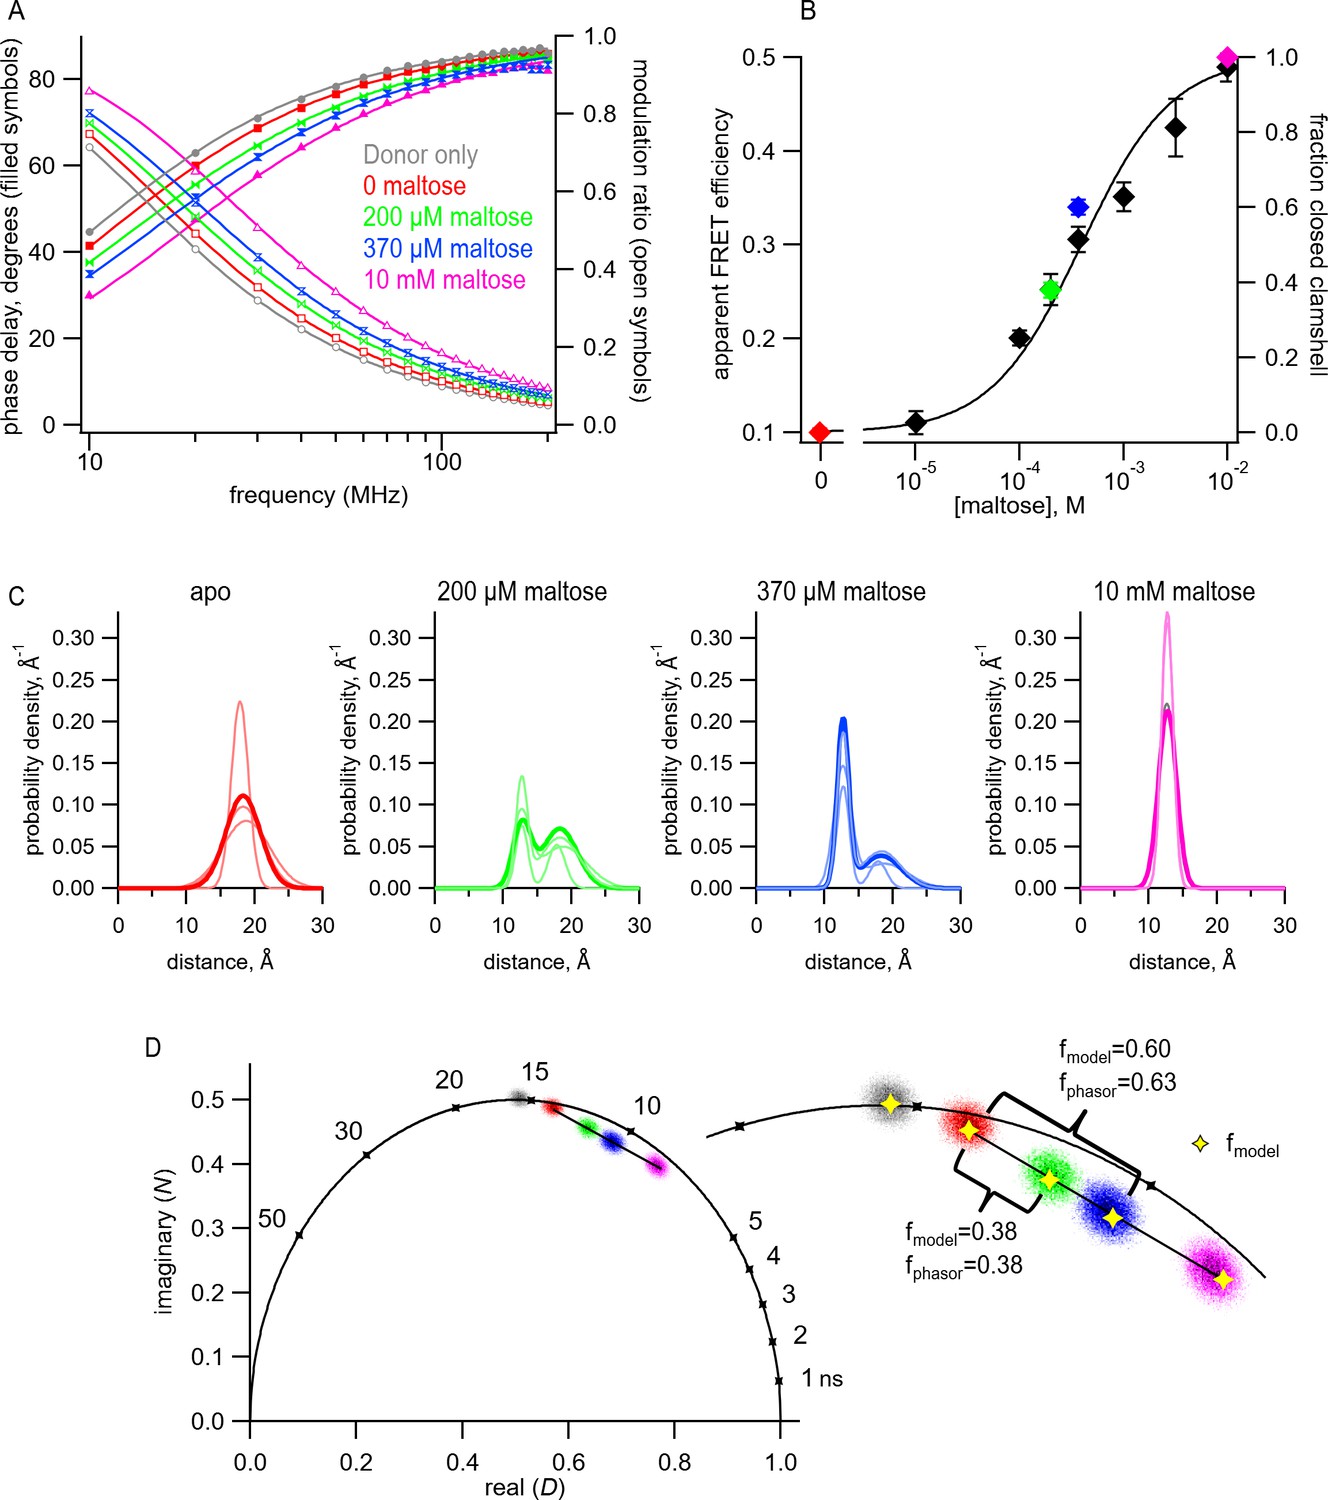
Transition metal ion fluorescence resonance energy transfer (tmFRET) between Acd and Cu2+ in MBP can be used to measure distributions among conformations at subsaturating maltose concentrations.
(A) Frequency-domain measurements of fluorescence lifetimes of MBP-295Acd-HH measured sequentially in the absence of acceptor (donor only – gray), 100 µM Cu2+ (red), 100 µM Cu2+ and 200 µM maltose (green), 100 µM Cu2+ and 370 µM maltose (blue), and 100 µM Cu2+ and 10 mM maltose (magenta). Filled symbols represent phase delay, and open symbols represent modulation ratio. Solid curves are fits with Equations 5 and 6 corrected with Equations 13 and 14 with the following fit parameters: (B) The dependence of apparent FRET efficiency measured with steady-state FRET (black) or fraction in the closed clamshell conformation measured with time-resolved FRET (red) on maltose concentration. Points are mean ± SEM for 3–5 independent experiments. The fraction of the population in the closed clamshell conformation at each MBP concentration was taken from model fits to the data, as shown in (A). Solid curve is a fit with the Hill equation with the following parameters: K1/2 = 393 µM and Hill slope = 1. (C) Spaghetti plots representing the center and width of the Gaussians used to fit the distance distributions for each experiment (thin curves) and the average of all fits (thick curves) for MBP-295Acd-HH at the indicated maltose concentrations. (D) Phasor plot in which each pixel of the fluorescence lifetime imaging microscopy image is plotted as a dot, with the color corresponding to the maltose concentration, as in (A) and (C). The line connects the centroid of the data in the absence of maltose to that in the presence of 10 mM maltose. (Inset) Magnified section of the phasor plot. The yellow points represent N and D predicted from Equations 7 and 8 from fits of the model to the frequency-domain data shown in (A). The fraction of the population in the closed clamshell conformation predicted by the models is compared to that given by the phasor plots.
Figure 7—figure supplement 1
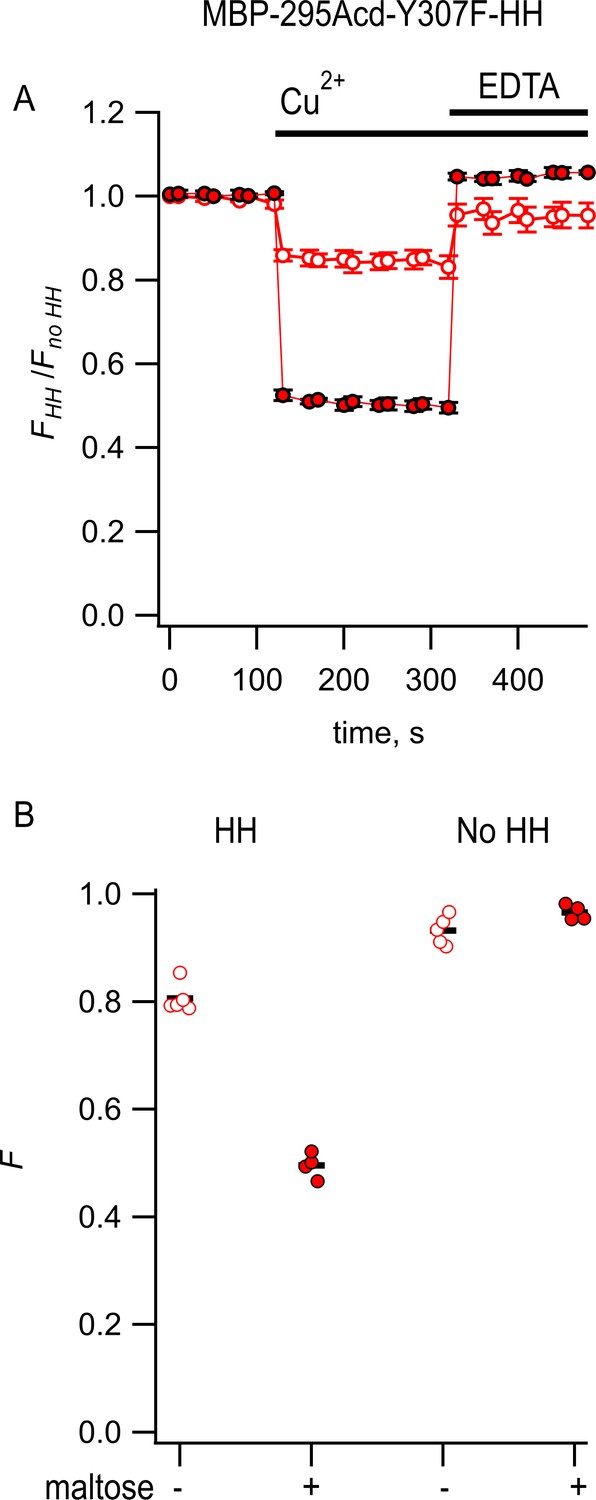
Steady-state measurement of transition metal ion fluorescence resonance energy transfer (tmFRET) between MBP-295Acd-Y307F-HH and Cu2+.
(A) Quenching by Cu2+ and recovery with EDTA for MBP-295Acd-Y307F-HH, with FHH and Fno HH as defined in Equation 2. Data are shown as mean ± SEM for n = 4–5. 100 µM Cu2+ and 2 mM EDTA were added at the times indicated by the bars. Open symbols represent data collected in the absence of maltose, and filled symbols represent data collected in the presence of 10 mM maltose. (B) Collected data showing independent samples (circles) and the mean (black line) for FHH and Fno HH. The absence and presence of 10 mM maltose are as indicated by the – and + shown beneath each data set.
Figure 8 with 2 supplements
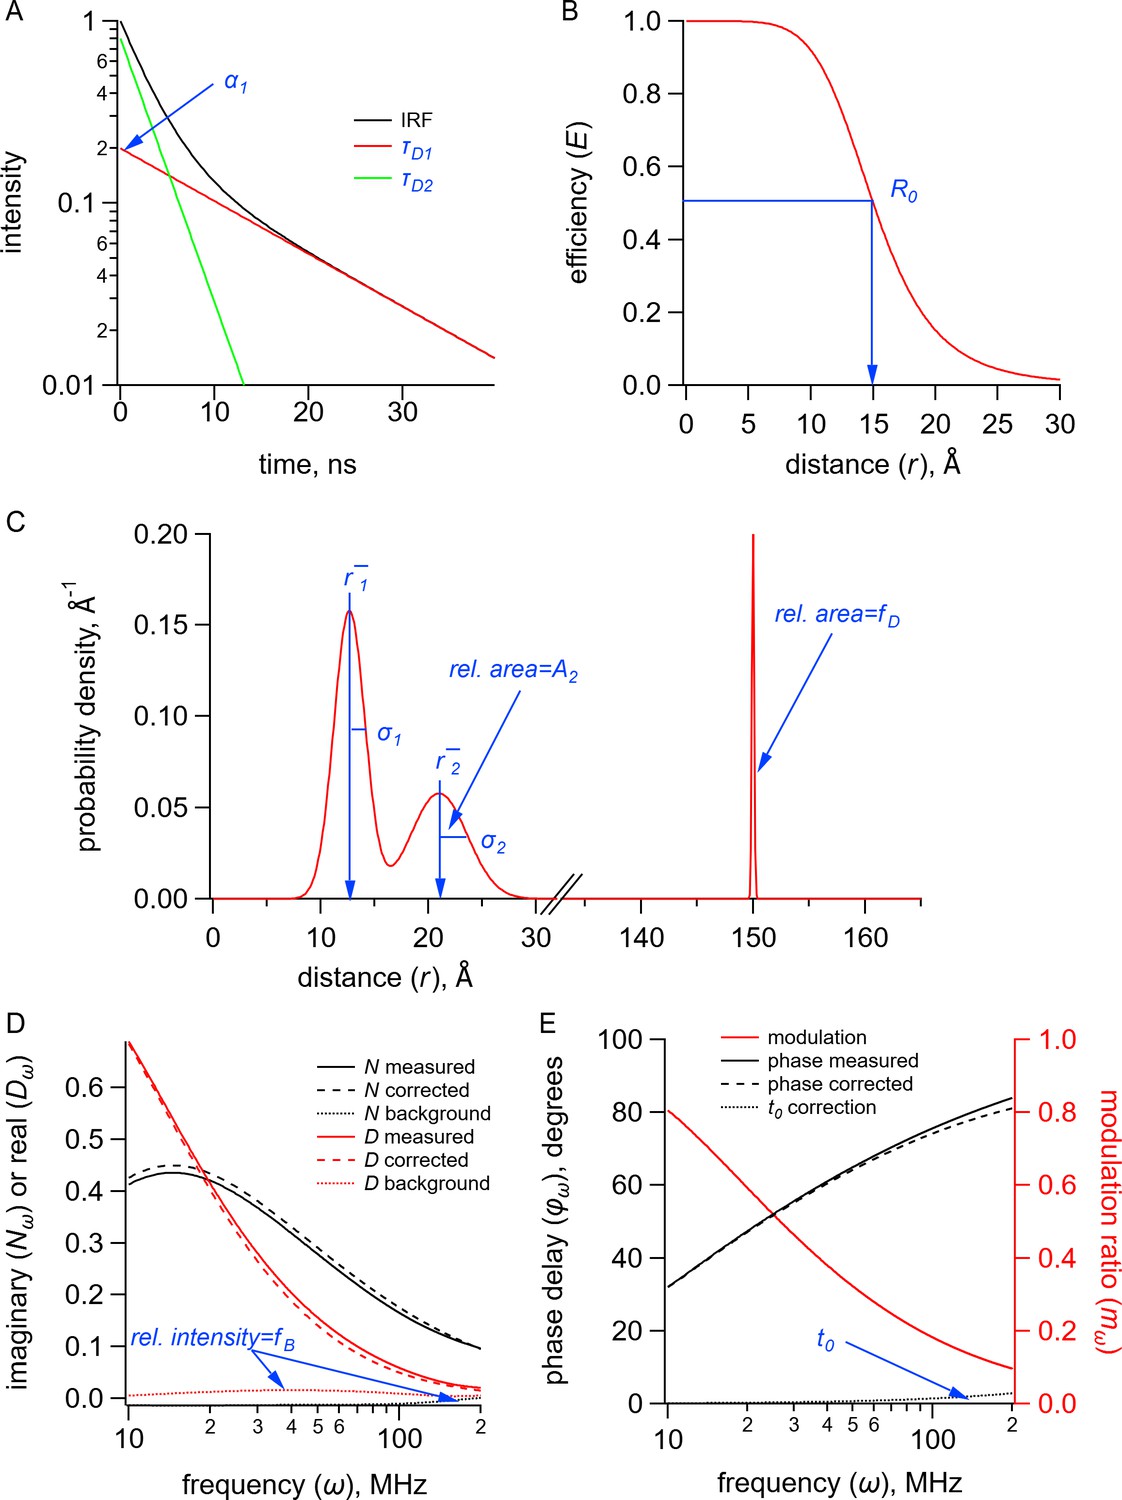
Quantities (black) and parameters (blue) in the model for time-resolved transition metal ion fluorescence resonance energy transfer (tmFRET).
(A) Plot of fluorescence lifetimes in the time domain for a donor fluorophore with two exponential components with time constants ( and ) and relative amplitude (). (B) Plot of the FRET efficiency (E) as a function of distance () showing the characteristic distance for the donor-acceptor pair(). (C) Plot of a distribution of donor-acceptor distances with two Gaussian components with means ( and ), standard deviations ( and ), and relative amplitude of the second component (). The fraction of donor only () was modeled as a narrow Gaussian with a mean distance of 150 Å and a standard deviation of 0.1 Å, too far to exhibit any detectable FRET. (D) Plot of the imaginary () and real () components of the measured, corrected, and background fluorescence response as a function of the modulation frequency () where is the fraction of the fluorescence intensity due to background. (E) Plot of the phase delay and modulation ratio of the measured and corrected fluorescence response as a function of the modulation frequency () where is the time shift of the instrument response function.
Figure 8—figure supplement 1
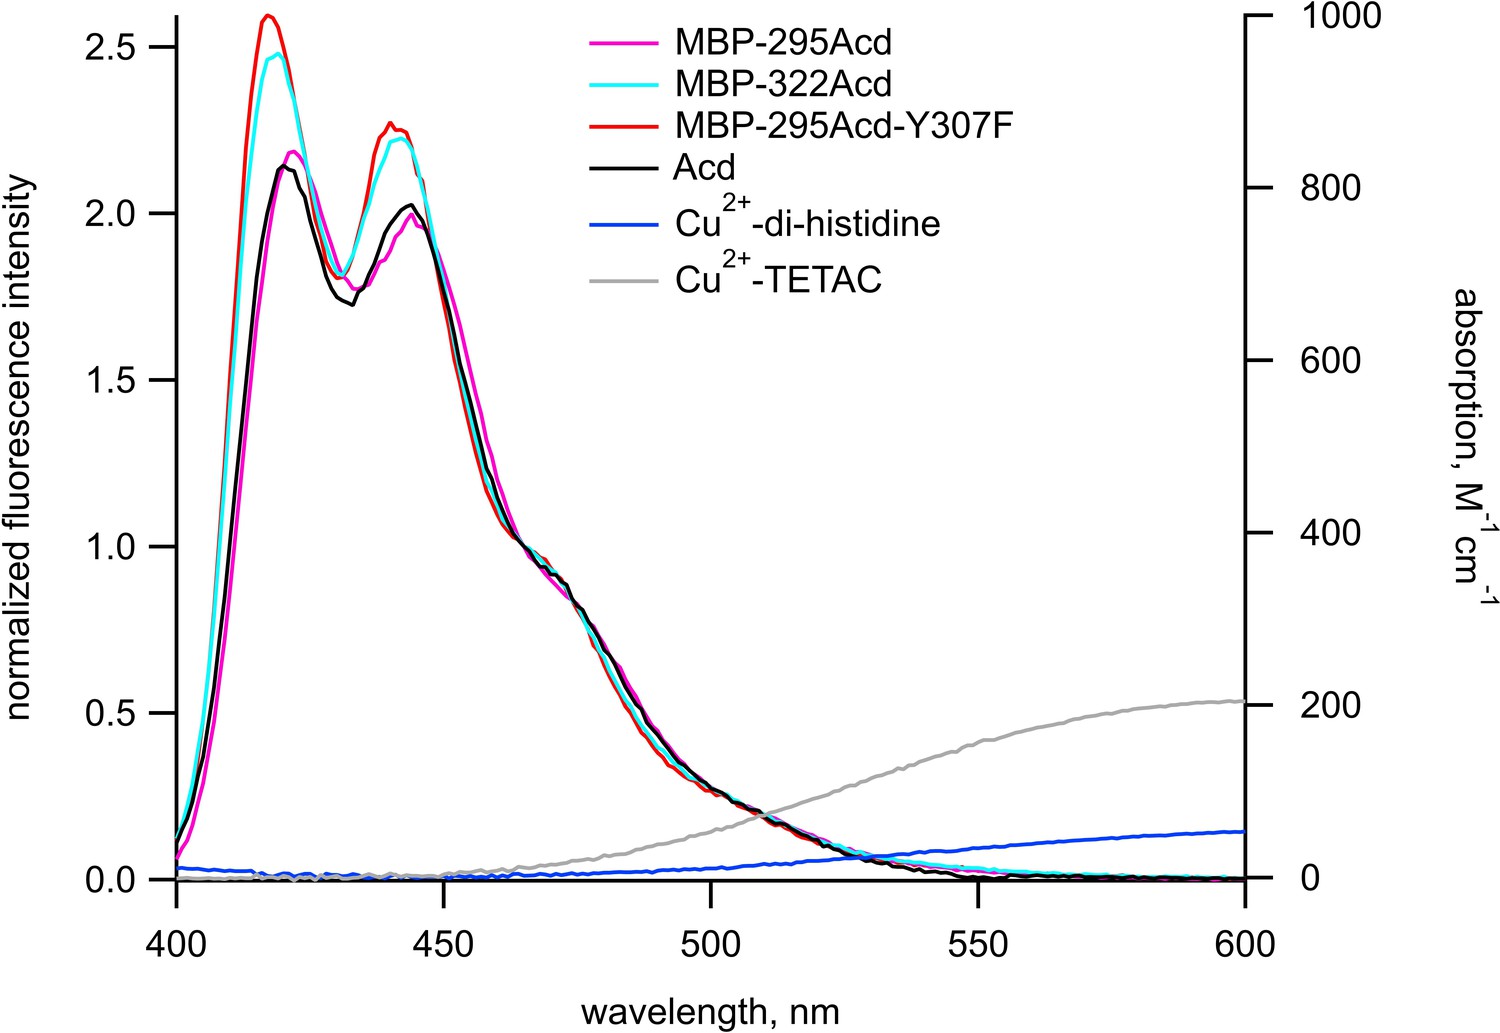
Spectral overlap between donors and acceptors for Acd experiments.
Emission spectra in response to excitation at 370 nm normalized to the fluorescence intensity measured at 465 nm (left axis) and absorption spectra (right axis) are shown for donors and acceptors, respectively, in KBT. Each emission spectrum represents the mean of 5–6 experiments. The color scheme is as labeled in the figure.
Figure 8—figure supplement 2
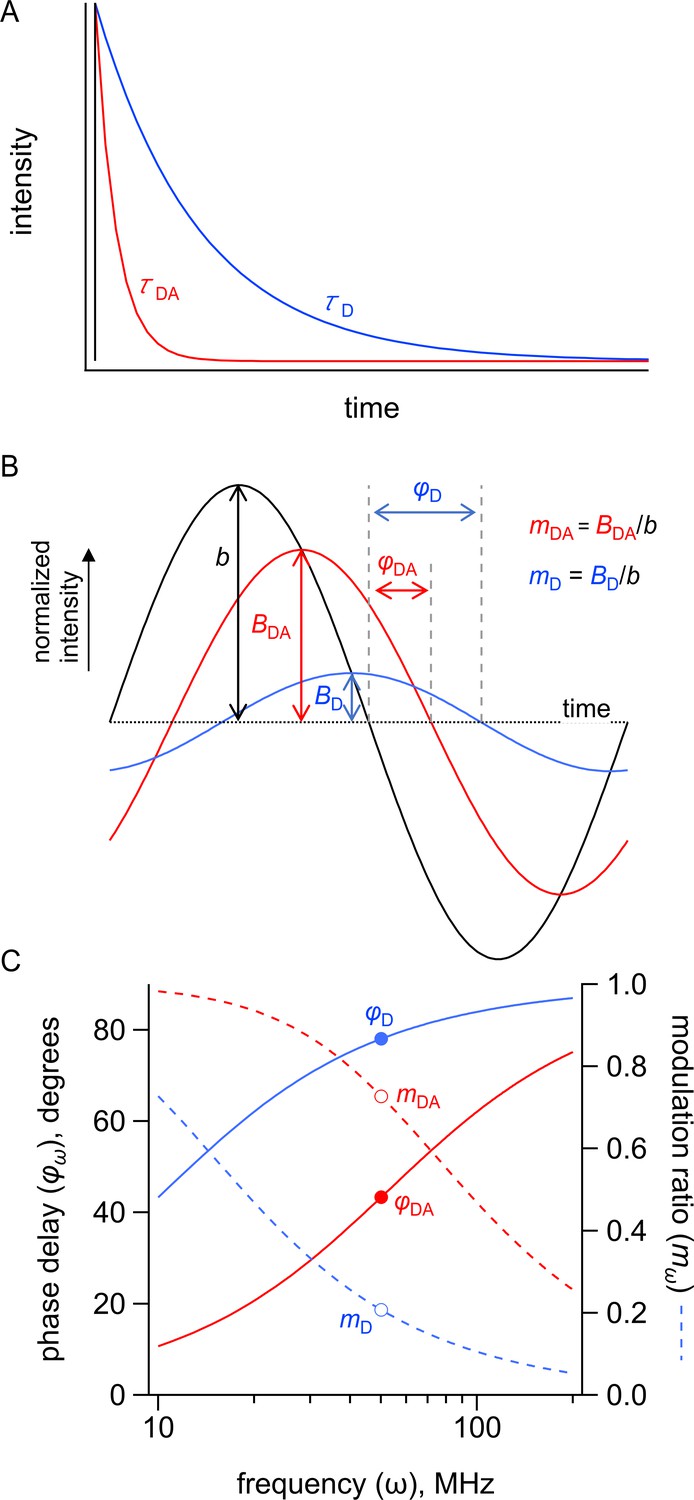
Measuring fluorescence resonance energy transfer (FRET) in the time domain and frequency domain.
Simulated FRET depicted in the time and frequency domains for a donor with a τ = 15 ns lifetime in the absence of acceptor and a τ = 3 s lifetime in the presence of acceptor. (A) Simulated emission of a donor in the absence (blue) and presence (red) of acceptor in response to pulsed excitation (black). (B) Simulated emission of a donor in the absence (blue, D) and presence (red, DA) of acceptor in response to 50 MHz modulated excitation (black) shown in the time domain. The phase delay is given by φ, and the modulation ratio is given by m. (C) Simulated emission of a donor in the absence (blue) and presence (red) of acceptor in response to modulated excitation from 10 to 200 MHz shown in the frequency domain. The phase delay is given by φ, and the modulation ratio is given by m. The points indicate φ and m in response to 50 MHz modulated excitation.
Tables
Table 1
Fit parameters for frequency-domain lifetime data.
| Donor | Acceptor | Recovery | τD1 (ns) | α1 | τD2 (ns) | (Å) | σ1 (Å) | (Å) | σ2 (Å) | A2 0.2 mM | A2 0.37 mM | |
|---|---|---|---|---|---|---|---|---|---|---|---|---|
| Anap | n/a | |||||||||||
| Mean | 1.3 | 0.76 | 3.3 | |||||||||
| SEM | 0.02 | 0.003 | 0.02 | |||||||||
| n | 4 | 4 | 4 | |||||||||
| Acd | n/a | |||||||||||
| Mean | 16.0 | |||||||||||
| SEM | 0.03 | |||||||||||
| n | 4 | |||||||||||
| MBP-295Acd-Y307F-C | Cu2+-TETAC | |||||||||||
| Mean | 0.92 | 15.6 | 23.7 | 6.2 | 13.4 | 6.5 | ||||||
| SEM | 0.040 | 0.05 | 0.36 | 0.47 | 0.38 | 0.27 | ||||||
| n | 10 | 10 | 10 | 10 | 7 | 7 | ||||||
| MBP-322Acd-C | Cu2+-TETAC | |||||||||||
| Mean | 0.94 | 15.1 | 13.6 | 5.3 | 15.8 | 5.5 | ||||||
| SEM | 0.015 | 0.09 | 0.06 | 0.22 | 0.09 | 0.15 | ||||||
| n | 5 | 5 | 5 | 5 | 4 | 4 | ||||||
| MBP-295Acd-Y307F-HH | Cu2+ | |||||||||||
| Mean | 0.88 | 15.5 | 18.3 | 2.5 | 12.7 | 1.3 | 0.38 | 0.60 | ||||
| SEM | 0.040 | 0.07 | 0.21 | 0.54 | 0.04 | 0.26 | 0.002 | 0.02 | ||||
| n | 5 | 5 | 3 | 3 | 4 | 4 | 3 | 3 | ||||
| MBP-295Acd | n/a | |||||||||||
| Mean | 14.0 | 0.70 | 2.0 | |||||||||
| SEM | 0.14 | 0.011 | 0.08 | |||||||||
| n | 5 | 5 | 5 |
-
and σ1 are from fits to the data in the absence of maltose. and σ2 are from fits to the data in the presence of 10 mM maltose. Recovery refers to fits to the data in the presence of TCEP, for Cu2+-TETAC, and EDTA, for Cu2+.
Table 2
Predicted donor-acceptor distances from MBP X-ray crystal structures.
| Donor | Acceptor | R0 (Å) | Apo vs. Holo | rpredicted,β-carbon (Å) | rpredicted,centroid (Å) |
|---|---|---|---|---|---|
| MBP-295Acd-Y307F-C | Cu2+-TETAC | 14.9 | Apo | 21.3 | 21.7 |
| MBP-295Acd-Y307F-C | Cu2+-TETAC | 14.9 | Holo | 12.8 | 12.1 |
| MBP-295Acd-Y307F-HH | Cu2+ | 12.2 | Apo | 18.7 | 17.1 |
| MBP-295Acd-Y307F-HH | Cu2+ | 12.2 | Holo | 10.9 | 7.8 |
| MBP-322Acd-C | Cu2+-TETAC | 14.9 | Apo | 13.4 | 11.2 |
| MBP-322Acd-C | Cu2+-TETAC | 14.9 | Holo | 17.7 | 18.8 |
-
rpredicted, β-carbon, and rpredicted centroid were determined from PDB structures 1OMP and 1ANF. The calculated R0 values and predicted distances for MBP-295Acd constructs are the same as for MBP-295Acd-Y307F constructs.
Key resources table
| Reagent type (species) or resource | Designation | Source or reference | Identifiers | Additional information |
|---|---|---|---|---|
| Cell line (Homo sapiens) | HEK293T/17 | ATCC | ATCC: CRL-11268;RRID:CVCL_1926 | |
| Recombinant DNA reagent | NESAcdRS82.pUC57 | BioBasic | ||
| Recombinant DNA reagent | pAcBac1.tR4-MbPyl | Plasmid # 50832; http://n2t.net/addgene:50832; | RRID:Addgene_50832 | |
| Recombinant DNA reagent | pANAP | Addgene: DOI: 10.1021/ja4059553 | Addgene: 48696 | |
| Recombinant DNA reagent | DN-eRF1 (peRF1-E55D.pcDNA5-FRT) | Jason Chin: DOI: 10.1021/ja5069728 | ||
| Recombinant DNA reagent | FLAG-MBP1-K295TAG-W340A.pcDNA3-k | Addgene | Plasmid # 126627 | |
| Recombinant DNA reagent | FLAG-MBP1-K295TAG-W340A-S233H-T237C.pcDNA3-k | Addgene | Plasmid # 127402 | |
| Recombinant DNA reagent | FLAG-MBP1-E322TAG-W340A.pcDNA3-k | Addgene | Plasmid # 127404 | |
| Recombinant DNA reagent | FLAG-MBP1-E322TAG-E309C-W340A.pcDNA3-k | Addgene | Plasmid # 127408 |
Additional files
Download links
A two-part list of links to download the article, or parts of the article, in various formats.
Downloads (link to download the article as PDF)
Open citations (links to open the citations from this article in various online reference manager services)
Cite this article (links to download the citations from this article in formats compatible with various reference manager tools)
An improved fluorescent noncanonical amino acid for measuring conformational distributions using time-resolved transition metal ion FRET
eLife 10:e70236.
https://doi.org/10.7554/eLife.70236


