Cortico-subcortical β burst dynamics underlying movement cancellation in humans
- Department of Psychological and Brain Sciences, University of Iowa, United States
- Department of Neurosurgery, University of Iowa Carver College of Medicine, United States
- Iowa Neuroscience Institute, University of Iowa, United States
- Department of Neurology, University of Iowa Carver College of Medicine, United States
Figures
Figure 1 with 1 supplement
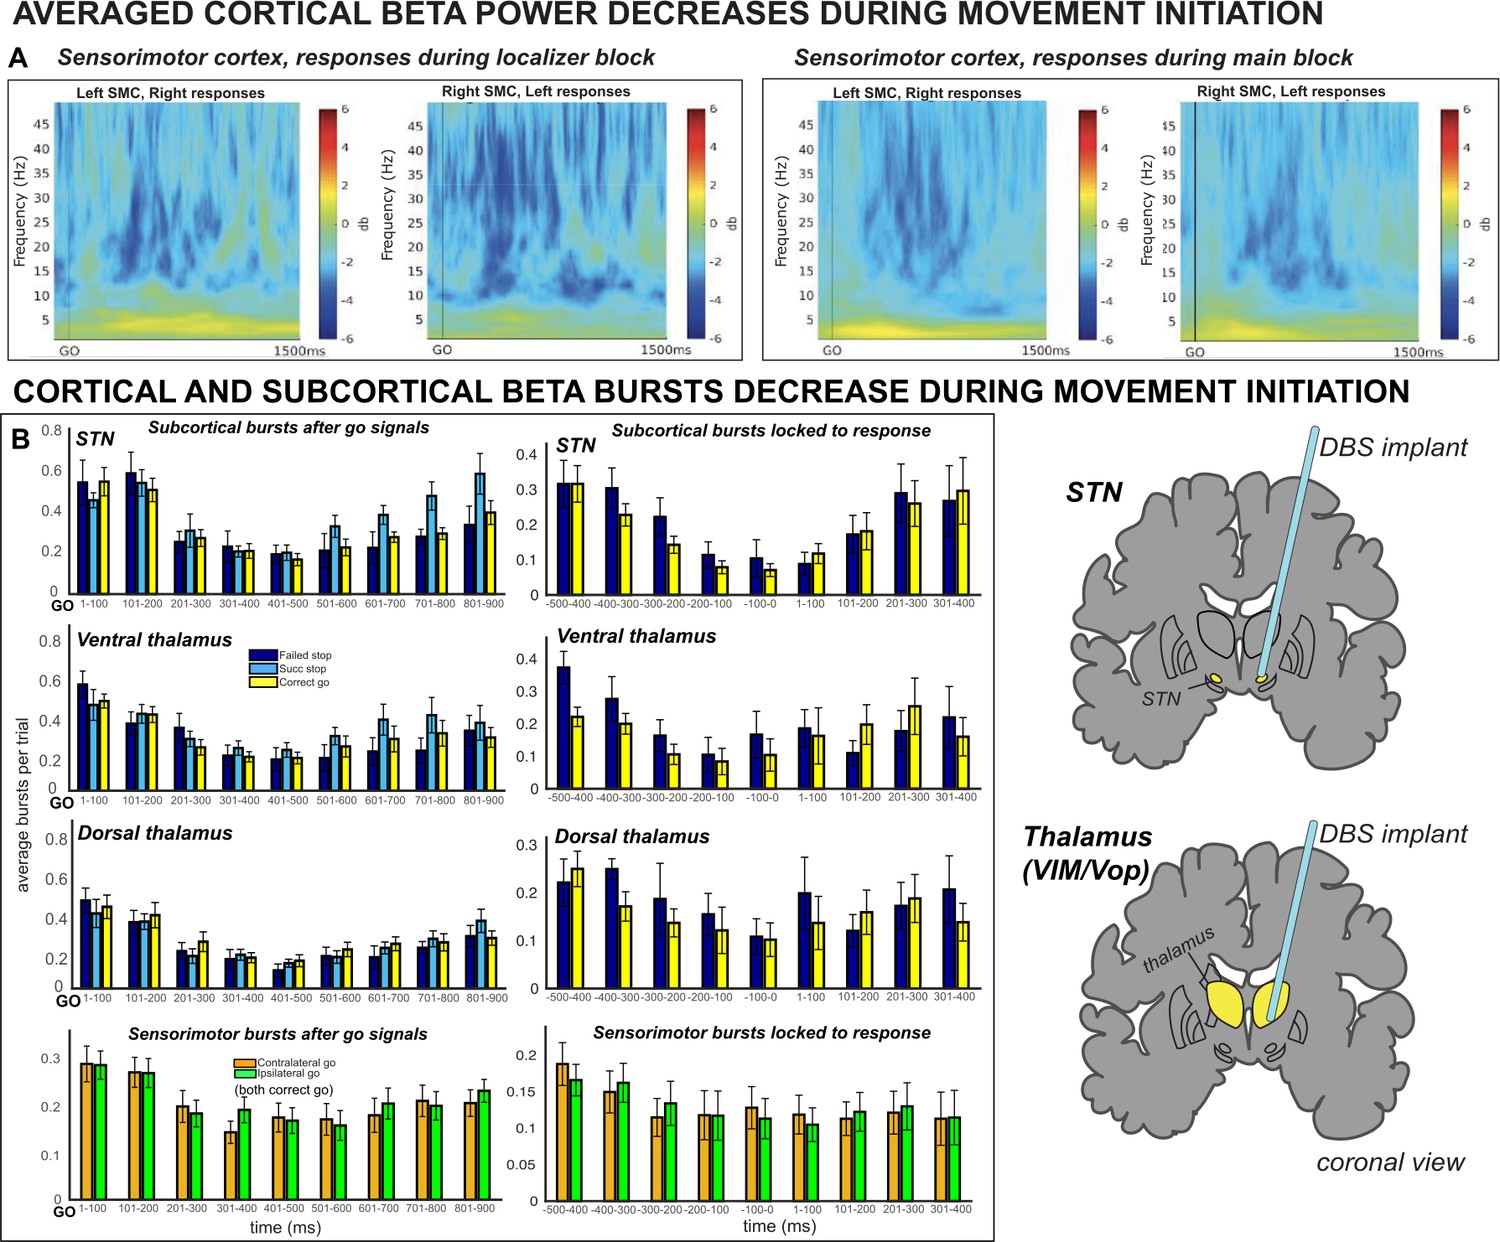
Averaged β power and β burst rates decreased across recording sites during movement execution.
(A) Broadband ERSPs shown were computed from 100ms preceding to 1500ms following the go signal. The two left-most plots include ERSPs from the localizer block and the right-most plots include ERSPs during the main block. In averaged ERSPs during movement on go-trials, both localizer and main task sessions show clearly visible β power decreases following the go signal. (B) Average burst rates at each recording location following the go-signal and surrounding response execution (for go and failed stop trials) are depicted in time bins of 100ms. During the main task session, β burst rates decrease quickly following the go signal in STN, thalamus (both ventral and dorsal contacts), and SMC until a response is made.
Figure 1—figure supplement 1
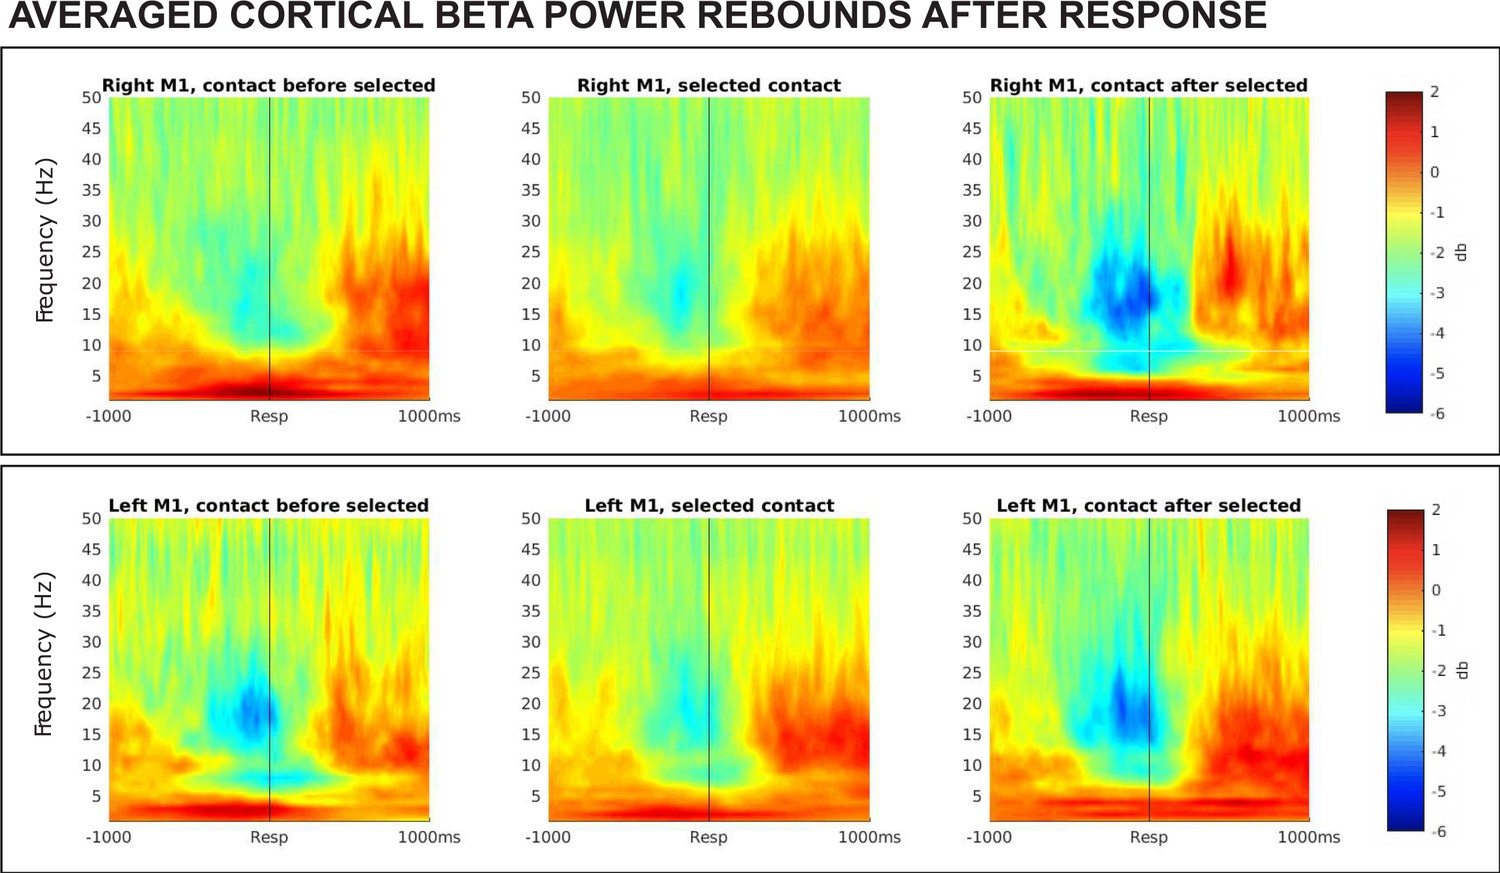
Averaged ERSPs from all SMC contact pairs, 1000 ms before to 1000 ms following movement execution during contralateral correct go trials.
The data was baseline-corrected using a baseline window from 1100 ms before to 1000 ms before response. Electrodes selected for the β burst analysis are shown in the central column, flanked by adjacent electrode pairs (if they were present a subject’s data). β rebound is pronounced at all electrodes but occurs most rapidly at electrodes selected for analysis.
Figure 2
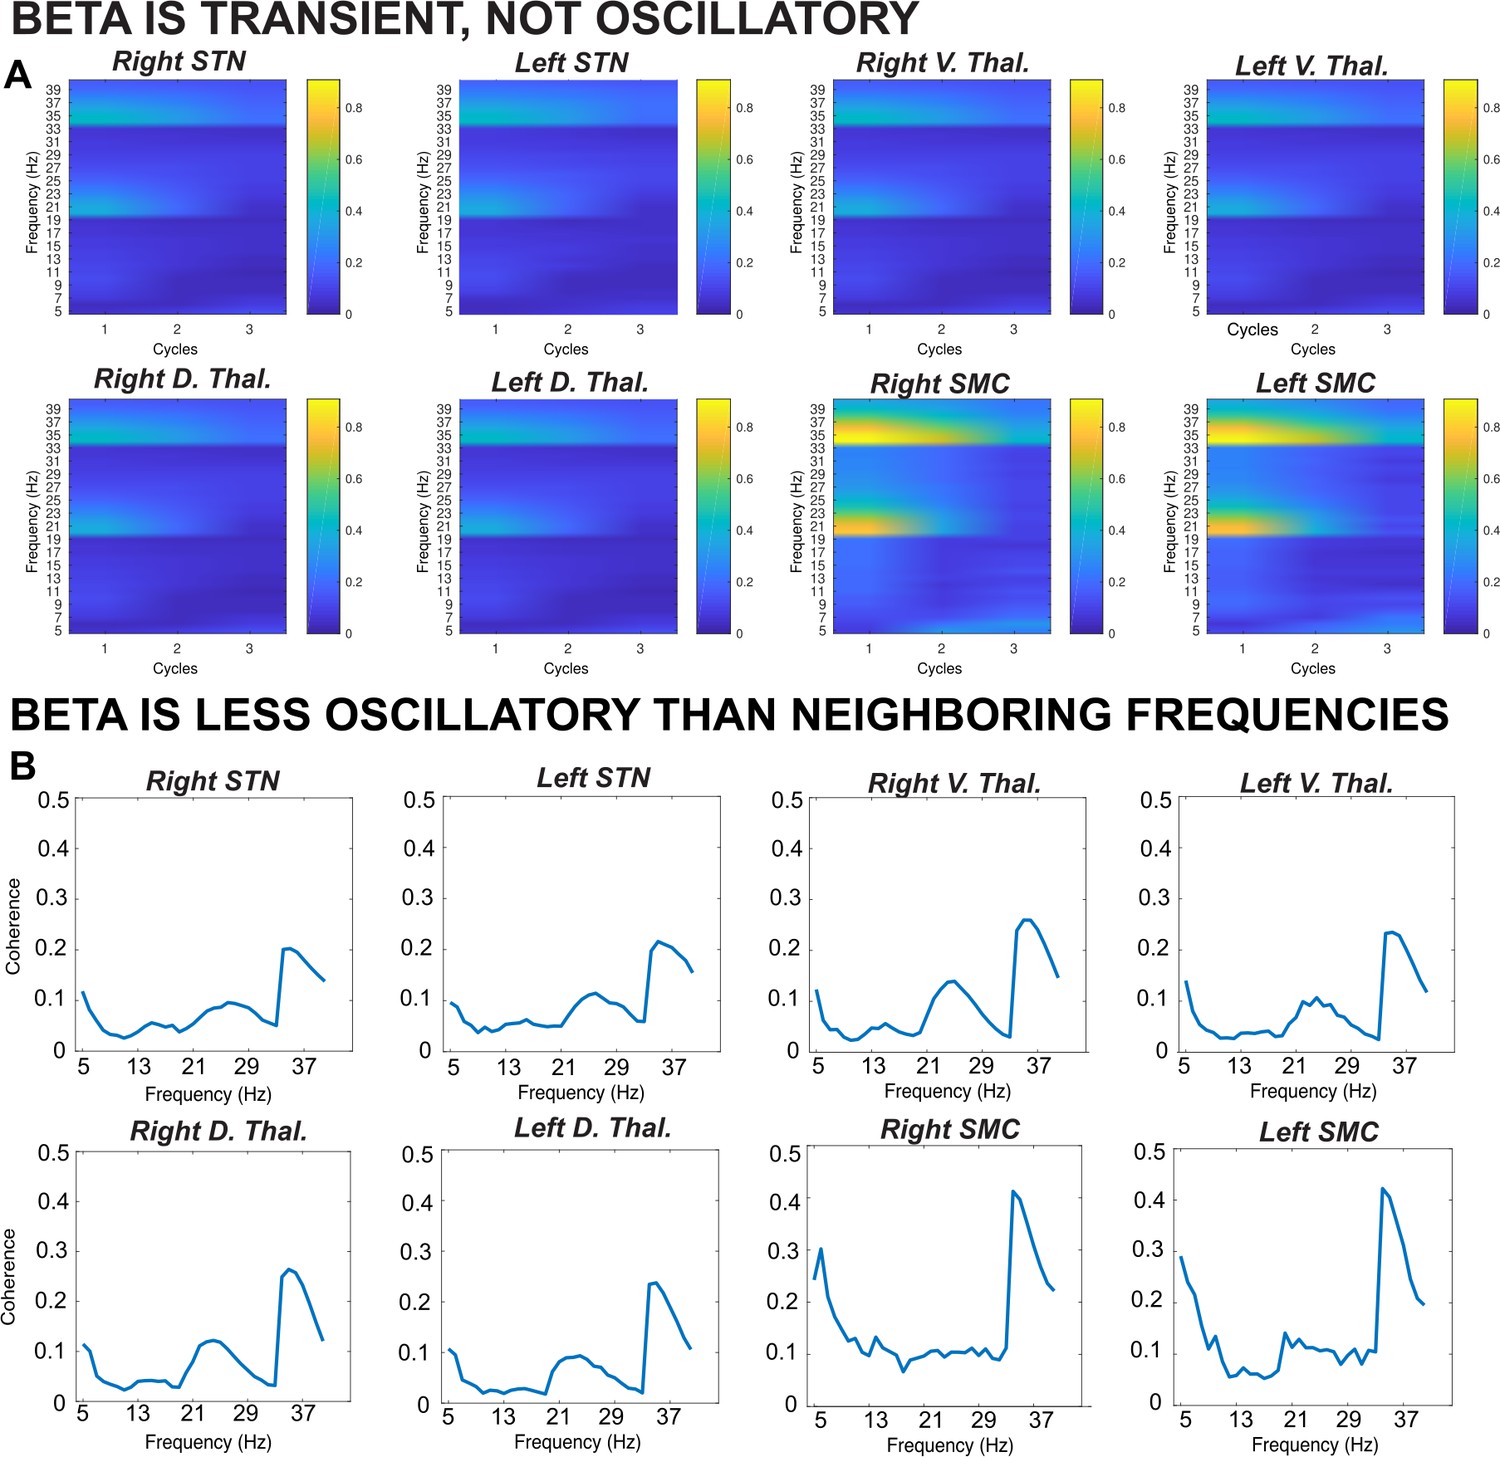
Results from a lagged coherence analysis on epoched data including go and stop trials.
(A) While coherence is relatively high at one cycle (current phase predicts phase in one cycle well), lagged coherence decreases over time so that lagged coherence in the β band is relatively low at three cycles across recording locations. This supports the claim that β is transient and not oscillatory in nature. (B) Coherence shown is at three cycles. The β burst search band (15–29 Hz) represents a relative trough compared to below- and above-β frequencies, indicating that β signals are more transient and less oscillatory than signals in neighboring frequency bands. β is most burst-like in the SMC, slightly less burst-like in STN, and least burst-like compared to neighboring frequencies in the thalamus.
Figure 3 with 4 supplements

β burst rates increase following stop signals.
(A) Increases in average β band activity are observed at all subcortical recording sites during stop trials (contrast shown is between successful stops and correct go trials). (B) The total number of β bursts was quantified between trial-wise stop-signal onset (SSD) and participant-wise SSRT. For matched go-trials, this window began at current SSD stored in the staircase. Each point represents the average burst count for one participant. β bursts increased at early latencies in STN and thalamus during successful cancellation (when quantified between SSD and SSRT) and at later latencies in both thalamus and STN during stop trials (panel D). (C) The differences in burst counts and rates in panels B and D could not be accounted for by differences in pre-go or pre-stop baseline burst rates, quantified in the 100ms preceding go- or stop-signal onset. (D) Average burst rates at each subcortical recording location time-locked to the stop-signal (left) or subject-wise SSRT (right) are depicted in time bins of 100ms. The gray lines on the time-bin plots show the SSRT sample average for STN and thalamic DBS patient groups. (Significant comparisons key: green stars = comparison between successful stop and go trials, navy stars = comparison between successful and failed stop trial; * indicates p < 0.05, ** indicates p < 0.01, *** indicates p < 0.001. Significant effects displayed in the plot are effects of TRIAL TYPE, on burst counts (B) or on burst rates at given time points (D).
Figure 3—figure supplement 1
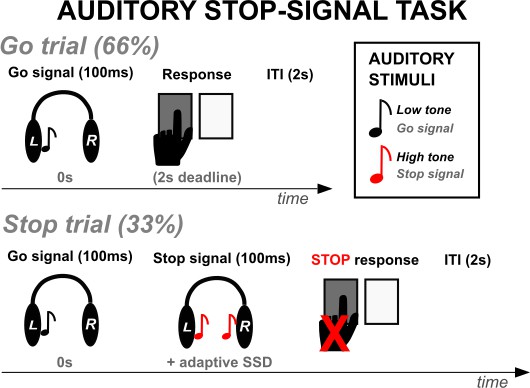
Participants performed an auditory version of the stop-signal task while LFP recordings were collected.
Figure 3—figure supplement 2
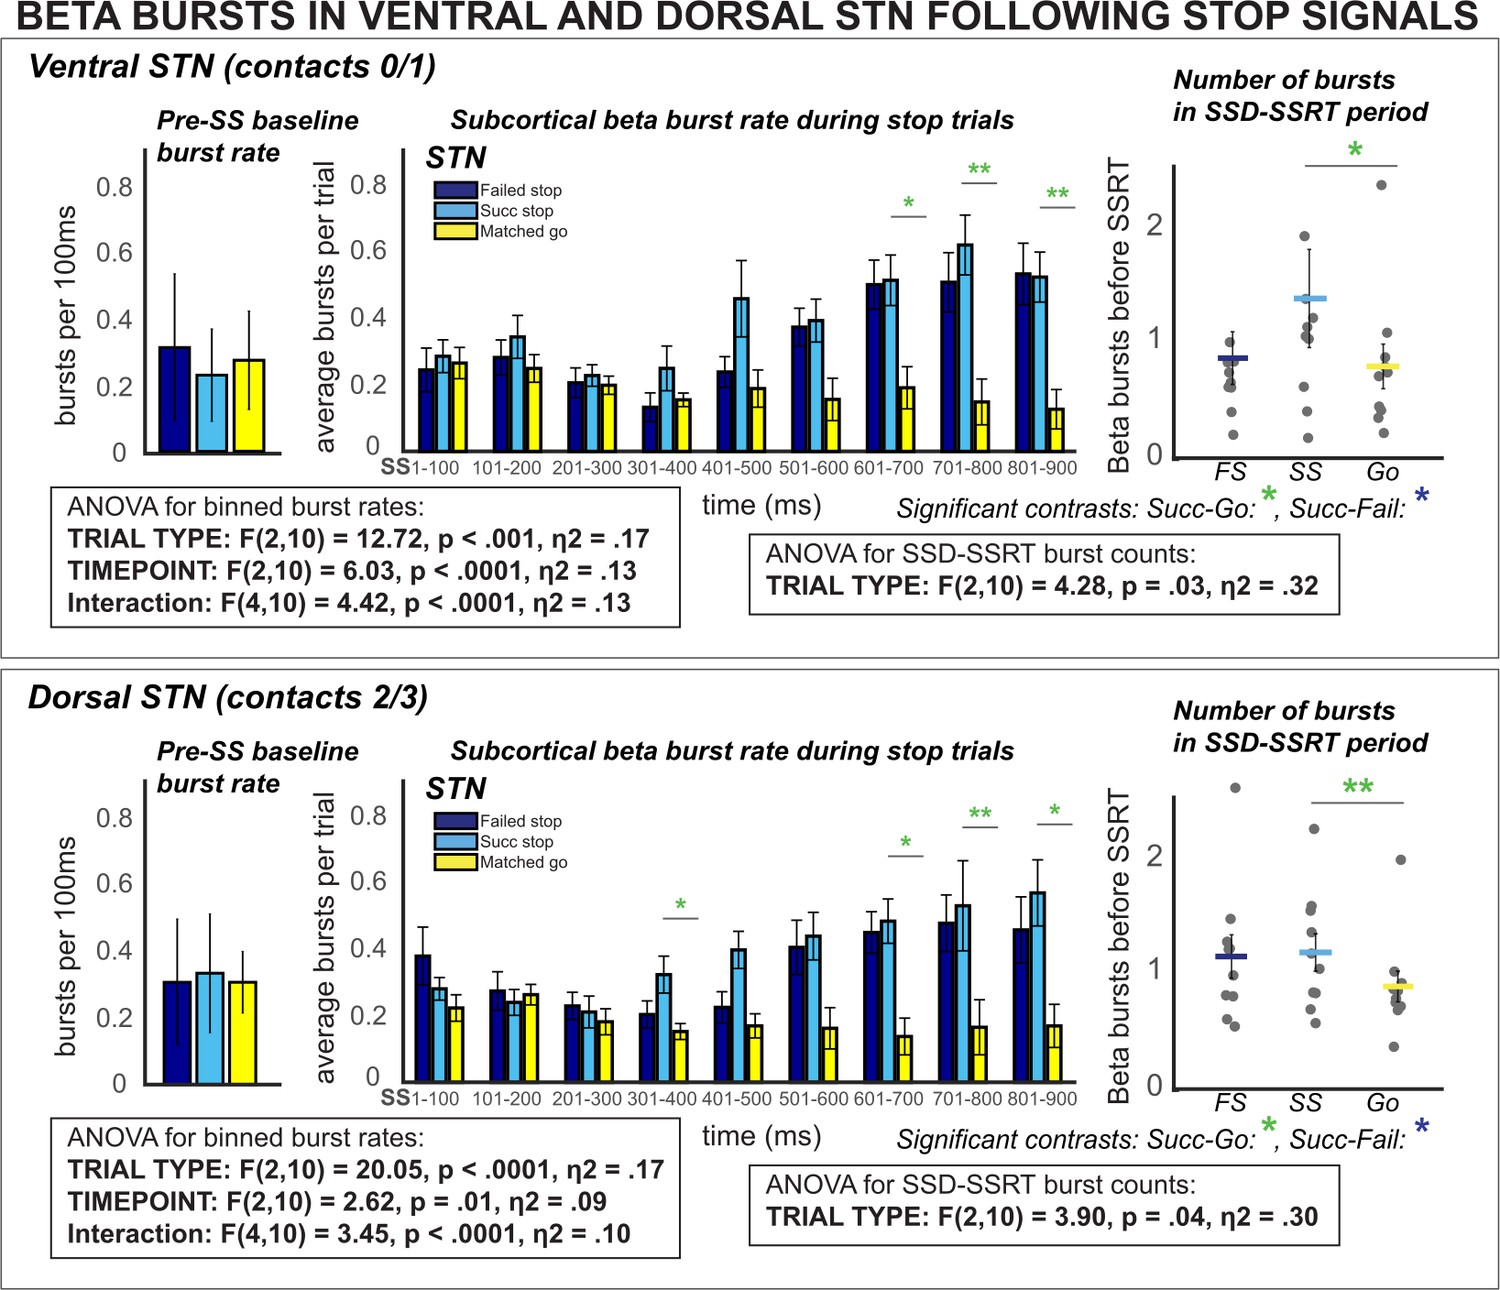
β burst rates increase following stop signals in ventral and dorsal STN.
Burst rates increased at early latencies in both dorsal and ventral STN (when quantified between SSD and SSRT) and at later latencies following SSRT. These differences could not be accounted for by differences in pre-stop baseline burst rates (* indicates p < 0.05, ** indicates p < 0.01, *** indicates p < 0.001).
Figure 3—figure supplement 3
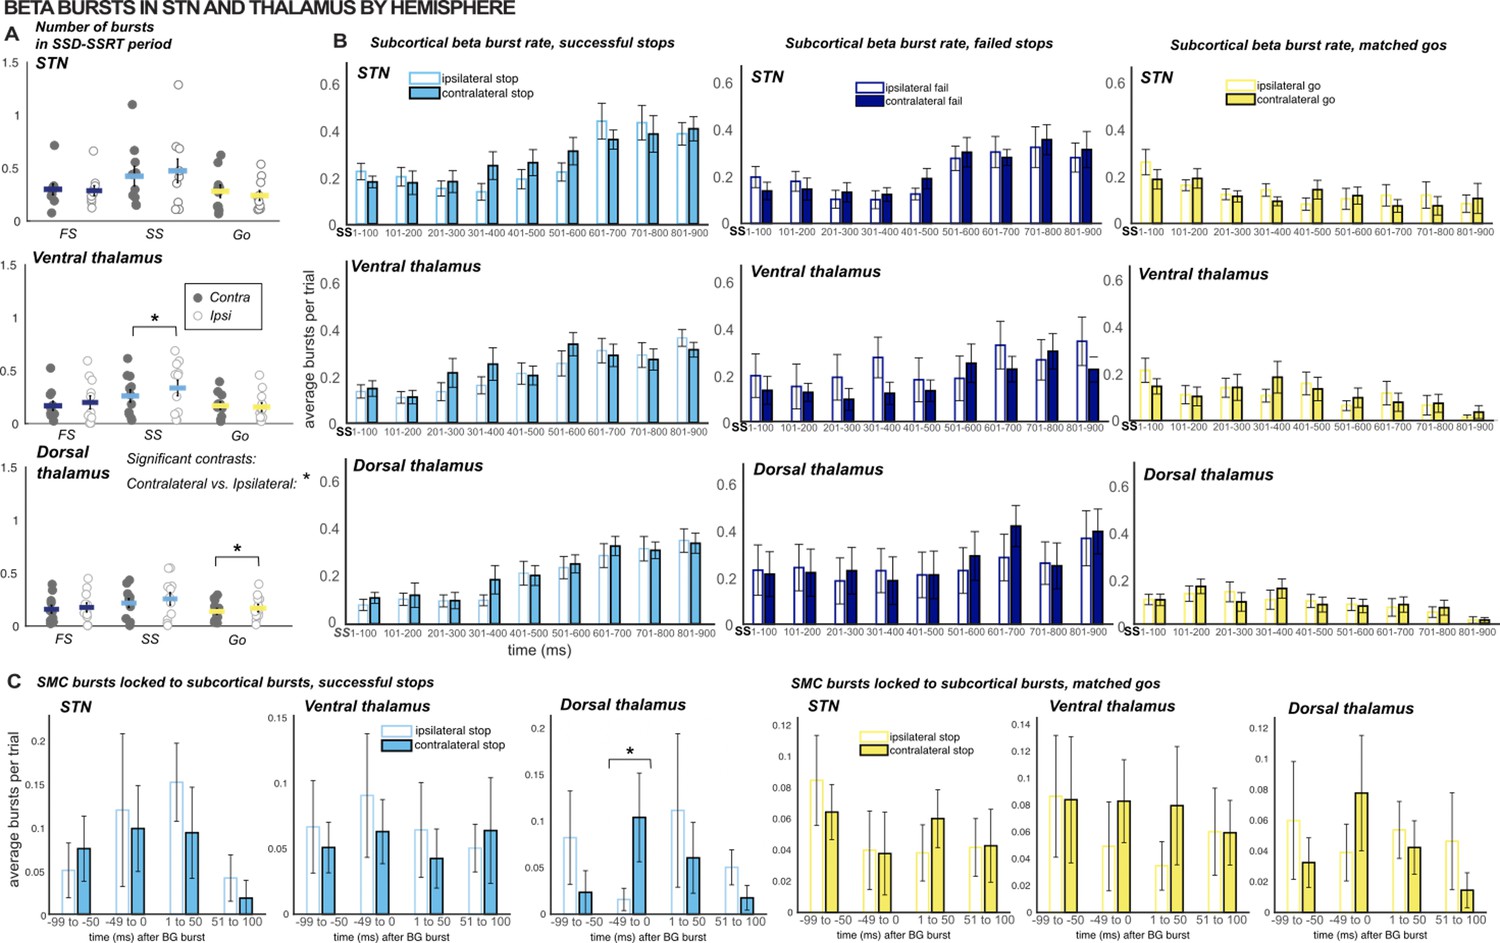
Comparing β burst counts and rates across hemispheres.
(A) The total number of β bursts was quantified between trial-wise stop-signal onset (SSD) and participant-wise SSRT. For matched go-trials, this window began at current SSD stored in the staircase. Each point represents the average burst count for one participant. Gray dots are values for the contralateral hemisphere and white dots are from the ipsilateral hemisphere. (B) Average burst rates at each subcortical recording location time-locked to the stop-signal (or SSD, for matched go trials) are depicted in time bins of 100ms. Solid bars represent values from the contralateral hemisphere and white bars represent values from the ipsilateral hemisphere. (C) Timing of SMC bursts with respect to subcortical bursts, in 50ms time bins. All burst rates were calculated in the 500ms following stop-signal onset (or SSD, for matched-go trials). The only timebins and count windows in which significant differences were observed between contralateral and ipsilateral (to movement) hemispheres were the SSD-SSRT counts for successful stops in ventral thalamus (p = 0.03) and matched go trials in dorsal thalamus (p = 0.02) and burst rates in the -50-0ms time bin when quantifying SMC burst rates time-locked to dorsal thalamic bursts during successful stops (p = 0.01 ; * indicates p < 0.05).
Figure 3—figure supplement 4
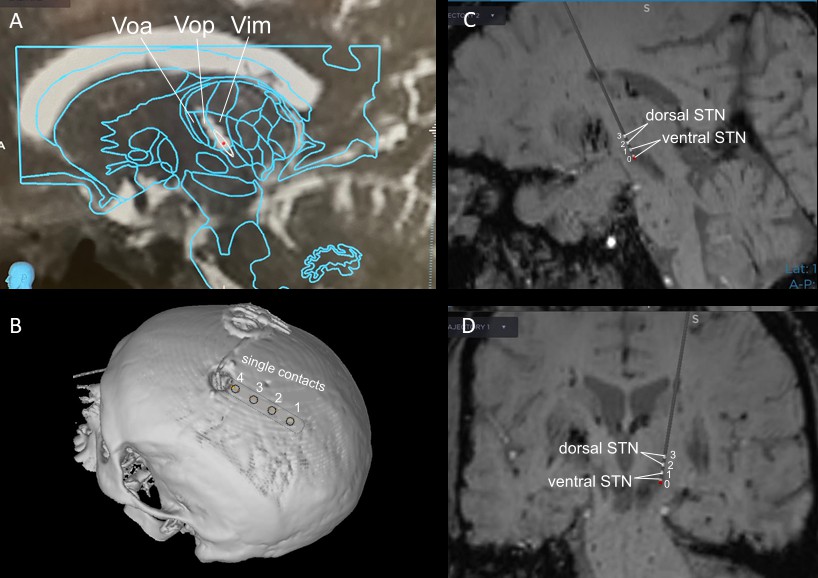
Exemplar estimations of recording lead locations based on pre- and post-operative imaging and planned implant trajectory in a VIM and STN DBS case.
VIM (A) and STN (C – sagittal view, D – coronal view) implants were placed using framed indirect stereotactic targeting refined by standard confirmatory physiologic testing and macrostimulation. STN implant placement was further confirmed with multi-electrode simultaneous microelectrode recordings. The bilateral subgaleal electrode strips (B) were directed posteriorly from the burr holes at the coronal suture and positioned above sensorimotor cortex.
Figure 4 with 1 supplement
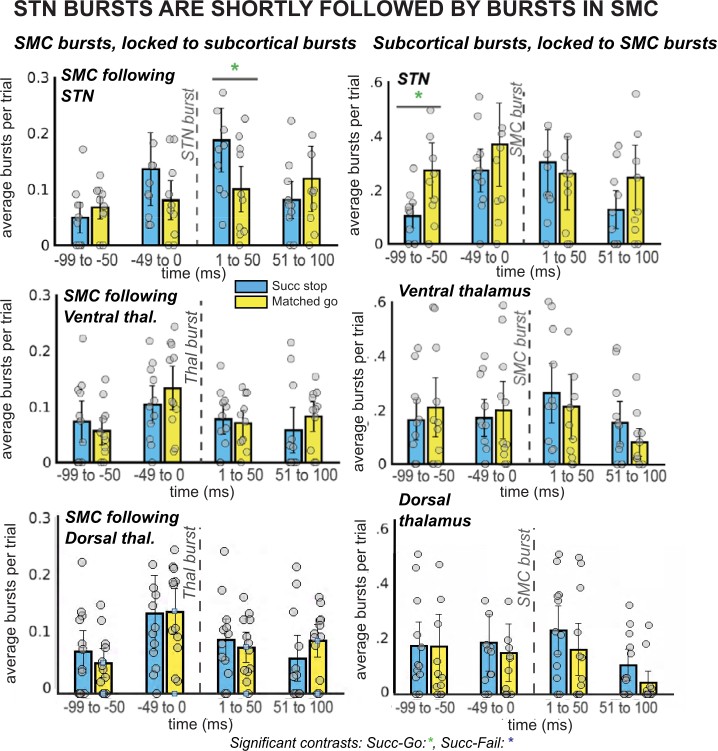
β burst rates in SMC increase following STN bursts.
The left column of plots displays the timing of SMC bursts with respect to subcortical bursts, in 50ms time bins. The right column displays timing of subcortical bursts with respect to SMC bursts. All burst rates were calculated in the 500ms following stop-signal onset (or SSD, for matched-go trials). Each gray dot is the average burst rate per participant in the given time bin. In the STN group, the first STN burst following the stop signal (or SSD, for matched-go trials) was followed within 50ms by bursts in the SMC for stop, but not go, trials. This reliable temporal relationship between STN and SMC bursts during movement cancellation did not follow the opposite pattern – STN bursts did not reliably follow SMC bursts at a specific time point. (Significant comparison key: green stars = comparison between successful stop and go trials; * indicates uncorrected p < 0.05. Effects indicated in the figure are effects of TRIAL TYPE on burst rate at given time points.)
Figure 4—figure supplement 1
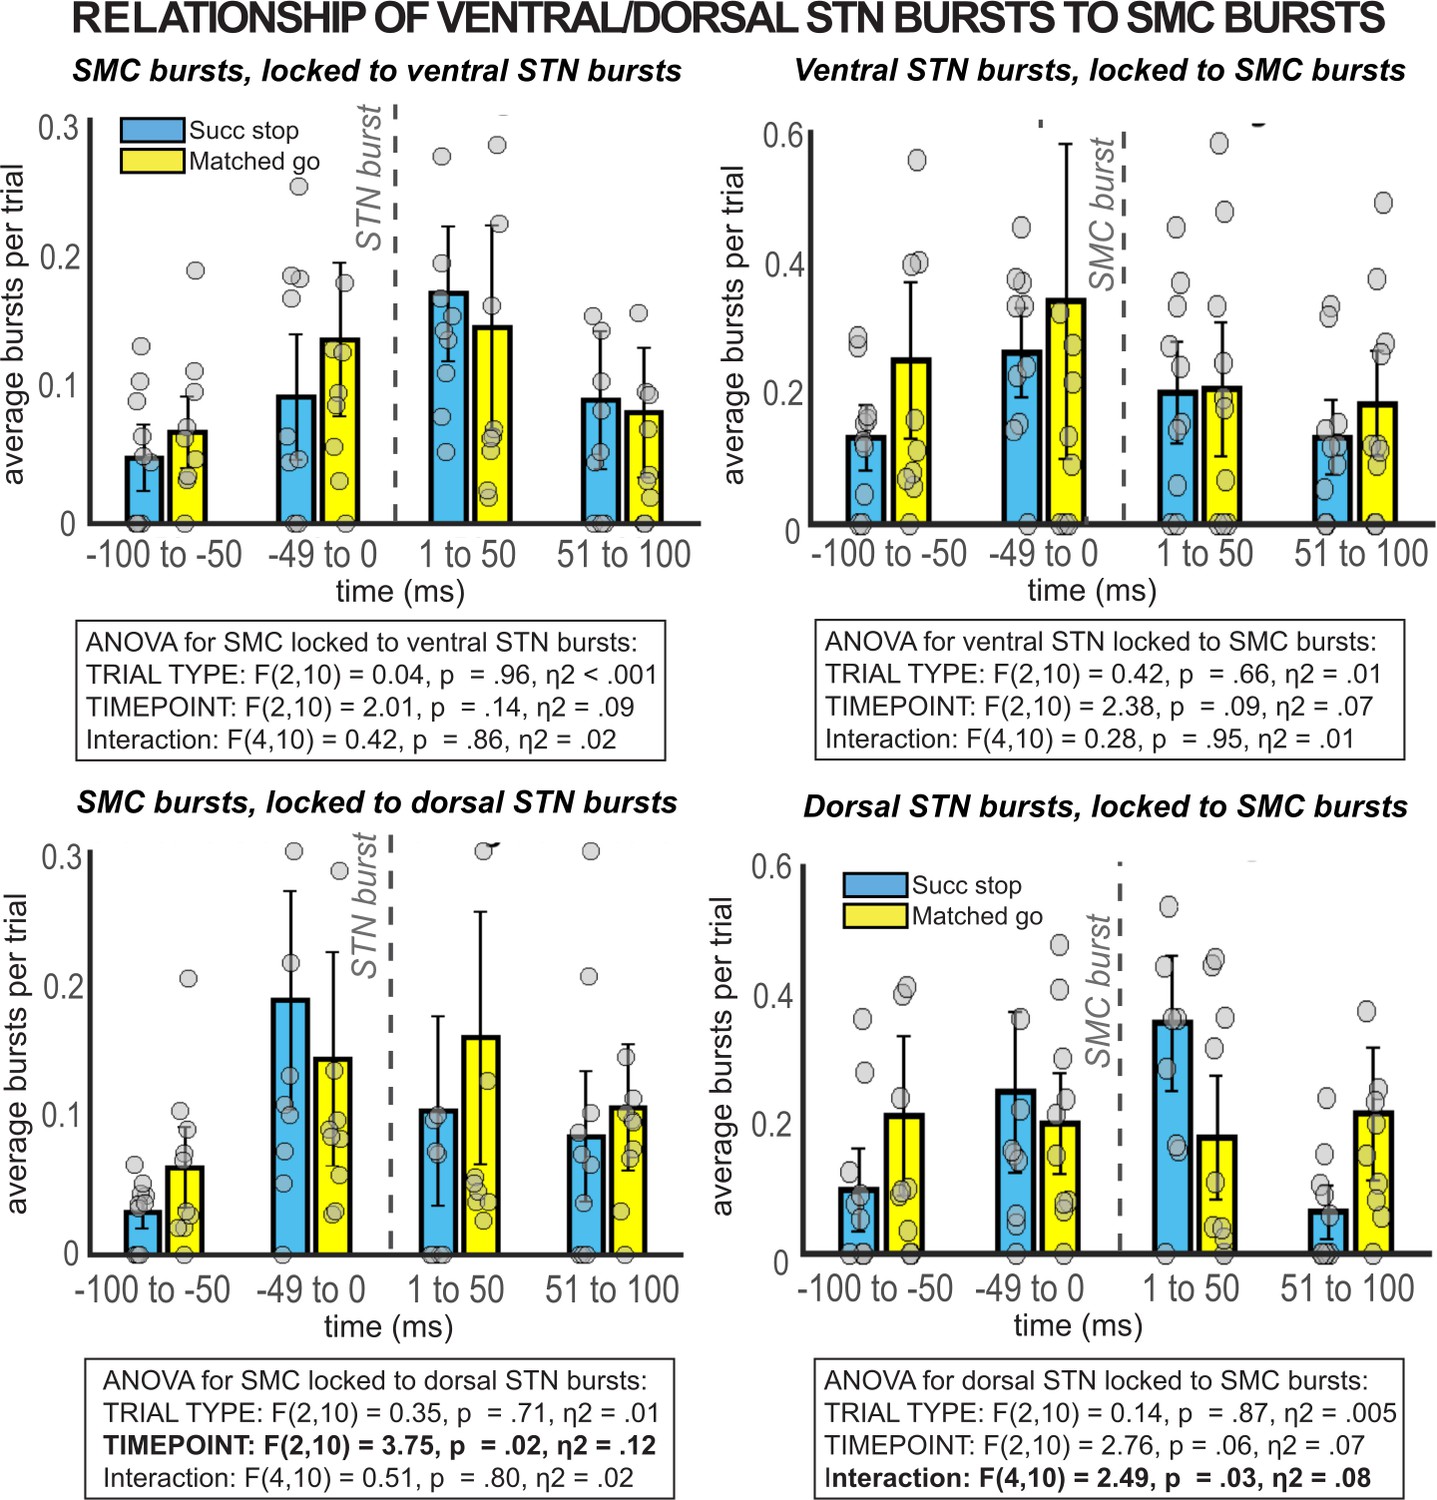
β burst rates in SMC preceding and following bursts in ventral and dorsal STN.
When STN electrodes are chosen based on location (contacts 0/1 = ventral, contacts 2/3 = dorsal) instead of number of β bursts over the recording, no significant temporally resolved relationships are observed between β bursts in STN and SMC.
Figure 5
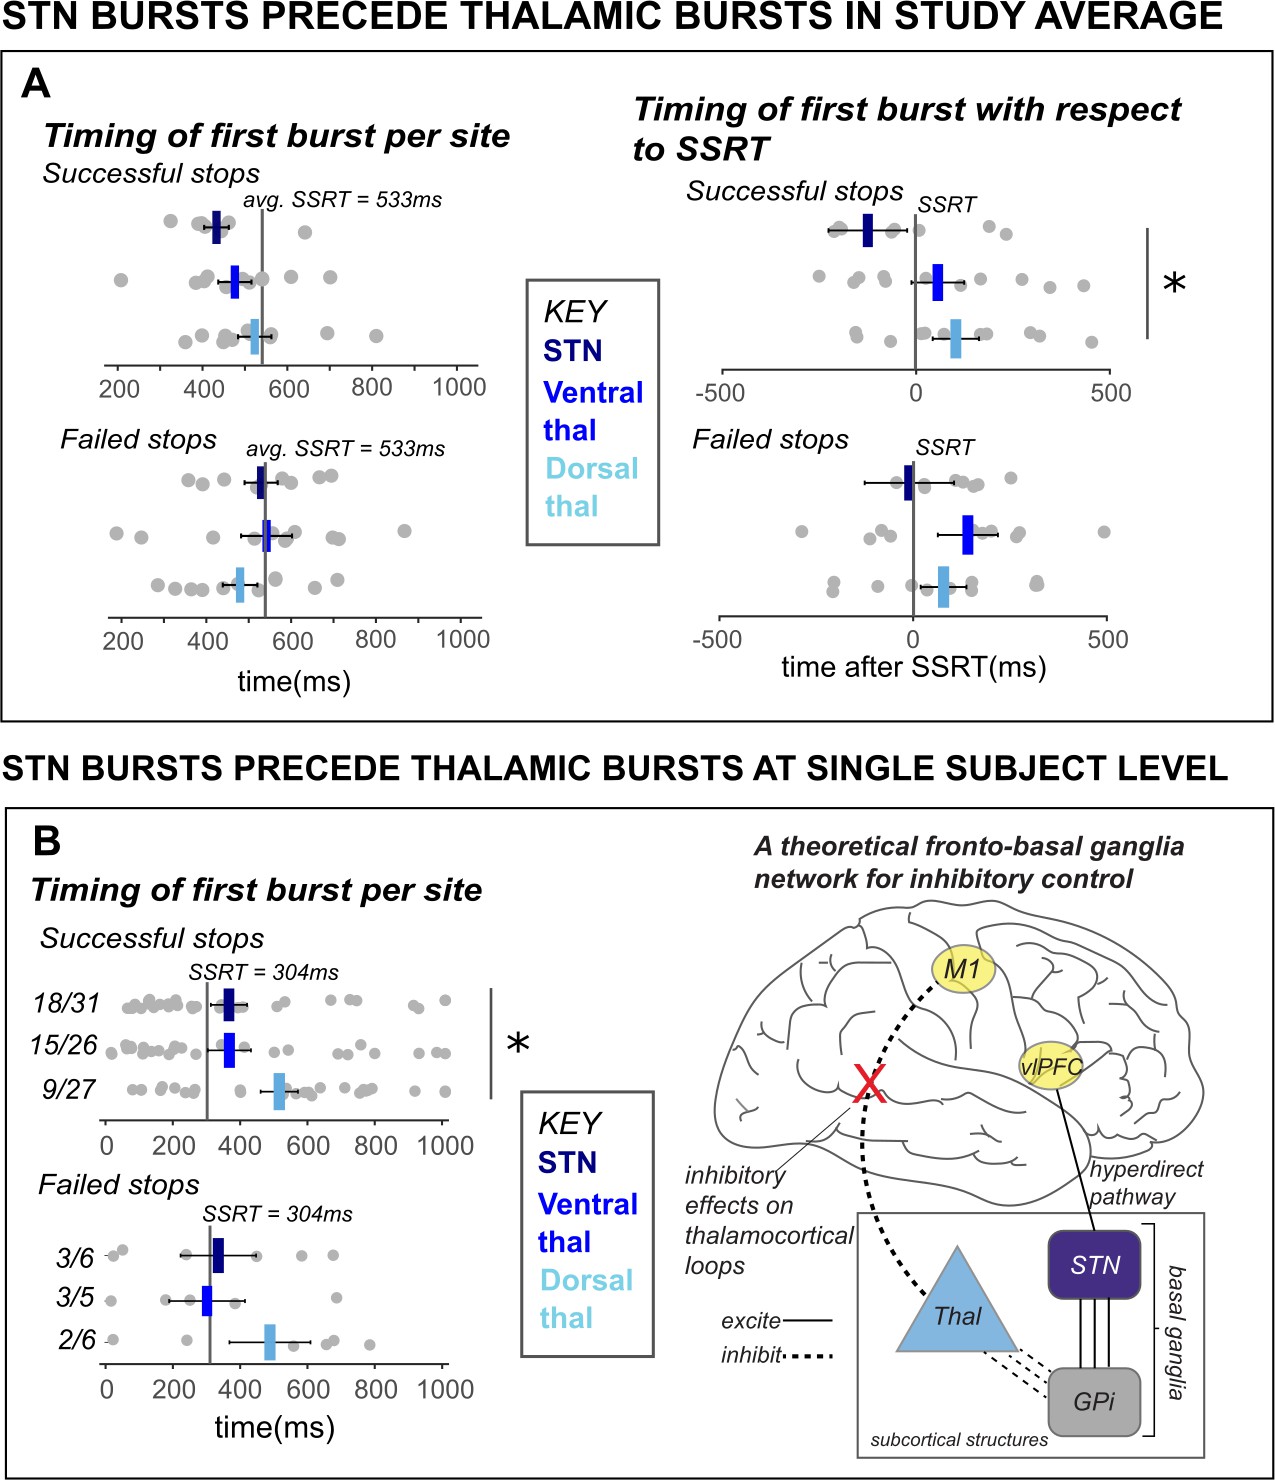
β bursts in STN precede bursts in thalamus.
A) The timing of first bursts from the STN in STN DBS patients and thalamic regions in thalamus DBS patients are shown with respect to the stop-signal (left) and participant-wise SSRT (right). First bursts were quantified between stop-signal onset and 1 s following stop-signal onset. Each gray dot represents a participant’s mean burst timing for each trial type and recording location. The central line on the barplots represents the average of single-subject mean burst timings. (B) The timing of first bursts from the STN and thalamic regions in the single subject with both STN and thalamic DBS are shown with respect to the stop-signal (left) and participant-wise SSRT (right). Each dot represents the timing of a burst for a single trial, while the central bar represents the median burst timing. Bursts that occur in each region before SSRT are counted. Across the entire study sample (A) and in our single subject with simultaneous STN and thalamic recording sites (B), STN bursts occurred earlier than dorsal thalamic bursts during cancellation. These findings from subcortical regions in our datasets lend support for an account of subcortical dynamics proposed in a theorized network model of movement cancellation, which posits that the STN is recruited prior to and acts to net-inhibit the thalamus during cancellation (red X indicates reduction of thalamocortical drive). (Significant comparison key: stars = comparison between burst timing in STN and dorsal thalamus; * indicates p < 0.05. Effects indicated in the figure are effects of BURST LOCATION on average burst timing.)
Author response image 1
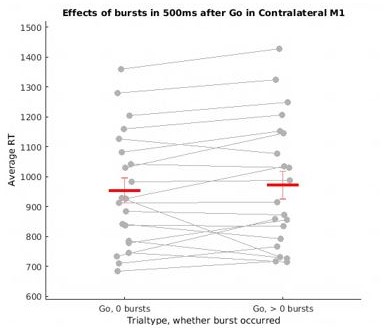
Main effect of trial type (go + fail): F = 35.78, p <.0001; no main effect of burst presence: F = 0.13, p = .72; no interaction effect: F = 0.88, p = .36.
Tables
Table 1
Means of stop-signal task behavioral performance metrics.
* Indicates significant difference between thalamic and STN groups at p < 0.0001. SD = standard deviation.
| Reaction times (ms) | Accuracy | |||
|---|---|---|---|---|
| Go | Failed stop | SSRT | Go trials* | Stop trials |
| All participants | ||||
| 943 (SD: 213) | 763 (SD: 174) | 474 (SD: 232) | 0.89 (SD: 0.07) | 0.61 (SD: 0.16) |
| STN DBS | ||||
| 952 (SD: 234) | 786 (SD: 213) | 533 (SD: 296) | 0.83 (SD: 0.05) | 0.55 (SD: 0.18) |
| Thalamic DBS | ||||
| 934 (SD: 203) | 741 (SD: 136) | 421 (SD: 150) | 0.94 (SD: 0.04) | 0.65 (SD: 0.11) |
Additional files
-
Transparent reporting form
- https://cdn.elifesciences.org/articles/70270/elife-70270-transrepform1-v2.pdf
-
Supplementary file 1
Information about participant diagnoses, handedness, symptom laterality, and pre-operative symptom severity scores.
For participants with Parkinson’s disease, scores shown are from the motor examination portion (i.e., total part III) of the Unified Parkinson’s disease rating scale (UPDRS). For essential tremor participants, scores are from the Fahn-Tolosa tremor scale. All Parkinson’s disease patients besides participant 2 were diagnosed with idiopathic Parkinson’s disease. Participant 2 had a diagnosis of both idiopathic Parkinson’s and essential tremor.
- https://cdn.elifesciences.org/articles/70270/elife-70270-supp1-v2.docx
Download links
A two-part list of links to download the article, or parts of the article, in various formats.
Downloads (link to download the article as PDF)
Open citations (links to open the citations from this article in various online reference manager services)
Cite this article (links to download the citations from this article in formats compatible with various reference manager tools)
Cortico-subcortical β burst dynamics underlying movement cancellation in humans
eLife 10:e70270.
https://doi.org/10.7554/eLife.70270


