An essential, kinetoplastid-specific GDP-Fuc: β-D-Gal α-1,2-fucosyltransferase is located in the mitochondrion of Trypanosoma brucei
- Wellcome Centre for Anti-Infectives Research, School of Life Sciences, University of Dundee, United Kingdom
- Department of Molecular Microbiology, Washington University School of Medicine, United States
Figures
Figure 1
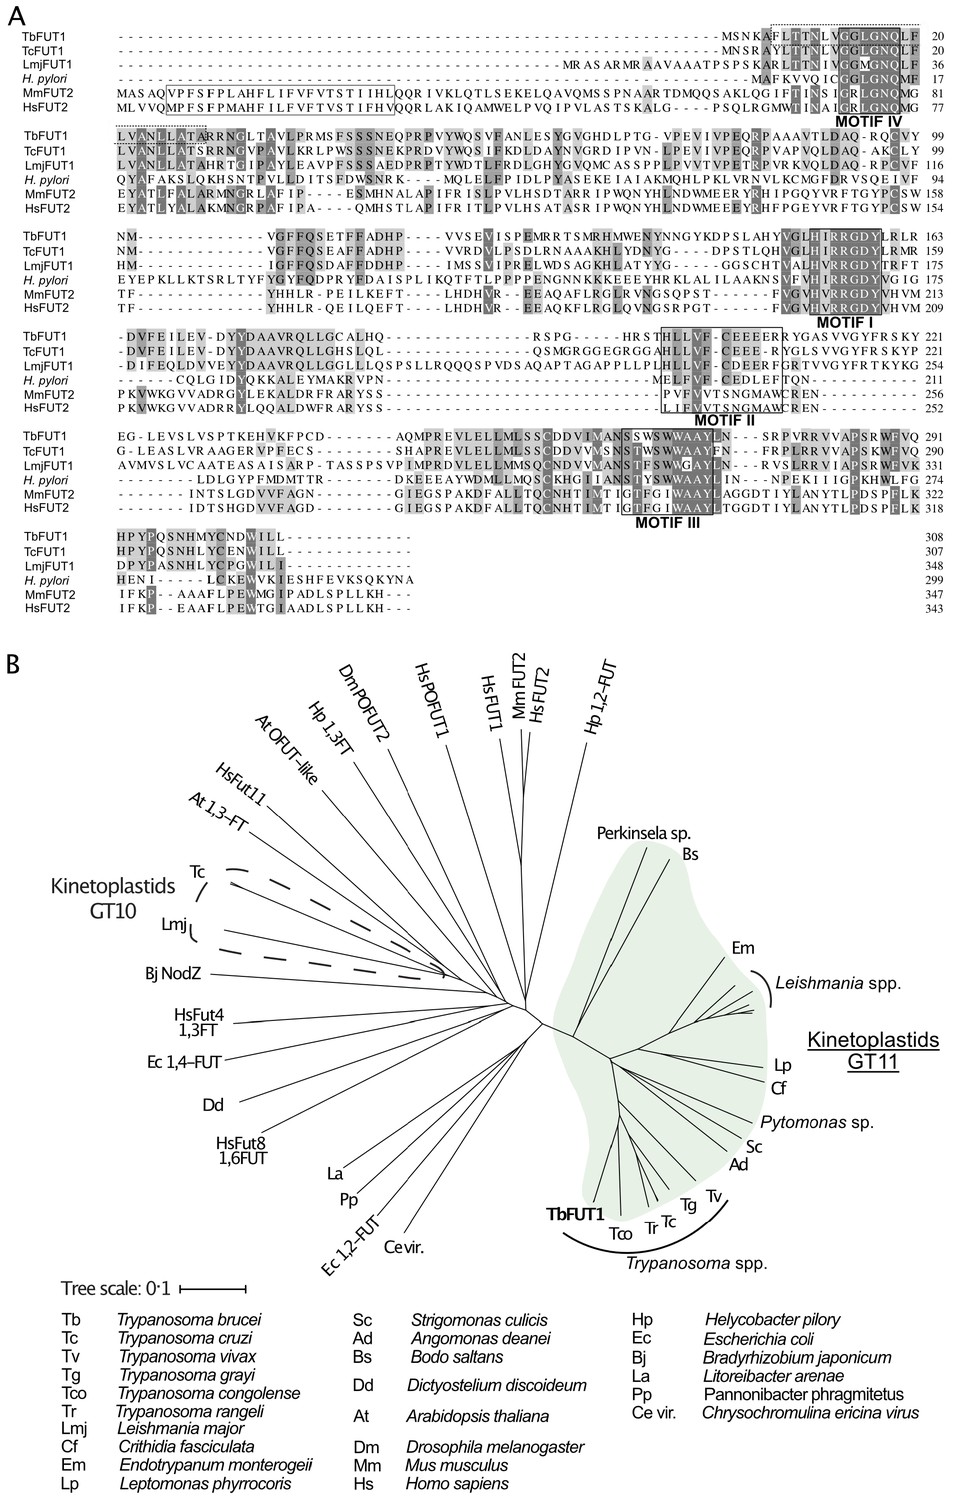
Amino acid sequence and phylogenetic analyses of TbFUT1.
(A) Sequence alignment of TbFUT1 and other GT11 family fucosyltransferases (FUTs) shows that TbFUT1 (Tb927.9.3600) lacks a conventional N-terminal type 2 membrane protein transmembrane domain (TM, grey box) but contains conserved motifs I–IV (black boxes). A putative TbFUT1 TM (dashed box) overlaps with motif IV but does not align with the eukaryotic FUT TM and is most likely part of a cleavable N-terminal mitochondrial targeting sequence (residues 1–31 with cleavage at R30–R31). Sequences used in the alignment: T. cruzi (TcCLB.506893.90), L. major (LmjF01.0100), H. pylori (AAC99764), Homo sapiens FUT2 (AAC24453), and Mus musculus FUT2 (AAF45146). (B) A selection of known and predicted fucosyltransferase protein sequences was aligned using ClustalΩ (Sievers et al., 2011), and the unrooted phylogram shown was generated by iTOL (itol.embl.de) (Letunic and Bork, 2016). Single homologues of the GT11 TbFUT1 were found in all the kinetoplastids (marked in green) and, collectively, these sequences form a clade distant from other fucosyltransferase sequences, including the other kinetoplastid GT10 fucosyltransferases (marked by a dashed line). No TbFUT1 homologues were found in apicomplexan parasites or in Euglena.
Figure 2 with 2 supplements
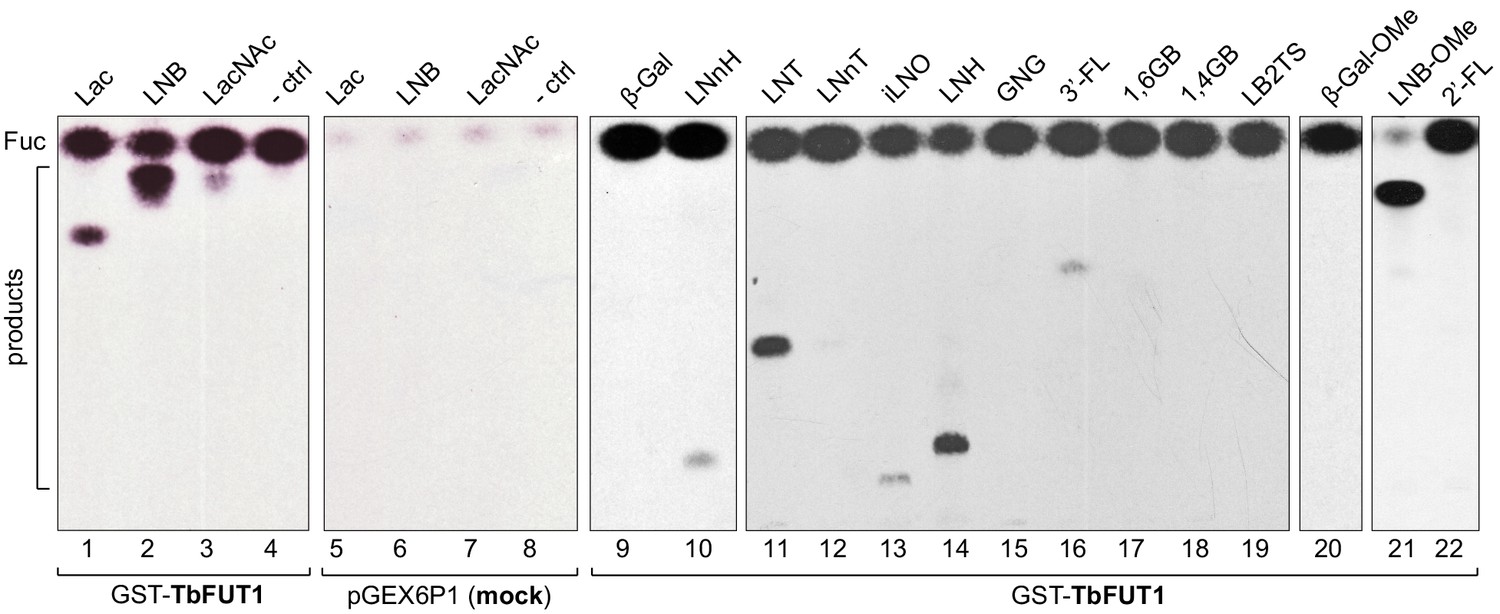
Recombinant GST-TbFUT1 transfers [3 H]Fuc to a variety of sugar acceptors.
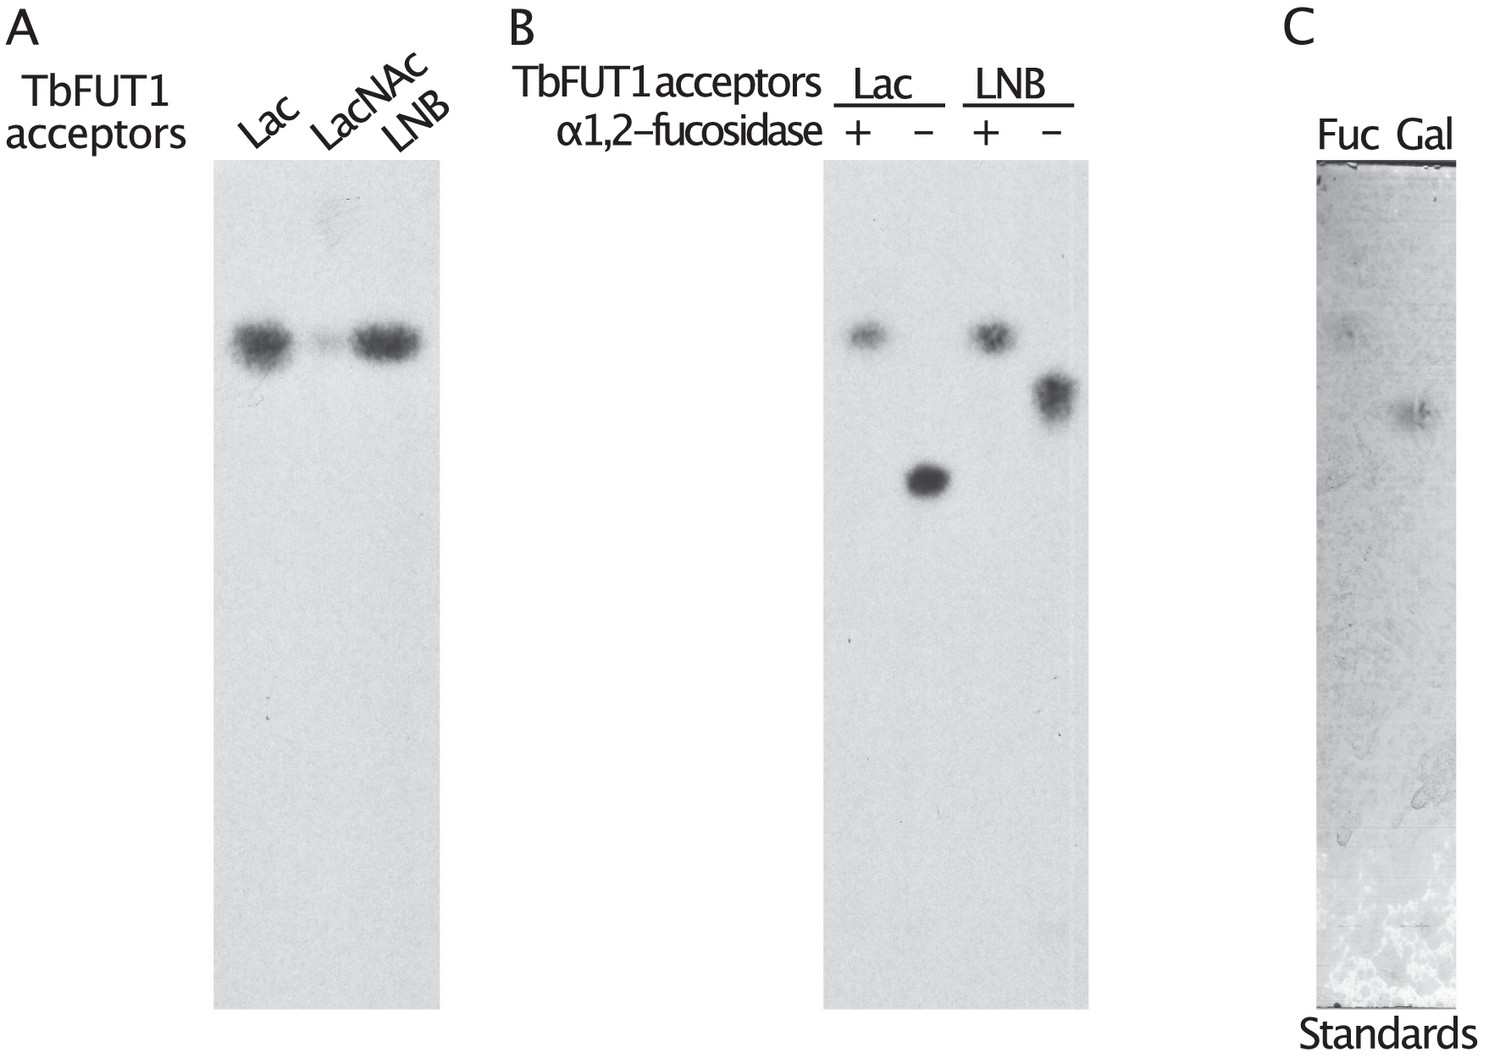
Each assay used 2 μg of purified GST-TbFUT1, GDP-[3H]Fuc, and 1 mM of acceptor. Reaction products were desalted and separated by silica High Performance Thin Layer Chromatography (HPTLC) and detected by fluorography. LNB, LNB-OMe, and LNB-terminating structures were the best acceptors tested. The acceptor abbreviations above each lane are defined in Table 1. -ctrl: negative control reaction without acceptor (lane 4) or with buffer alone (lane 8).
Figure 2—figure supplement 1
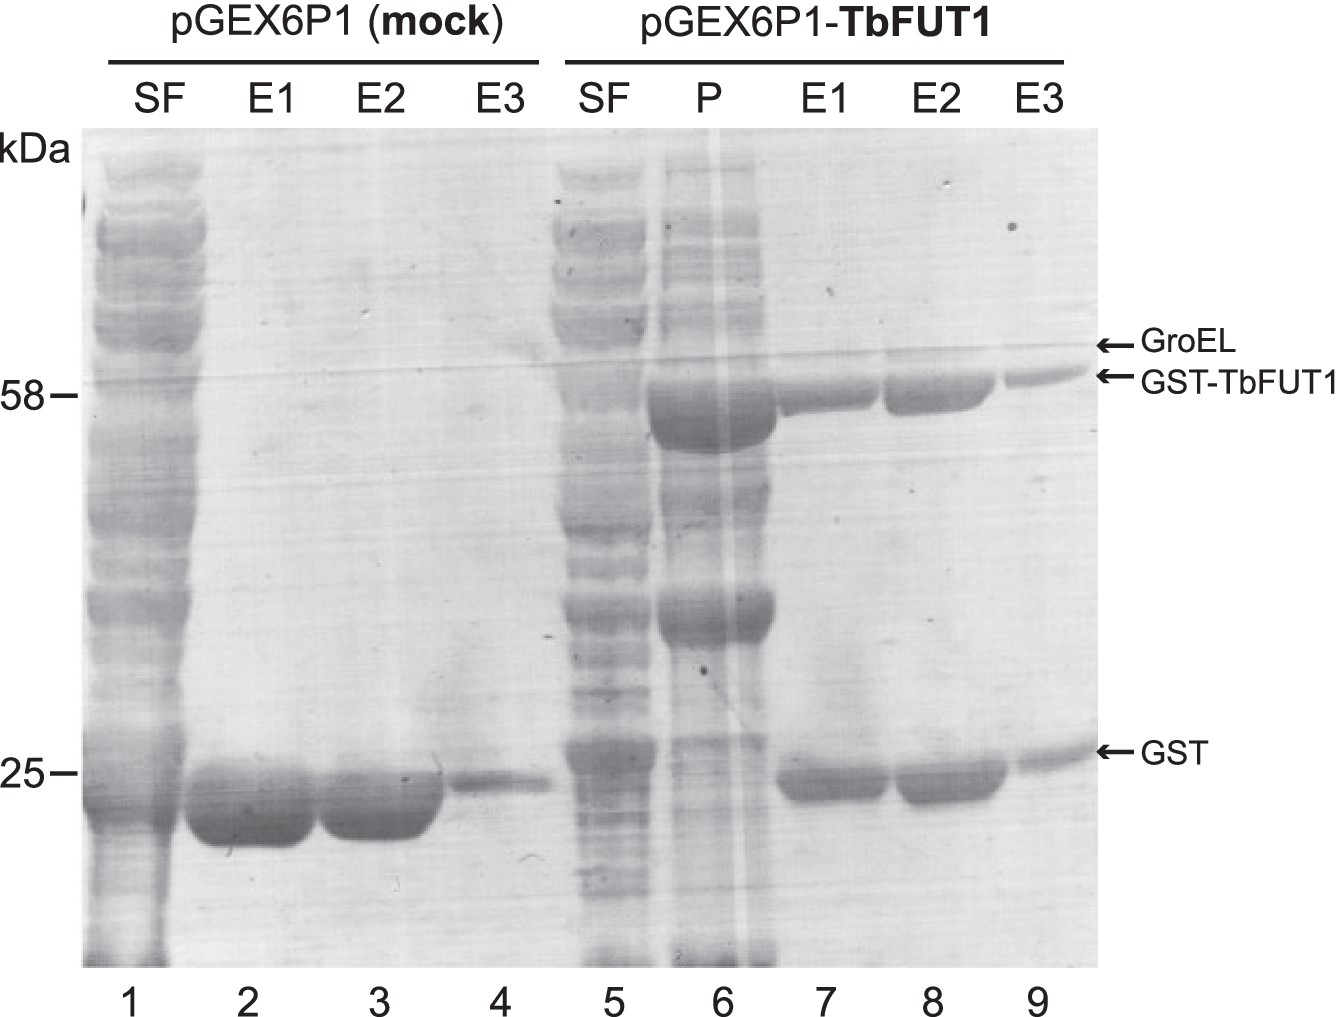
Purification of recombinant GST-TbFUT1.
The material encoded by the empty vector (lanes 1–4) and the GST-TbFUT1 (lanes 5–9) was expressed and purified following the same protocol (see Materials and methods). Aliquots from the lysis and affinity purification steps were run on a SDS-PAGE and stained with Coomassie. SF: soluble fraction; P: pellet (insoluble fraction); E1–E3: elutions.
Figure 2—figure supplement 2
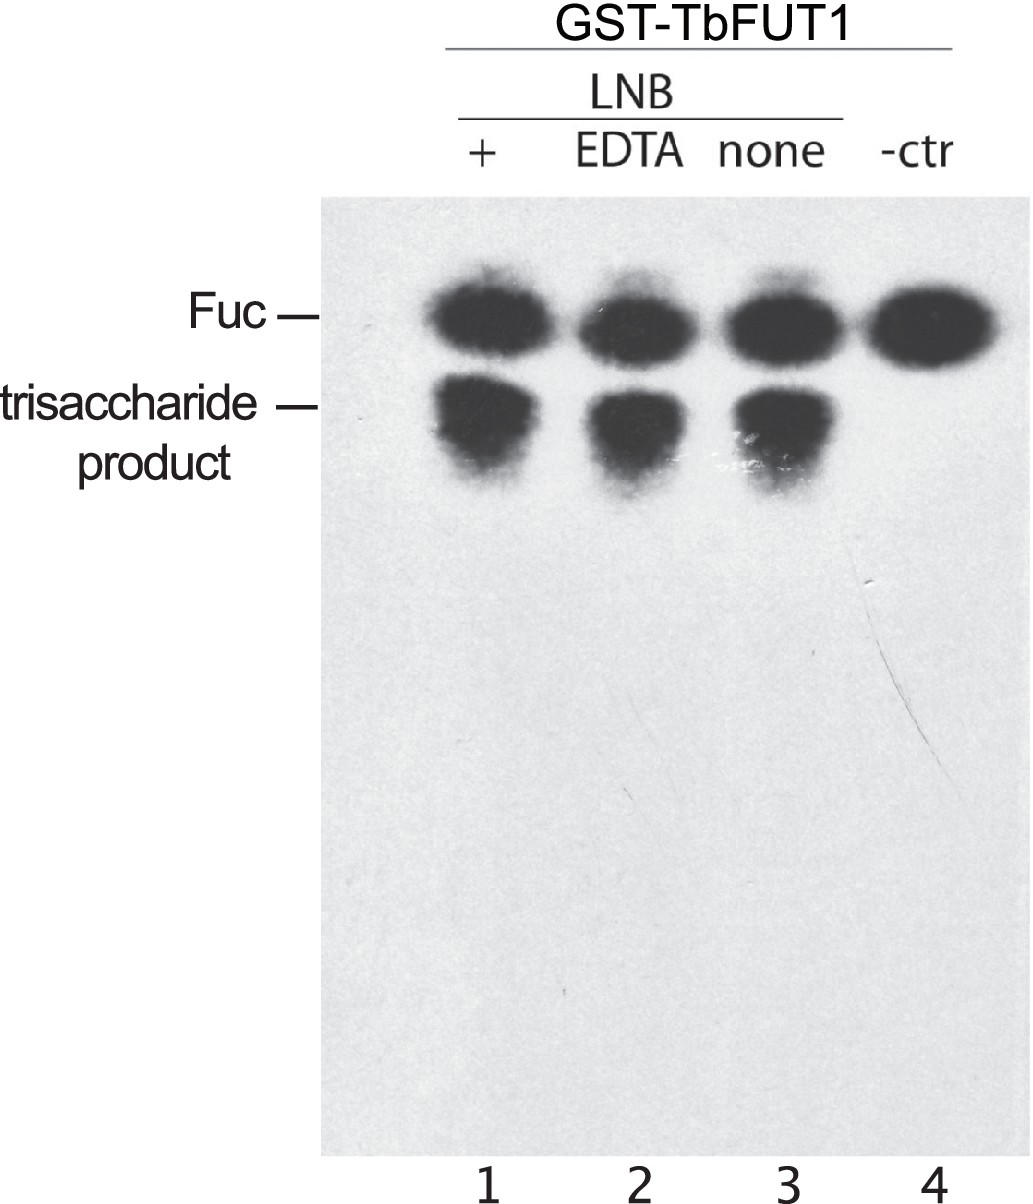
TbFUT1 activity is independent of divalent metal cations.
We performed activity assays using lacto-N-biose (LNB) as acceptor (see experimental procedures) either using the complete reaction buffer (+, lanes 1 and 4), removing MgCl2 and MnCl2 from it (none, lane 3, 50 mM TrisHCl, 25 mM KCl pH 7.2) or adding EDTA to it (EDTA, lane 2, 50 mM TrisHCl, 25 mM KCl, 5 mM EDTA pH 7.2). A negative control missing the LNB acceptor (-ctr, lane 4) was also performed.
Figure 3 with 2 supplements
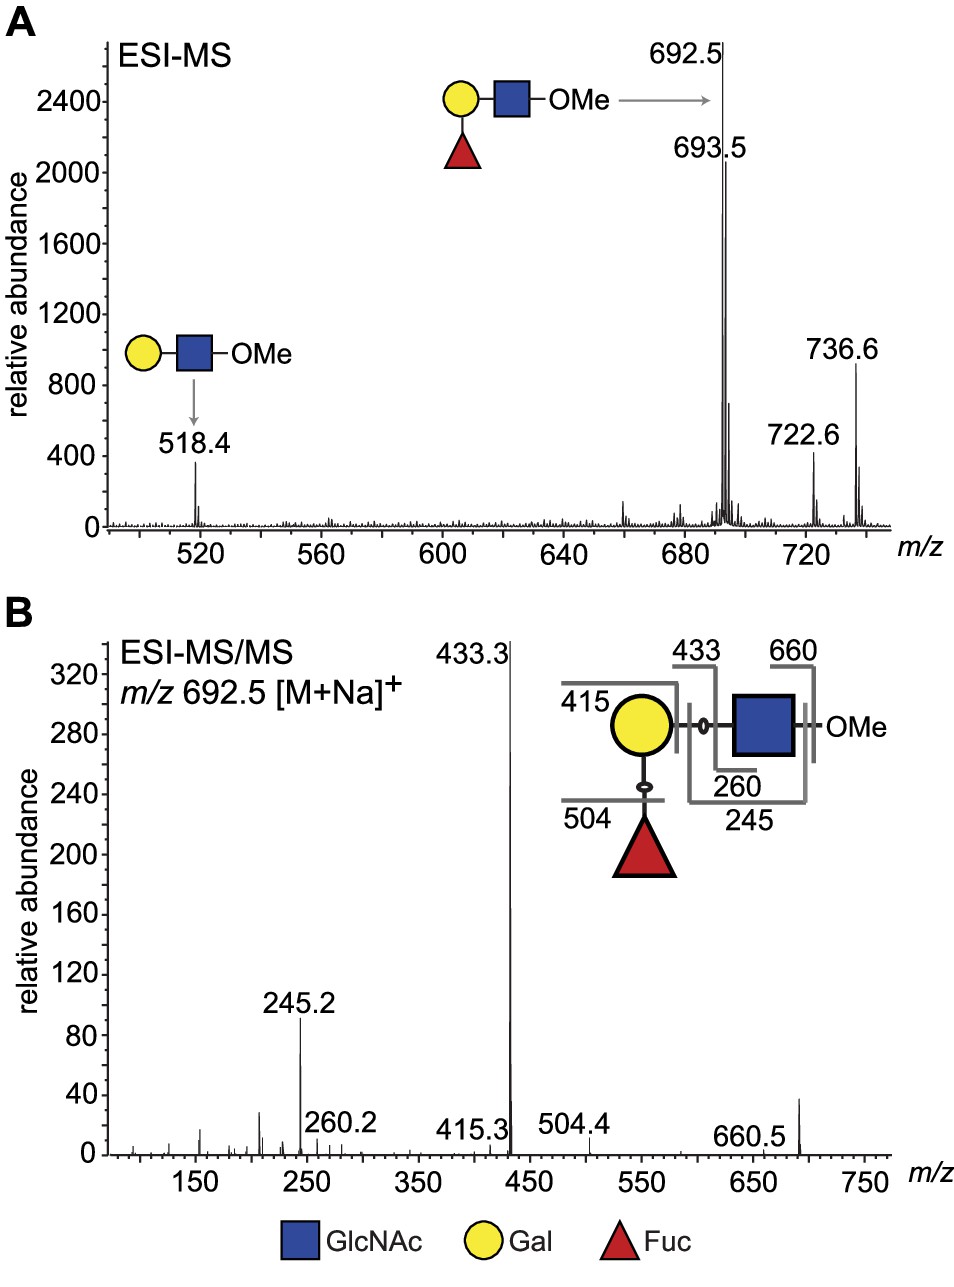
ESI-MS and ESI-MS/MS of TbFUT1 in vitro reaction product.
(A) ESI-MS of the purified and permethylated reaction product. The ion at m/z 692.5 is consistent with the [M + Na]+ ion of a permethylated trisaccharide of composition dHex1Hex1HexNAc1. Some of the unmodified acceptor (Hex1HexNAc1) was also observed (m/z 518.4). (B) MS/MS product ion spectrum of m/z 692.5. The collision-induced fragmentation pattern indicated that the dHex (Fuc) residue was linked to the Hex (Gal) and not to the HexNAc (GlcNAc) residue.
Figure 3—figure supplement 1
Preliminary characterization of TbFUT1 reaction products.
(A) Labelled products were recovered from the activity assays and treated with 4 M trifluoroacetic acid (TFA) (acid hydrolysis). (B) Tritiated products, recovered from the TbFUT1 activity assays, were treated (lanes 1 and 3) with 10 U of X. manihotis α-1,2-fucosidase or mock treated (lanes 2 and 4) by incubating with only the fucosidase buffer. Acid hydrolysis reactions, fucosidase treatments, and monosaccharide standards were run on a HPTLC plate in solvent A. The radiolabelled products were visualized by fluorography, and the standards were visualized with orcinol/sulphuric acid (C).
Figure 3—figure supplement 2
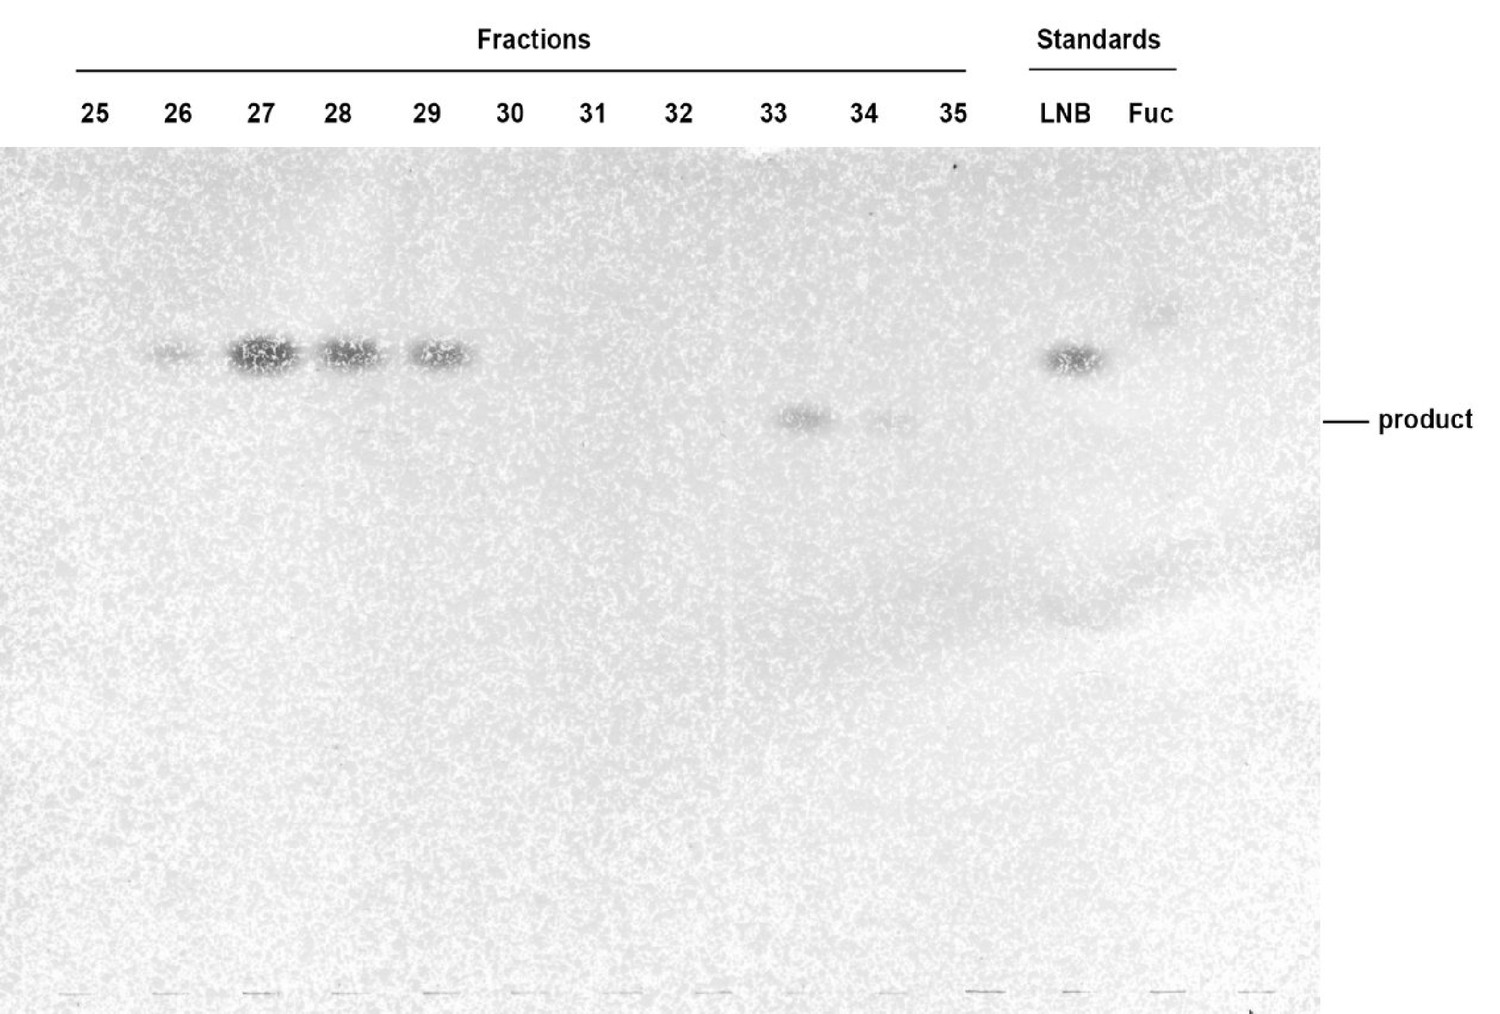
Purification of the TbFUT1 reaction product by normal phase HPLC.
An aliquot (2%) from each sugar-containing fraction from the normal phase purification was run on a HPTLC plate in solvent A and developed with orcinol/sulphuric acid. Standards for the acceptor (LNB) and for Fuc were also analysed. Fractions containing the reaction product (33 and 34) were pooled for analysis.
Figure 4 with 1 supplement

1H-NMR and 1H-ROESY spectra of the TbFUT1 reaction product.
(A) One-dimensional 1H-NMR spectrum. The arrow points to the α-Fuc H1 doublet. (B) Enlargement of the 3.2–5.1 ppm region of the two-dimensional 1H-ROESY spectrum. (a) indicates the crosspeak resulting from a through-space connectivity between α-Fuc H1 and β-Gal H2.
Figure 4—figure supplement 1
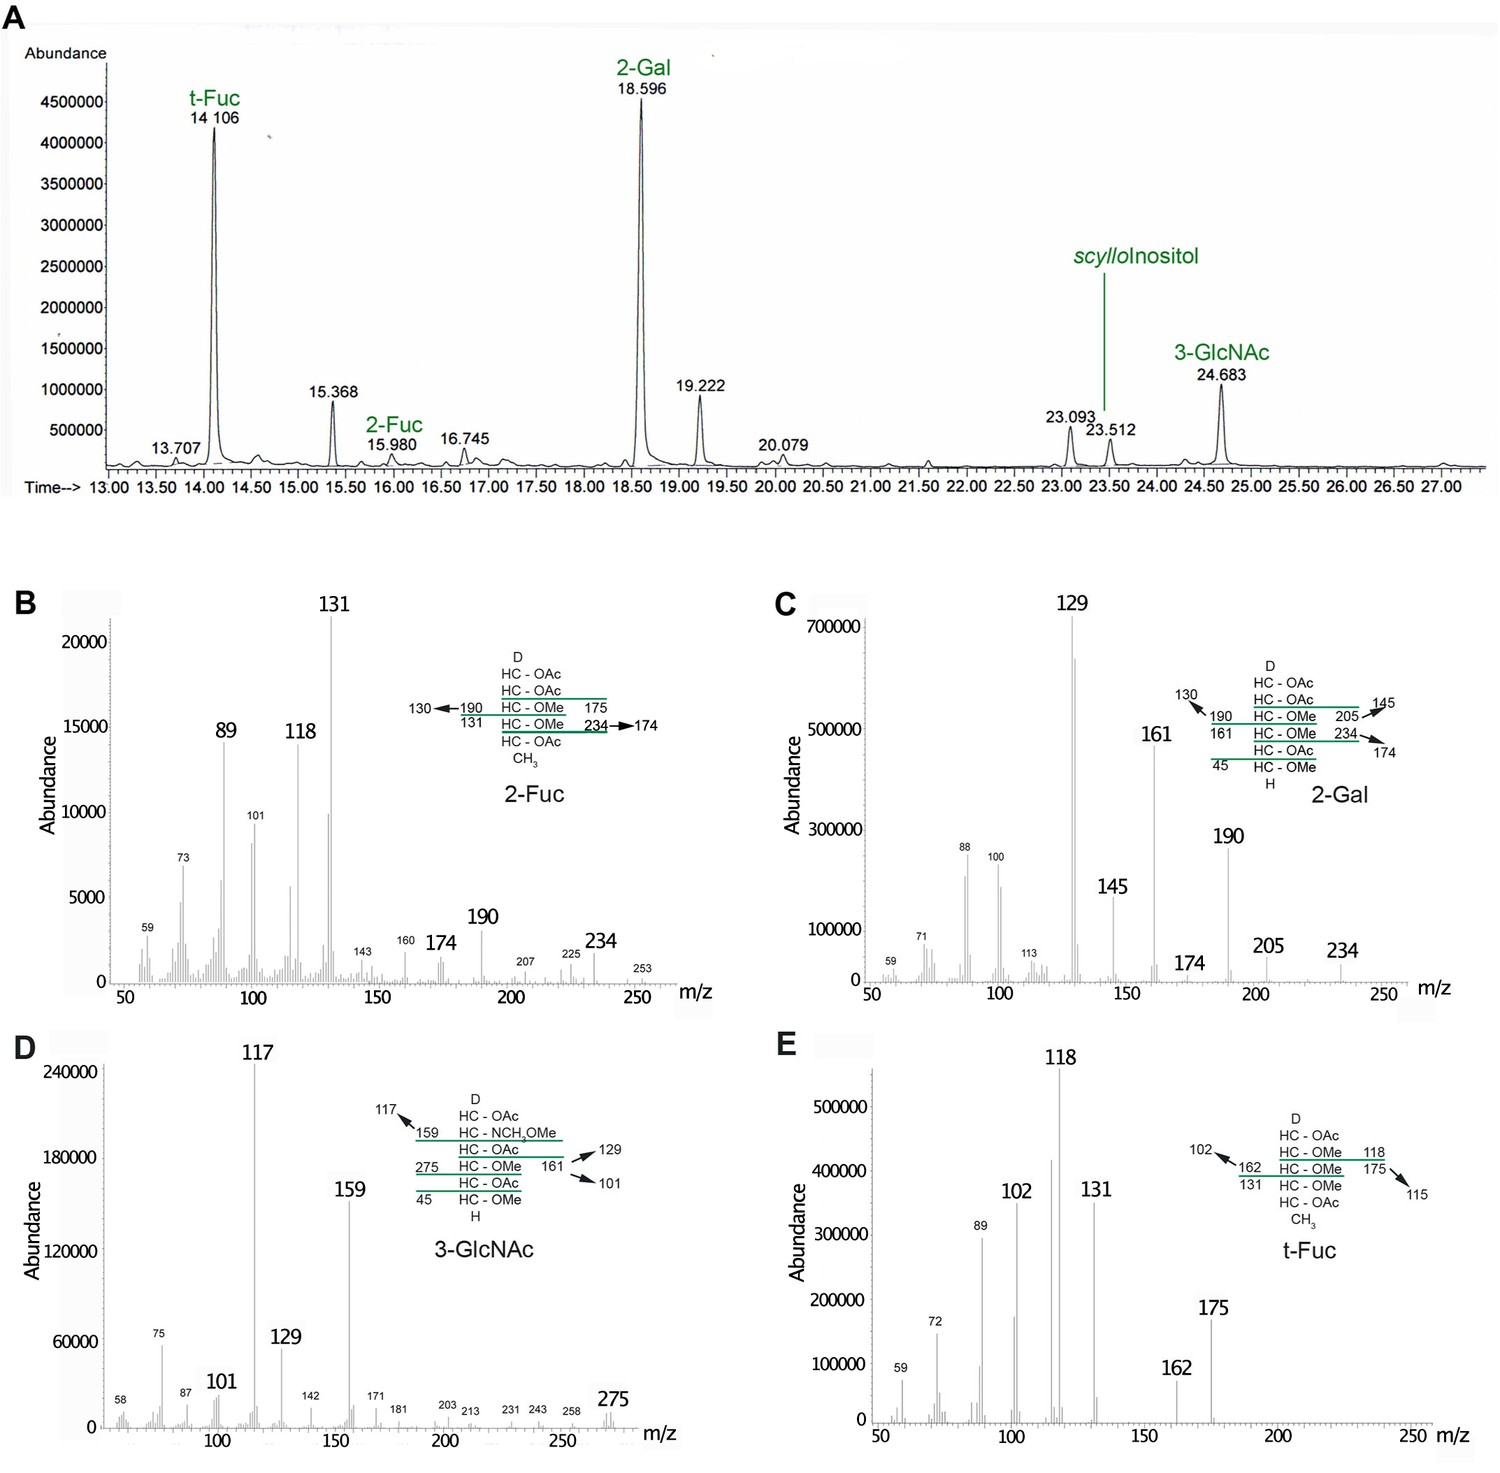
GC-MS methylation linkage analysis of the purified reaction product.
(A) Chromatogram of the partially methylated alditol acetates (PMAAs) obtained from the reaction product. The peaks are annotated to reflect their origin in the oligosaccharide: t-Fuc: non-reducing terminal fucose; 2-Gal: 2-O-substituted galactose; 3-GlcNAc: 3-O-substituted N-acetylglucosamine; 2-Fuc: 2-O-substituted fucose. (B–E) Electron-impact MS spectra for the peaks at 15.9, 18.6, 24.7, and 14.1 min, respectively. The insets in each panel show the fragmentation patterns.
Figure 5 with 1 supplement
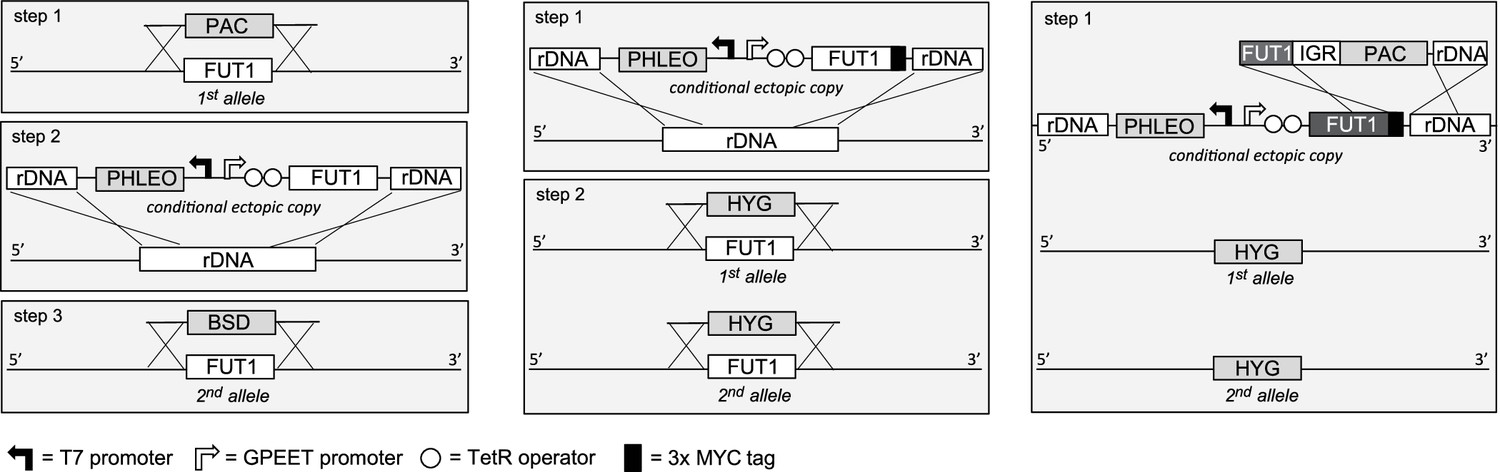
Cloning strategies for the creation of the TbFUT1 conditional null mutants.
Left panel: To create the procyclic form conditional null mutant (PCF TbFUT1 cKO), the first TbFUT1 allele was replaced by PAC, an ectopic tetracycline-inducible copy of the TbFUT1 gene was introduced into the ribosomal DNA locus, and the second TbFUT1 allele was replaced by BSD. Middle panel: To create the bloodstream form conditional null mutant (BSF TbFUT1-MYC3 cKO), an ectopic tetracycline-inducible copy of the TbFUT1 gene with a MYC3 tag was first introduced into the ribosomal DNA locus. Both TbFUT1 alleles were subsequently replaced by HYG through homologous recombination followed by gene conversion. Right panel: To create the untagged bloodstream form cKO (BSF TbFUT1 cKO), the BSF TbFUT1-MYC3 cKO mutant (middle panel) was modified by homologous recombination with a construct that removed the C-terminal MYC3 tag under PAC selection. IGR: intergenic region.
Figure 5—figure supplement 1
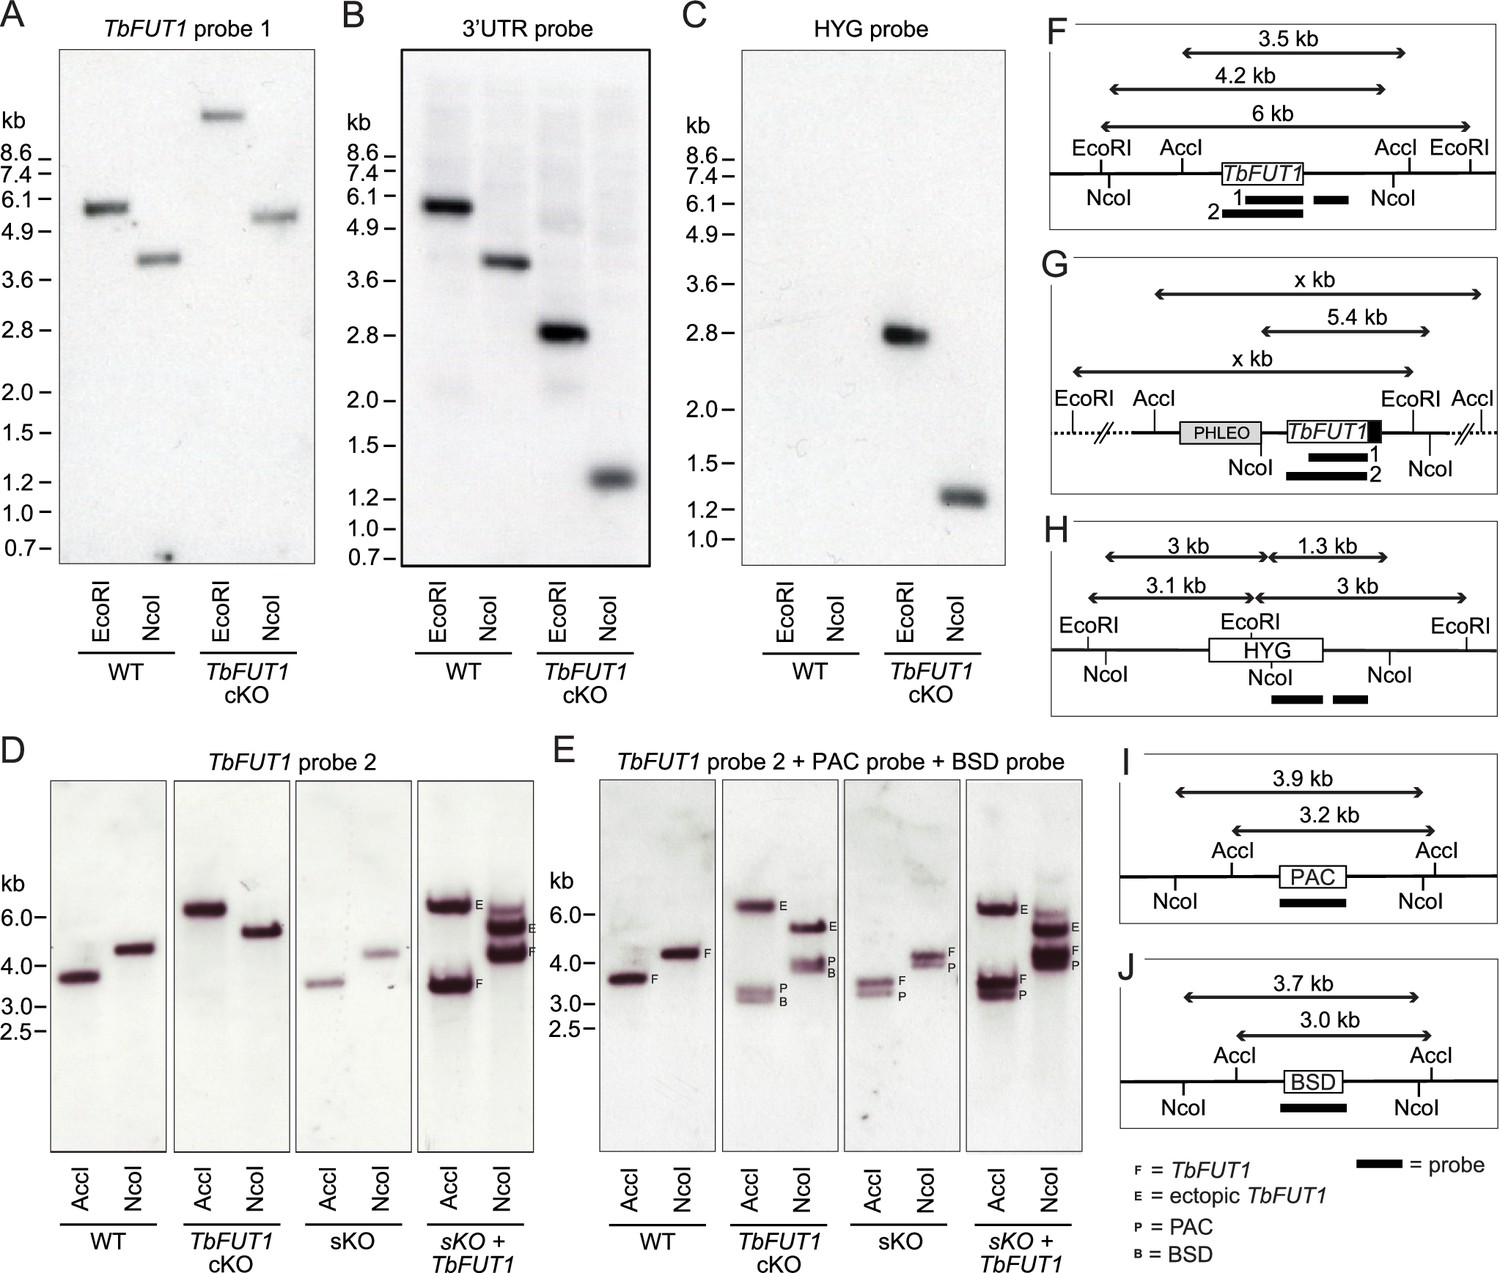
Southern blots of TbFUT1 conditional null mutants.
Bloodstream form gDNA of wild-type (WT) and TbFUT1 cKO mutant was digested with EcoRI and NcoI, respectively, and three separate blots probed with a DIG-labelled DNA fragment of TbFUT1 (A), 3′UTR (B), and HYG (C). Similarly, procyclic form WT, single KO (sKO), sKO plus ectopic TbFUT1 (sKO + TbFUT1), and TbFUT1 cKO gDNA was digested with AccI and NcoI, respectively, and one blot consecutively probed with a DIG-labelled DNA fragment of TbFUT1 (D) or PAC and BSD (E). A graphic key illustrates the resulting band patterns and fragment sizes expected by probing against the native TbFUT1 (F), the ectopic TbFUT1 with or without MYC3-tag (black box) (G) and the three resistance genes HYG (H), PAC (I), and BSD (J).
Figure 6 with 4 supplements
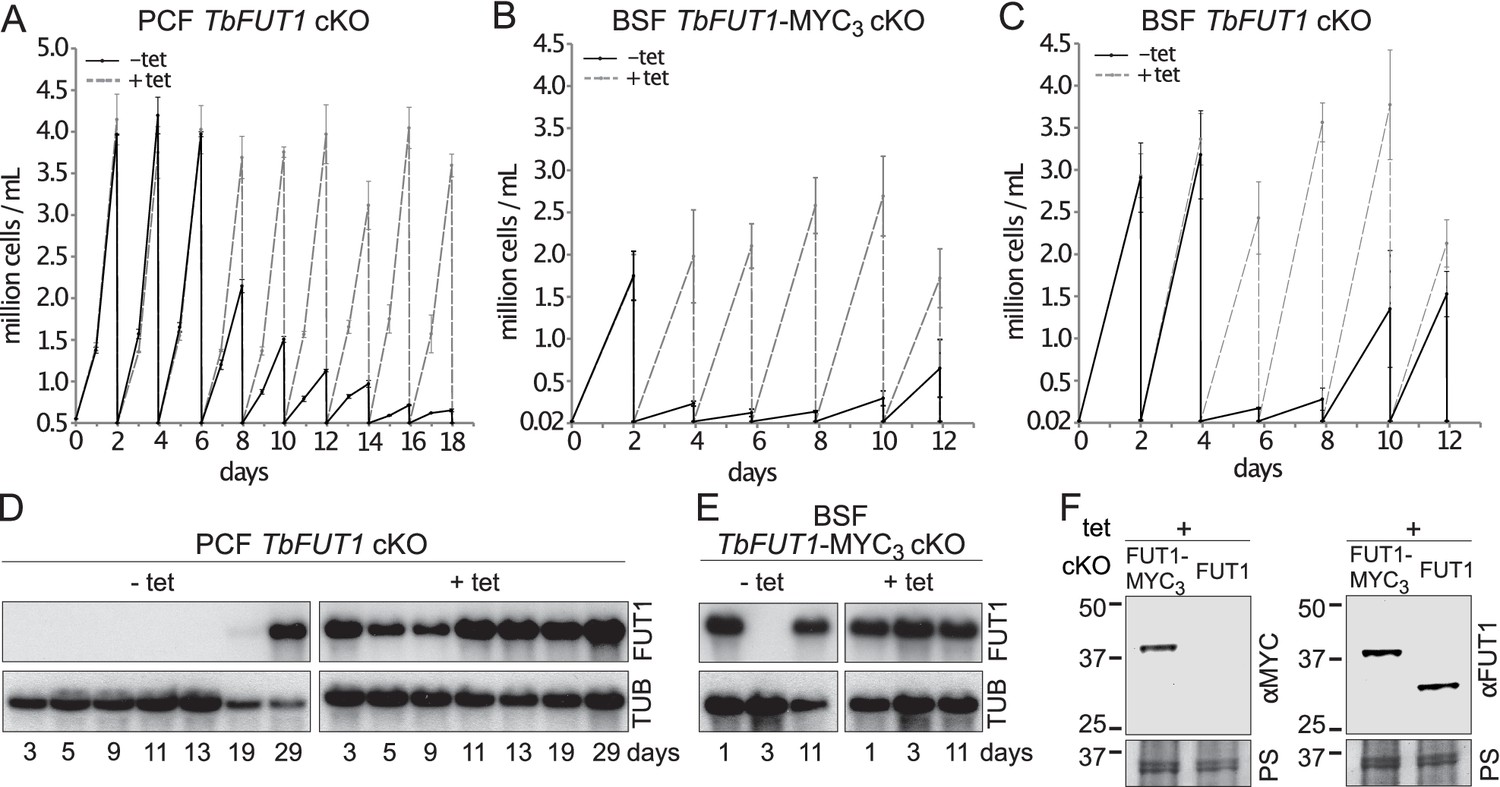
TbFUT1 is essential for procyclic and bloodstream form cell growth in vitro.
The cell numbers (± standard deviation) for TbFUT1 cKO under permissive (plus tetracycline, dotted line) and non-permissive (minus tetracycline, solid line) conditions are shown for three procyclic (A) and bloodstream form (C) clones, as well as for three bloodstream clones carrying a tetracycline-inducible ectopic TbFUT1 gene with a C-terminal MYC3 tag (B). For each clone procyclic form clone, two biological repeats were analysed and three for bloodstream form clones. (D, E) Corresponding TbFUT1 mRNA levels were determined by northern blots. Alpha-tubulin (TUB) was used as a loading control. (F) TbFUT1-MYC3 and untagged TbFUT1 are detected by western blot analysis in the respective bloodstream form cKO cell lines under permissive conditions (+Tet). The left panel shows an anti-MYC (αMYC) blot and the right panel an anti-recombinant TbFUT1 antibody (αFUT1) blot. Membranes were stained with Ponceau S (PS) to ensure equal loading.
Figure 6—figure supplement 1
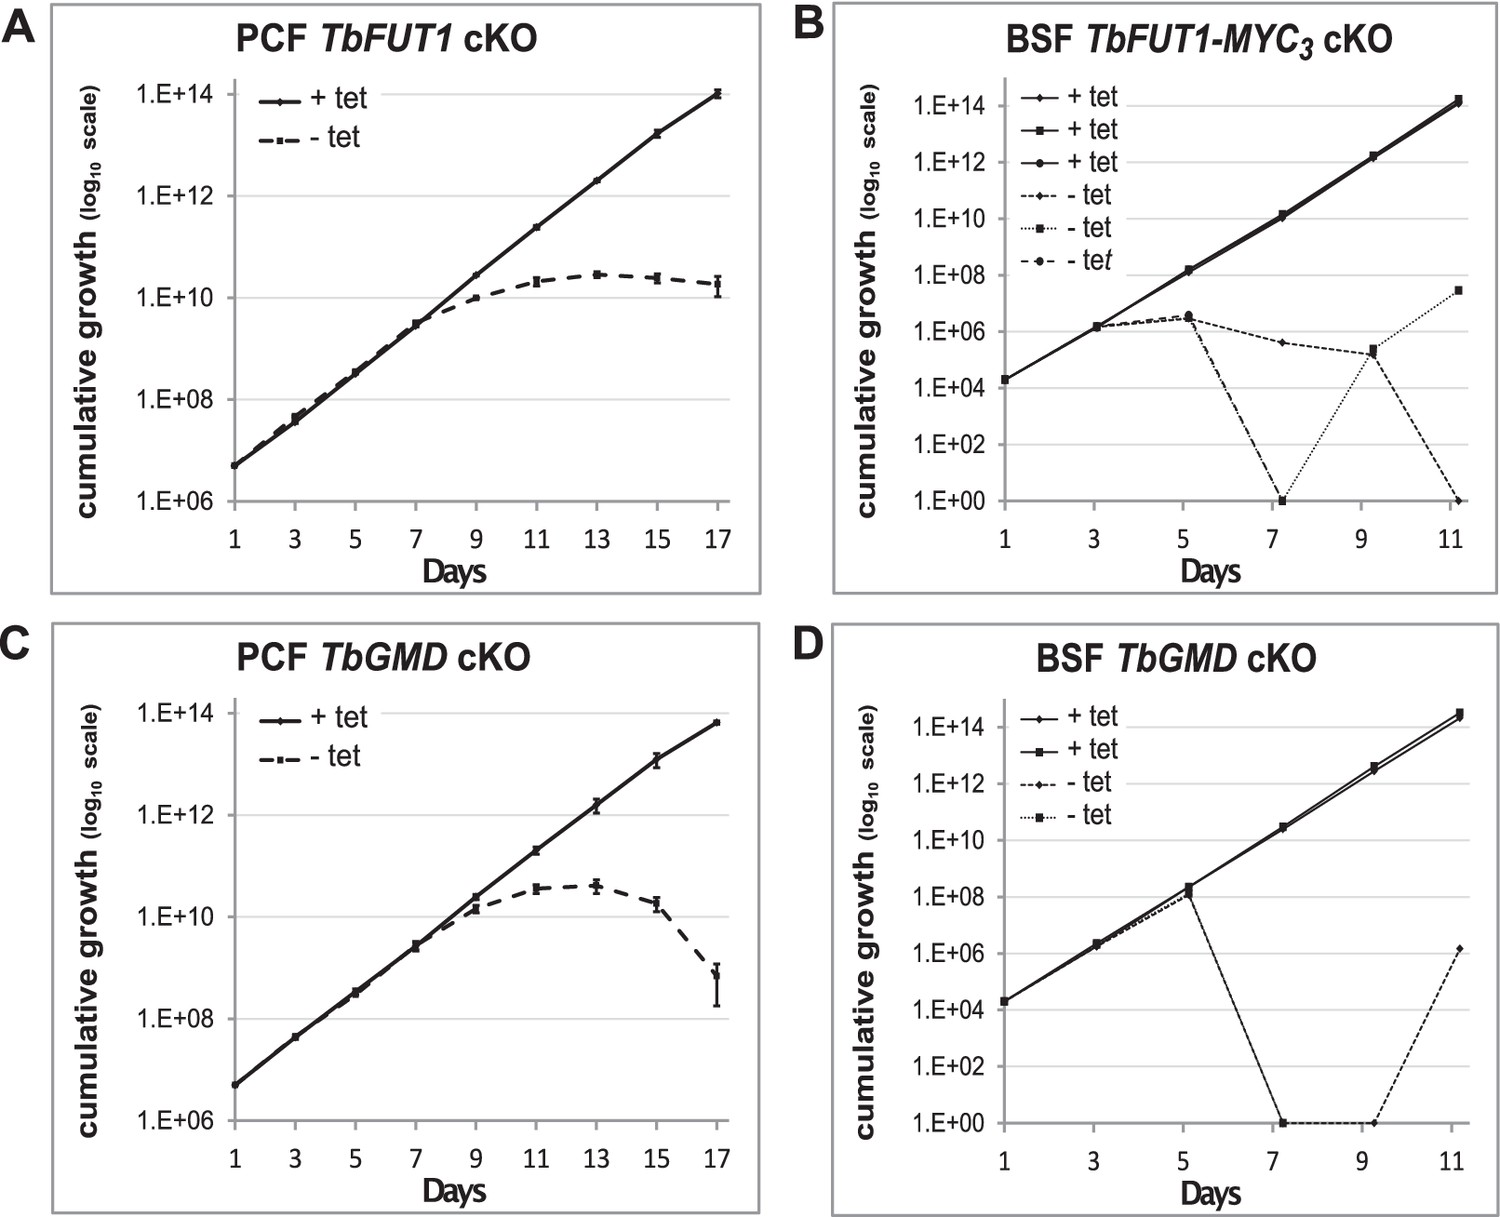
Comparison of TbFUT1 and TbGMD conditional null mutant growth.
TbFUT1 and TbGMD cKO were grown in parallel under permissive (solid) or non-permissive (dotted) conditions. Cells were split and counted every 2 days in biological duplicates (procyclic form) or triplicates (bloodstream form) using a haemocytometer. Growth is depicted in cumulative curves over several passages of (A) procyclic form TbFUT1 conditional knockout. (B) Three different clones of bloodstream form BSF TbFUT1 cKO cells expressing the MYC3-tagged ectopic copy. (C) Procyclic form TbGMD cKO cells. (D) Two different clones of bloodstream form TbGMD cKO cells.
Figure 6—figure supplement 2
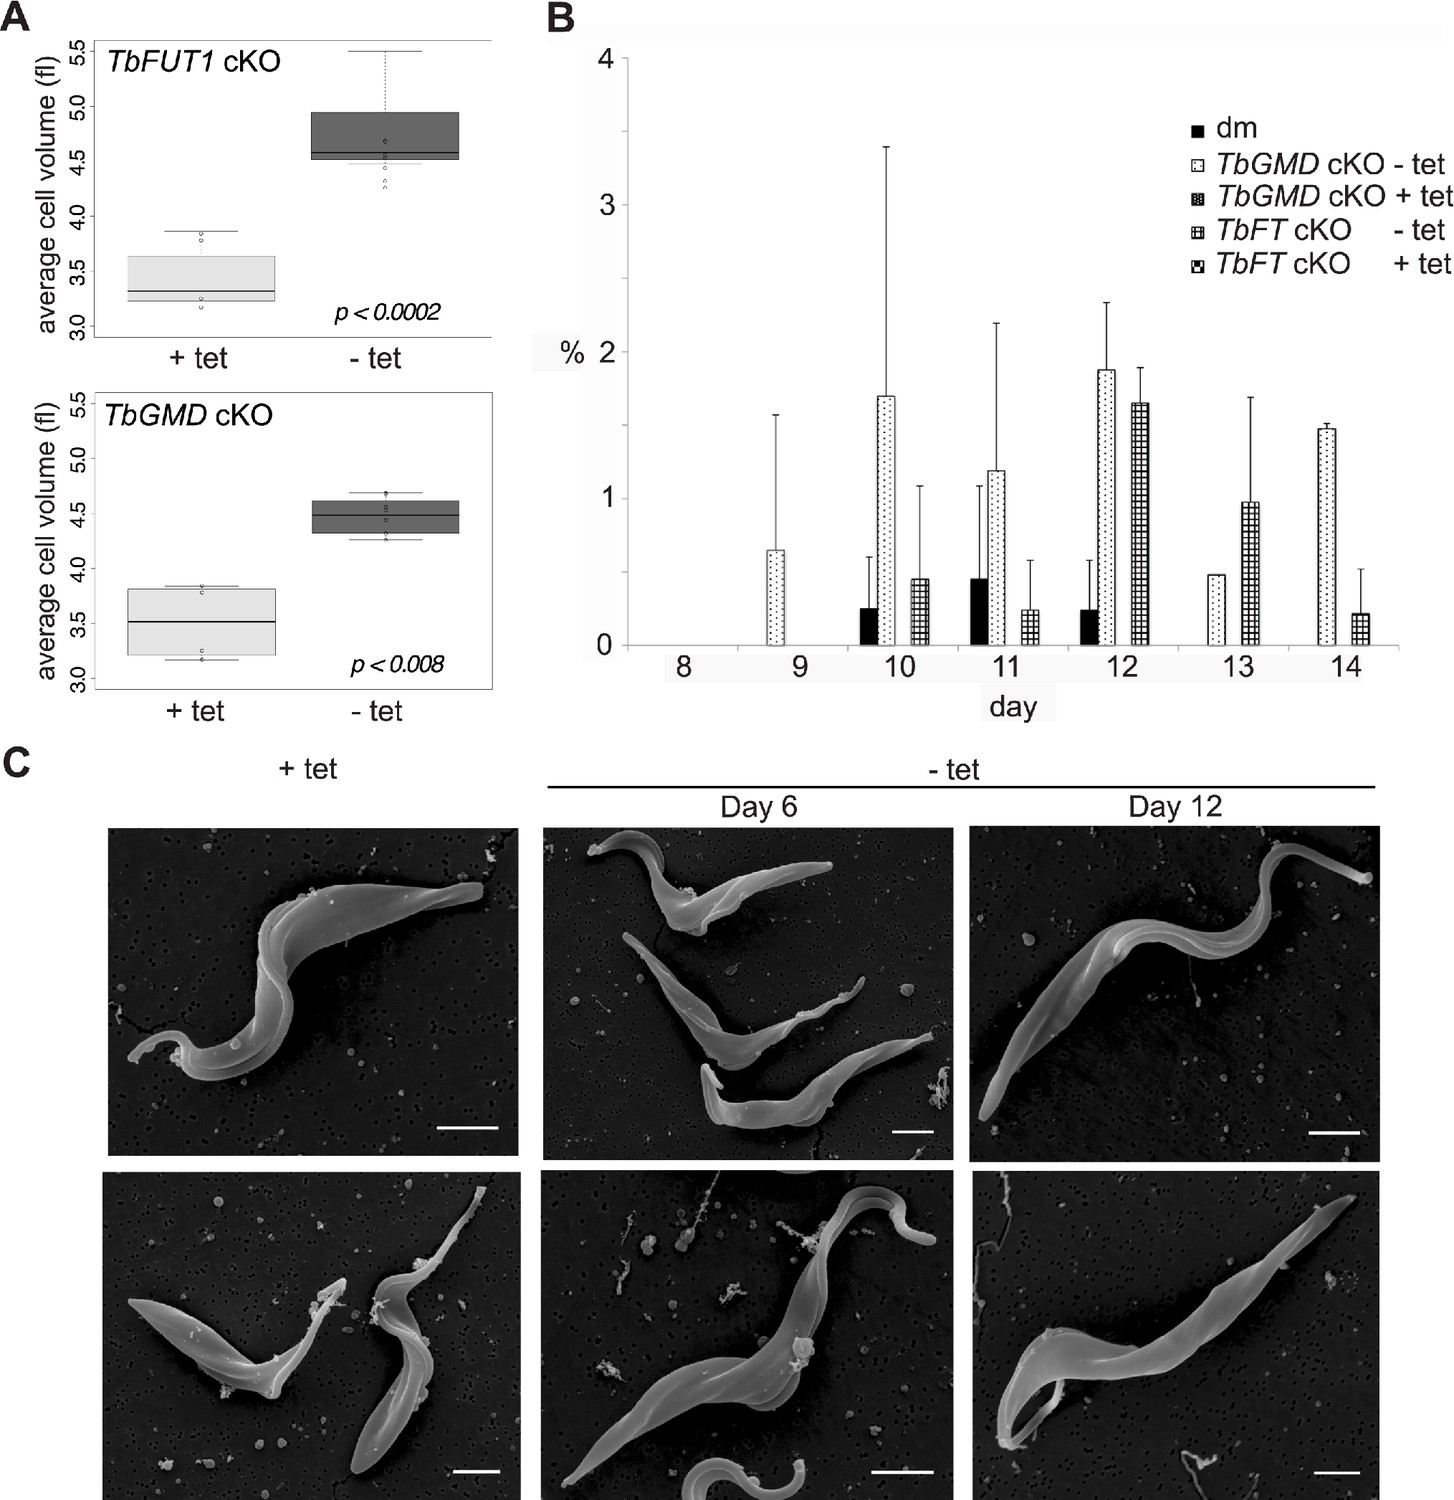
TbFUT1 and TbGMD cKO have increased cell size.
(A) The average cell volume was measured using a Cazy cell counter (day 10–13) for both cell lines grown in permissive (+Tet) and non-permissive (–Tet) conditions. The average cell volume (circles) for each day is shown. The boxes mark the interquartile range, the black lines the median, while the whiskers mark the maximum and minimum values. Values outside the whiskers are considered outliers. (B) Number of cells with detached flagella in TbFUT1 and TbGMD cKO cells grown in permissive and non-permissive conditions compared to wild type (dm). The average of two biological replicates (± standard deviation) is shown. In each replicate, 200 cells/cell line were counted using a haemocytometer at an inverted light microscope. (C) Scanning electron microscopy (SEM) images of PCF TbFUT1 cKO grown in the presence or absence of tetracycline for 6 and 12 days. No flagellar detachment was observed, but cells grown in non-permissive conditions appear longer. Scale bars: 2 μm.
Figure 6—figure supplement 3
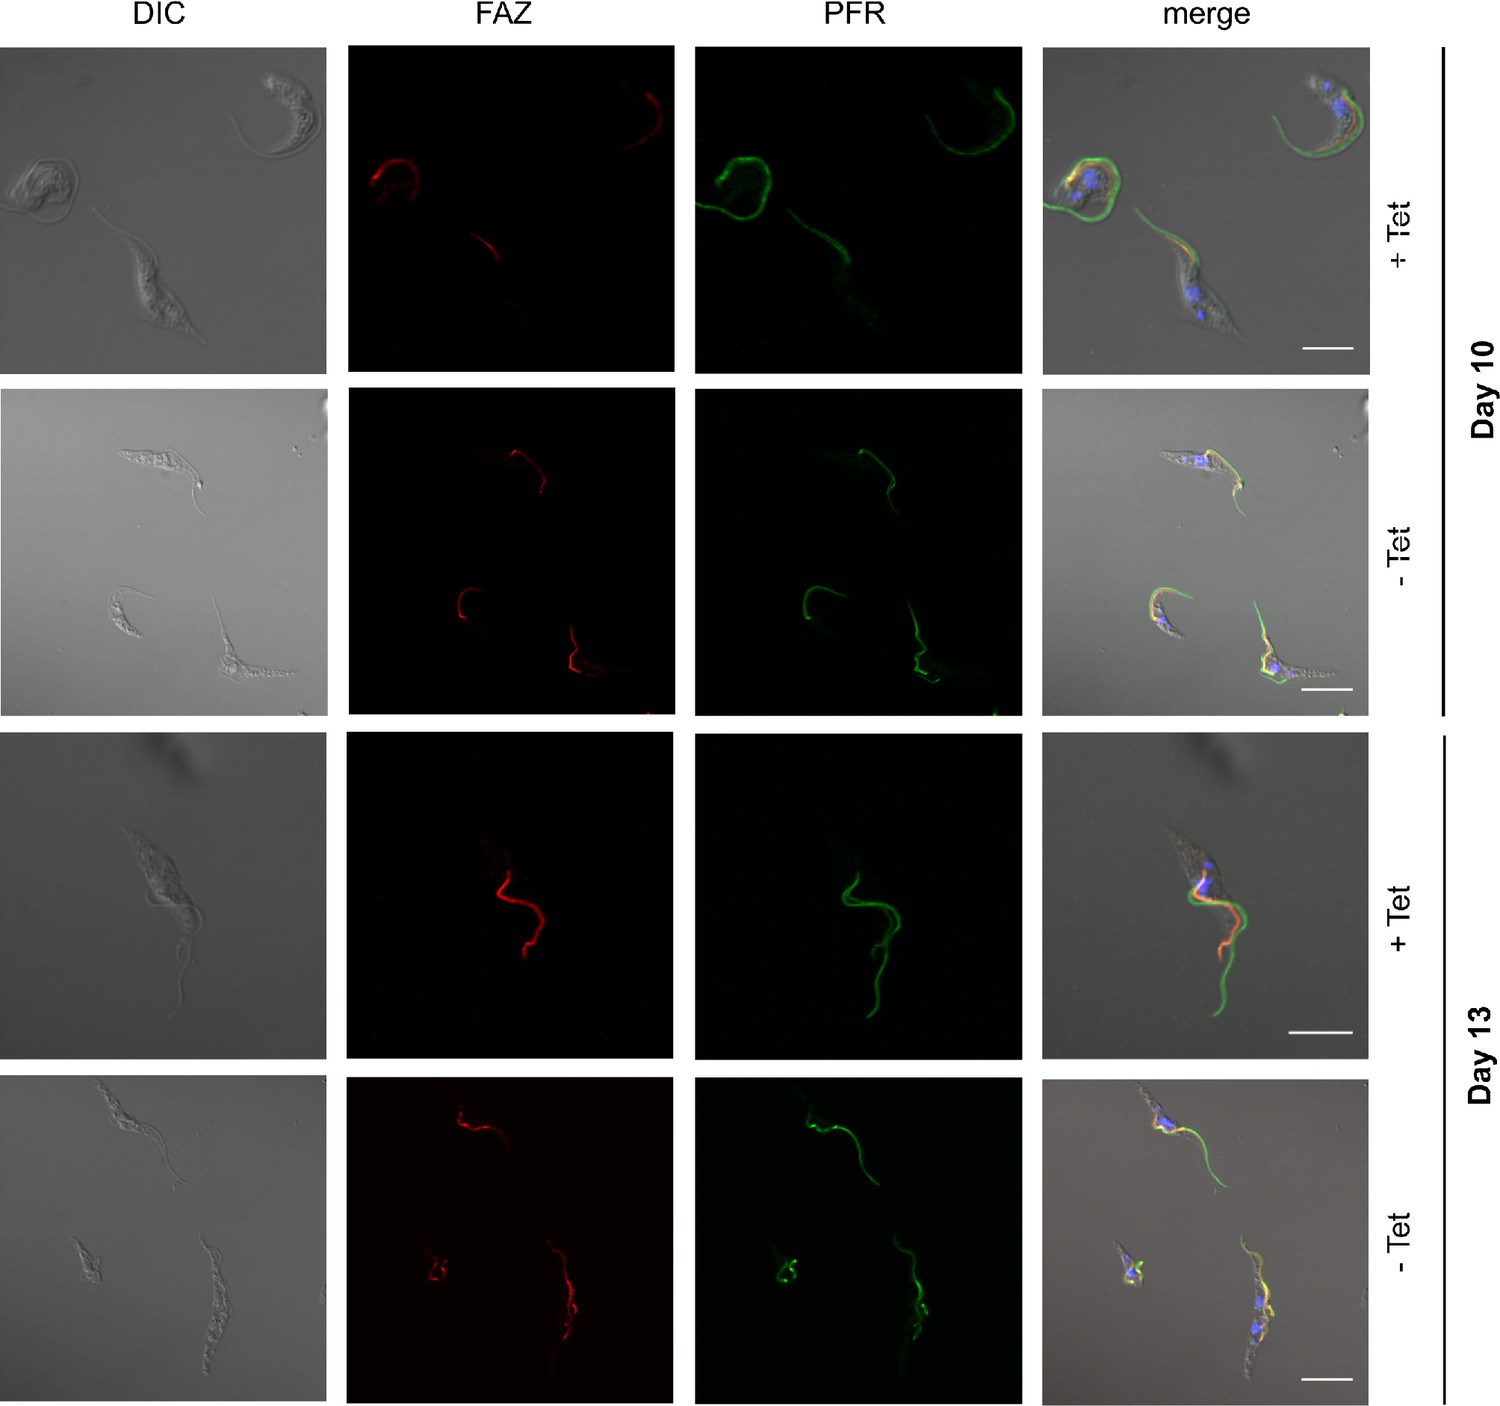
The paraflagellar rod (PFR) and flagellar attachment zone (FAZ) appear normal in PCF TbFUT1 cKO.
Cells were grown in permissive (+Tet) or non-permissive (-Tet) conditions and harvested at days 10 and 13. They were fixed, permeabilized, and stained as described in Materials and methods. The antibodies were used at the following dilutions: anti-FAZ 1:2, anti-PFR 1:10. Scale bars: 4 μm.
Figure 6—figure supplement 4
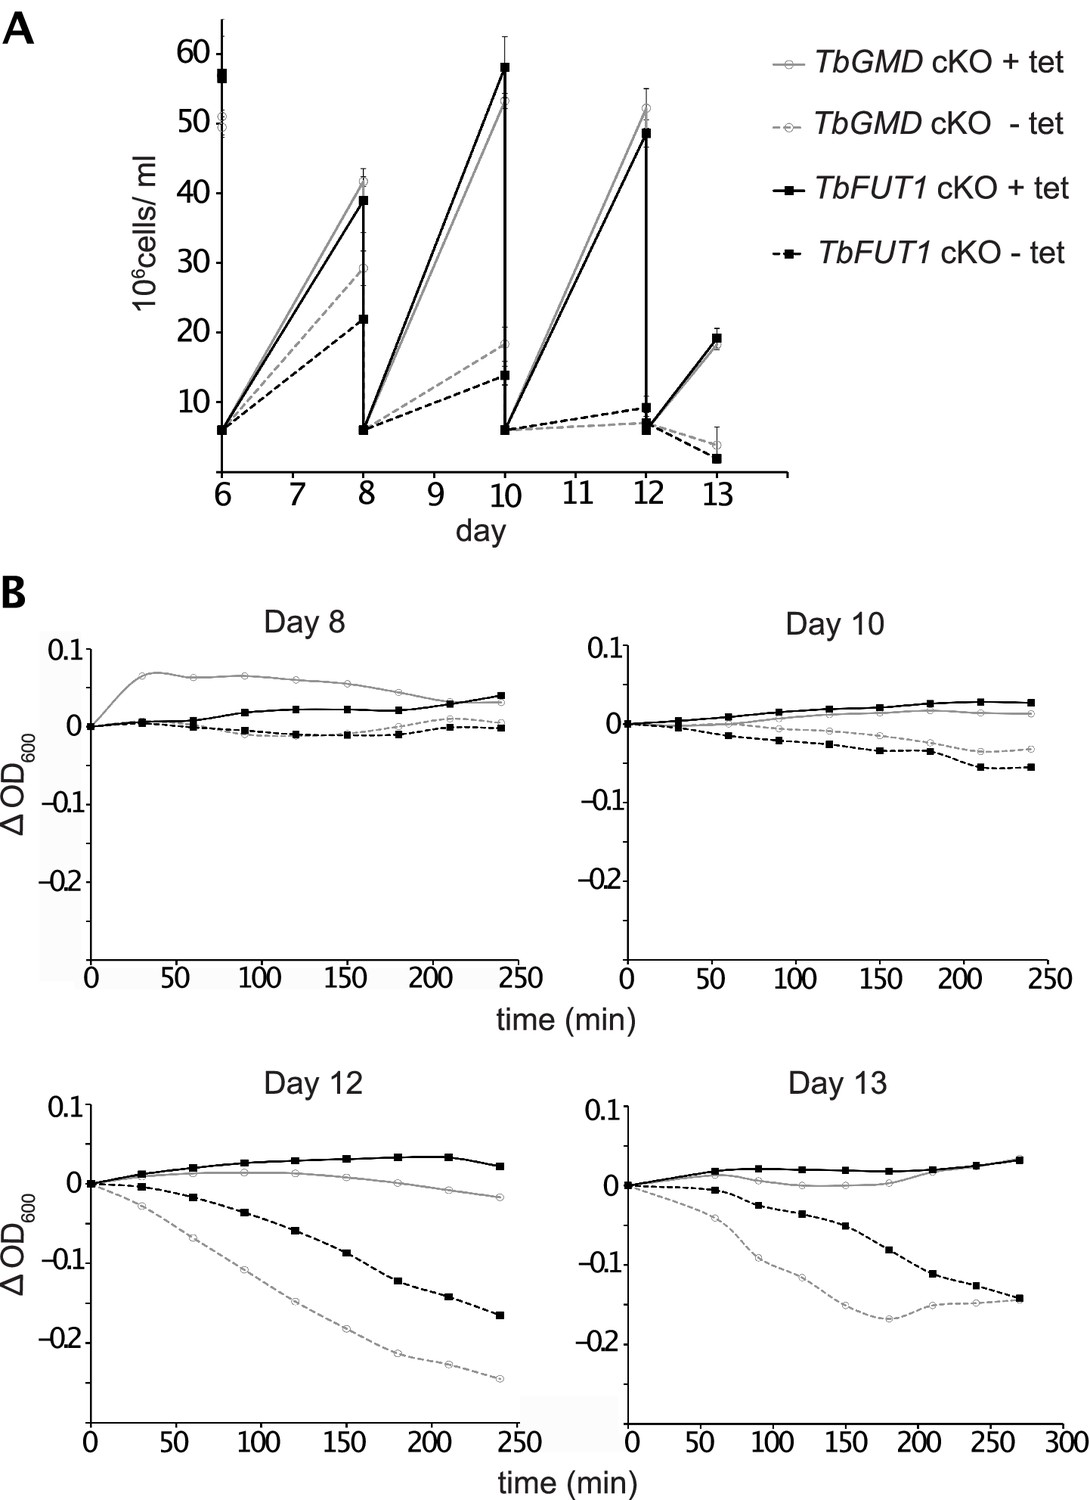
TbFUT1 and TbGMD cKO procyclic form cells show no defect in motility.
(A) Growth curve from days 6–13 of the cell lines used in the sedimentation assay. (B) Sedimentation assays on days 8, 10, 12, and 13. A reduction in motility could be observed in the PCF TbFUT1 and TbGMD cKO cells, grown under non-permissive conditions, only after the start of the growth phenotype (day 12 and onwards), not before. This suggests that the reduction in motility may be an effect of the growth defect and not its cause, as would be expected in a true flagellar attachment mutant (Bastin et al., 1999; Demonchy et al., 2009). TbGMD cKO is marked in grey while TbFUT1 cKO is marked in black. Cultures grown in non-permissive conditions are marked with dashed lines.
Figure 7
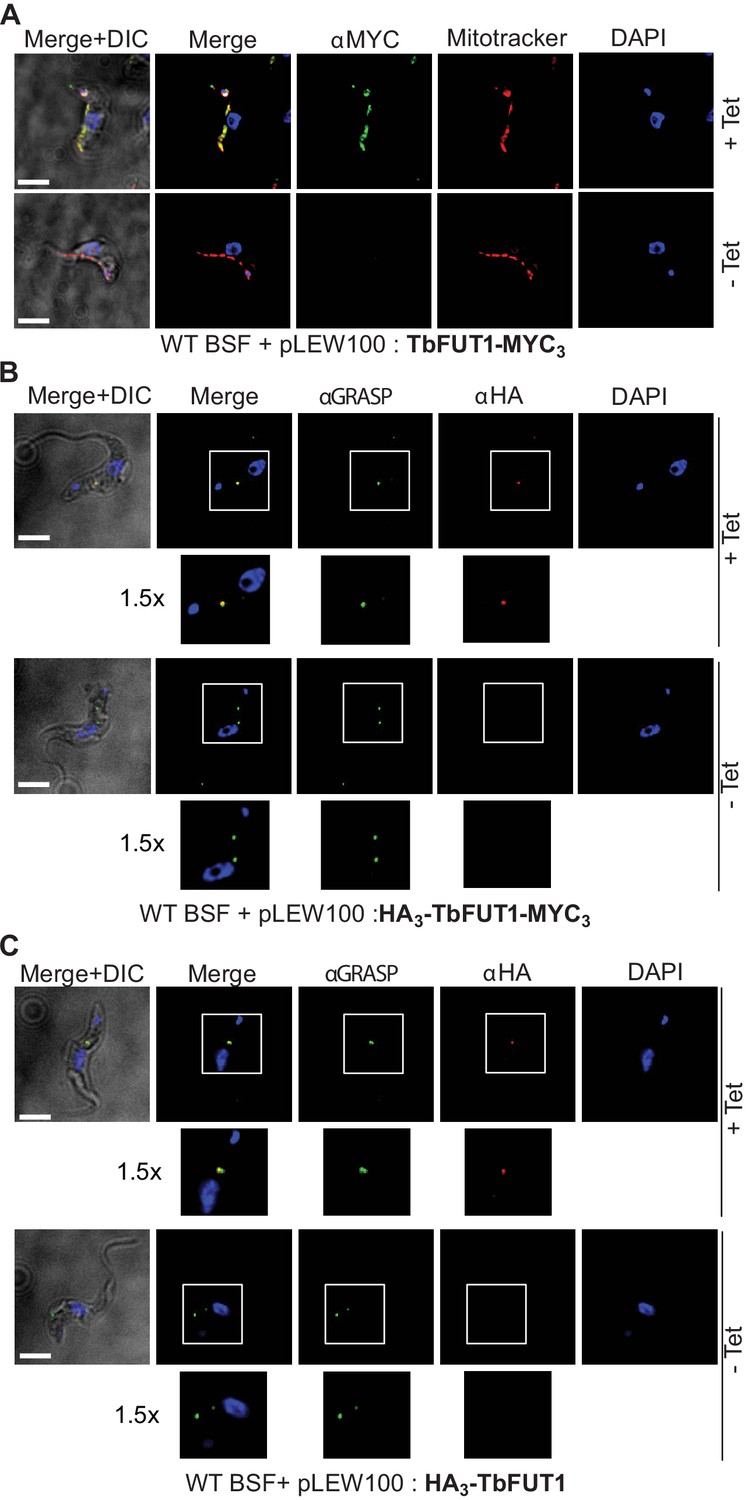
C- and N-terminal tagging of TbFUT1 result in mitochondrial and Golgi apparatus localization, respectively.
(A) Bloodstream form (BSF) cKO parasites expressing tet-inducible C-terminally tagged TbFUT1-MYC3 were imaged under permissive (+Tet) and non-permissive (-Tet) conditions by differential interference contrast (DIC) and fluorescence microscopy after staining with anti-MYC, MitoTracker, and DAPI. Comparable patterns were observed for anti-MYC and MitoTracker, suggesting that TbFUT1-MYC3 localizes to the mitochondrion. (B, C) IFA of BSF cKO parasites expressing a tet-inducible N-terminally tagged HA3-TbFUT1-MYC3 (B) or HA3-TbFUT1 (C) after labelling with anti-HA, anti-GRASP, and DAPI suggests a Golgi apparatus location for both HA3-TbFUT1-MYC3 and HA3-TbFUT1. The absence of anti-MYC (A) or anti-HA (B, C) staining under non-permissive conditions confirms the specificity of the labelling for the respective TbFUT1 fusion proteins. White boxes: areas magnified 1.5× in the rows below. Scale bars: 3 μm.
Figure 8

Antibodies to the recombinant protein localize TbFUT1 to the mitochondrion.
(A) IFA of wild-type bloodstream form (BSF) trypanosomes after staining with affinity-purified anti-TbFUT1 (αFUT1) MitoTracker and DAPI. Comparable patterns were observed for αFUT1 and MitoTracker, suggesting that TbFUT1 localizes to the mitochondrion. (B, C) TbFUT1 conditional null mutants were grown under permissive (+Tet) and non-permissive (-Tet) conditions for 3 days in the case of BSF (B) or 7 days for PCF (C) and imaged.. In both cases, the tetracycline-inducible TbFUT1 pattern is consistent with a mitochondrial localization. (D) BSF trypanosomes induced to express a C-terminally tagged known Golgi glycosyltransferase (TbGnTI-HA3) were imaged after staining with αFUT1, anti-HA, and DAPI, as indicated. The merged images of two representative cells suggest no significant co-localization between native TbFUT1 and the Golgi-localized TbGnT1. White boxes: areas magnified 1.5× in the rows below. Scale bars: 3 μm.
Figure 9 with 1 supplement

Absence of TbFUT1 disturbs mitochondrial activity.
Bloodstream form (BSF) wild-type and TbFUT1 cKO parasites were cultured for 5 days under permissive (+Tet) and non-permissive (-Tet) conditions, fixed and labelled with MitoTracker for mitochondrial potential and with anti-mitochondrial ATPase antibody. In mutants grown in non-permissive conditions (lower panels), both ATPase and MitoTracker staining are strongly reduced, suggesting reduced mitochondrial functionality. Scale bar: 3 μm.
Figure 9—figure supplement 1
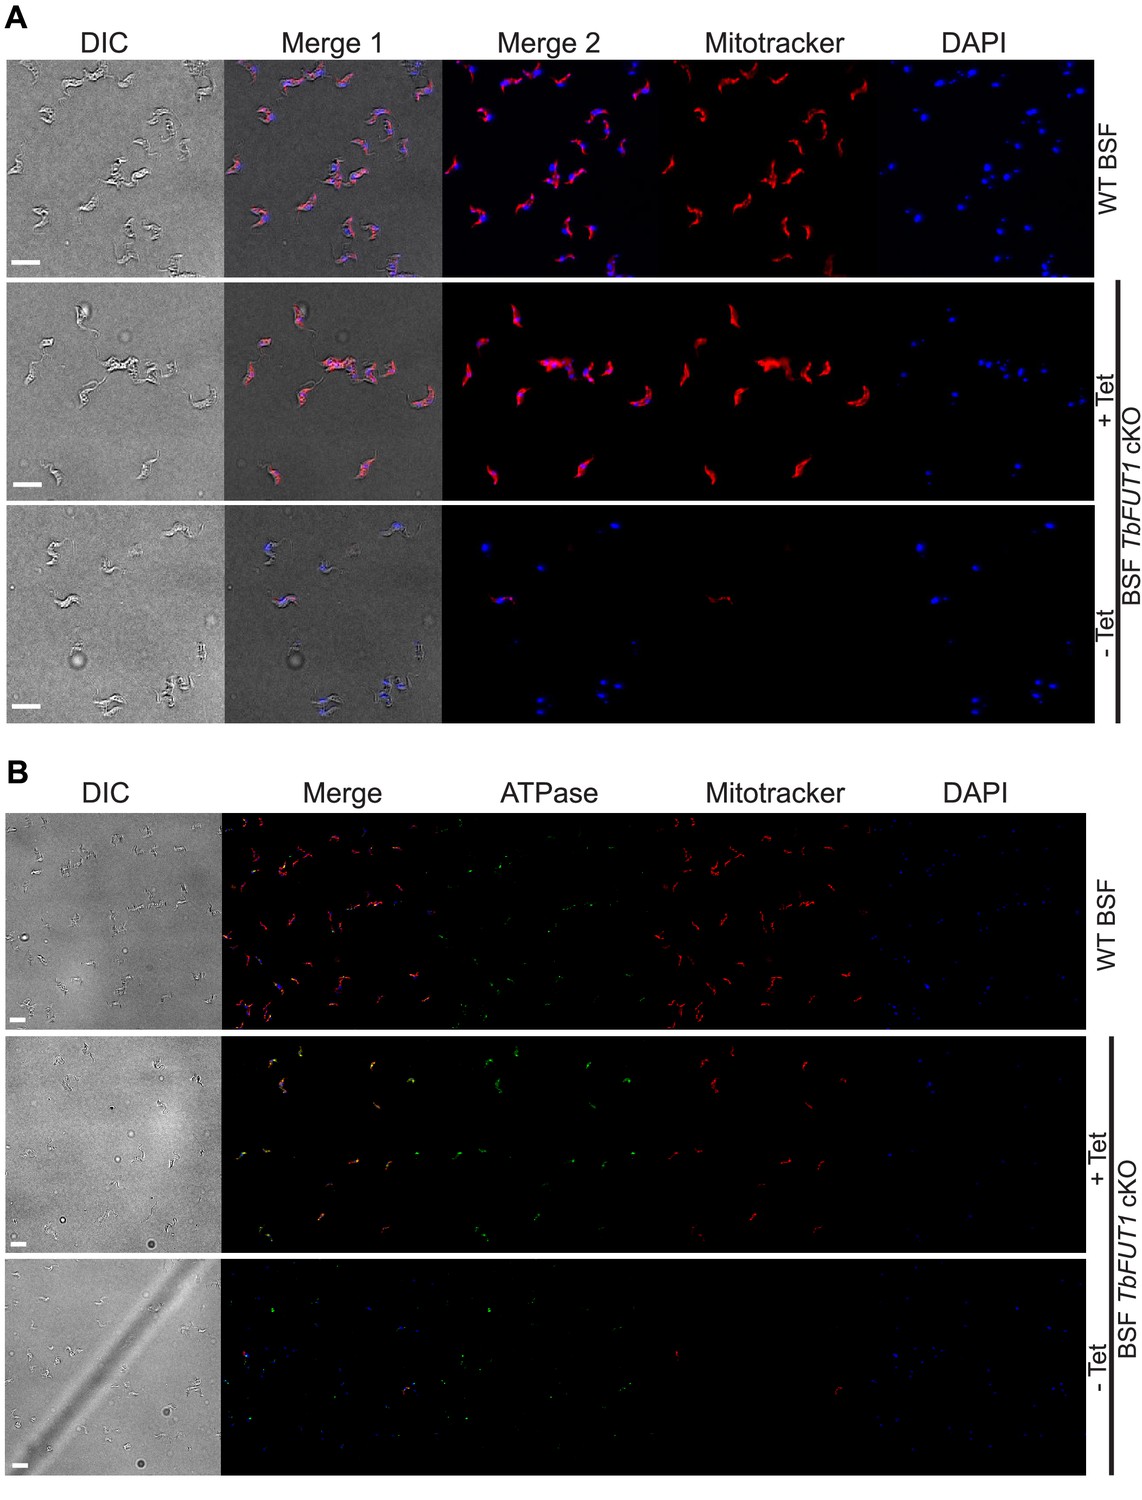
Absence of TbFUT1 disturbs mitochondrial activity.
Still viable bloodstream form conditional null mutants cultured for 5 days under non-permissive conditions (-Tet) were tested with MitoTracker for mitochondrial activity and co-stained with either DAPI (60× objective) (A) or with DAPI and anti-ATPase antibody (B) (20× objective). In both cases, a strong reduction in MitoTracker staining was observed by indirect immunofluorescence. Scale bars: 10 μm.
Figure 10

TbFUT1 can functionally and spatially replace LmjFUT1.
(A) Outline of the ‘plasmid shuffling’ procedure to replace LmjFUT1 with TbFUT1. An L. major homozygous fut1- null mutant expressing LmjFUT1 (from the GFP-positive, episomal pXNGPHLEO vector) was transfected with pIR1NEO-TbFUT1 (±HA) expressing either WT or HA-tagged TbFUT1 (GFP-negative). Following transfection and growth in the absence of selective drugs, single cells were sorted for GFP expression or loss. A similar yield of colonies was obtained from both populations. (B) TbFUT1 HA-tagged (top row) or WT (bottom row) was expressed in an L. major chromosomal fut1- mutant background and analysed by indirect immunofluorescence using anti-HA or anti-TbFUT1 antibodies. MitoTracker red was used as a mitochondrial marker. Scale bar: 2 μm.
Tables
Table 1
Acceptor substrates and semi-quantitative fucosyltransferase activities.
| TbFUT1 activity | Lane of Figure 1 | Abbreviations* | Name | Structure |
|---|---|---|---|---|
| +++ | 2, 6 | LNB | Lacto-N-biose | Galβ1,3GlcNAc |
| +++ | 21 | LNB-OMe | Lacto-N-biose-O-methyl | Galβ1,3GlcNAcβ-OMe |
| ++ | 11 | LNT | Lacto-N-tetraose | Galβ1,3GlcNAcβ1,3Galβ1,4Glc |
| ++ | 14 | LNH | Lacto-N-hexaose | Galβ1,3GlcNAcβ1,3(Galβ1,4GlacNAcβ1,6)Galβ1,4Glc |
| ++ | 1,5 | Lac | Lactose | Galβ1,4Glc |
| + | 13 | iLNO | Iso-lacto-N-octaose | Galβ1,3GlcNAcβ1,3(Galβ1,3GlcNAcβ1,3Galβ1,4GlcNAcβ1,6)Galβ1,4Glc |
| + | 3,7 | LacNAc | N-acetyllactosamine | Galβ1,4GlcNAcN |
| + | 10 | LNnH | Lacto-N-neohexaose | Galβ1,4GlcNAcβ1,3(Galβ1,4GlcNAcβ1,6)Galβ1,4Glc |
| + | 12 | LNnT | Lacto-N-neotetraose | Galβ1,4GlcNAcβ1,3Galβ1,4Glc |
| + | 16 | 3′-FL | 3′-Fucosyllactose | Galβ1,4(Fucα1,3)Glc |
| – | 9 | β-Gal | β-Galactose | β-Gal |
| – | 15 | GNG | β1,6-Galactosyl-N-acetyl-glucosamine | Galβ1,6GlcNAc |
| – | 17 | 1,6 GB | β1,6-Galactobiose | Galβ1,6Gal |
| – | 18 | 1,4 GB | Galabiose | Galα1,4Gal |
| – | 19 | LB2TS | Linear B2 trisaccharide | Galα1,3Galβ1,4GlcNAc |
| – | 20 | β-Gal-OMe | β-Galactose-O-methyl | β-Gal-OMe |
| – | 22 | 2’-FL | 2’-Fucosyllactose | Fucα1,2Galβ1,4Glc |
-
*
The relative efficiencies of the acceptors as TbFUT1 substrates (+++, ++, +, and –) are based on visual inspection of the intensities of the products bands in Figure 2.
Table 2
Partially methylated alditol acetates (PMAAs) derivatives identified by GC-MS methylation linkage analysis of the purified TbFUT1 reaction product.
| PMAA derivative | RT (min) | Origin |
|---|---|---|
| 4,6-di-O-methyl-1,3,5-tri-O-acetyl-(1–2H)- 2-N-methylacetamidoglucosaminitol | 24.6 | 3-O-substituted GlcNAc |
| 2,3,4,6-tetra-O-methyl-1,5-di-O-acetyl-(1–2H)-galactitol | 16.7 | Non-reducing terminal Gal |
| 3,4,6-tri-O-methyl-1,2,5-tri-O-acetyl-(1–2H)-galactitol | 18.6 | 2-O-substituted Gal |
| 2,3,4-tri-O-methyl-1,5-di-O-acetyl-(1–2H)-fucitol | 14.1 | Non-reducing terminal Fuc |
| 3,4-di-O-methyl-1,2,5-tri-O-acetyl-(1–2H)-fucitol | 15.9 | 2-O-substituted Fuc |
-
RT: retention time.
Table 3
1H-NMR and 1H-ROESY chemical shift assignments for the purified TbFUT1 reaction product.
| Residue | H1 | H2 | H3 | H4 | H5 | H6/6' | NAc |
|---|---|---|---|---|---|---|---|
| αFuc | 5.05 (J = 4 Hz) | 3.57 | 3.67 | 3.63 | 4.2 | 1.1 | |
| βGal | 4.5 | 3.45 | 3.55 | 3.89 | ND | ND | |
| βGlcNAc | ND | 3.63 | ND | 3.4 | ND | 3.78/3.89 | 2.1 |
-
J: coupling constant; ND: chemical shift could not be clearly assigned.
Key resources table
| Reagent type (species) or resource | Designation | Source or reference | Identifiers | Additional information |
| Gene (Trypanosoma brucei) | TbFUT1 | Genedb.org | Tb927.9.3600 | |
| Strain, strain background (Trypanosoma brucei) | Strain 427, clone 29.13 (PCF WT) | Wirtz et al., 1999 | Procyclic form | |
| Strain, strain background (Trypanosoma brucei) | Strain 427, variant MITaT 1.2 (BSF WT) | Wirtz et al., 1999 | Bloodstream form | |
| Strain, strain background(Leishmania major) | L. major Friedlin V1 | Guo et al., 2017 | MHOM/IL/80/Friedlin | |
| Strain, strain background (Escherichia coli) | BL21 (DE3) | Agilent | ||
| Strain, strain background (Escherichia coli) | BL21 Gold(DE3) | Agilent | ||
| Recombinant DNA reagent | pLEW100 | Prof. George Cross (Rockefeller University) | Addgene Plasmid #24011 | (Plasmid) |
| Recombinant DNA reagent | pMOTag4YH-PAC | Prof. Thomas Seebeck (University of Bern); Oberholzer et al., 2006 | (Plasmid) | |
| Recombinant DNA reagent | pIR1NEO | Guo et al., 2021 | (Plasmid) | |
| Recombinant DNA reagent | pGEX6P1-GST-PP | Prof. Daan Van Aalten (University of Dundee) | (Plasmid) | |
| Recombinant DNA reagent | pET15b | Novagen | (Plasmid) | |
| Chemical compound, drug | GDP[3H]Fuc | American Radiochemicals | ||
| Chemical compound, drug | Galβ1,3GlcNAcβ-OMe (LNB-O-Me) | Toronto Research Chemicals | ||
| Peptide, recombinant protein | X. manihotis α–1,2-fucosidase | New England Biolabs | ||
| Commercial assay or kit | GDP-Glo Kit | Promega | ||
| Other | MitoTracker Red CMX Ros | Thermo Fisher | ||
| Antibody | (Rabbit polyclonal) anti-TbFUT1 IgG | This study: antibody generated as described in Materialsandmethods | (1:1000) | |
| Antibody | (Rabbit polyclonal) anti-GRASP IgG | Prof. Graham Warren (University College London)/Prof. Chris de Graffenreid (Brown University) | (1:1000) | |
| Antibody | (Rabbit polyclonal) anti-ATPase IgG | Prof. David Horn (University of Dundee) | (1:1000) | |
| Antibody | (Mouse polyclonal) anti-FAZ IgM | Prof. Keith Gull (University of Oxford) | (1:2) | |
| Antibody | (Mouse polyclonal) anti-PFR IgG | Prof. Keith Gull (University of Oxford) | (1:10) |
Additional files
-
Supplementary file 1
Summary of BLASTp searches for putative fucosyltransferases in the three kinetoplastids genomes.
- https://cdn.elifesciences.org/articles/70272/elife-70272-supp1-v2.xlsx
-
Supplementary file 2
Primers and oligonucleotides used in this study.
- https://cdn.elifesciences.org/articles/70272/elife-70272-supp2-v2.xlsx
-
Source data 1
This folder includes the raw data for the following figures: Figure 2, Figure 2—figure supplement 1, Figure 2—figure supplement 2, Figure 3—figure supplement 1, and Figure 3—figure supplement 2.
- https://cdn.elifesciences.org/articles/70272/elife-70272-supp3-v2.zip
-
Source data 2
This folder includes the raw data for Figure 5—figure supplement 1.
- https://cdn.elifesciences.org/articles/70272/elife-70272-supp4-v2.zip
-
Source data 3
This folder includes the raw data for Figure 6D–F.
- https://cdn.elifesciences.org/articles/70272/elife-70272-supp5-v2.zip
-
Transparent reporting form
- https://cdn.elifesciences.org/articles/70272/elife-70272-transrepform1-v2.docx
Download links
A two-part list of links to download the article, or parts of the article, in various formats.
Downloads (link to download the article as PDF)
Open citations (links to open the citations from this article in various online reference manager services)
Cite this article (links to download the citations from this article in formats compatible with various reference manager tools)
An essential, kinetoplastid-specific GDP-Fuc: β-D-Gal α-1,2-fucosyltransferase is located in the mitochondrion of Trypanosoma brucei
eLife 10:e70272.
https://doi.org/10.7554/eLife.70272


