Tempo and mode of gene expression evolution in the brain across primates
- Department of Biology, University of Massachusetts Amherst, United States
- Molecular and Cellular Biology Graduate Program, University of Massachusetts Amherst, United States
- Department of Anthropology and Center for the Advanced Study of Human Paleobiology, The George Washington University, United States
- MAEBIOS Epidemiology Unit, United States
- Department of Anthropology, School of Biomedical Sciences, and Brain Health Research Institute, Kent State University, United States
- Department of Comparative Medicine, Michale E. Keeling Center for Comparative Medicine,The University of Texas M D Anderson Cancer Centre, United States
- New York Consortium in Evolutionary Primatology, United States
- Nash Family Department of Neuroscience and Friedman Brain Institute, Icahn School of Medicine at Mount Sinai, United States
- Department of Neuroscience, Washington University School of Medicine, United States
- Department of Anthropology, Washington University in St. Louis, United States
Figures
Figure 1
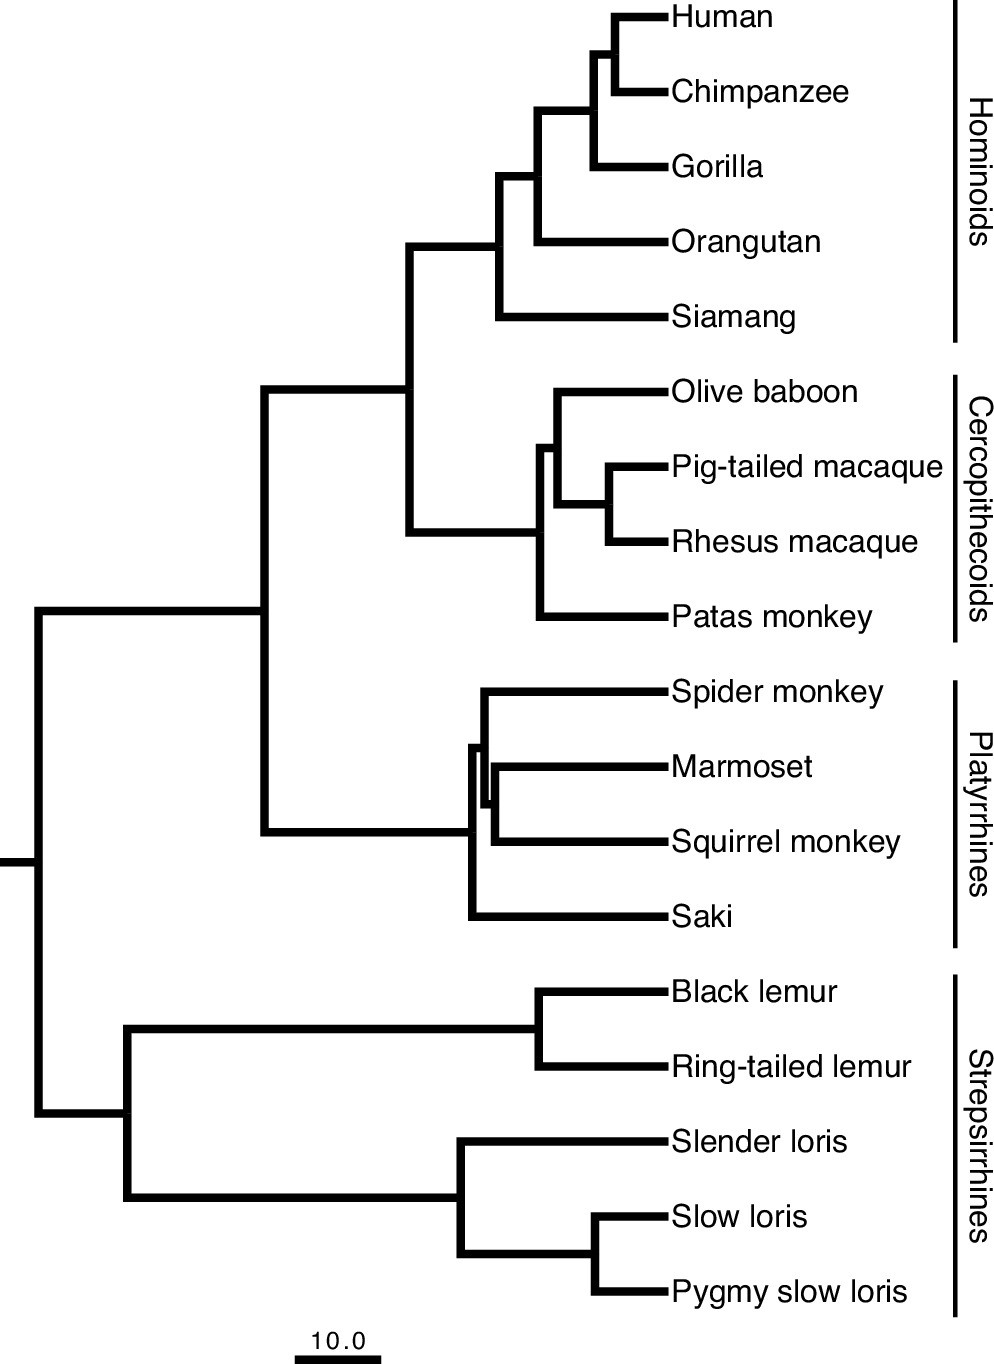
Primate phylogeny showing the eighteen species sampled in this study.
The scale bar for the branch lengths represents 10 million years of evolution. The phylogenetic tree is a consensus tree of 1000 iterations produced from 10kTrees v.3 (https://10ktrees.nunn-lab.org) based on data from GenBank. The insets demonstrate the approximate locations of the four brain regions sampled on a coronal section, midsagittal view, and lateral view (displayed left to right, respectively) of a schematized adult human brain.
Figure 2 with 3 supplements
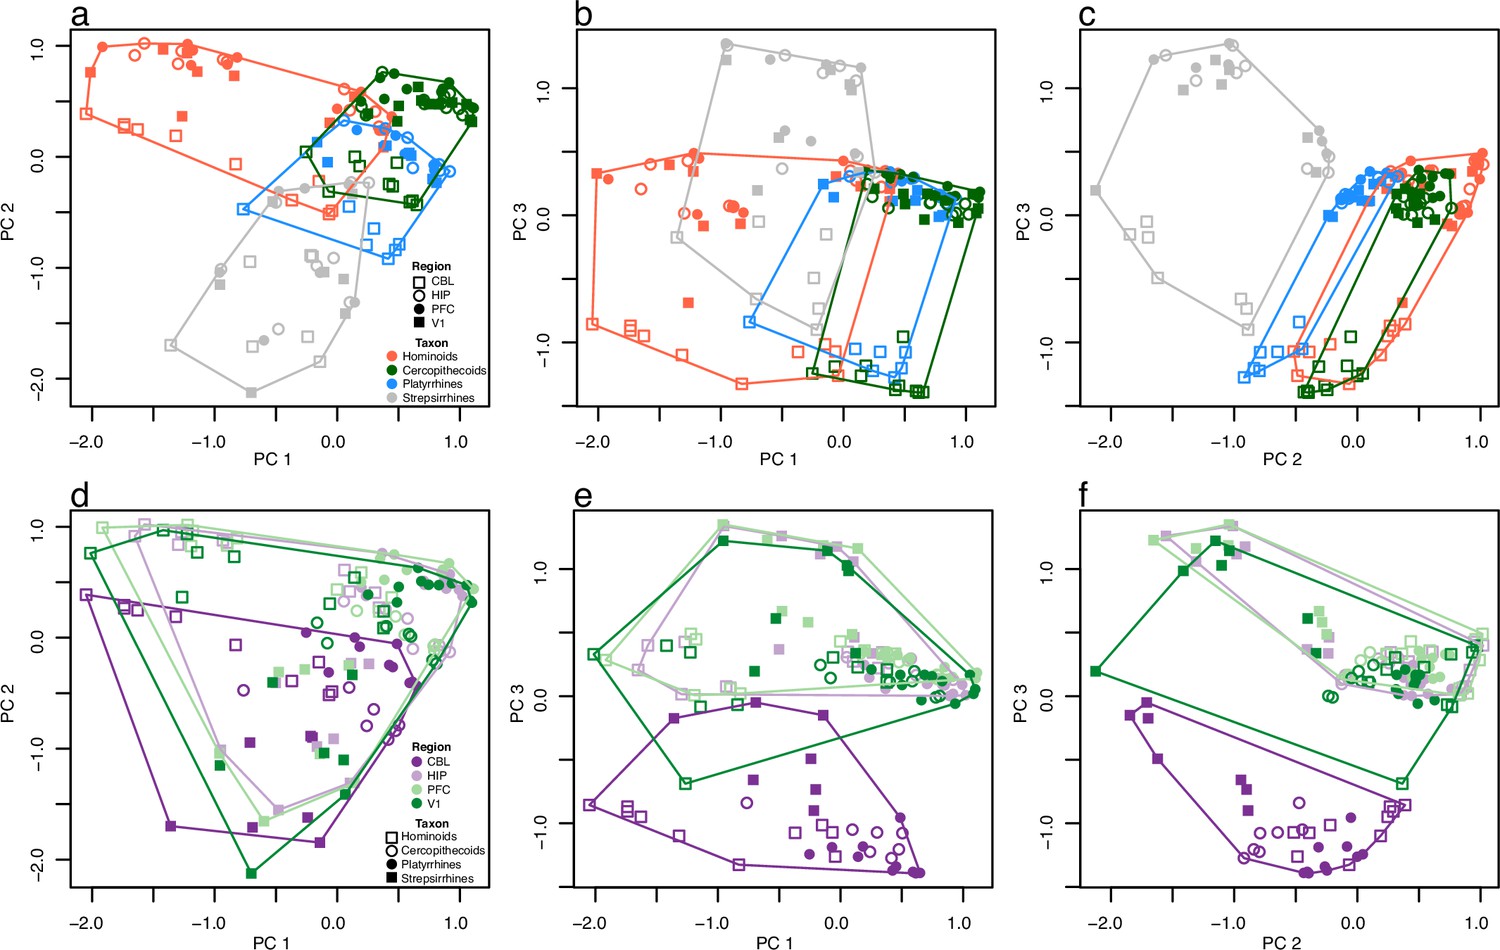
Patterns of brain gene expression across primates.
The first three axes of a principal coordinates analysis (PCoA) are plotted in both rows but have different symbols and colors to emphasize expression patterns specific to taxa (upper row, a–c) and regions (lower row, d-f). Polygons in each plot surround the data points for taxa (upper row) and regions (lower row). Axes 1, 2, and 3 represent 12.8, 10.3, and 9.4% of variance, respectively.
Figure 2—figure supplement 1

The first three axes of the principal coordinates analysis (PCoA) are plotted in three bivariate plots.
This is the same plot as Figure 2 of the main text except here each species is plotted as a different color.
Figure 2—figure supplement 2
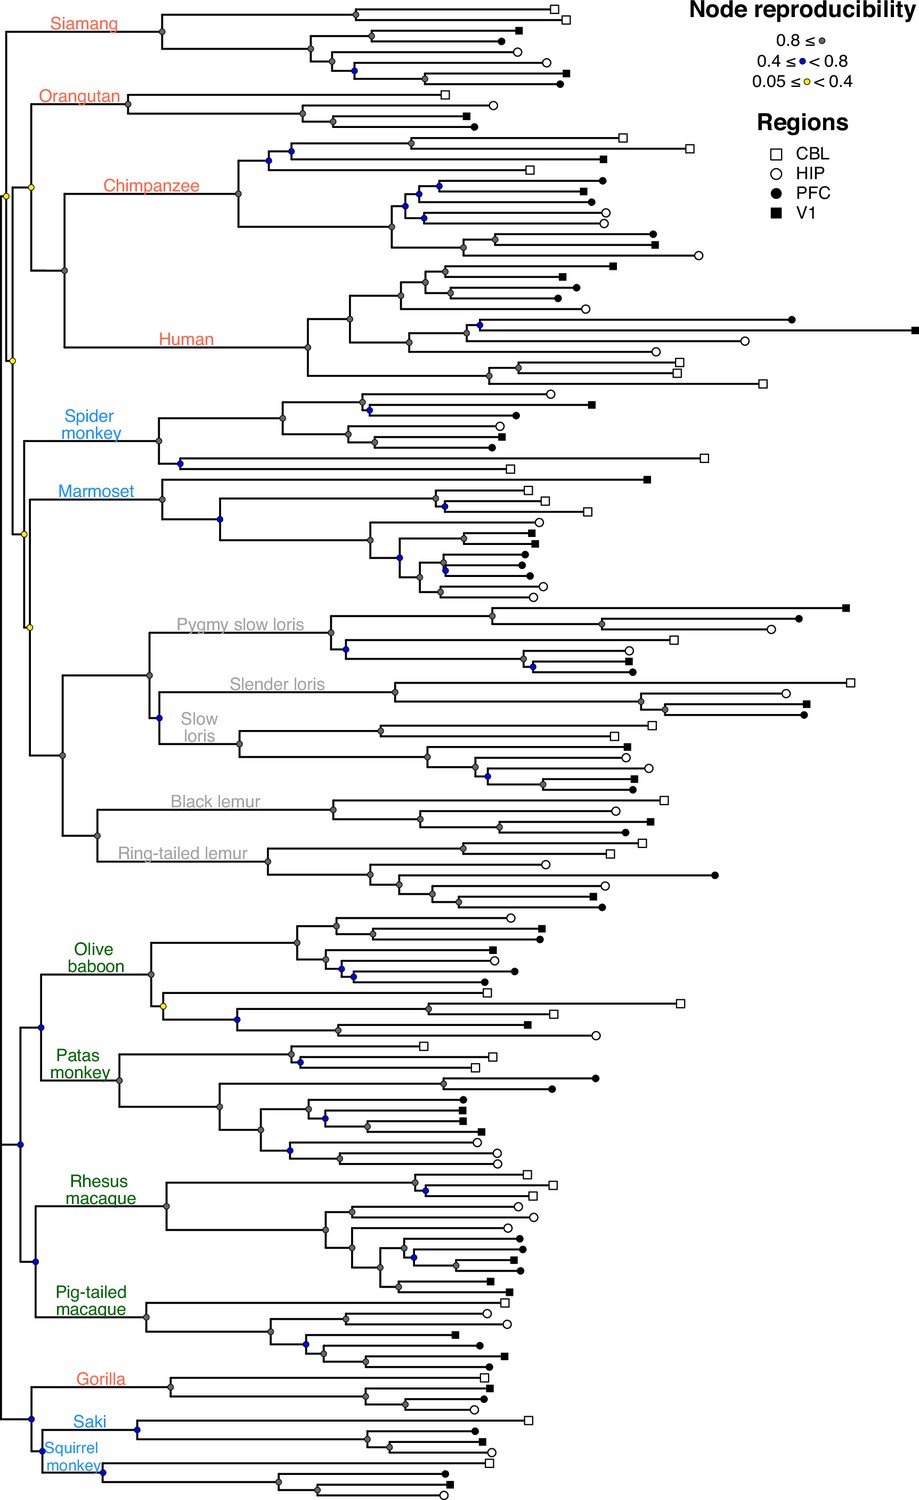
Gene expression phenogram of all sampled data.
The phenogram was constructed from neighboring-joining tree estimation based on log2 fold-change distances of the 500 most variable genes based on standard deviation (the same distance matrix that constructed the principal coordinates analysis (PCoA)). Reproducibility of the nodes of the tree were estimated using a bootstrap analysis of 1000 iterations. Species common names are color-coded to indicate taxa (hominoid, pink; cercopithecoid, green; platyrrhine, blue; strepsirrhine, gray).
Figure 2—figure supplement 3
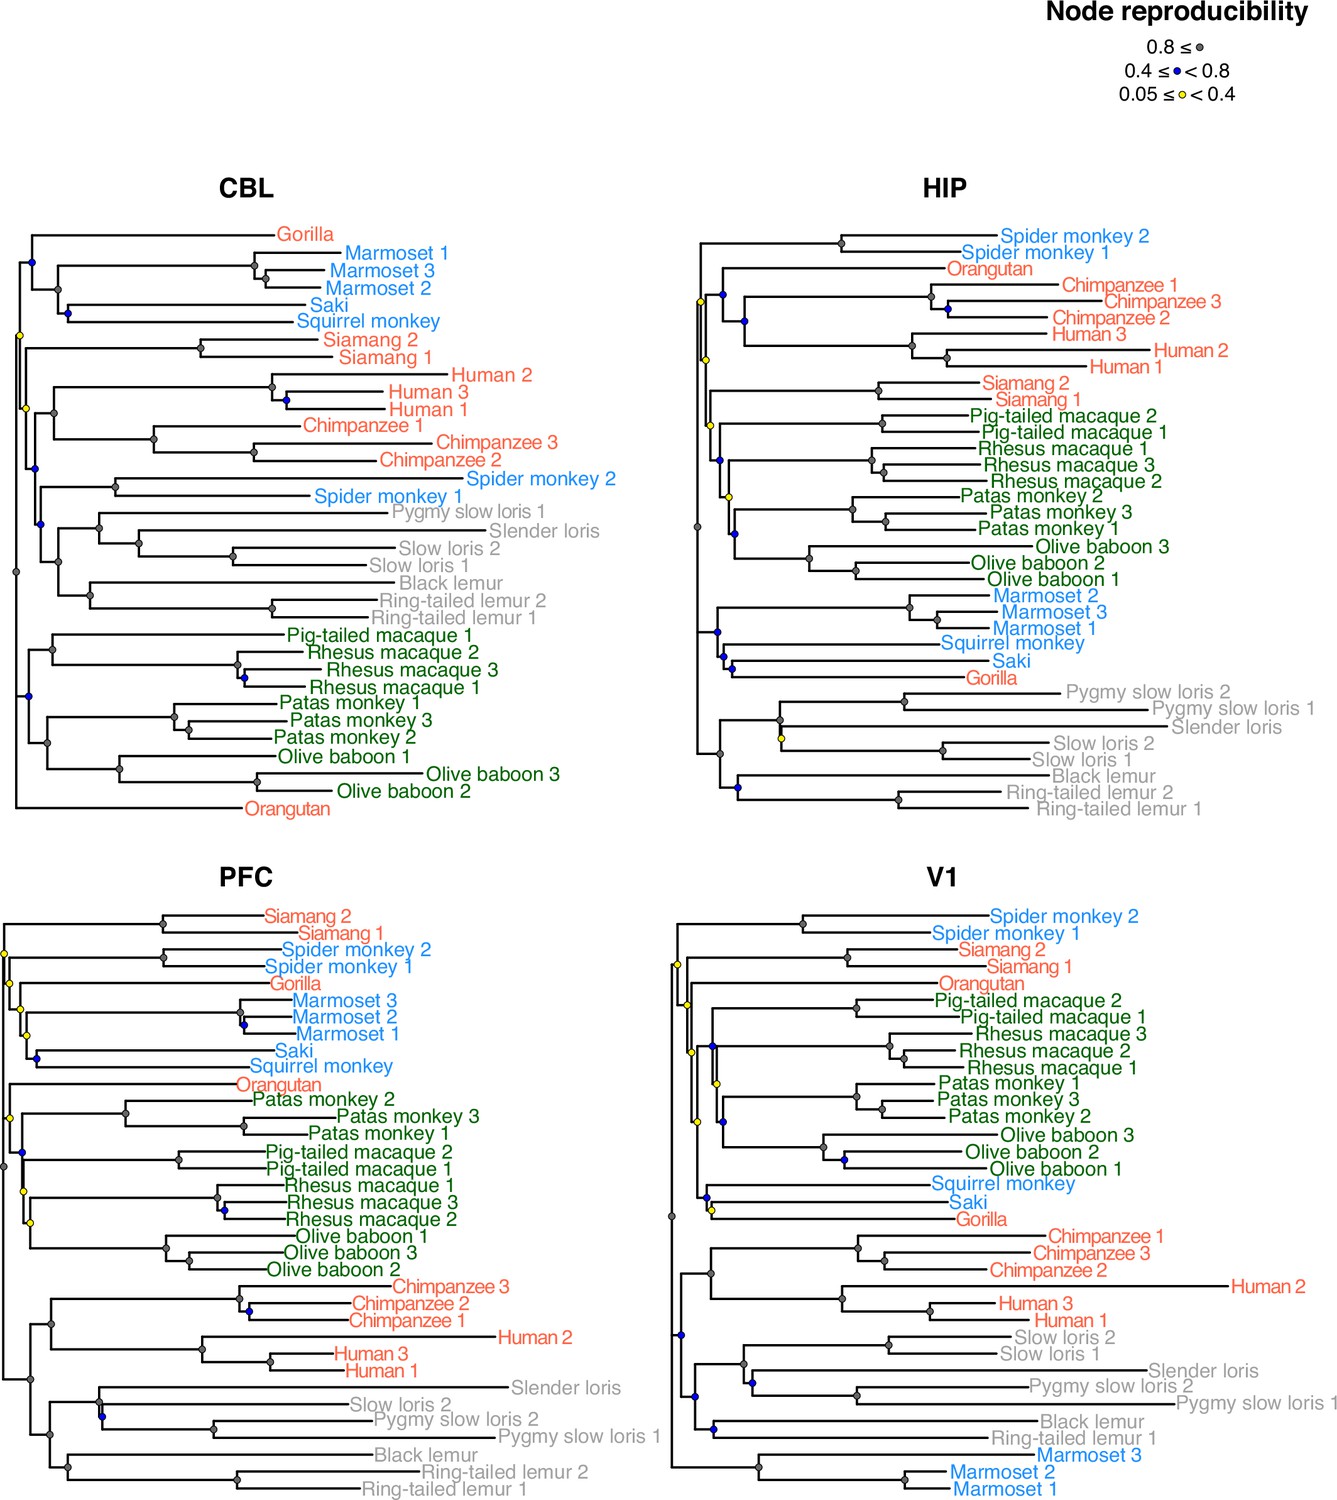
Gene expression phenograms by region.
The phenograms were constructed using the same techniques as Supplementary data Figure 2. Species common names are color-coded to indicate taxa (hominoid, pink; cercopithecoid, green; platyrrhine, blue; strepsirrhine, gray).
Figure 3 with 2 supplements
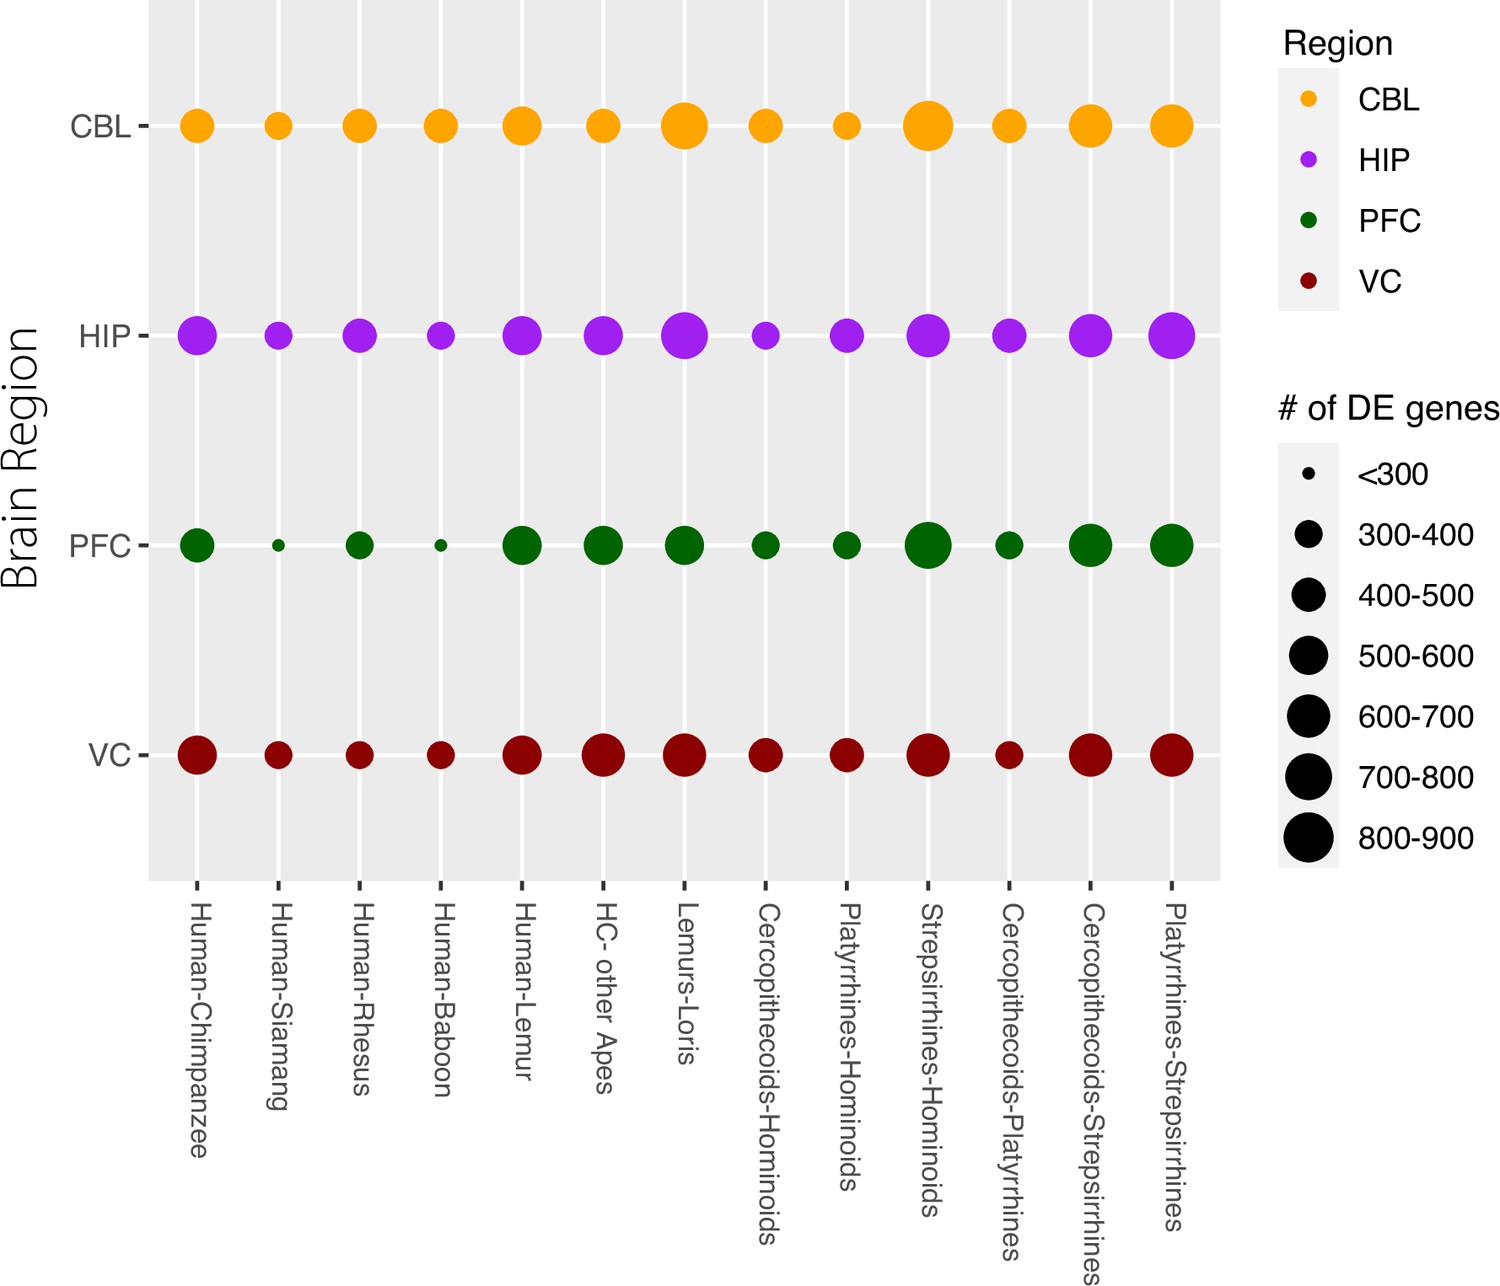
Gene counts of differentially expressed (DE) genes between species and clades.
Each row represents one of the four brain regions examined. The size of the circle represents the number of DE genes seen at q<0.05 (5% FDR). The comparisons on the left are between exemplar species or sets of species, comparisons on the right are between clades of primates.
Figure 3—figure supplement 1
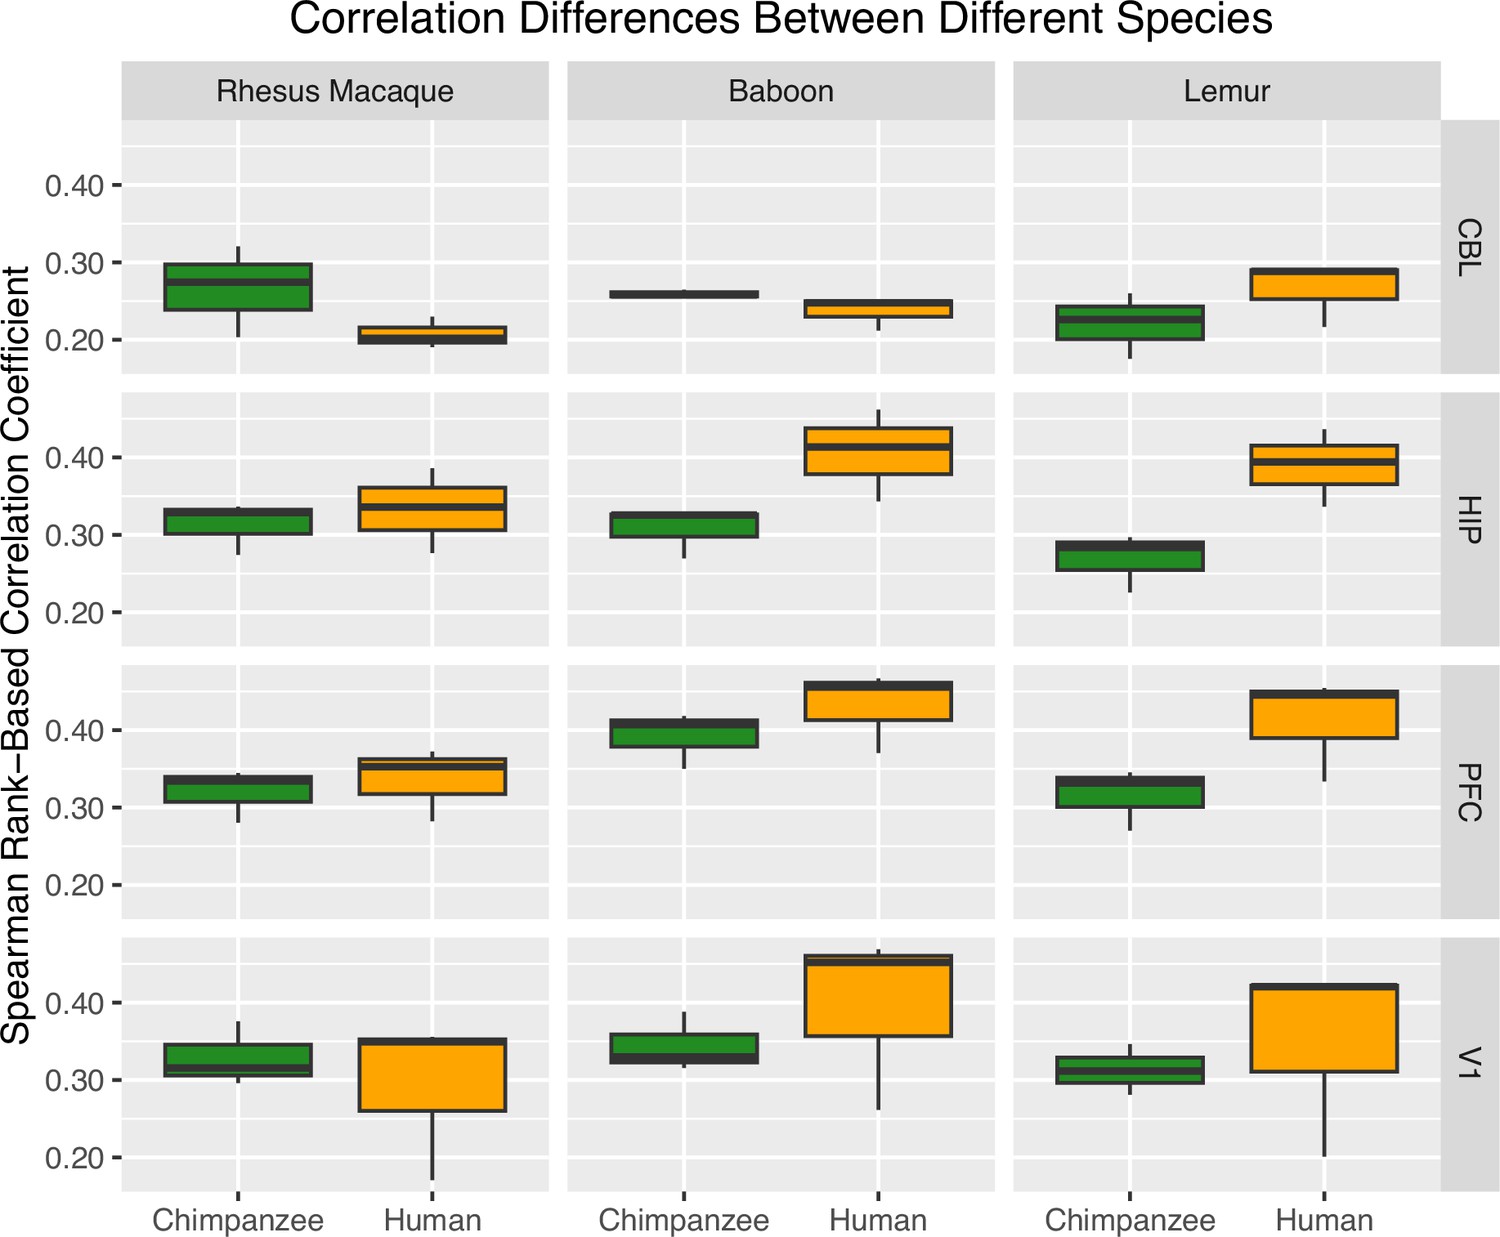
Box Plots of Pearson Rank-based Correlation Coefficients for multiple species and brain region comparisons.
The plot shows how each species’ expression patterns (rhesus macaque, baboon, and lemur) correlate with the DEGs of human and chimpanzee (yellow and green, respectively) samples for each brain region.
Figure 3—figure supplement 2

Upset Plot of each brain region (color) showing the shared DEGs for select species across the phylogeny.
Figure 4 with 1 supplement
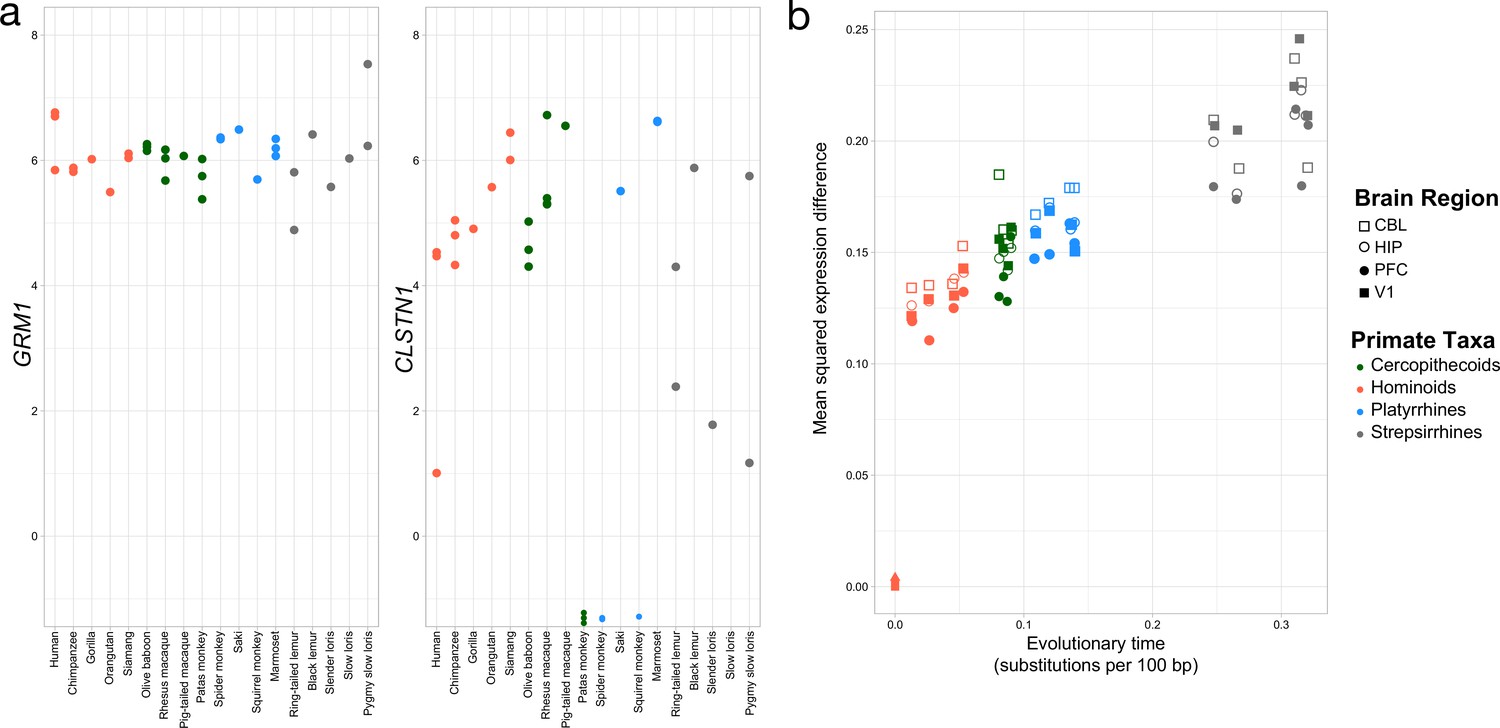
Rates of change over genes and evolutionary time.
a. Exemplar genes that show constraint (left panel) and variation (right panel) across primates (colors as in Figure 2). b. Mean squared expression difference plotted by evolutionary distance to humans across all orthologs that were expressed. Shapes denote the four brain regions, and the colors represent the four major primate clades represented in our samples.
Figure 4—figure supplement 1

Region-specific plots of mean square expression differences over evolutionary time for each of the four brain regions analyzed.
Figure 5 with 1 supplement
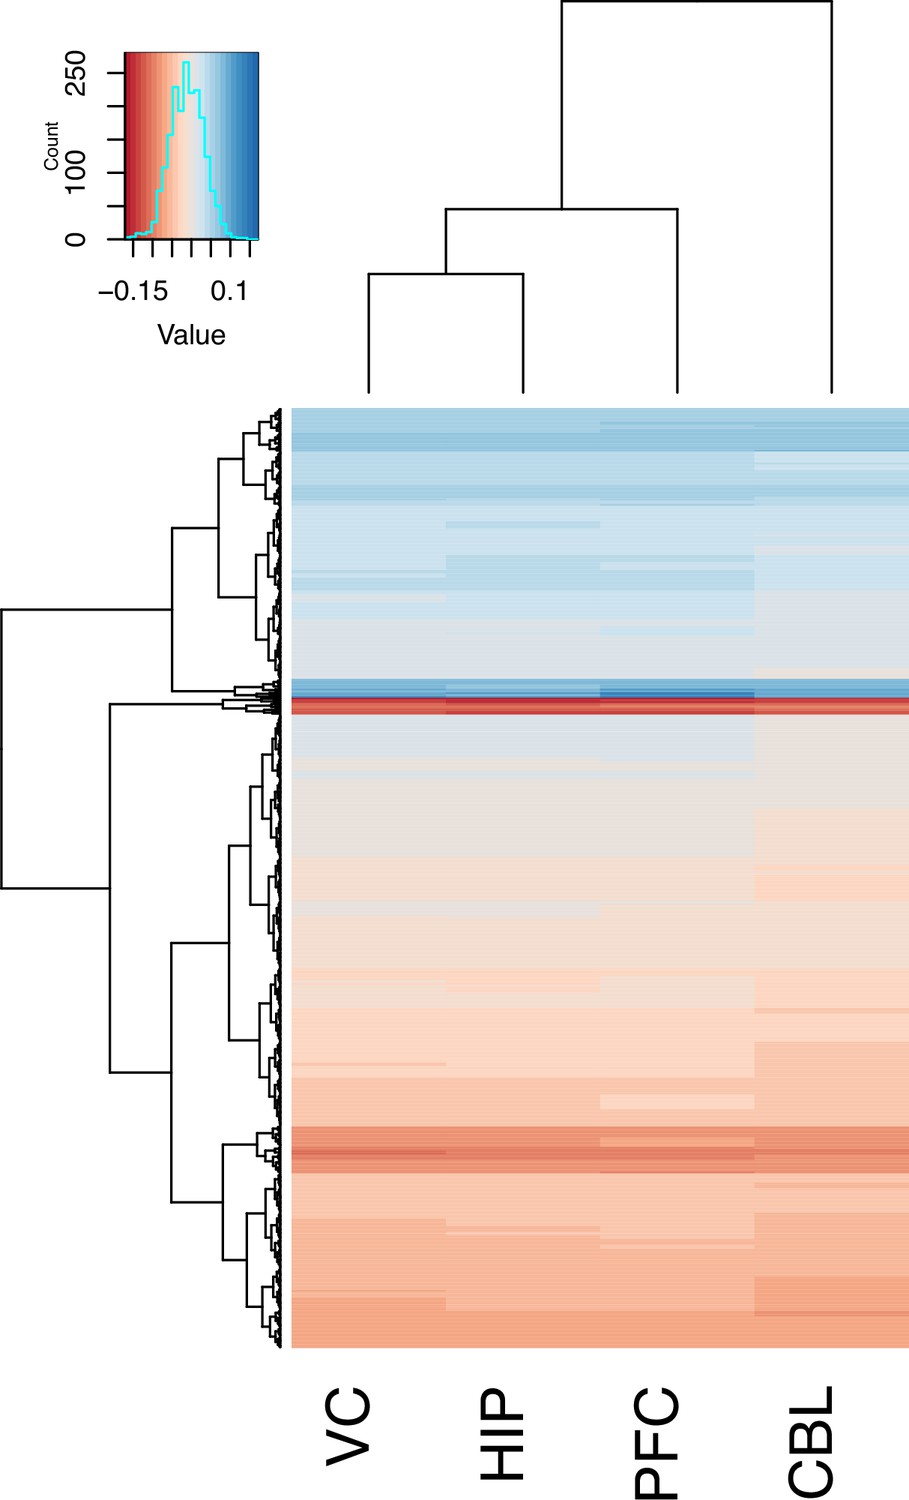
Gene correlated with brain size by region.
A clustering and heatmap of the loadings from PC2 of genes for the four regions examined (V1, HIP, PFC, and CBL).
Figure 5—figure supplement 1

principal coordinates analysis (PCoA) of expression data from human samples of all four brain regions and primary neurons and astrocytes.
Symbols delineate the current study’s tissue samples from primary cell data. Colors distinguish cell type or brain region. Tissue-level human samples from all regions do not exhibit biased expression for either neurons or astrocytes.
Tables
Author response table 1
| term | min | q25 | median | mean | q75 | max | sd |
|---|---|---|---|---|---|---|---|
| Residuals | 0.01258956 | 0.23478366 | 0.31134162 | 0.31409894 | 0.38774308 | 0.75204413 | 0.11557519 |
| age | 8.2272E-10 | 0.00049112 | 0.003355 | 0.01021905 | 0.01296546 | 0.19166529 | 0.01660386 |
| family | 0.00018917 | 0.151815 | 0.2737052 | 0.30422055 | 0.43594555 | 0.87422117 | 0.18970219 |
| individual | 0.00042591 | 0.02788199 | 0.05329402 | 0.06773906 | 0.09440077 | 0.37780784 | 0.05345294 |
| region | 0.00021586 | 0.03412893 | 0.06644626 | 0.10044476 | 0.12891681 | 0.88163452 | 0.10373119 |
| sex | 5.0908E-10 | 0.00052758 | 0.00313619 | 0.00908844 | 0.01174799 | 0.1501228 | 0.01403884 |
| species | 2.0257E-06 | 0.04136567 | 0.12098179 | 0.1941892 | 0.3078835 | 0.8005367 | 0.18885516 |
Additional files
-
Supplementary file 1
Species and sample information.
- https://cdn.elifesciences.org/articles/70276/elife-70276-supp1-v2.xlsx
-
Supplementary file 2
Percent identity thresholds used for orthology assignments for each species.
- https://cdn.elifesciences.org/articles/70276/elife-70276-supp2-v2.xlsx
-
Supplementary file 3
BUSCO Scores against Mammalian lineage (mammalia_odb10).
- https://cdn.elifesciences.org/articles/70276/elife-70276-supp3-v2.docx
-
Supplementary file 4
Eigenvalues, percent variance, and cumulative variance across disparate axes of the principal coordinates analysis (PCoA) of the 500 most variable genes from all data sampled.
- https://cdn.elifesciences.org/articles/70276/elife-70276-supp4-v2.xlsx
-
Supplementary file 5
Area occupied by each polygon representing either taxa or brain region in the principal coordinates analysis (PCoA) of the 500 most variable genes from all data sampled.
- https://cdn.elifesciences.org/articles/70276/elife-70276-supp5-v2.xlsx
-
Supplementary file 6
Enrichments are performed on an ordered query of differentially expressed (DE) genes where q<0.05 (this is not ranked on higher or lower expression, just absolute change).
- https://cdn.elifesciences.org/articles/70276/elife-70276-supp6-v2.xlsx
-
Supplementary file 7
Enrichments are performed on an ordered query of genes comparing those with a higher degree of fit for the Ornstein–Uhlenbeck (OU) model (stabilizing expression) with those that fit the Brownian Motion model (neural expression).
- https://cdn.elifesciences.org/articles/70276/elife-70276-supp7-v2.xlsx
-
Supplementary file 8
Species endocranial volumes (ECVs) were obtained from Isler et al., 2008 and Coqueugniot and Hublin, 2012.
Reported volumes are averages of male and female data. ECVs are transformed to brain mass using the Stephan, 1960 correction factor of 1.036 g/ml.
- https://cdn.elifesciences.org/articles/70276/elife-70276-supp8-v2.xlsx
-
Supplementary file 9
PC2 results from the brain size analysis by region.
- https://cdn.elifesciences.org/articles/70276/elife-70276-supp9-v2.xlsx
-
Supplementary file 10
Outlier Expression Analysis using the scoreGenes.R script in the EVEE-tools script set.
- https://cdn.elifesciences.org/articles/70276/elife-70276-supp10-v2.xlsx
-
MDAR checklist
- https://cdn.elifesciences.org/articles/70276/elife-70276-mdarchecklist1-v2.pdf
Download links
A two-part list of links to download the article, or parts of the article, in various formats.
Downloads (link to download the article as PDF)
Open citations (links to open the citations from this article in various online reference manager services)
Cite this article (links to download the citations from this article in formats compatible with various reference manager tools)
Tempo and mode of gene expression evolution in the brain across primates
eLife 13:e70276.
https://doi.org/10.7554/eLife.70276


