Social contact patterns and implications for infectious disease transmission – a systematic review and meta-analysis of contact surveys
- MRC Centre for Global Infectious Disease Analysis, Imperial College London, United Kingdom
- Department of Mathematics, Imperial College London, United Kingdom
- Department of Epidemiology and Biostatistics, Indiana University School of Public Health, United States
- Laboratory for the Modeling of Biological and Socio-technical Systems, Northeastern University, United States
- VITROME, Institut de Recherche pour le Developpement, Senegal
- School of Health and Related Research, University of Sheffield, United Kingdom
- Division of Pharmacoepidemiology, Department of Health Policy, Vanderbilt University Medical Center, United States
- KEMRI-Wellcome Trust Research Programme, Kenya
- Centre for Community Medicine, All India Institute of Medical Sciences, India
- Bill and Melinda Gates Foundation, United States
- JC School of Public Health and Primary Care, Chinese University of Hong Kong, China
- Stanley Ho Centre for Emerging Infectious Diseases, The Chinese University of Hong Kong, China
- Shenzhen Research Institute of The Chinese University of Hong Kong, China
- Instituto de Investigación Nutricional, Peru
- Department of Medicine, Vanderbilt University, United States
- London School of Hygiene and Tropical Medicine, United Kingdom
- WHO Collaborating Centre for Infectious Disease Epidemiology and Control, School of Public Health, LKS Faculty of Medicine, The University of Hong Kong, China
- Laboratory of Data Discovery for Health (D24H), Hong Kong Science Park, China
- Faculty of Medicine and Public Health, HRH Princess Chulabhorn College of Medical Science, Chulabhorn Royal Academy, Thailand
- Dondena Centre for Research on Social Dynamics and Public Policy, Department of Social and Political Sciences, Bocconi University, Italy
- Desmond Tutu HIV Centre, Department of Medicine, University of Cape Town, South Africa
- Centre for Infectious Disease Epidemiology and Research (CIDER), School of Public Health and Family Medicine, Faculty of Health Sciences, University of Cape Town, South Africa
- Health Directorate, Luxembourg
- Infection and Immunity, Murdoch Children's Research Institute, Australia
- Department of Paediatrics, University of Melbourne, Australia
- School of Life Sciences, University of Warwick, United Kingdom
- Department of Tropical Hygiene, Faculty of Tropical Medicine, Mahidol University, Thailand
- National Institute for Allergies and Infectious Diseases, National Institutes of Health, United States
- The Emmes Company, United States
- Influenza Programme, US Centers for Disease Control and Prevention, India
- Seattle Epidemiologic Research and Information Center, United States Department of Veterans Affairs, United States
- Department of Epidemiology, University of Washington, United States
- Fred Hutchinson Cancer Research Center, United States
- School of Public Health, Fudan University, Key Laboratory of Public Health Safety, Ministry of Education, China
Figures
Figure 1

Total number of contacts.
Sample median total number of contacts shown by gender (right) and 5-year age groups up to ages 80+ shown for (A) lower-income countries (LICs)/lower-middle countries (LMICs), (B) upper-middle-income countries (UMICs), and (C) high-income countries (HICs). Grey lines denote individual studies, and the solid black line is the median across all studies of within that income group. Studies with a diary-based methodology are represented by a solid grey line and those with a questionnaire or interview design are shown as a dashed line. For UMICs, one study outlier with extremely high number of contacts is excluded (online Thai survey with a ‘snowball’ design by Stein et al., 2014). Contact rate ratios and associated 95% credible intervals from a negative binomial model with random study effects are shown in (D) (LICs/LMICs), (E) (UMICs), and (F) (HICs). All models were adjusted for age and gender and were ran separately for each key variable (weekday/weekend, household size, survey methodology, student/employment status).
Figure 2
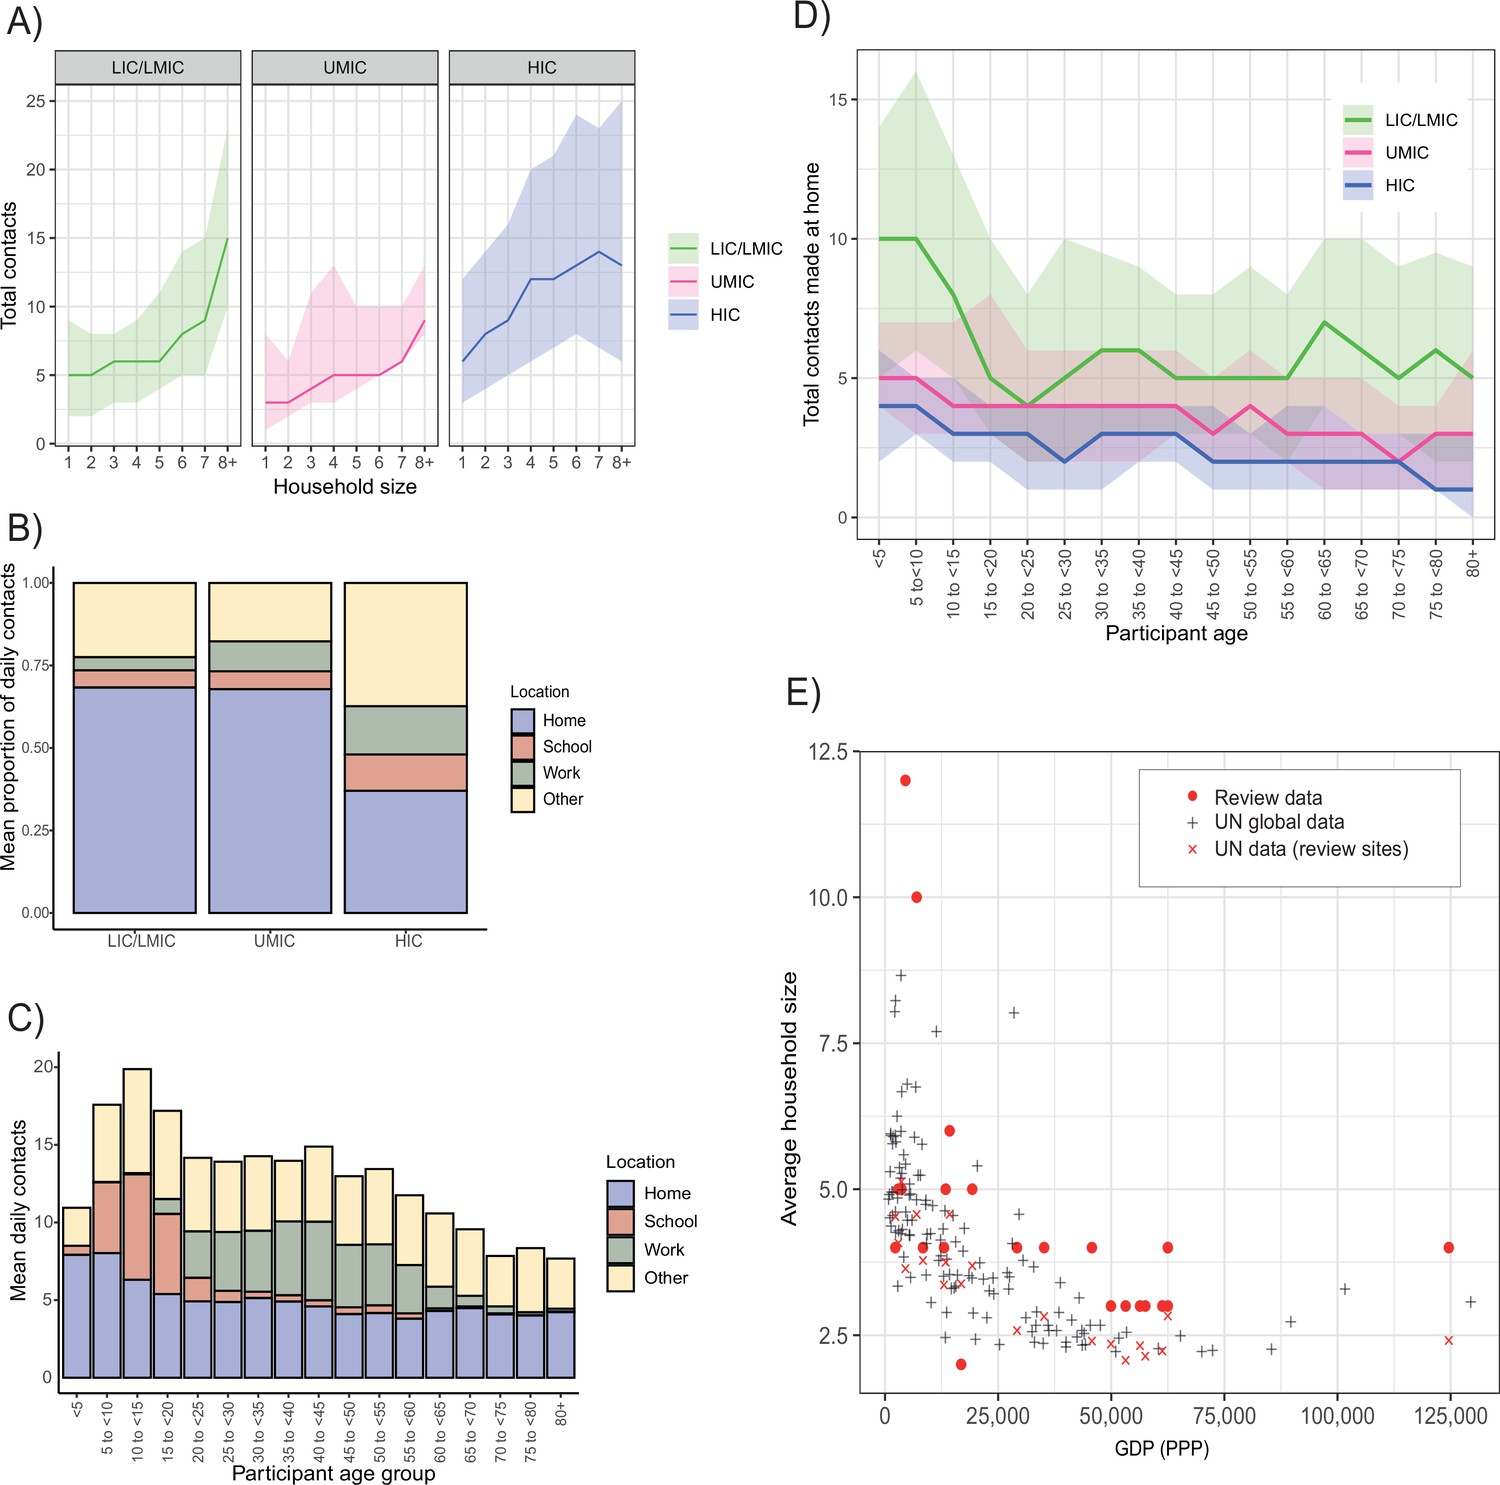
Contact location and household size.
(A) Sample median number of contacts by household size in review data, stratified by income strata. Shaded area denotes the interquartile range. (B) Sample mean % of contacts made at each location (home, school, work, other) by income group. (C) Total daily contacts (sample mean number) made at each location by 5-year age group. (D) Sample median number of contacts made at home by 5-year age groups and income strata. Shaded area denotes the interquartile range. (E) Average household size and GDP; red circles represent median household size in single studies from the review. GDP information was obtained from the World Bank Group and global household size data from the Department of Economic and Social Affairs, Population Division, United Nations.
Figure 3
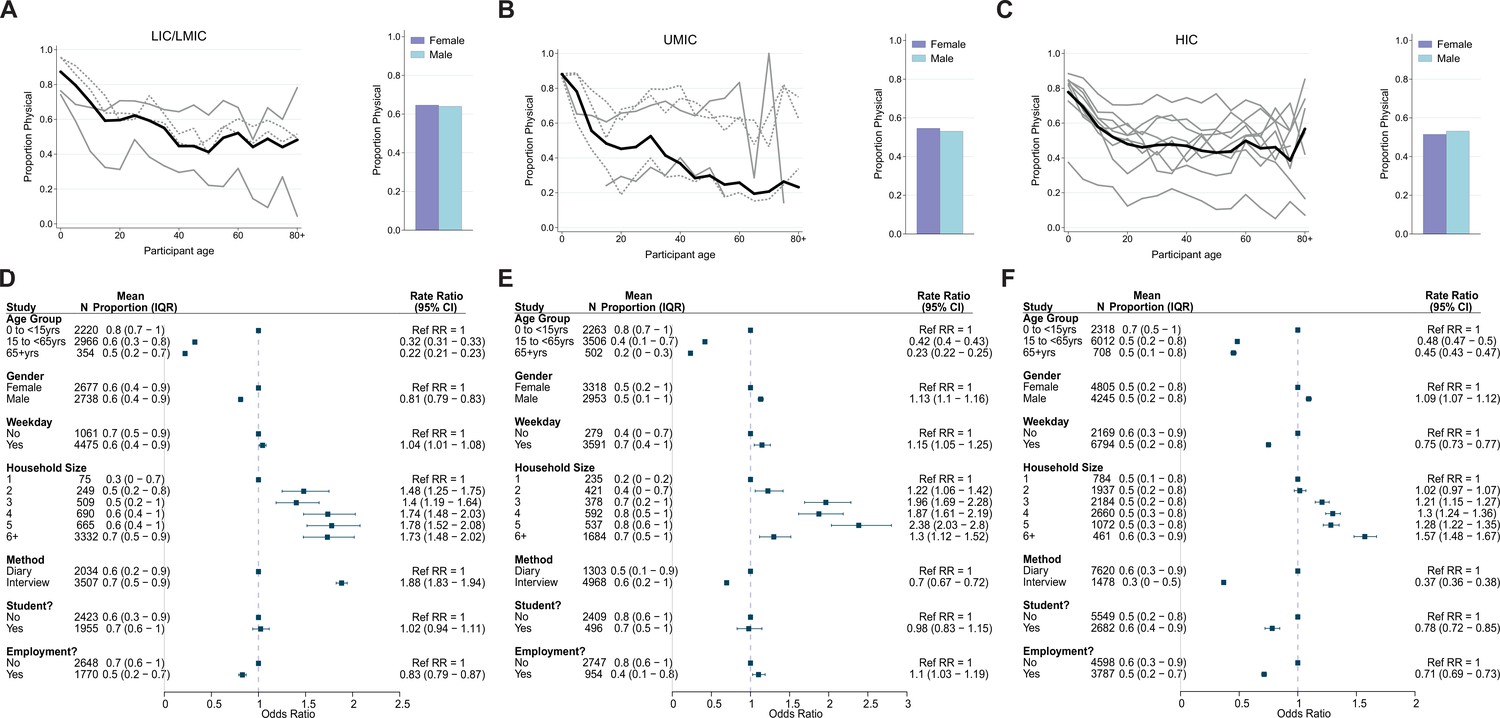
Physical contacts.
Mean proportion of contacts that are physical shown by gender (right) and 5-year age groups up to ages 80+ shown for (A) lower-income countries (LICs)/lower-middle countries (LMICs), (B) upper-middle-income countries (UMICs), and (C) high-income countries (HICs). Grey lines denote individual studies, and the solid black line is the mean across all studies of within that income group. Studies with a diary-based methodology are represented by a solid grey line and those with a questionnaire or interview design are shown as a dashed line. Odds ratios and associated 95% credible intervals from a logistic regression model with random study effects are shown in D (LICs/LMICs), E (UMICs), and F (HICs). All models were adjusted for age and gender and were ran separately for each key variable (weekday/weekend, household size, survey methodology, student/employment status).
Figure 4
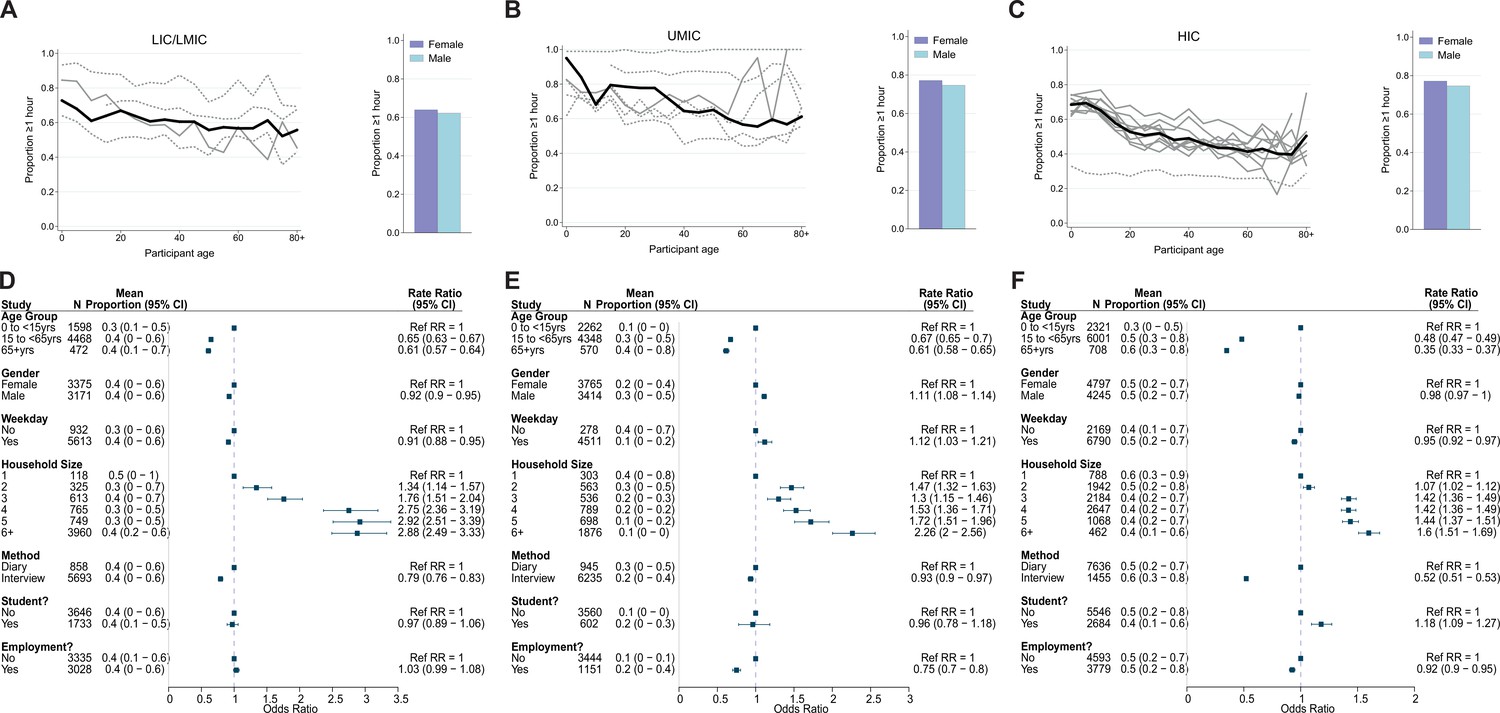
Contact duration.
Mean proportion of contacts that last at least an hour shown by gender (right) and 5-year age groups up to ages 80+ shown for (A) lower-income countries (LICs)/lower-middle countries (LMICs), (B) upper-middle-income countries (UMICs), and (C) high-income countries (HICs). Grey lines denote individual studies and the solid black line is the mean across all studies of within that income group. Studies with a diary-based methodology are represented by a solid grey line and those with a questionnaire or interview design are shown as a dashed line. Odds ratios and associated 95% credible intervals from a logistic regression model with random study effects are shown in (D) (LICs/LMICs), (E) (UMICs), and (F) (HICs). All models were adjusted for age and gender and were ran separately for each key variable (weekday/weekend, household size, survey methodology, student/employment status).
Appendix 1—figure 1
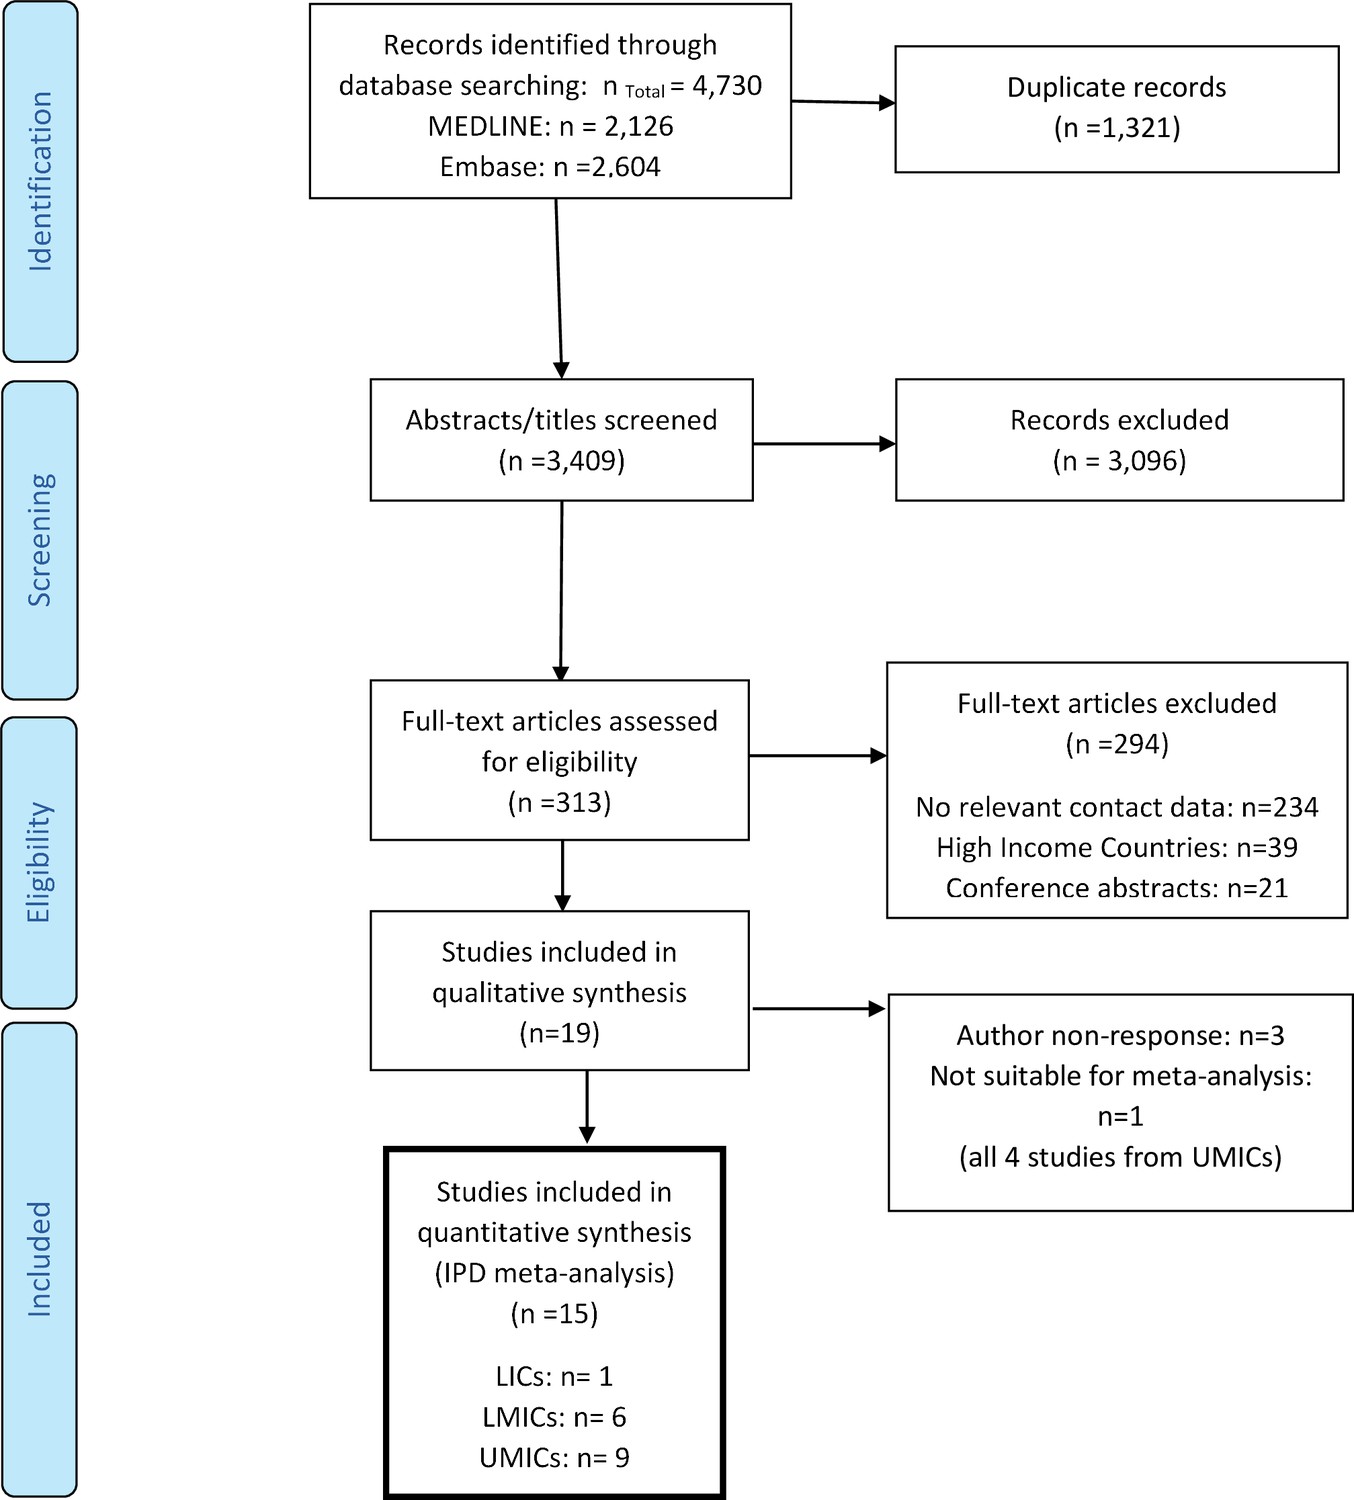
Preferred Reporting Items for Systematic Reviews and Meta-Analyses (PRISMA) flow diagram of the screening process and selection of eligible.
Appendix 2—figure 1
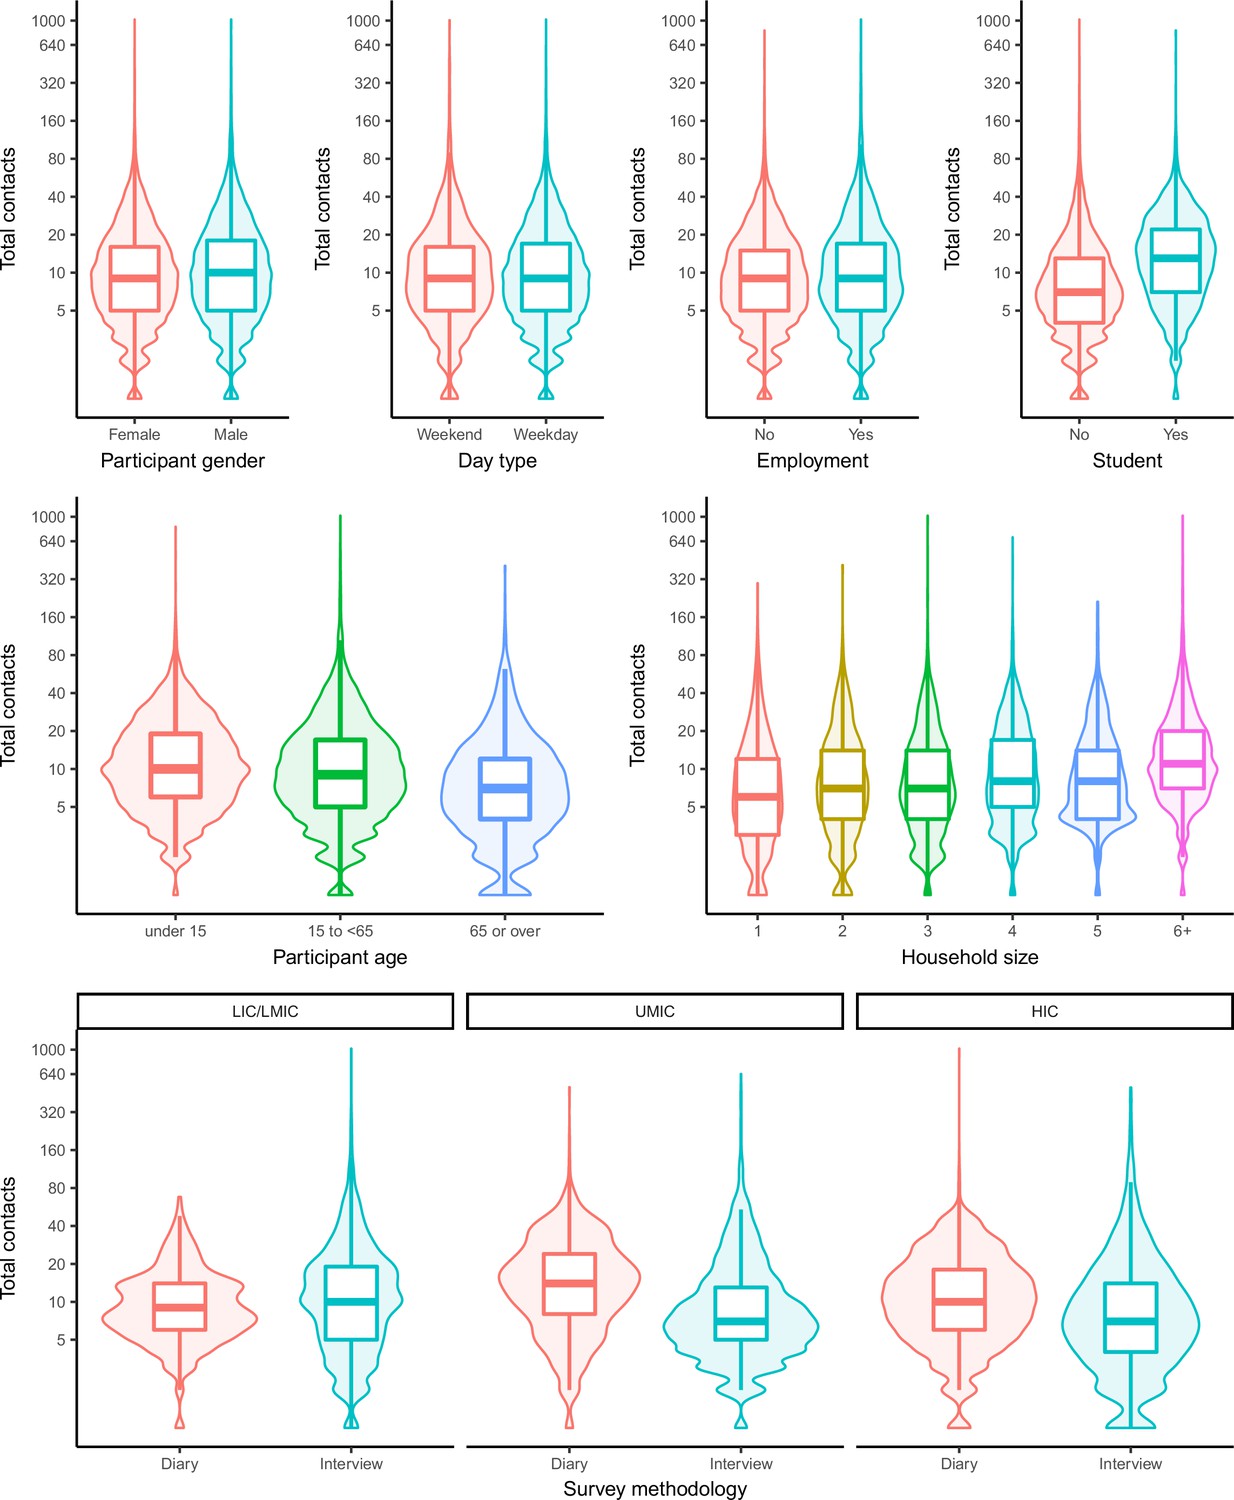
Total number of contacts boxplots and violin plots by participant/study characteristics.
Appendix 2—figure 2
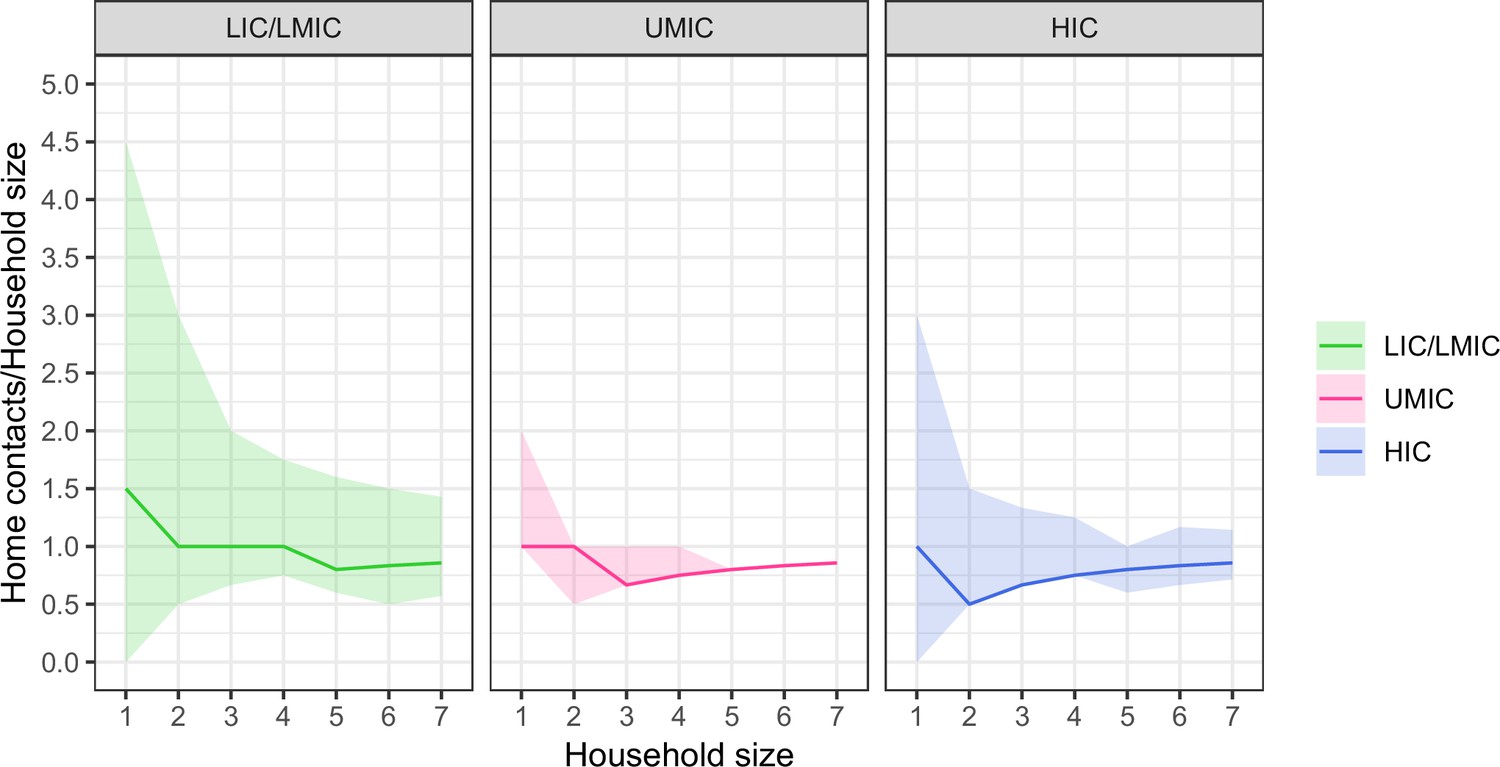
The relationship between household size and median daily contacts made at home divided by a participant’s household size, stratified by income strata.
Appendix 2—figure 3

Comparison of estimated regression coefficients for predicting total contacts with and without the inclusion of additional contacts.
Appendix 2—figure 4
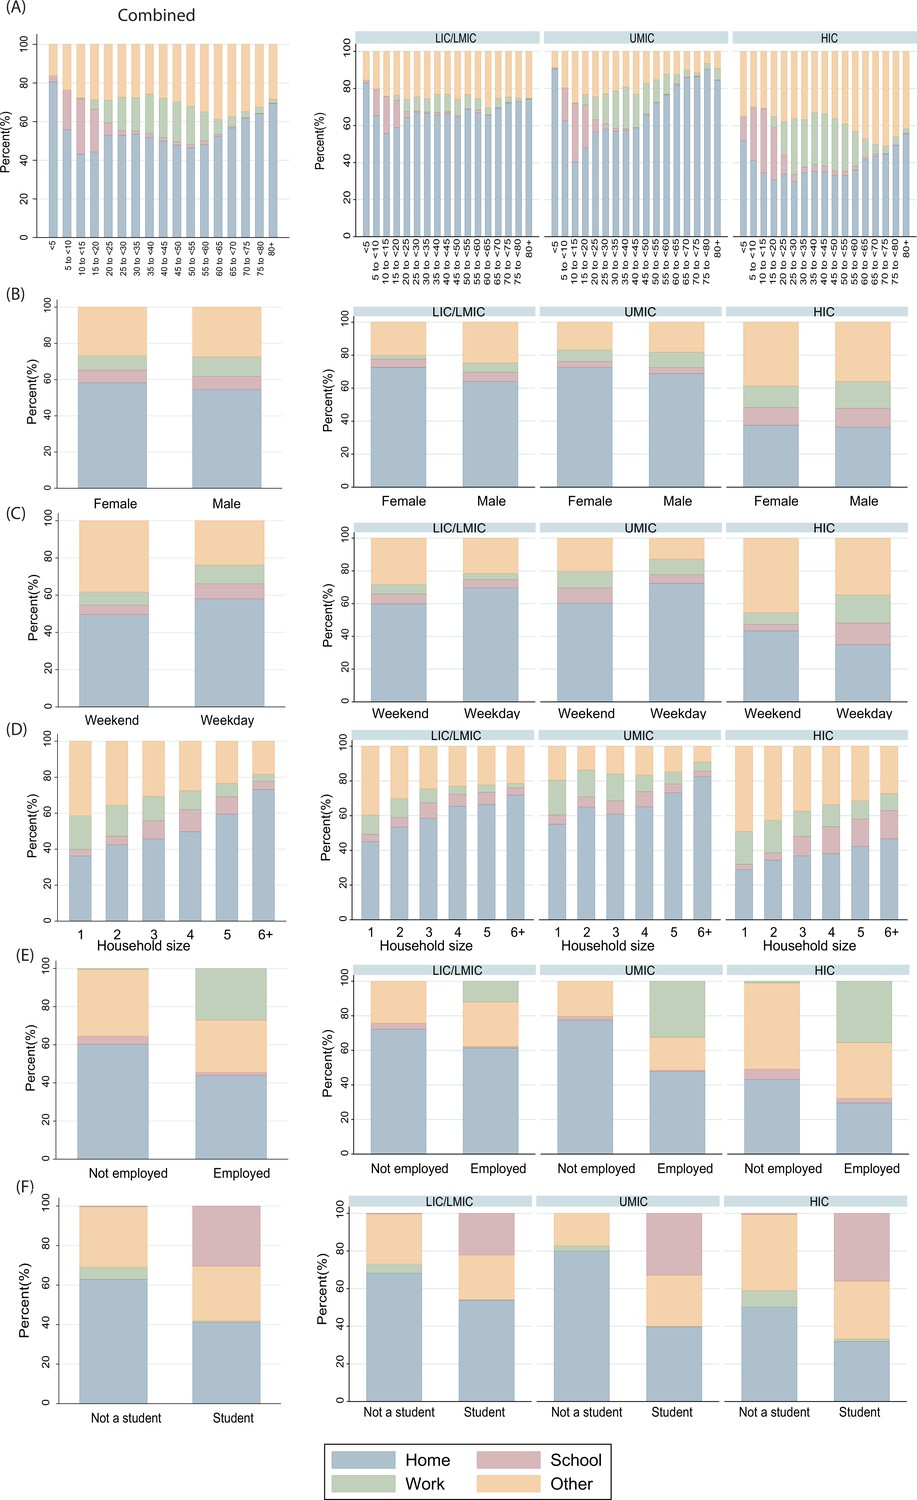
Location of contacts as a percentage of total daily contacts by (A) participant’s age, (B) participant’s gender, (C) day of the week, (D) household size, (E) employment status (in participants aged 18 or over), and (F) student status in participants aged 5 to <20 years.
Appendix 2—figure 5
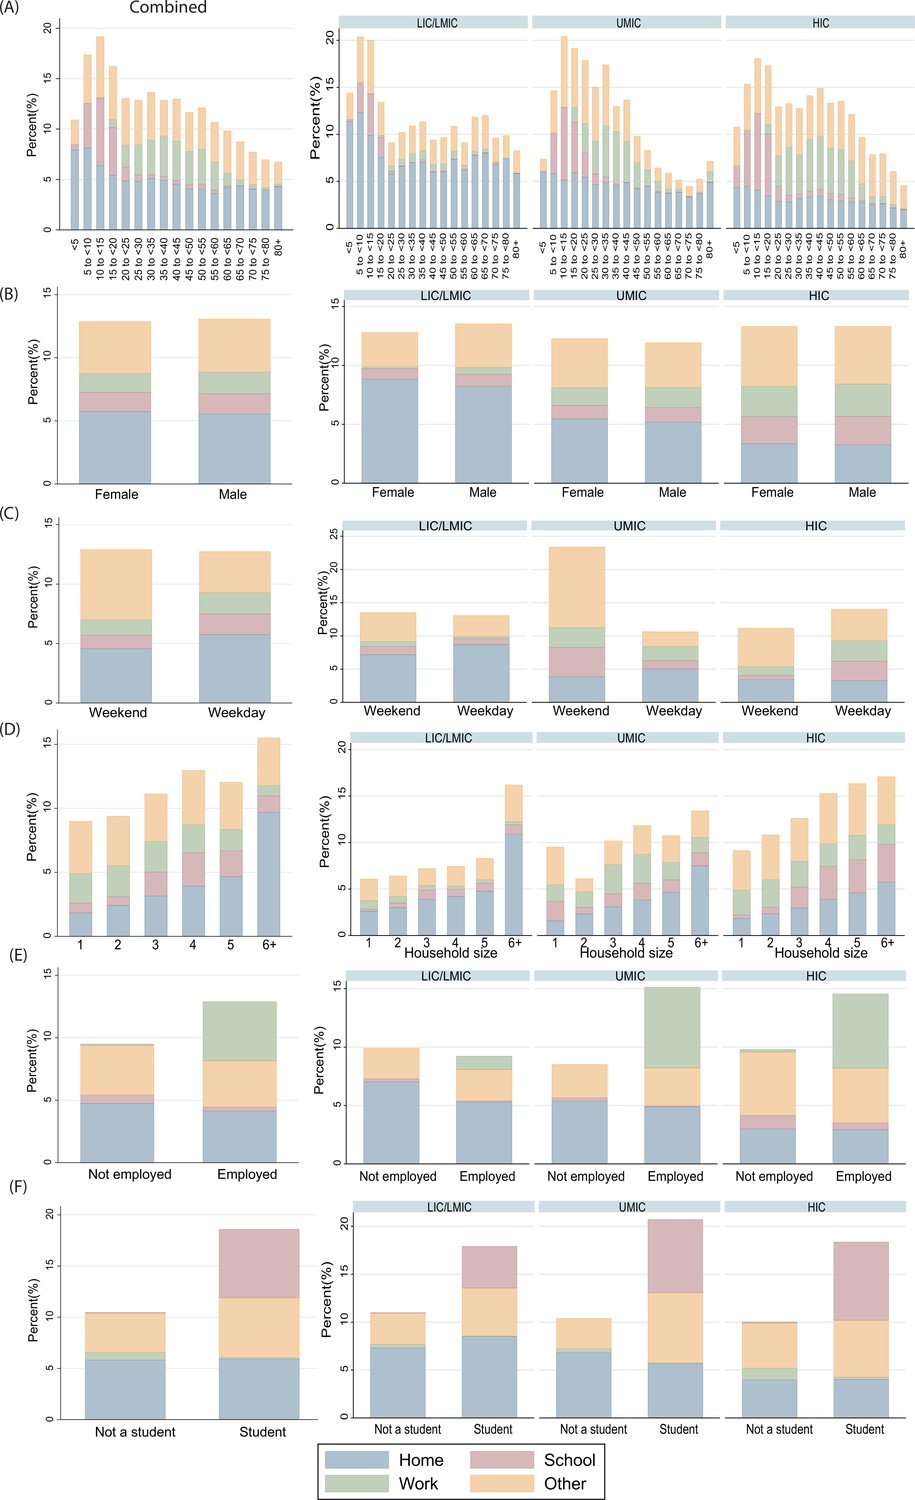
Total number of daily contacts in each location by (A) participant’s age, (B) participant’s gender, (C) day of the week, (D) household size, (E) employment status (in participants aged 18 or over), and (F) student status in participants aged 5 to < 20 years.
Appendix 2—figure 6
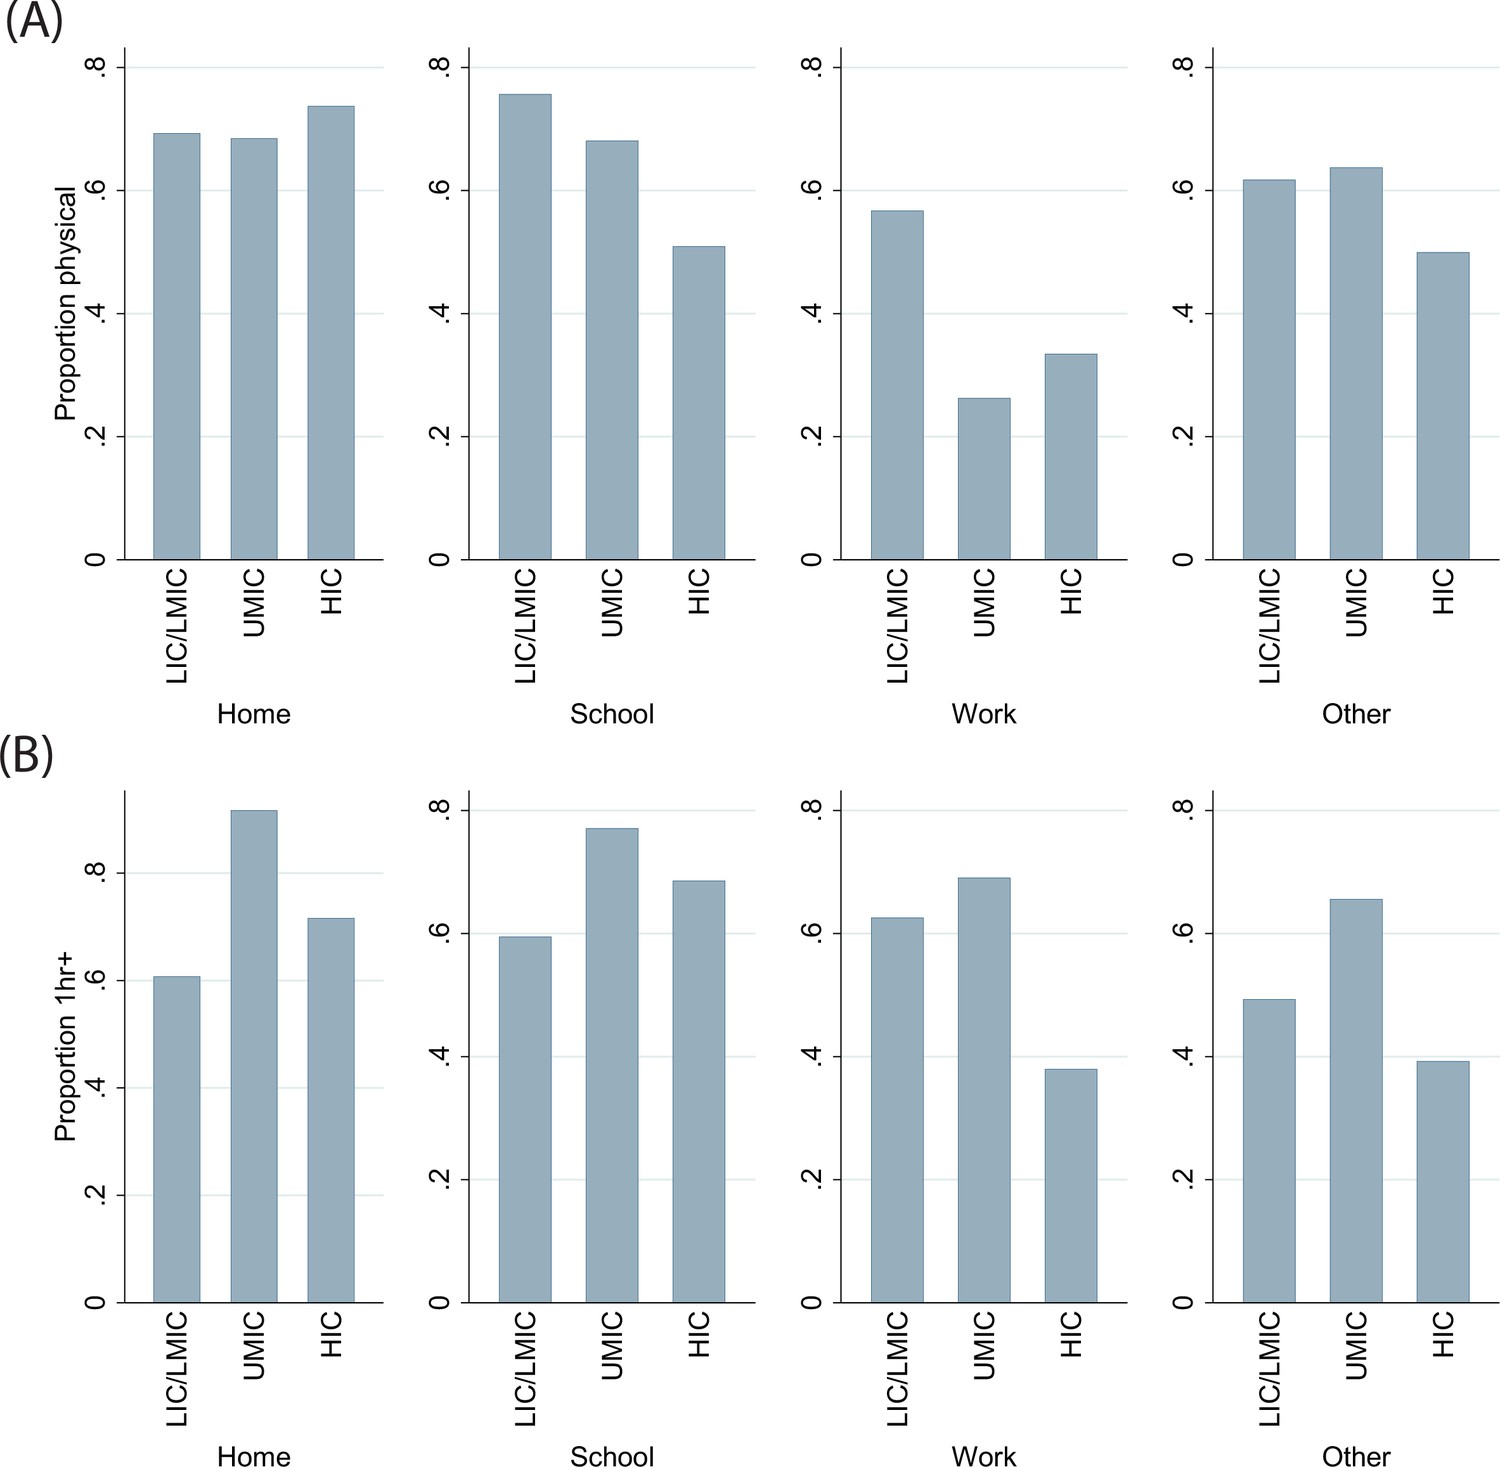
Contact location and (A) type of contacts and (B) duration of contact, by income group.
Appendix 2—figure 7
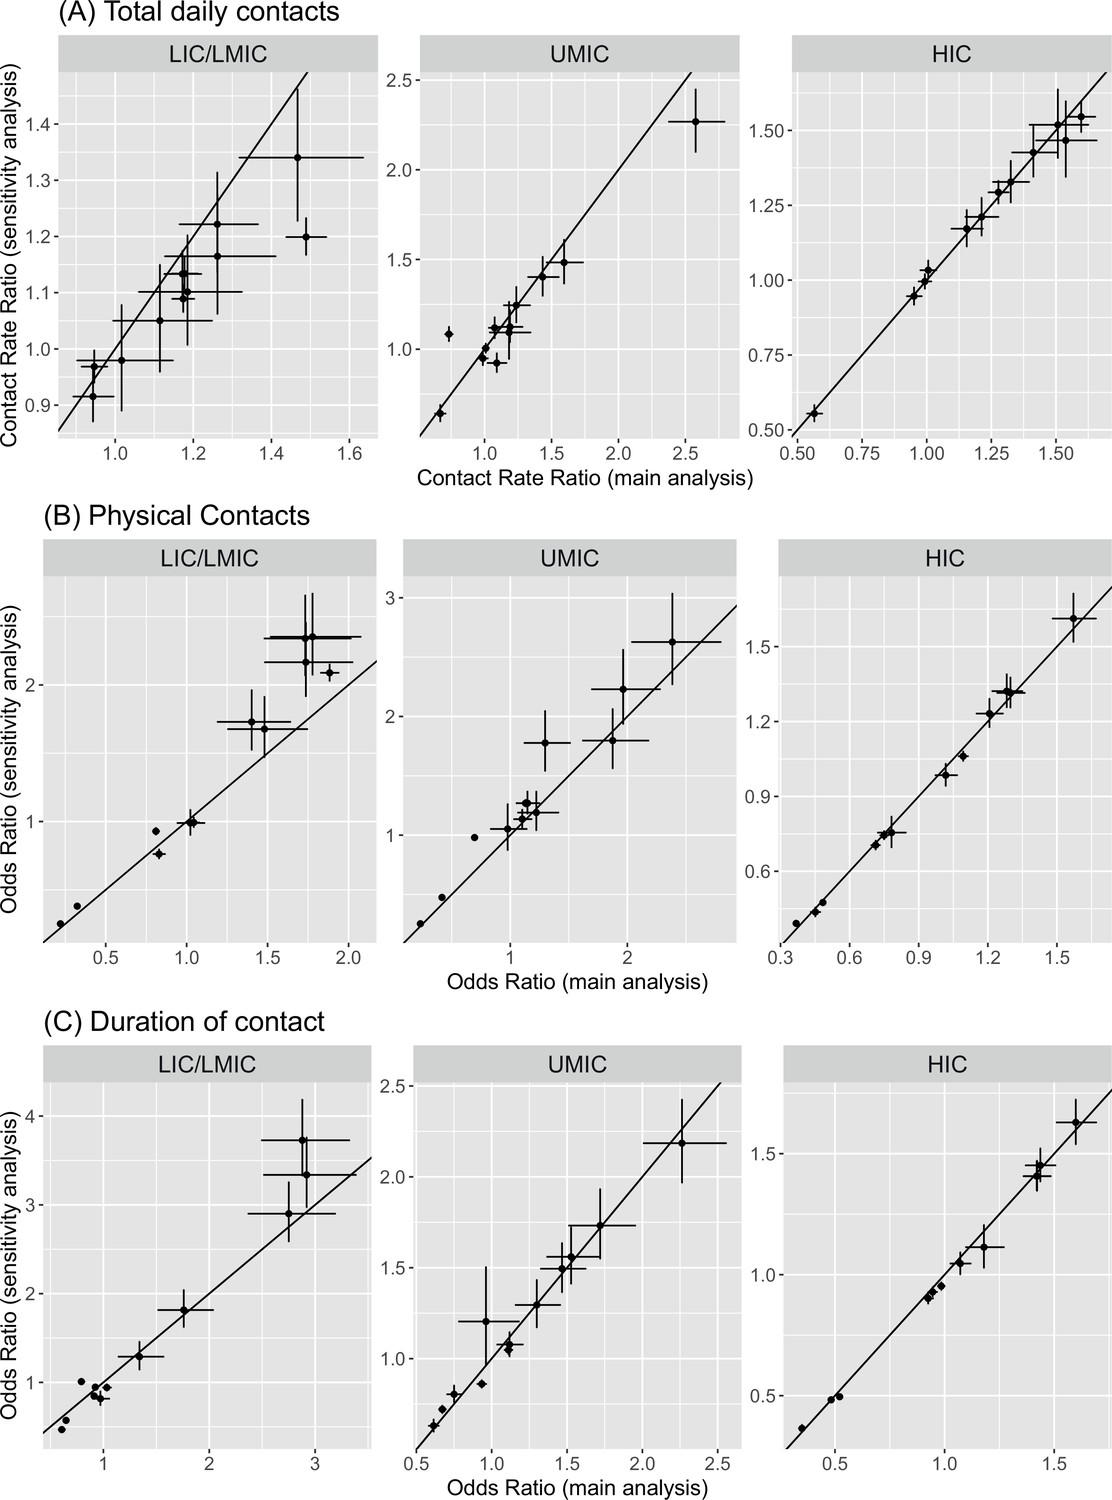
Comparison of estimated regression coefficients in the main analysis and sensitivity analysis weighing each study equally within an income group.
Tables
Table 1
Summary table of total daily contacts.
The total number of observations, as well as the mean, median, and interquartile range (p25 and p75) of total daily contacts shown by participant and study characteristics.
| N | Mean | p25 | Median | p75 | |||||
|---|---|---|---|---|---|---|---|---|---|
| Overall | 28,503 | 14.5 | 5 | 9 | 17 | ||||
| Gender | Male | 13,218 | 15.3 | 5 | 9 | 18 | |||
| Female | 14,598 | 13.7 | 5 | 9 | 16 | ||||
| Age | <15 | 8,561 | 14.6 | 6 | 10 | 19 | |||
| 15–65 | 17,841 | 14.9 | 5 | 9 | 17 | ||||
| >65 | 2,047 | 10.4 | 3 | 6 | 12 | ||||
| Income status | LIC/LMIC | 9,906 | 15.4 | 5 | 10 | 17 | |||
| UMIC | 8,330 | 14.4 | 5 | 8 | 16 | ||||
| HIC | 10,267 | 13.7 | 5 | 9 | 17 | ||||
| Survey Methodology | Diary | 12,226 | 13.9 | 6 | 10 | 18 | |||
| Interview/survey | 16,227 | 15.0 | 4 | 8 | 16 | ||||
| Day type | Weekend | 4,308 | 14.7 | 5 | 9 | 16 | |||
| Weekday | 21,579 | 14.1 | 5 | 9 | 17 | ||||
| Employment | Yes | 8,879 | 15.4 | 5 | 9 | 17 | |||
| (in those aged > 18) | No | 6,158 | 9.8 | 4 | 7 | 12 | |||
| Student | Yes | 4,438 | 18.4 | 8 | 14 | 24 | |||
| (in those aged 5–18) | No | 600 | 10.4 | 5 | 8 | 14 | |||
| Household size | 1 | 1,479 | 10.4 | 3 | 6 | 12 | |||
| 2 | 3,220 | 11.8 | 4 | 7 | 14 | ||||
| 3 | 4,130 | 12.0 | 4 | 7 | 14 | ||||
| 4 | 5,240 | 13.4 | 5 | 8 | 17 | ||||
| 5 | 3,109 | 12.5 | 4 | 8 | 14 | ||||
| 6+ | 8,873 | 17.7 | 7 | 11 | 20 | ||||
| Study | Belgium | Mossong | 750 | 11.8 | 5 | 9 | 15 | ||
| China | Read | 1,821 | 18.6 | 7 | 13 | 22 | |||
| China | Zhang | 965 | 18.8 | 4 | 10 | 30 | |||
| Fiji | Neal | 2,019 | 6.4 | 4 | 6 | 8 | |||
| Finland | Mossong | 1,006 | 11.1 | 5 | 9 | 15 | |||
| Germany | Mossong | 1,341 | 7.9 | 4 | 6 | 10 | |||
| Hong Kong | Kwok et al., 2014 | 762 | 18.3 | 5 | 9 | 18 | |||
| Hong Kong | Kwok et al., 2018 | 1,066 | 11.9 | 3 | 7 | 13 | |||
| Hong Kong | Leung | 1,149 | 14.4 | 3 | 7 | 15 | |||
| India | Kumar | 2,943 | 27.0 | 12 | 17 | 26 | |||
| Italy | Mossong | 849 | 19.8 | 10 | 17 | 27 | |||
| Kenya | Kiti | 568 | 17.7 | 10 | 15 | 23 | |||
| Luxembourg | Mossong | 1,051 | 17.5 | 8 | 14 | 24 | |||
| The Netherlands | Mossong | 269 | 13.9 | 6 | 11 | 19 | |||
| Peru | Grijalva | 588 | 15.3 | 8 | 12 | 20 | |||
| Poland | Mossong | 1,012 | 16.3 | 7 | 13 | 22.5 | |||
| Russia | Ajelli | 502 | 18.0 | 6 | 11 | 19 | |||
| South Africa | Dodd | 1,276 | 5.2 | 4 | 5 | 7 | |||
| South Africa | Wood | 571 | 15.6 | 9 | 14 | 20 | |||
| Senegal | Potter | 1,417 | 19.7 | 10 | 15 | 25 | |||
| Thailand | Mahikul | 369 | 22.6 | 13 | 20 | 31 | |||
| Thailand | Stein | 219 | 58.5 | 15 | 24 | 55 | |||
| Uganda | Le Polain de Waroux | 568 | 7.0 | 5 | 7 | 9 | |||
| United Kingdom | Mossong | 1,012 | 11.7 | 6 | 10 | 16 | |||
| Vietnam | Horby | 865 | 7.7 | 5 | 7 | 9 | |||
| Zambia | Dodd | 2,300 | 4.8 | 3 | 4 | 6 | |||
| Zimbabwe | Melegaro | 1,245 | 10.7 | 6 | 9 | 14 | |||
Appendix 2—table 1
Correlation (Pearson’s rho) between coefficients estimated in the main analysis and those from the sensitivity analysis weighing each study equally within an income group.
| Income group | Pearson’s rho correlation coefficient | |
|---|---|---|
| Total daily contacts | LIC/LMIC | 0.927 |
| UMIC | 0.962 | |
| HIC | 0.996 | |
| Duration of contacts | LIC/LMIC | 0.987 |
| UMIC | 0.984 | |
| HIC | 0.998 | |
| Physical contacts | LIC/LMIC | 0.977 |
| UMIC | 0.974 | |
| HIC | 0.998 |
Appendix 2—table 2
Assortativity by age and sex, weighing by study sample size (method A).
| Age category | Gender | |||||||
|---|---|---|---|---|---|---|---|---|
| LIC/LMIC | ||||||||
| Contact age | Contact gender | |||||||
| 1 | 2 | 3 | Male | Female | ||||
| Participant age | 1 | 0.47 | 0.41 | 0.12 | Participant gender | Male | 0.59 | 0.41 |
| 2 | 0.22 | 0.64 | 0.14 | Female | 0.41 | 0.59 | ||
| 3 | 0.20 | 0.51 | 0.29 | |||||
| UMIC | ||||||||
| Contact age | Contact gender | |||||||
| 1 | 2 | 3 | Male | Female | ||||
| Participant age | 1 | 0.34 | 0.51 | 0.15 | Participant gender | Male | 0.52 | 0.48 |
| 2 | 0.20 | 0.62 | 0.17 | Female | 0.46 | 0.54 | ||
| 3 | 0.14 | 0.41 | 0.45 | |||||
| HIC | ||||||||
| Contact age | Contact gender | |||||||
| 1 | 2 | 3 | Male | Female | ||||
| Participant age | 1 | 0.55 | 0.31 | 0.14 | Participant gender | Male | 0.51 | 0.49 |
| 2 | 0.24 | 0.53 | 0.23 | Female | 0.42 | 0.58 | ||
| 3 | 0.15 | 0.33 | 0.51 | |||||
Appendix 2—table 3
Assortativity by age and sex, weighing each study equally (method B).
| LIC/LMIC | ||||||||
| Contact age | Contact gender | |||||||
| 1 | 2 | 3 | Male | Female | ||||
| Participant age | 1 | 0.48 | 0.41 | 0.11 | Participant gender | Male | 0.55 | 0.45 |
| 2 | 0.27 | 0.60 | 0.13 | Female | 0.42 | 0.58 | ||
| 3 | 0.21 | 0.51 | 0.28 | |||||
| UMIC | ||||||||
| Contact age | Contact gender | |||||||
| 1 | 2 | 3 | Male | Female | ||||
| Participant age | 1 | 0.38 | 0.46 | 0.16 | Participant gender | Male | 0.54 | 0.46 |
| 2 | 0.21 | 0.61 | 0.18 | Female | 0.44 | 0.56 | ||
| 3 | 0.18 | 0.50 | 0.32 | |||||
| HIC | ||||||||
| Contact age | Contact gender | |||||||
| 1 | 2 | 3 | Male | Female | ||||
| Participant age | 1 | 0.54 | 0.31 | 0.14 | Participant gender | Male | 0.51 | 0.49 |
| 2 | 0.27 | 0.51 | 0.22 | Female | 0.42 | 0.58 | ||
| 3 | 0.21 | 0.31 | 0.48 | |||||
Additional files
-
Transparent reporting form
- https://cdn.elifesciences.org/articles/70294/elife-70294-transrepform1-v2.pdf
-
Supplementary file 1
Search string.
- https://cdn.elifesciences.org/articles/70294/elife-70294-supp1-v2.docx
-
Supplementary file 2
Preferred Reporting Items for Systematic Reviews and Meta-Analyses (PRISMA)-individual participant data (IPD) checklist of items to include when reporting a systematic review and meta-analysis of IPD.
- https://cdn.elifesciences.org/articles/70294/elife-70294-supp2-v2.docx
-
Supplementary file 3
Risk of bias table (AXIS critical appraisal tool).
- https://cdn.elifesciences.org/articles/70294/elife-70294-supp3-v2.xlsx
-
Supplementary file 4
Study additional Information and data assumptions.
- https://cdn.elifesciences.org/articles/70294/elife-70294-supp4-v2.docx
-
Supplementary file 5
Data dictionary for participant-level data.
- https://cdn.elifesciences.org/articles/70294/elife-70294-supp5-v2.docx
-
Supplementary file 6
Extraction table of study characteristics.
- https://cdn.elifesciences.org/articles/70294/elife-70294-supp6-v2.docx
-
Supplementary file 7
Data availability by study.
- https://cdn.elifesciences.org/articles/70294/elife-70294-supp7-v2.docx
Download links
A two-part list of links to download the article, or parts of the article, in various formats.
Downloads (link to download the article as PDF)
Open citations (links to open the citations from this article in various online reference manager services)
Cite this article (links to download the citations from this article in formats compatible with various reference manager tools)
Social contact patterns and implications for infectious disease transmission – a systematic review and meta-analysis of contact surveys
eLife 10:e70294.
https://doi.org/10.7554/eLife.70294


