Partial response electromyography as a marker of action stopping
- Center for Lifespan Changes in Brain and Cognition, Department of Psychology, University of Oslo, Norway
- Cognitive and Translational Neuroscience Cluster, Department of Psychology, University of Oslo, Norway
- Multimodal Imaging and Cognitive Control Lab, Department of Psychology, University of Oslo, Norway
Figures
Box 1—figure 1
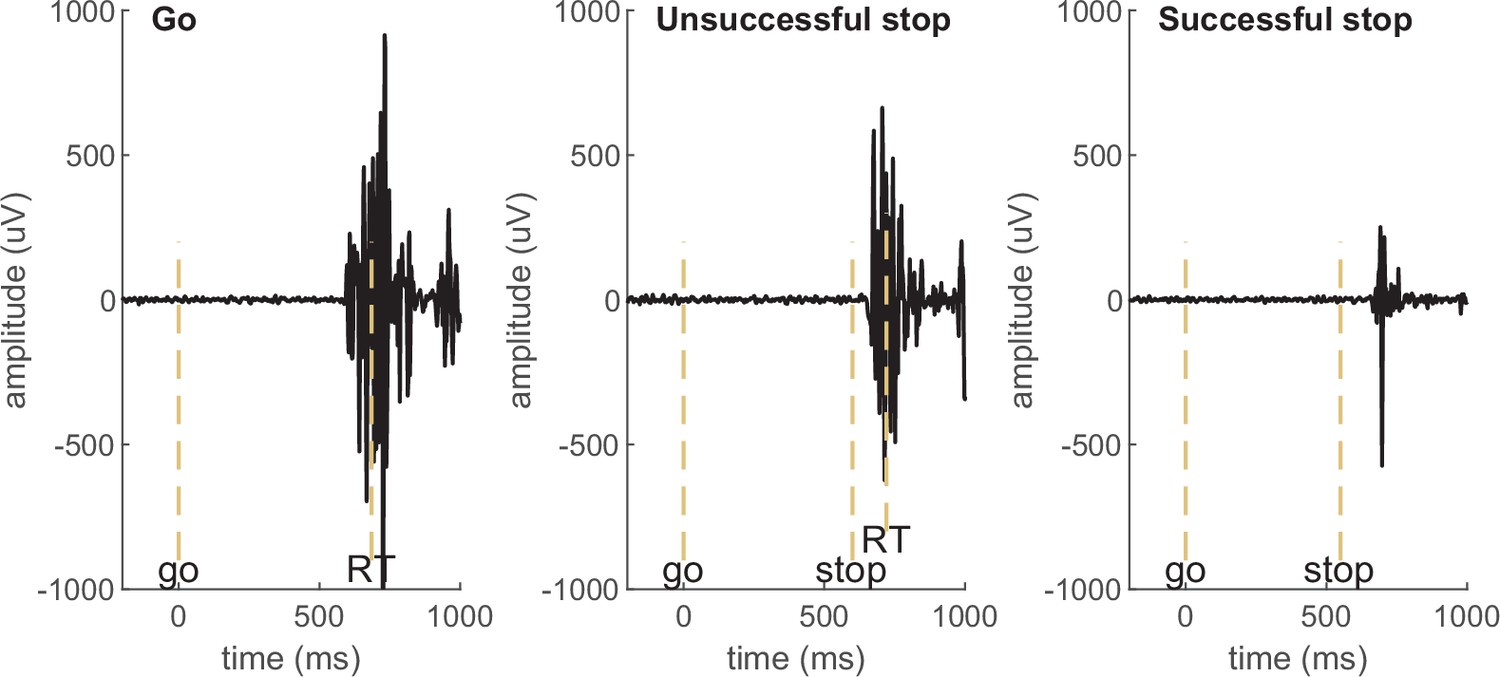
Examples of electromyography (EMG) signals in a go, unsuccessful stop, and successful stop trial in an example participant. EMG in go and unsuccessful stop trials is associated with a button press (marked by RT), while no button press is registered in successful stop trials and the muscle burst therefore qualifies as partial response EMG (prEMG). The dashed vertical lines mark the onset of go signal, stop signal, and the recorded reaction time (RT).
Figure 1
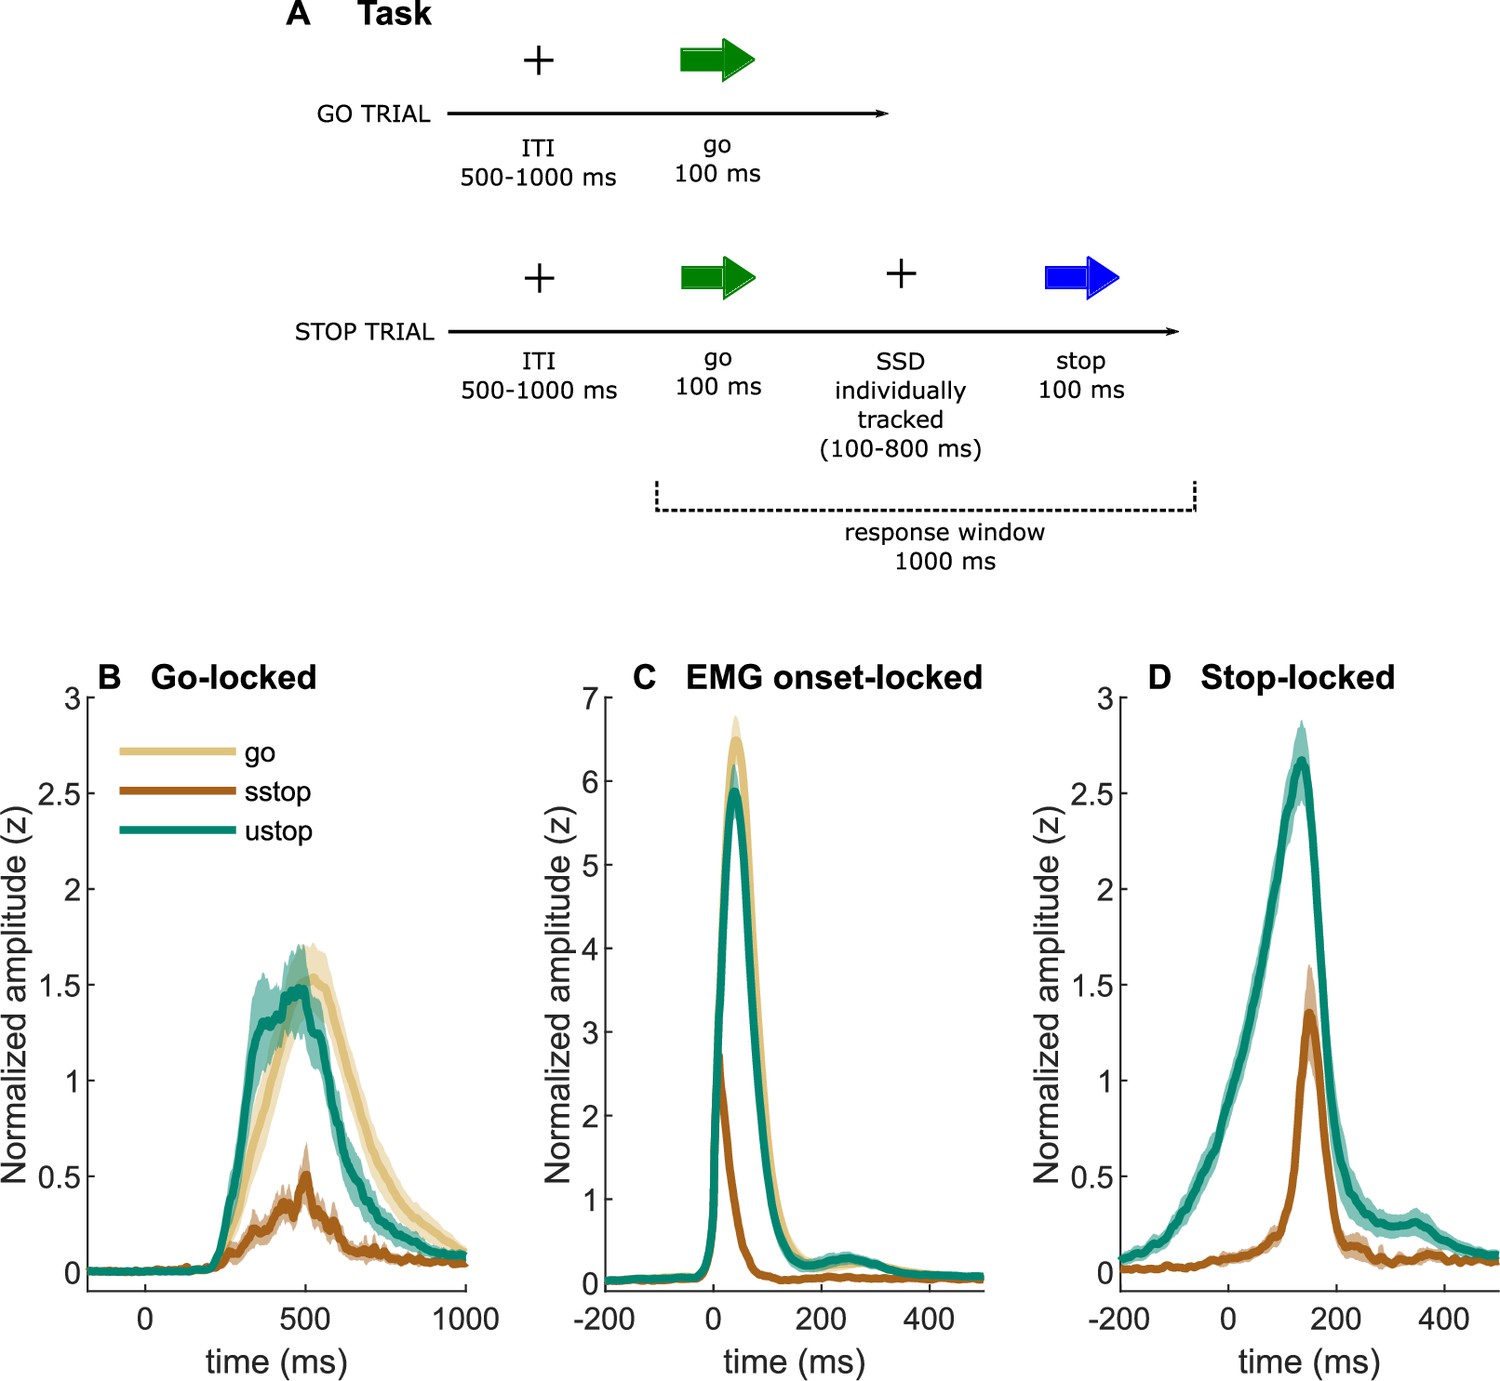
Task description and EMG time-courses.
(A) Task depiction; (B, C) electromyography (EMG) time-courses, time-locked to (A) go signal onset, (B) EMG onset, and (C) stop signal onset. The lines depict averaged activity and the shaded areas depict 95% confidence intervals across participants. sstop – successful stop; ustop – unsuccessful stop.
Box 2—figure 1

(Left panels) Schematics of partial response electromyography (prEMG) peak latency extraction methods on four trials, in which the ‘bumps’ represent rectified and smoothed EMG bursts, and the vertical red lines indicate the extraction points for latencies from the time-courses. In case of several red lines, the final estimate was averaged across the extracted latencies. G and s mark the onset of go and stop signal, respectively, with s also marking the zero time-point. (Right panels) Correlations between the prEMG peak latency and the SSRT, calculated by different methods. The diagonal shows the histograms for each variable together with the density functions, the lower diagonal shows the scatterplots, and the upper diagonal shows the Spearman correlation coefficients. SSRTint – integration method; SSRTbeest – BEESTS method; prEMG_st – extracted from single trials; prEMG_avg – extracted from the average waveform of all trials; prEMG_mode – estimated from the mode SSD.
Figure 2
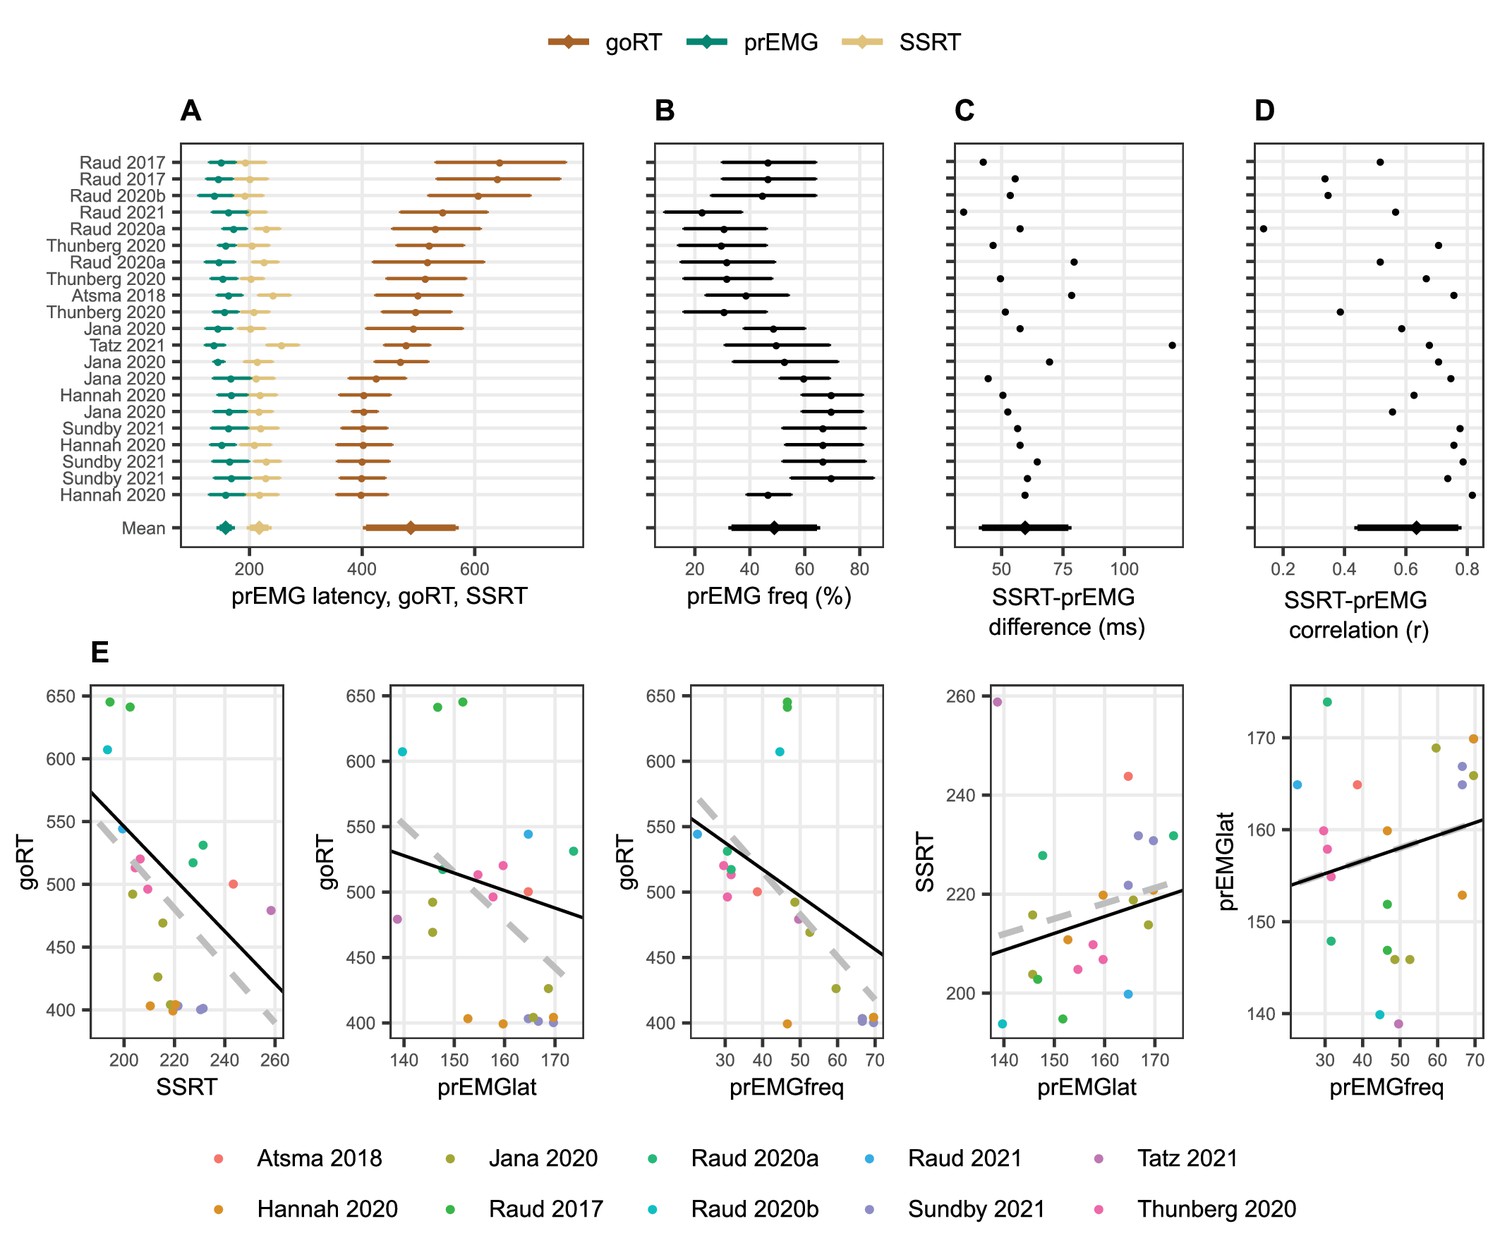
Meta-analysis of studies reporting partial response electromyography (prEMG) in stop signal tasks, which included 21 experiments or conditions reported in 10 independent studies.
(A–D) Means and standard deviations (error bars) of each entry, ordered by go RTs. The error bars around the y-entry ‘Mean’ represent standard deviations across studies. (E) Associations between behavioral and EMG variables across studies. The dots reflect each separate condition/experiment study, color coded by the studies they originate from. The dashed gray lines represent bivariate regression lines, and the solid black lines represent the fixed effects of the general linear mixed model, accounting for the fact that single studies have more than one entry. The regression lines for the stop signal reaction time (SSRT)-prEMGlat plot are calculated excluding the outlier at top left. Note that the entry marked Raud et al., 2021 represent the data from current study.
-
Figure 2—source data 1
Meta-analysis data.
- https://cdn.elifesciences.org/articles/70332/elife-70332-fig2-data1-v2.csv
Figure 3
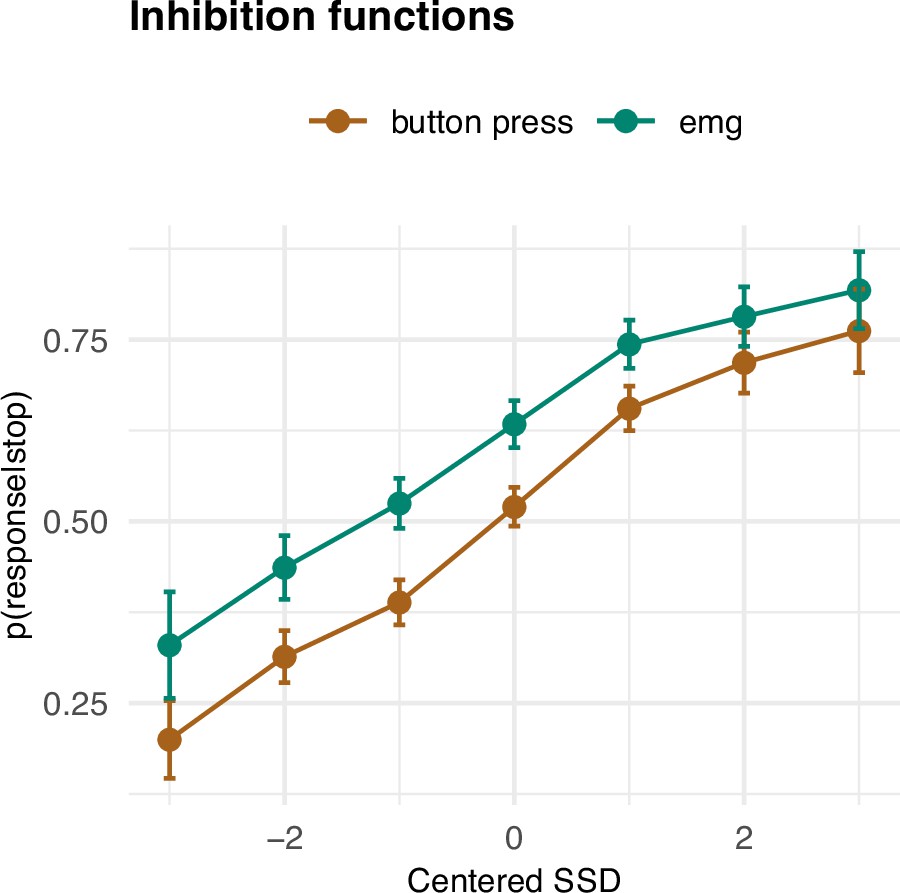
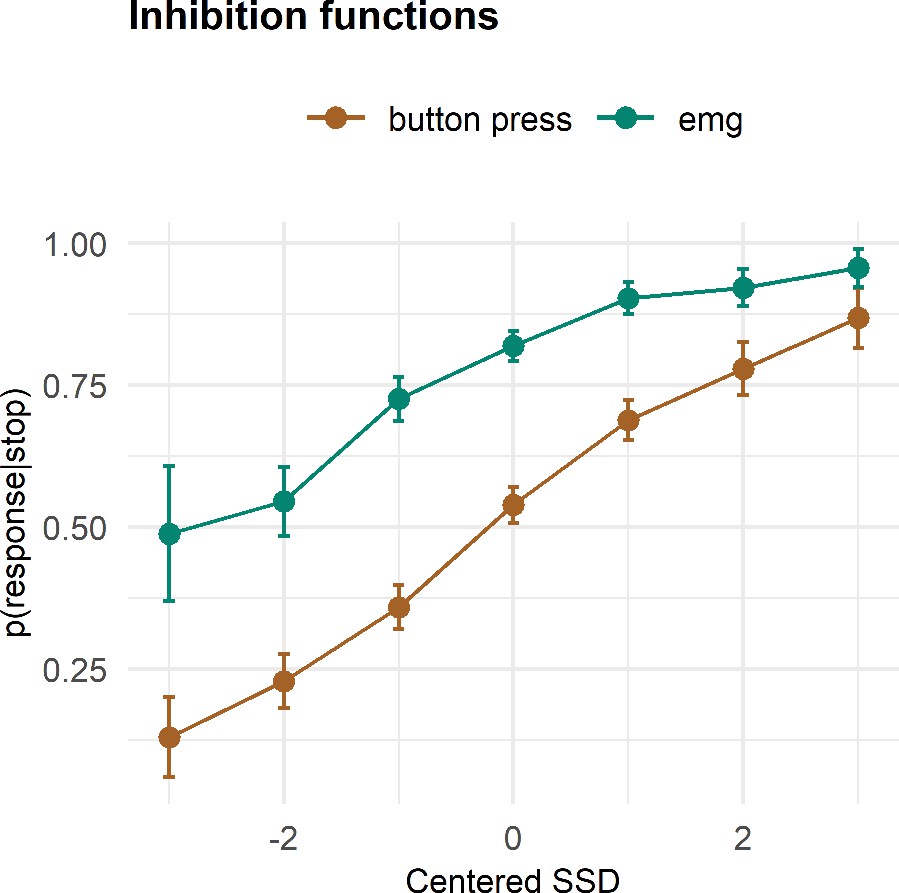
Inhibition functions.
Error bars represent 95% confidence intervals. Note that the error bars are calculated across all trials and participants, ignoring that each participant has several data points.
-
Figure 3—source data 1
Inhibition functions data.
- https://cdn.elifesciences.org/articles/70332/elife-70332-fig3-data1-v2.txt
Figure 4
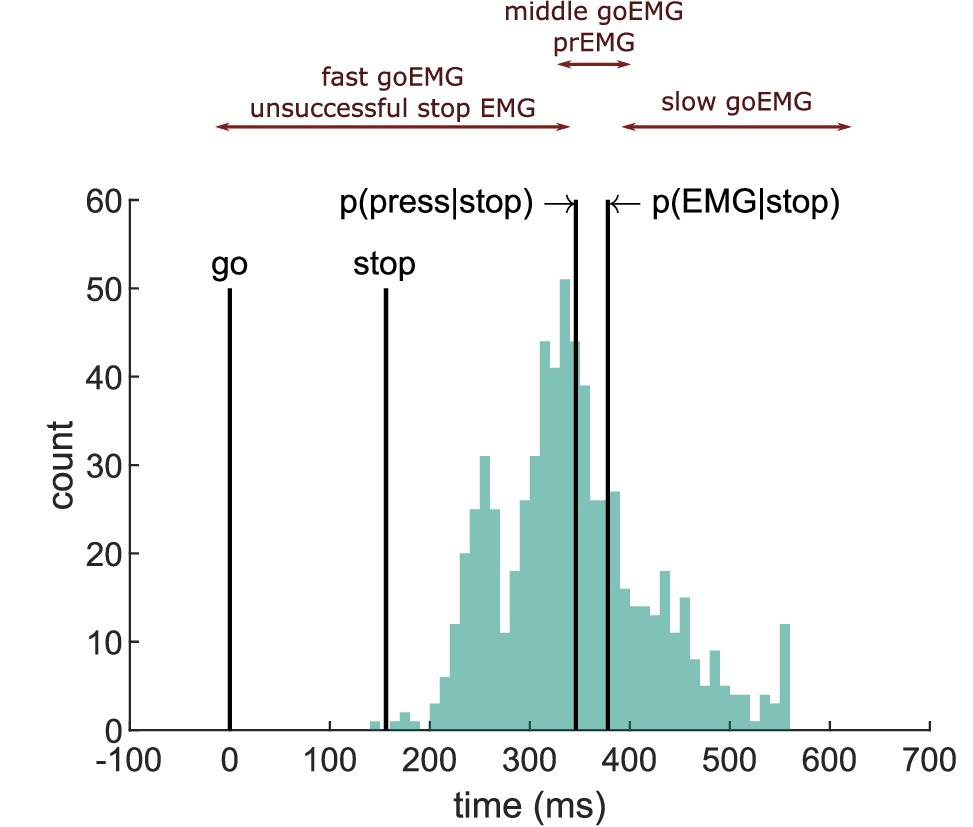
Depiction of the extension of the horse race model on electromyography (EMG) data extracted from an example participant.
The histogram depicts the distribution of EMG onsets in go trials, and the vertical lines mark (from left to right) the go signal onset, stop signal onset (mean stop signal delay [SSD]), percentile corresponding to the probability of producing a response and to the probability of producing EMG in stop trials. Assuming stochastic independence of go and stop trials, unsuccessful stop trials should correspond to the fast go trials (left side of the distribution between go signal and p(press|stop)), while partial response electromyography (prEMG) should correspond to the middle partition of the go distribution in between the p(press|stop) and p(EMG|stop).
Figure 5
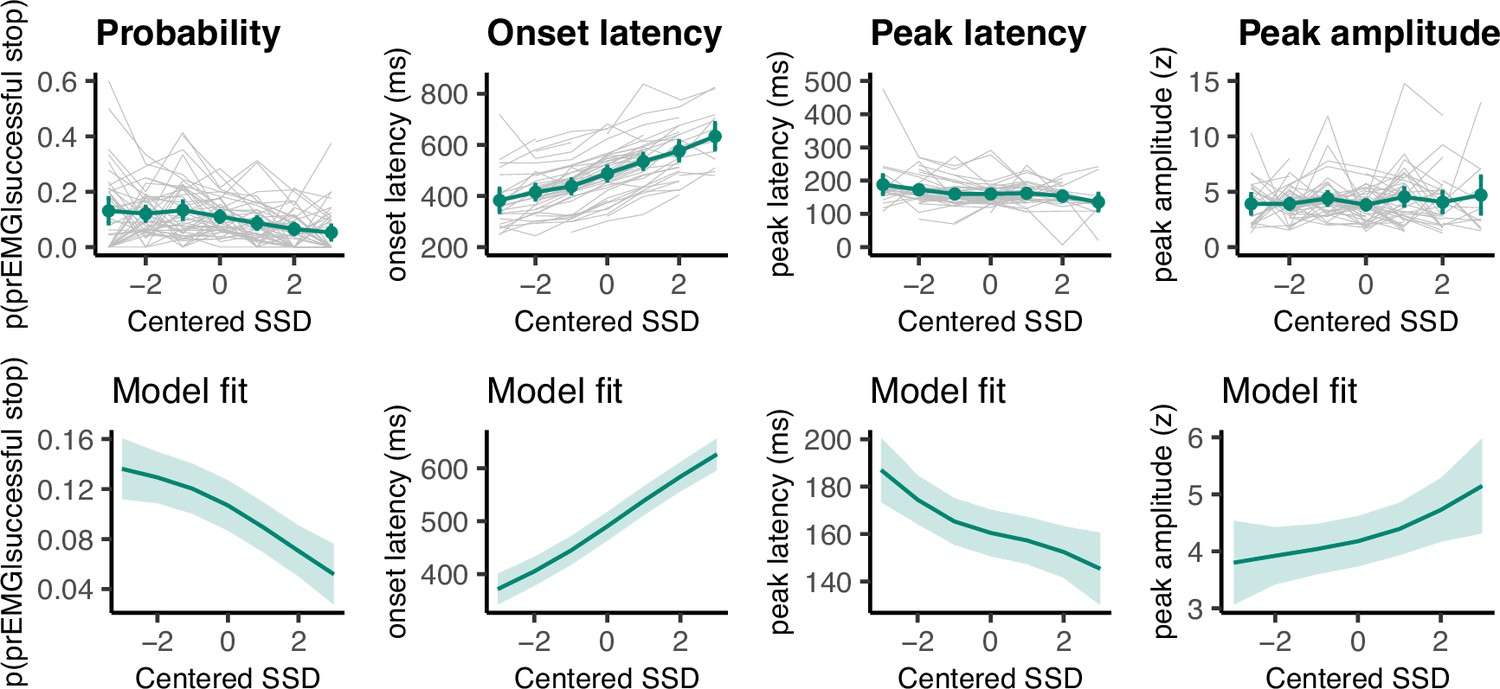
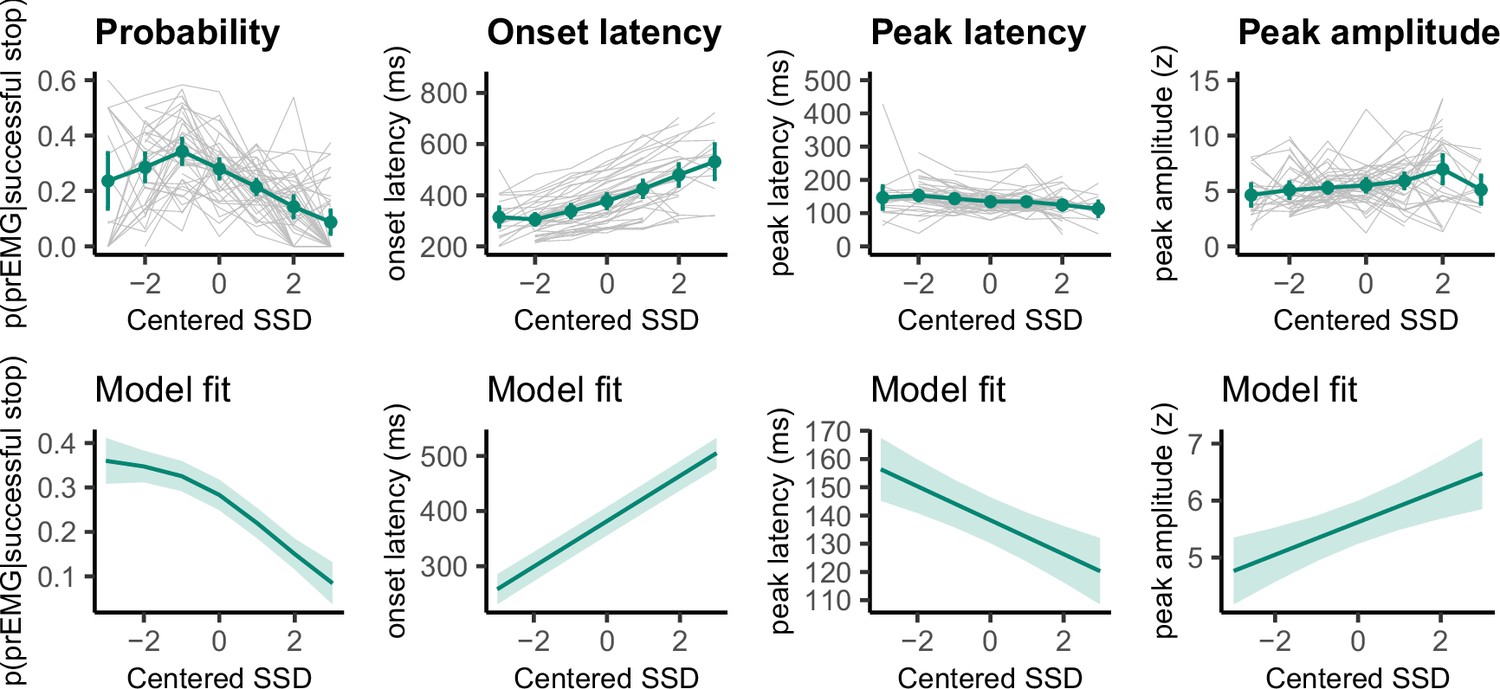
Partial response electromyography (prEMG) probability, onset latency, peak latency, and peak amplitude.
The upper panels represent empirical data across all participants. Green lines represent the group average with 95% confidence intervals and gray lines represent each participant. The lower panels depict the model fit of the generalized additive models with 95% confidence intervals. Note the different y-axes between empirical data and model fits.
-
Figure 5—source data 1
SSD-centered prEMG frquency data.
- https://cdn.elifesciences.org/articles/70332/elife-70332-fig5-data1-v2.txt
-
Figure 5—source data 2
SSD-centered prEMG onset latency data.
- https://cdn.elifesciences.org/articles/70332/elife-70332-fig5-data2-v2.txt
-
Figure 5—source data 3
SSD-centered prEMG peak latency data.
- https://cdn.elifesciences.org/articles/70332/elife-70332-fig5-data3-v2.txt
-
Figure 5—source data 4
SSD-centered prEMG peak amplitude data.
- https://cdn.elifesciences.org/articles/70332/elife-70332-fig5-data4-v2.txt
Figure 6
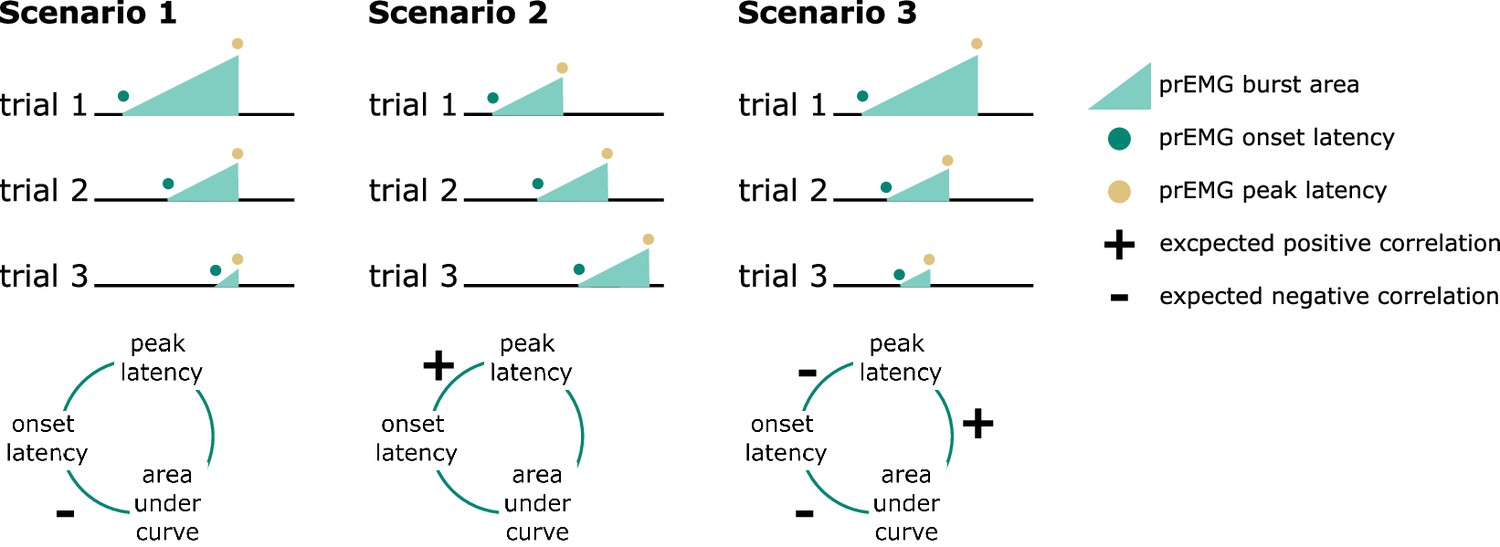
Predicted directions of single-trial correlations between electromyography (EMG) onset latency, peak latency, and area under the curve (calculated as the cumulative sum of point-wise amplitudes from onset to peak latency) under three different scenarios.
Figure 7
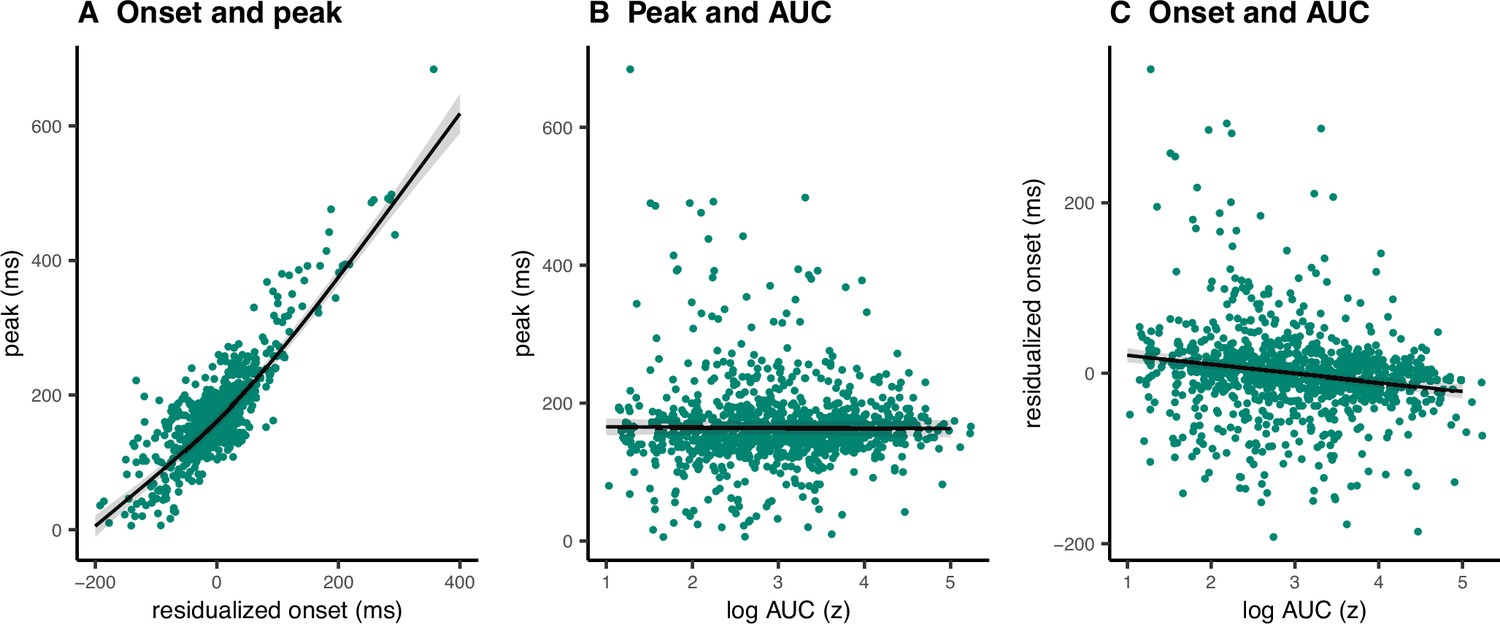
Single-trial associations between partial response electromyography (prEMG) onset latency, peak latency, and area under curve (AUC).
The dots represent single trials from all participants. The black lines represent the fixed effect model fits from generalized additive mixed models, where the individual variability was modeled as separate intercepts for each participant. The shaded areas represent 95% confidence intervals.
-
Figure 7—source data 1
prEMG single trial data.
- https://cdn.elifesciences.org/articles/70332/elife-70332-fig7-data1-v2.csv
Figure 8
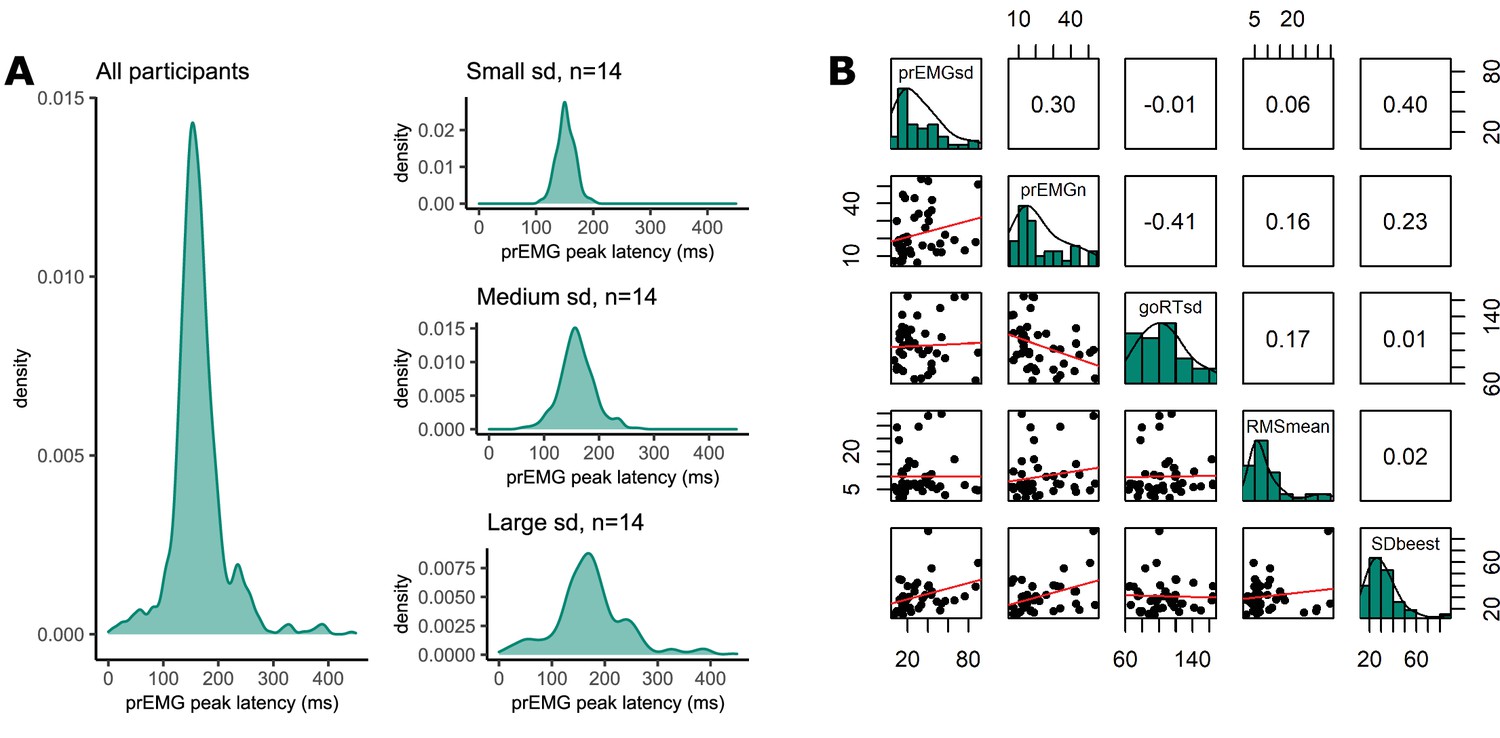
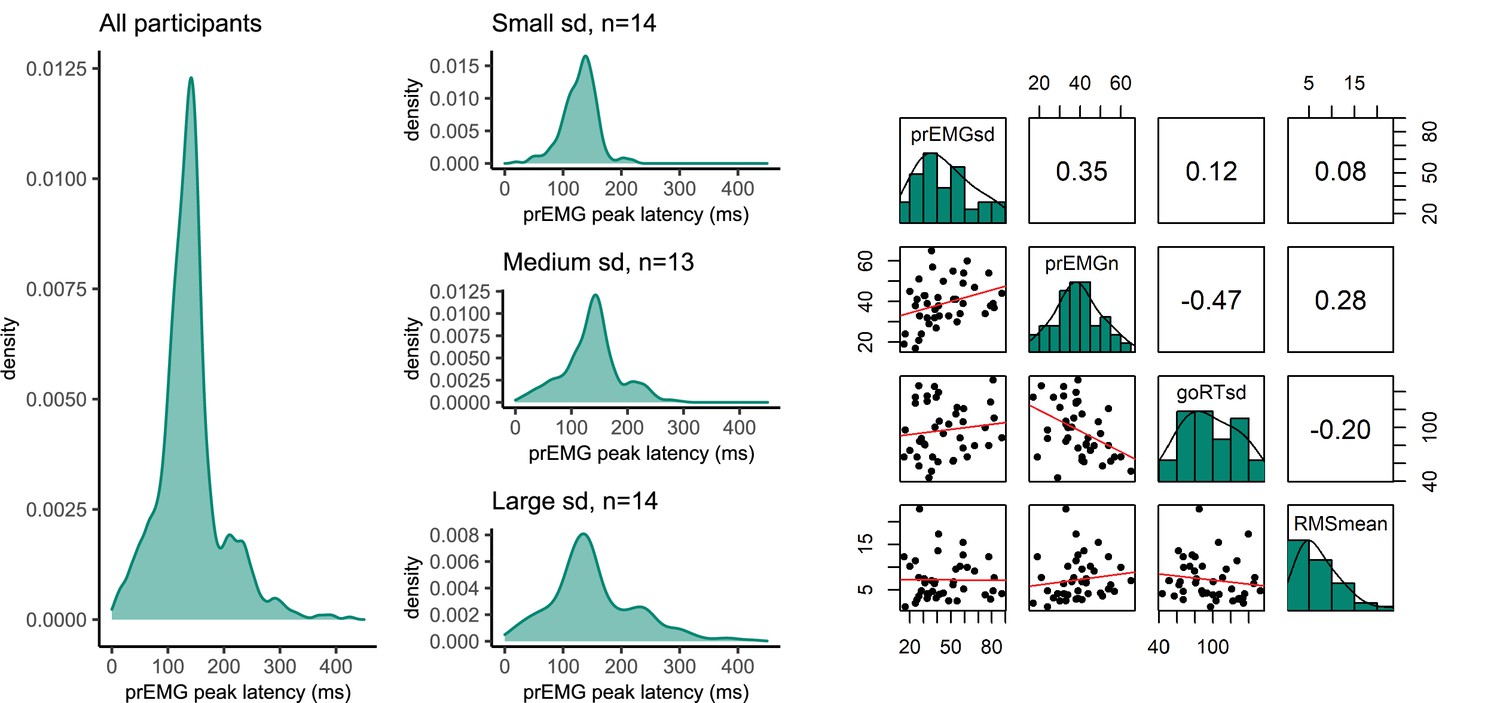
Variability of partial response electromyography (prEMG) peak latency.
(A) Density functions of prEMG peak latency across all trials and participants (left panel) and separately for group of participants with low, medium, and large individual standard deviations (sd; right panels). (B) Correlation matrix between individual prEMG standard deviations (prEMGsd), number of prEMG trials (prEMGn), go reaction time standard deviations (goRTsd), average root mean square EMG amplitudes during the intertrial interval −200 to 0 before go stimulus onset (RMSmean), and standard deviations of the stop signal reaction time (SSRT) calculated through the BEESTS method (SDbeest). The diagonal shows the histograms for each variable together with the density functions, the lower diagonal shows the scatterplots, and the upper diagonal shows the Spearman correlation coefficients. prEMG reliability.
-
Figure 8—source data 1
prEMG variability data.
- https://cdn.elifesciences.org/articles/70332/elife-70332-fig8-data1-v2.csv
Figure 9
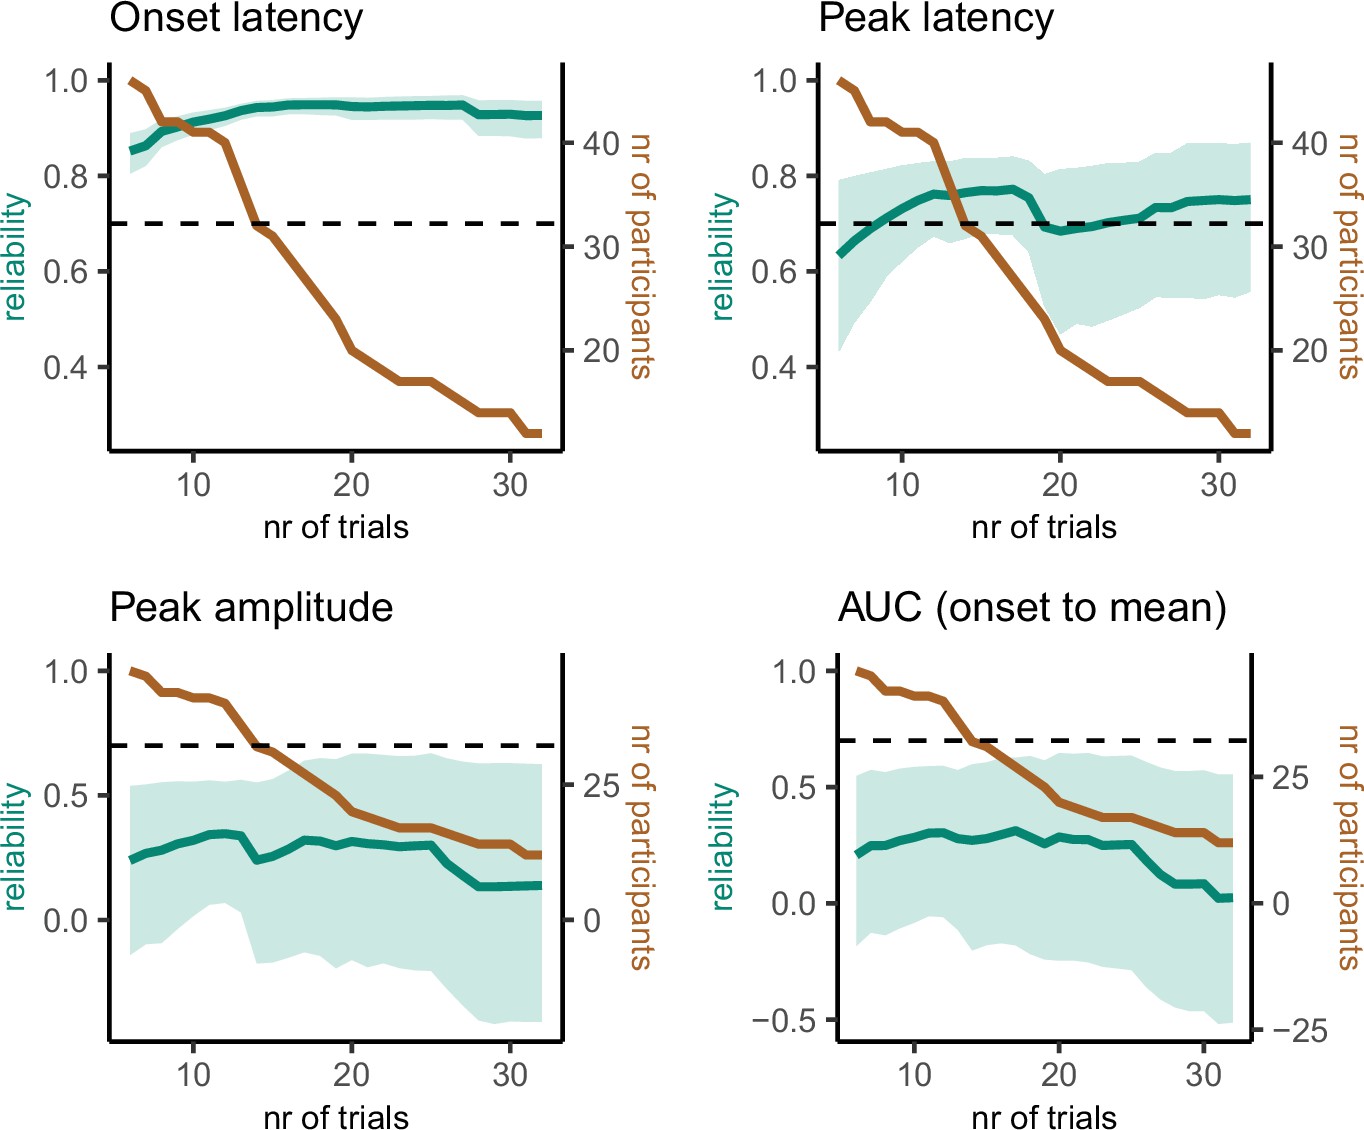
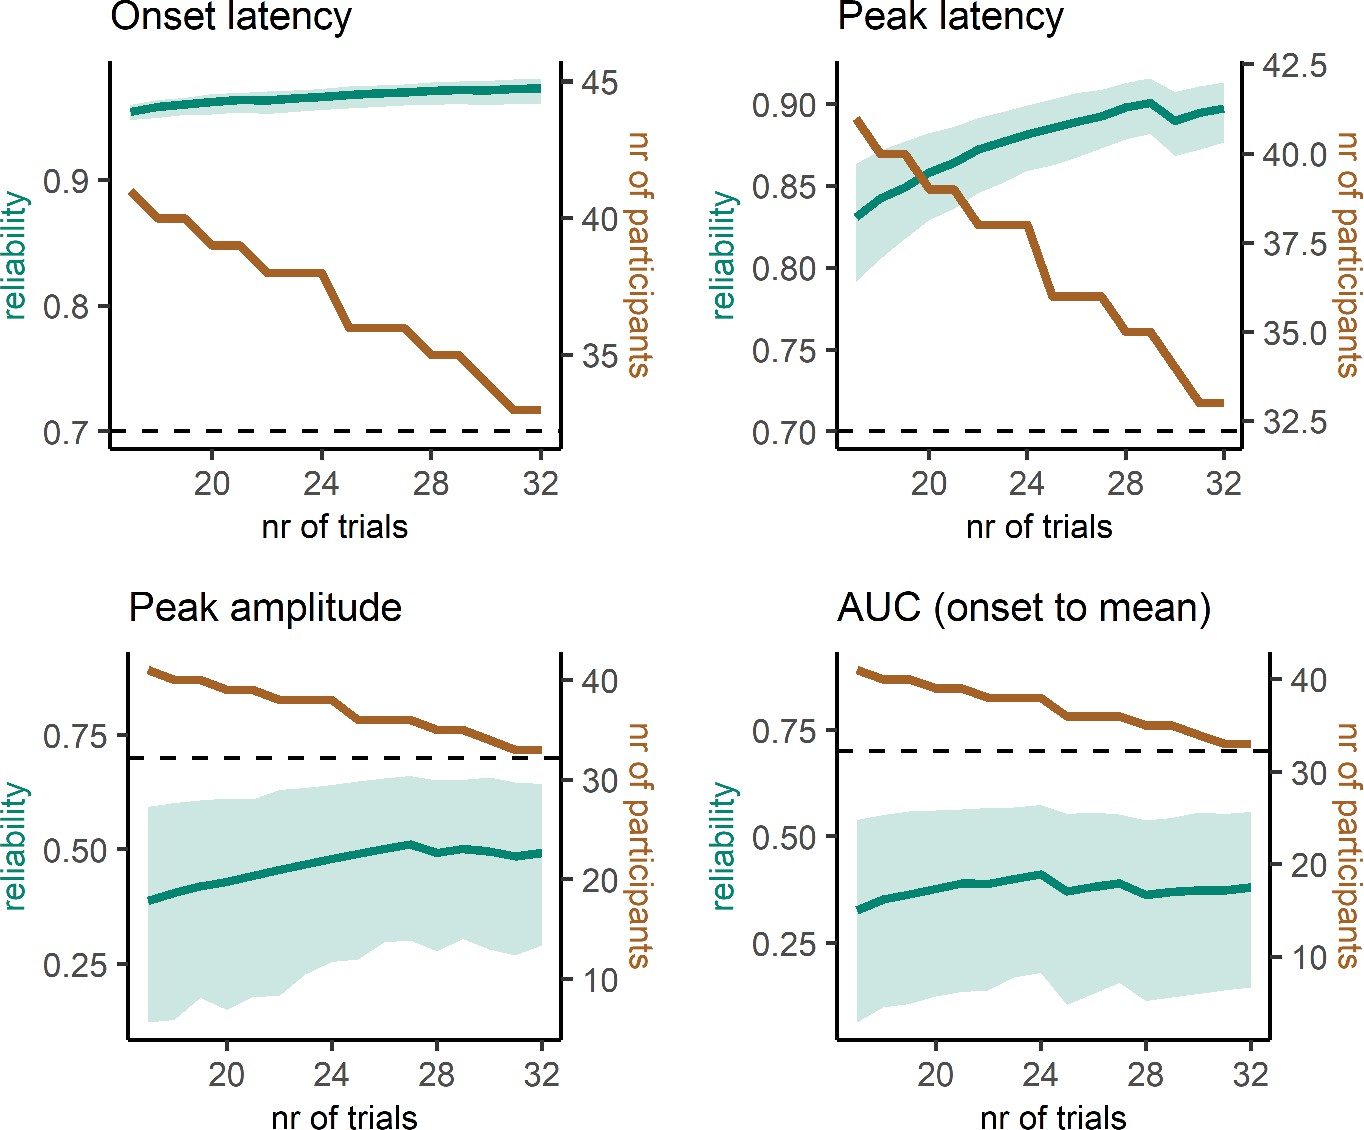
Reliability estimates as a function of number of trials (green) and number of participants (brown) for partial response electromyography (prEMG) latency- and amplitude-based measures.
Green shaded areas represent 95% confidence intervals for the reliability estimates, and the black dashed horizontal line represent a reliability value of 0.7 for reference. Note the different y-axes for latency and amplitude measures. AUC = area under the curve from prEMG onset to peak.
-
Figure 9—source data 1
prEMG reliability data.
- https://cdn.elifesciences.org/articles/70332/elife-70332-fig9-data1-v2.txt
Appendix 1—figure 1
Inhibition functions.
Error bars represent 95% confidence intervals. Note that the error bars are calculated across all trials and participants, ignoring that each participant has several data points.
Appendix 1—figure 2
Partial response electromyography (prEMG) probability, onset latency, peak latency, and peak amplitude.
The upper panels represent empirical data across all participants. Green lines represent the group average with 95% confidence intervals and gray lines represent each participant. The lower panels depict the model fit of the generalized additive models with 95% confidence intervals. Note the different y-axes between empirical data and model fits.
Appendix 1—figure 3
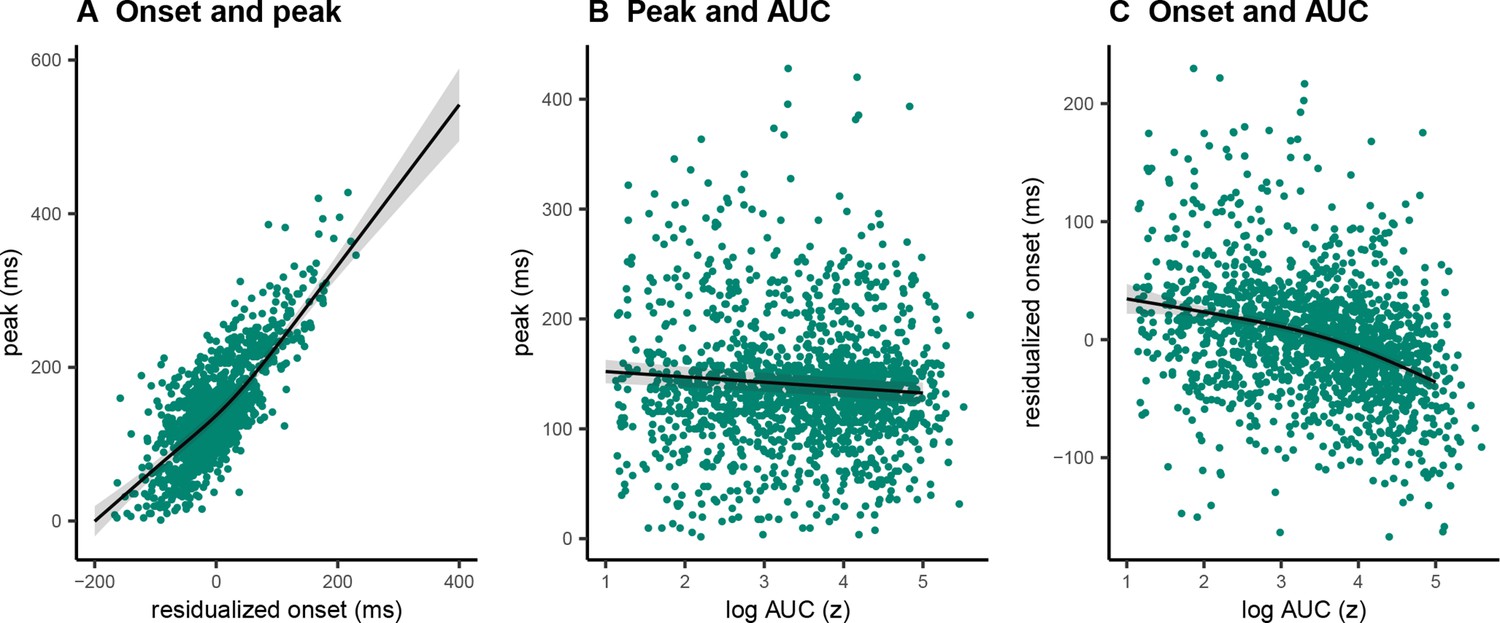
Single-trial associations between partial response electromyography (prEMG) onset latency, peak latency, and area under curve (AUC).
The dots represent single trials from all participants. The black lines represent the fixed effect model fits from generalized additive mixed models, where the individual variability was modeled as separate intercepts for each participant. The shaded areas represent 95% confidence intervals.
Appendix 1—figure 4
Variability of partial response electromyography (prEMG) peak latency.
Left: density functions of prEMG peak latency across all trials and participants (left panel) and separately for group of participants with low, medium, and large individual standard deviations (sd; right panels). Right: correlation matrix between individual prEMG standard deviations (prEMGsd), number of prEMG trials (prEMGn), go reaction time standard deviations (goRTsd), average root mean square EMG amplitudes during the intertrial interval −200 to 0 before go stimulus onset (RMSmean). The diagonal shows the histograms for each variable together with the density functions, the lower diagonal shows the scatterplots, and the upper diagonal shows the Spearman correlation coefficients.
Appendix 1—figure 5
Reliability estimates as a function of number of trials (green) and number of participants (brown) for partial response electromyography (prEMG) latency- and amplitude-based measures.
Green shaded areas represent 95% confidence intervals for the reliability estimates, and the black dashed horizontal line represent a reliability value of 0.7 for reference. Note the different y-axes for latency and amplitude measures. AUC = area under the curve from prEMG onset to peak.
Appendix 2—figure 1
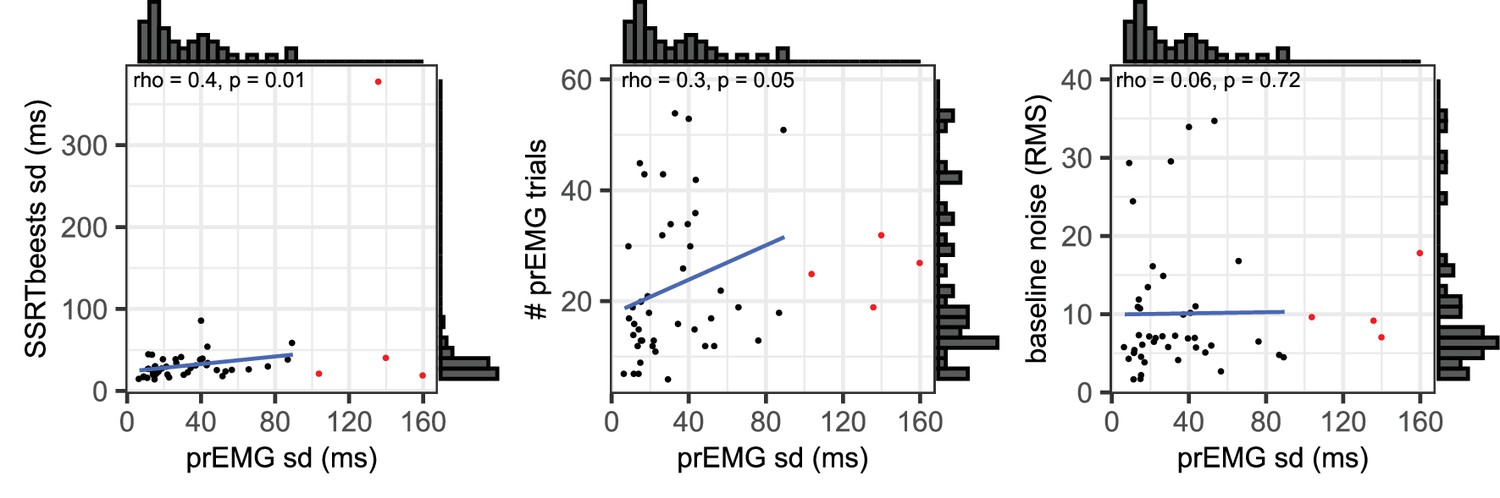
Scatterplots and histograms for the associations of the partial response electromyography (prEMG) peak latency standard deviations with stop signal reaction time (SSRT) standard deviations derived from BEESTS (left panel), number of prEMG trials (middle panel), and baseline EMG noise (right panel).
The red dots represent outliers, while the histograms, rho/p values, and blue regression lines are calculated after excluding the outliers.
Author response image 1
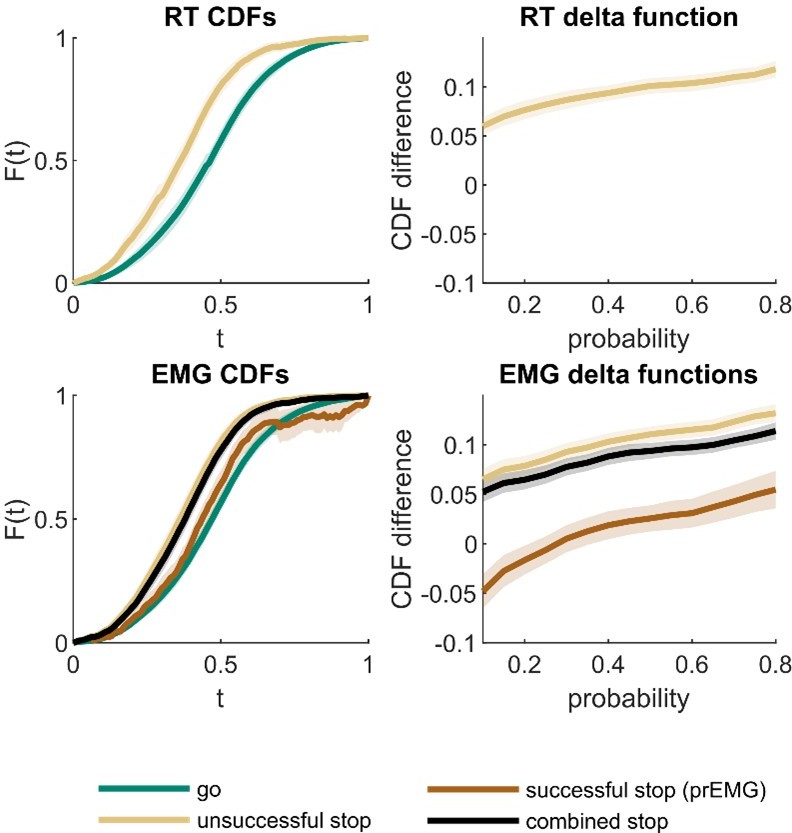
Cumulative density functions (CDFs) and delta function for reaction time (RT; upper panels) and EMG data (lower panels).
X-axis (t) in CDF plots represents normalized response times, and the y-axis (F(t)) represents probability of obtaining a response time faster or equal to t. The delta functions represent the horizontal difference between the go and stop trial CDFs as a function of cumulative probability. The combined stop variables include unsuccessful and successful stop trials with prEMG. The shaded areas represent 95% confidence intervals across participants. Note that successful stop (prEMG) CDF (lower left panel) is likely inaccurate at high t’s, due to very few available trials with slow EMG onsets.
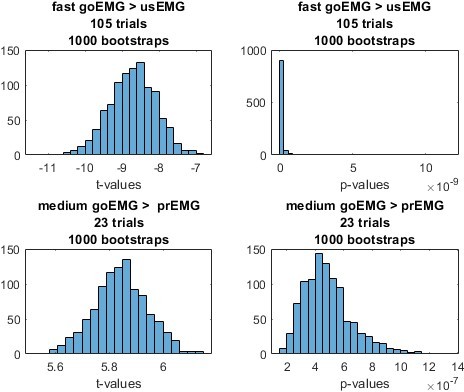
Author response image 2
Tables
Table 1
Behavioral and BEESTS parameters summary statistics.
| Mean | sd | Median | min | max | |
|---|---|---|---|---|---|
| Behavior | |||||
| Go accuracy (%) | 97.92 | 2.21 | 98.76 | 91.23 | 100.00 |
| Go errors (%) | 0.69 | 0.88 | 0.37 | 0.00 | 5.12 |
| Go omissions (%) | 1.40 | 1.95 | 0.73 | 0.00 | 8.04 |
| Go RT (ms) | 545.28 | 77.11 | 549.04 | 398.29 | 715.24 |
| SSD (ms) | 347.50 | 97.59 | 349.53 | 155.71 | 551.60 |
| SSRT (ms) | 198.99 | 29.63 | 202.00 | 120.05 | 263.97 |
| Stop accuracy (%) | 49.88 | 1.84 | 50.46 | 43.06 | 54.17 |
| Unsuccessful stop RT (ms) | 480.47 | 70.85 | 496.64 | 351.11 | 671.92 |
| BEESTS parameters | |||||
| Go failures (%) | 1.56 | 2.18 | 0.76 | 0.04 | 9.12 |
| Trigger failures (%) | 1.27 | 1.62 | 0.51 | 0.28 | 8.94 |
| Go RT (mean; ms) | 546.51 | 78.83 | 548.71 | 396.93 | 722.25 |
| Go RT (sd; ms) | 113.52 | 28.97 | 112.25 | 65.57 | 167.46 |
| SSRT (mean; ms) | 201.83 | 21.39 | 200.03 | 166.22 | 248.85 |
| SSRT (sd; ms)* | 30.70 | 13.38 | 27.69 | 14.94 | 86.55 |
-
Table 1—source data 1
Behavioral data.
- https://cdn.elifesciences.org/articles/70332/elife-70332-table1-data1-v2.txt
-
Table 1—source data 2
BEESTS data.
- https://cdn.elifesciences.org/articles/70332/elife-70332-table1-data2-v2.csv
Table 2
Means (and standard deviations in brackets) of the electromyography (EMG) variables.
| Variable | Go | Succ. stop | Unsucc. stop |
|---|---|---|---|
| Count | 655 (25) | 23 (13) | 106 (5) |
| Percentage | 99 (2) | 23 (14) | 98 (2) |
| Onset latency (ms) | 487 (81) | 481 (91) | 422 (74) |
| Peak latency* (ms) | NA (NA) | 165 (31) | 99 (37) |
| Peak amplitude (z) | 12 (1) | 4 (1) | 11 (1) |
| Motor time (ms) | 57 (13) | NA (NA) | 58 (14) |
| Rise time (ms) | 52 (10) | 19 (5) | 48 (9) |
| AUC (z) | 142 (18) | 31 (12) | 125 (16) |
-
Table 2—source data 1
EMG summary data.
- https://cdn.elifesciences.org/articles/70332/elife-70332-table2-data1-v2.csv
Table 3
Meta-analysis behavioral and electromyography (EMG) values across 21 different conditions or experiments in 10 independent studies. prEMG = partial response electromyography; SSRT = stop signal reaction time.
| Mean | sd | Median | min | max | |
|---|---|---|---|---|---|
| Go RT (ms) | 486 | 79 | 493 | 400 | 646 |
| SSRT (ms) | 217 | 16 | 216 | 194 | 259 |
| prEMG frequency (%) | 49 | 16 | 47 | 23 | 70 |
| prEMG peak/offset latency (ms) | 158 | 11 | 160 | 139 | 174 |
| SSRT and prEMG latency difference (ms) | 60 | 18 | 57 | 35 | 120 |
Table 4
EMG onsets in go trials divided into fast (between go onset and p(press|stop)), medium (between p(press|stop) and p(EMG|stop)) and slow (> p(EMG|stop)) trials.
| Mean | sd | Median | min | max | |
|---|---|---|---|---|---|
| goEMG_fast | 401 | 67 | 410 | 260 | 555 |
| goEMG_medium | 506 | 80 | 500 | 347 | 678 |
| goEMG_slow | 608 | 108 | 582 | 416 | 844 |
| usEMG | 422 | 74 | 430 | 272 | 596 |
| prEMG | 481 | 91 | 474 | 290 | 701 |
-
Table 4—source data 1
prEMG onset data.
- https://cdn.elifesciences.org/articles/70332/elife-70332-table4-data1-v2.txt
Table 5
Split half reliability estimates for prEMG characteristics, including mean, standard deviation, and percentiles derived from the permutation distributions that correspond to the 95% confidence intervals.
| Mmean | sd | 2.5th | 97.5th | |
|---|---|---|---|---|
| Onset latency (ms) | 0.94 | 0.01 | 0.91 | 0.97 |
| Peak latency (ms) | 0.87 | 0.05 | 0.75 | 0.94 |
| Peak RMS amplitude (z) | 0.51 | 0.13 | 0.22 | 0.71 |
| AUC (z) | 0.48 | 0.11 | 0.24 | 0.68 |
-
Table 5—source data 1
Reliability data.
- https://cdn.elifesciences.org/articles/70332/elife-70332-table5-data1-v2.txt
Key resources table
| Reagent type (species) or resource | Designation | Source or reference | Identifiers | Additional information |
|---|---|---|---|---|
| Software, algorithm | E-prime | Psychology Software Tools, Pittsburgh, PA | Version 2.0 | |
| Software, algorithm | Matlab | The Math Works, Inc MATLAB | 9.4.0.949201 (R2018a) | |
| Software, algorithm | Eeglab | Delorme and Makeig, 2004 | 14.1.1b | |
| Software, algorithm | R | R Core Team, 2019; | 3.6.2 (2019-12-12) | |
| Software, algorithm | BEESTS; Dynamic Models of Choice | Matzke et al., 2019; Matzke et al., 2013 Heathcote et al., 2019 | BEESTS2-GF |
Appendix 1—table 1
Behavioral summary statistics.
RT = reaction time; sd = standard deviation; SSD = stop signal delay; SSRT = stop signal reaction time. N = 41.
| Mean | sd | Median | min | max | |
|---|---|---|---|---|---|
| Behavior | |||||
| Go accuracy (%) | 97.95 | 2.26 | 98.44 | 86.67 | 100.00 |
| Go errors (%) | 0.66 | 1.07 | 0.22 | 0.00 | 5.11 |
| Go omissions (%) | 1.50 | 1.74 | 0.89 | 0.00 | 9.11 |
| Go RT (ms) | 481.28 | 80.33 | 471.67 | 335.16 | 636.69 |
| SSD (ms) | 271.18 | 93.04 | 255.17 | 88.33 | 453.21 |
| SSRT (ms) | 205.96 | 24.06 | 206.21 | 166.43 | 267.54 |
| Stop accuracy (%) | 50.00 | 2.09 | 50.00 | 42.67 | 54.00 |
| Unsuccessful stop RT (ms) | 441.05 | 72.64 | 436.43 | 318.15 | 591.36 |
Appendix 1—table 2
Means (and standard deviations in brackets) of the EMG variables.
Motor time refers to the difference between the EMG onset latency and the reaction time. Rise time refers to the duration of the rising flank of the EMG burst. *Peak latencies are time-locked to the stop signal onset. N = 41.
| Variable | Go | Succ. stop | Unsucc. stop |
|---|---|---|---|
| Count | 430 (15) | 39 (11) | 74 (3) |
| Percentage | 99 (1) | 58 (17) | 99 (2) |
| Onset latency (ms) | 367 (81) | 369 (85) | 316 (67) |
| Peak latency* (ms) | NA (NA) | 140 (27) | 74 (36) |
| Peak amplitude (z) | 11 (1) | 6 (1) | 10 (1) |
| Motor time (ms) | 118 (16) | NA (NA) | 118 (16) |
| Rise time (ms) | 60 (12) | 30 (7) | 57 (11) |
| AUC (z) | 138 (14) | 51 (12) | 124 (15) |
Appendix 1—table 3
EMG onsets in go trials divided into fast (between go onset and p(press|stop)), medium (between p(press|stop), and p(EMG|stop)) and slow (>p(EMG|stop)) trials.
usEMG = unsuccessful stop EMG; prEMG = partial response EMG (successful stop trials).
| Mean | sd | Median | min | max | |
|---|---|---|---|---|---|
| goEMG_fast | 411 | 82 | 412 | 260 | 678 |
| goEMG_medium | 520 | 103 | 503 | 345 | 858 |
| goEMG_slow | 626 | 139 | 584 | 415 | 1,068 |
| usEMG | 431 | 87 | 433 | 272 | 704 |
| prEMG | 496 | 114 | 479 | 290 | 841 |
Appendix 1—table 4
Split-half reliability estimates for partial response electromyography (prEMG) characteristics, including mean, standard deviation, and percentiles derived from the permutation distributions that correspond to the 95% confidence intervals.
RMS = root mean square; AUC = area under the curve from onset to peak.
| Mean | sd | 2.5th | 97.5th | |
|---|---|---|---|---|
| Onset latency (ms) | 0.98 | 0.01 | 0.96 | 0.99 |
| Peak latency (ms) | 0.92 | 0.05 | 0.91 | 0.96 |
| Peak RMS amplitude (z) | 0.59 | 0.11 | 0.32 | 0.77 |
| AUC (z) | 0.53 | 0.12 | 0.27 | 0.73 |
Author response table 1
| Relationship between prEMG standard deviation and … | Original analysis | Revised analysis after outlier removal |
|---|---|---|
| number of prEMG trials | 0.34 | 0.30 |
| baseline EMG (noise) | 0.13 | 0.06 |
| go RT standard deviation | 0.18 | -0.01 |
| BEESTS-SSRT standard deviation | 0.33 | 0.40 |
Additional files
Download links
A two-part list of links to download the article, or parts of the article, in various formats.
Downloads (link to download the article as PDF)
Open citations (links to open the citations from this article in various online reference manager services)
Cite this article (links to download the citations from this article in formats compatible with various reference manager tools)
Partial response electromyography as a marker of action stopping
eLife 11:e70332.
https://doi.org/10.7554/eLife.70332


