The East Asian gut microbiome is distinct from colocalized White subjects and connected to metabolic health
- Department of Microbiology and Immunology, G.W. Hooper Research Foundation, United States
- Diabetes Center, University of California San Francisco, United States
- Division of Endocrinology, Diabetes, and Metabolism, Department of Medicine, University of California San Francisco, United States
- Center for Molecular Toxicology and Carcinogenesis, Department of Veterinary & Biomedical Sciences, Pennsylvania State University, United States
Figures
Figure 1 with 1 supplement
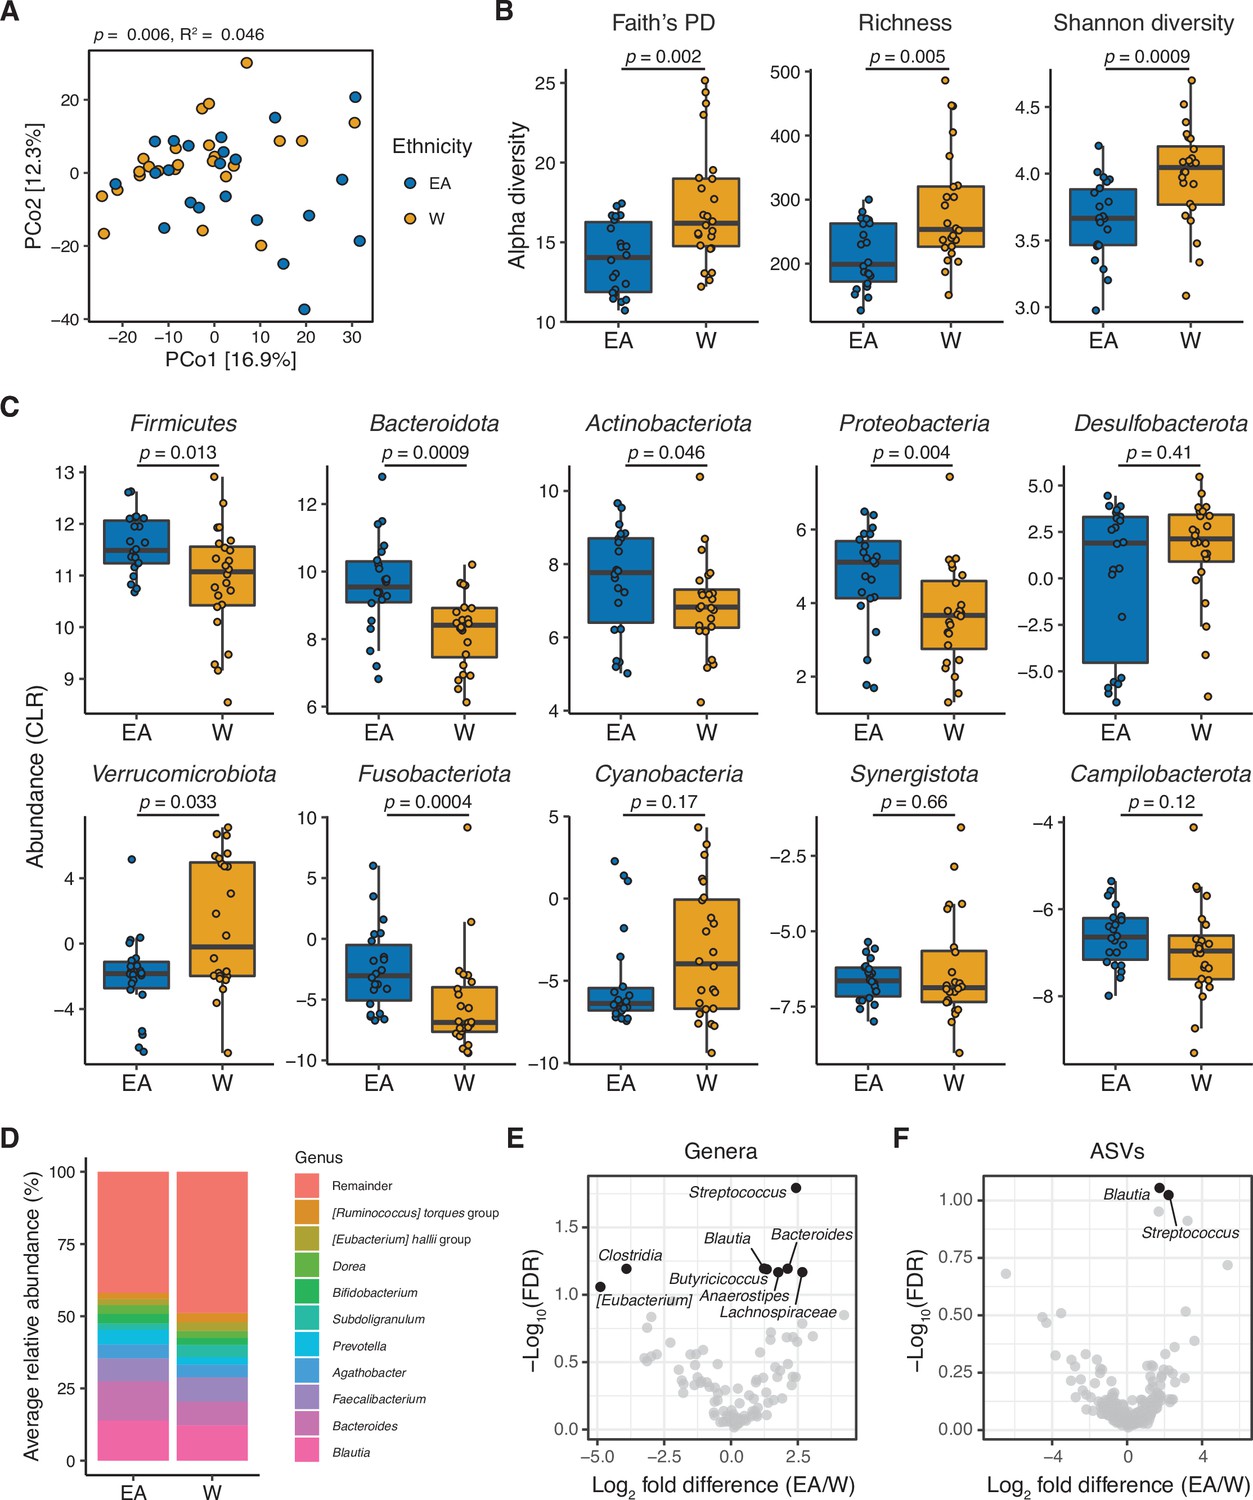
The gut microbiota is distinct between East Asian (EA) and White (W) subjects living in the Bay Area.
(A–C) Each point represents a single individual’s gut microbiota based upon 16S-seq. (A) Principal coordinate analysis of PhILR Euclidean distances reveals significant separation between ethnic groups (ADONIS test values shown). Additional distance calculations for complementary distance matrix calculations are shown in Supplementary file 1C. (B) Calculations of alpha diversity between EA and W subjects. p-values determined using Wilcoxon rank-sum tests. (C) CLR abundances of all bacterial phyla between EA and W subjects. p-values determined using Wilcoxon rank-sum tests. (D) Stacked bar plots showing the average percent relative abundances at the genus level for EA and W subjects, respectively. The most abundant taxa are shown as differently colored bars, with lower abundance taxa grouped as a single bar (Remainder). (E, F) Volcano plot of ALDEx2 differential abundance testing on (E) genera and (F) ASVs detected by 16S-seq in the gut microbiotas of EA versus W individuals. Significantly different (FDR<0.1) features are highlighted in black and labeled by genus or the most specific taxonomic assignment. (A–F) n=22 EA and n=24 W individuals. ASV, amplicon sequence variant; FDR, false discovery rate.
Figure 1—figure supplement 1
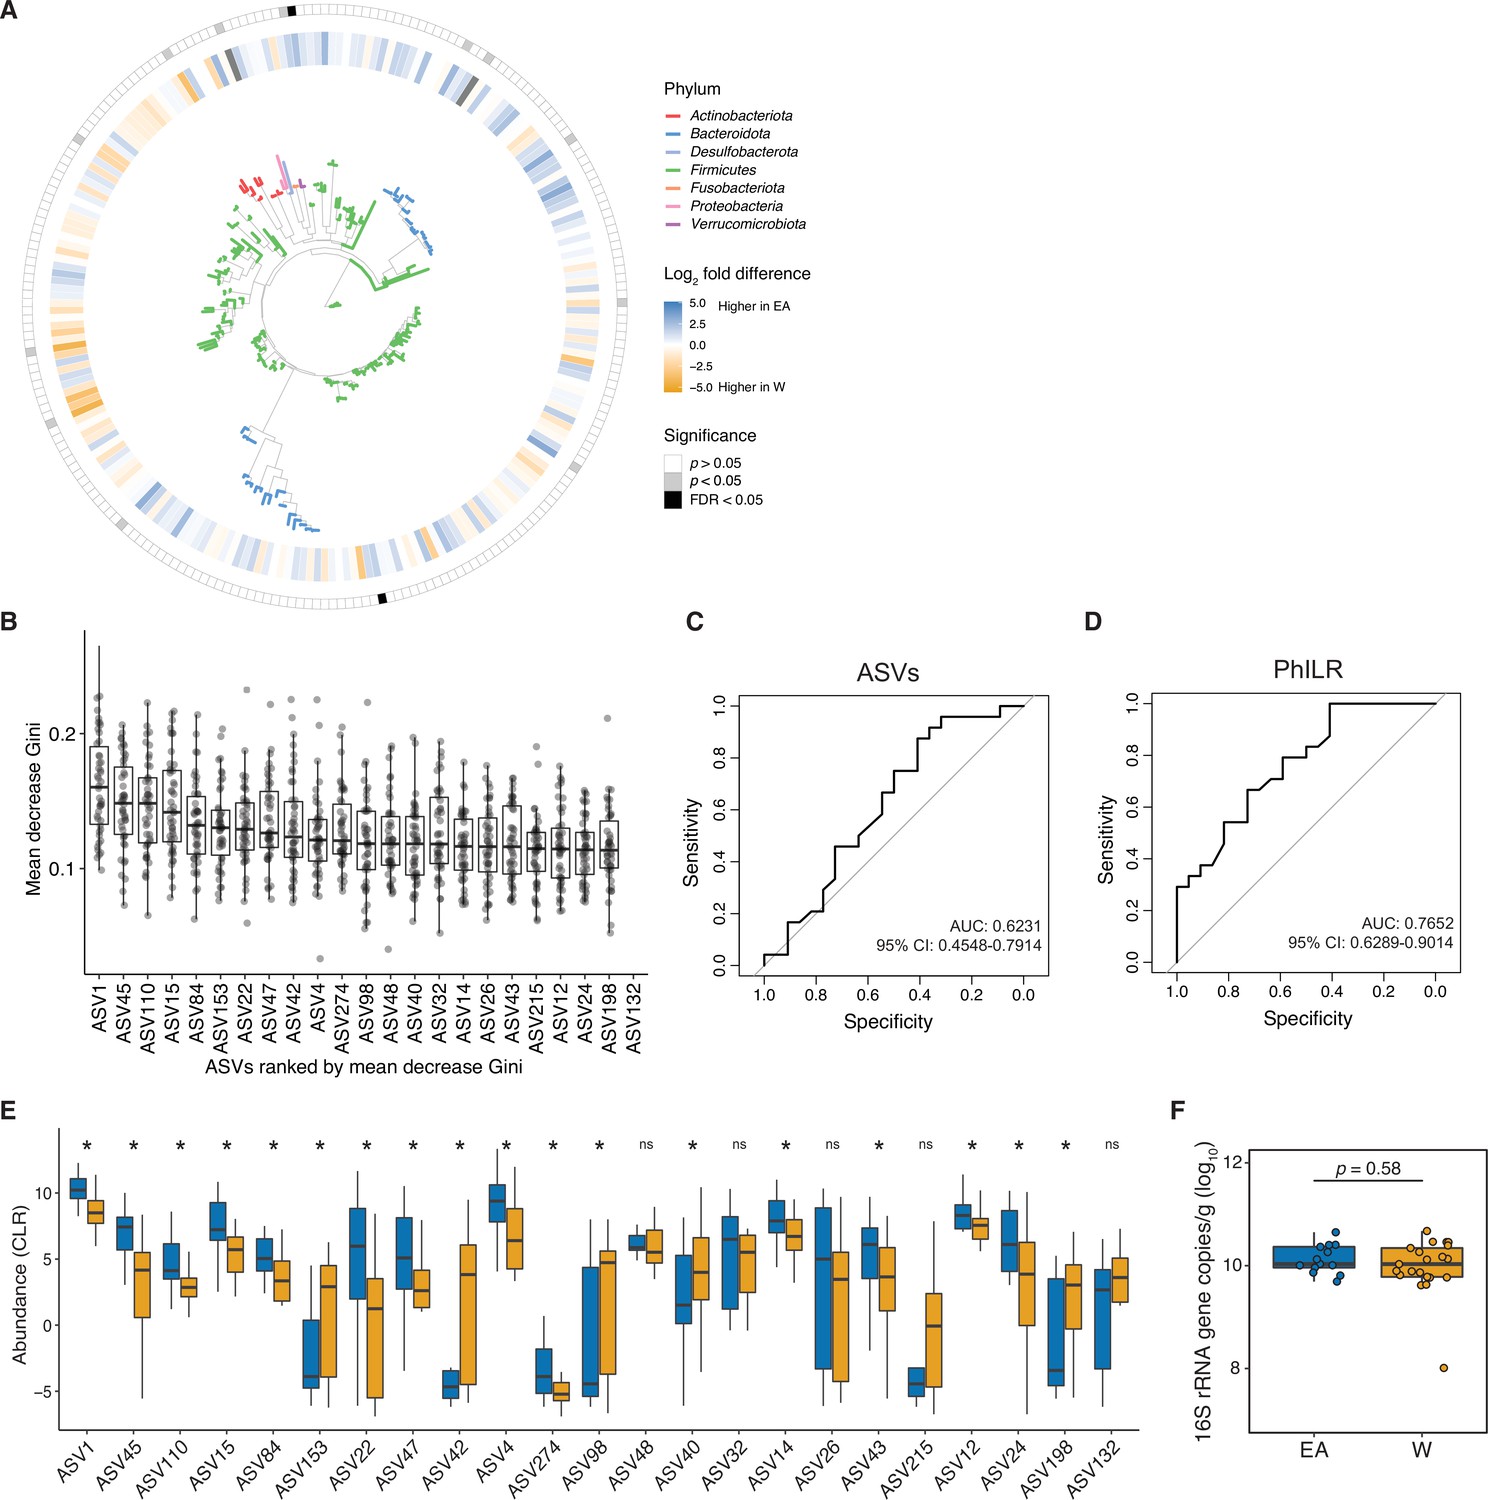
The gut microbiota can be used to predict ethnicity.
(A) A phylogenetic tree of all ASVs generated from 16S-seq is shown. Leaves are colored by phyla. The inner circle indicates differential abundance (EACLR-WCLR) between ethnicities. The outer circle is colored by significance (p<0.05, gray, FDR<0.1, black, Welch's t-test; labeled in Figure 1F). (B-D) A random forest classifier was developed utilizing ASV data (B,C) and PhILR transformed ASV data (D) representing phylogenetic nodes on the tree visualized in panel A. 46 classifiers were trained on a subset of 45 individuals and then used to predict the remaining individual (leave-one-out cross-validation). (B) ASVs in the top 90th percentile for median mean decrease in Gini are plotted. Each dot represents the value for mean decrease in Gini for a given classifier (n=46 total classifiers made up of a subset of 45 samples). (C-D) Receiver operating characteristic curves for ASV data (C) and phylogenetic nodes obtained utilizing PhILR transformation (D) are plotted with values of area under the receiver operator curve (AUC) and 95% confidence intervals displayed. (E) CLR abundances of ASVs in the top 90th percentile of median mean decrease Gini, in the same order as shown in panel B (*p<0.05, Wilcoxon rank-sum test between ethnicity). (F) No significant difference in overall gut microbial colonization assessed by qPCR quantification of 16S rRNA gene copies per gram wet weight (n=13 EA, n=21 W, Wilcoxon rank-sum test).
Figure 2
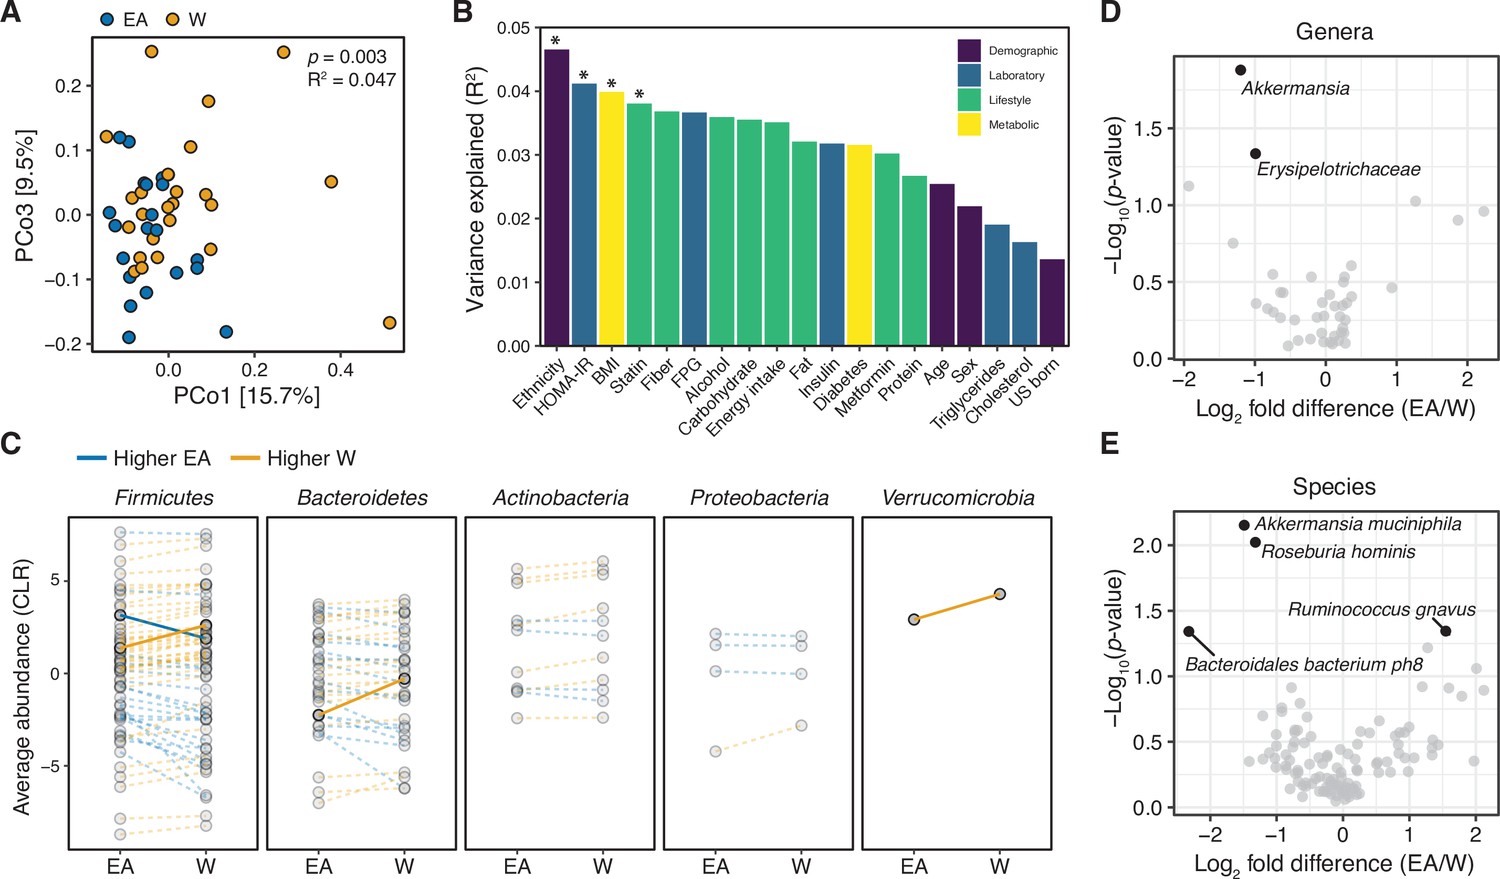
Metagenomic sequencing corroborates differences in the gut microbiota between ethnicities.
(A) Principal coordinate analysis of Bray-Curtis distances reveals significant separation between ethnic groups (ADONIS test values shown). Each point represents a single individual’s gut microbiota based upon shotgun sequencing. (B) PERMANOVA calculations for metadata variables on the x-axis with relation to variance in shotgun transformed species data with resulting effect size plotted on the y-axis. Variables are colored by metadata type (see inset; *p<0.05, ADONIS). (C) Each point represents the average relative abundance for a given species within each ethnic group, connected with a line that is colored by the ethnic group with higher mean abundance of each species: EA (blue) and W (orange). Solid lines highlight four bacterial species that are significantly different between ethnicity (p<0.05, ALDEx2, also shown in (E)). (D, E) Volcano plot of ALDEx2 differential abundance testing on (D) genera and (E) species level shotgun data. Significantly different (p<0.05) features are highlighted in black and labeled by the most specific taxonomic assignment. (A–E) n=21 EA and n=24 W individuals. Data reflects metagenomic sequencing. EA, East Asian; W, White.
Figure 3 with 1 supplement

Metabolomics and targeted metabolite profiling highlight significant differences in bacterial fermentation end-products between ethnicities.
(A) Global profiling of the stool metabolome by proton nuclear magnetic resonance (1H NMR) revealed a significant separation in metabolomic profiles between EA and W individuals (ADONIS test values shown). (B) Representative stool metabolites contributing to the separation of stool metabolomic profiles between EA and W individuals (p<0.05, Wilcoxon rank-sum test). (C–E) Gas chromatography-mass spectrometry analysis of short-chain fatty acids (SCFAs) revealed significantly higher concentrations of acetate (C), propionate (D), and isobutyrate (E) in the stool samples of EA compared to W individuals. p-values determined using Wilcoxon rank-sum tests. (A–E) n=10 EA and n=10 W individuals. EA, East Asian W, White.
Figure 3—figure supplement 1
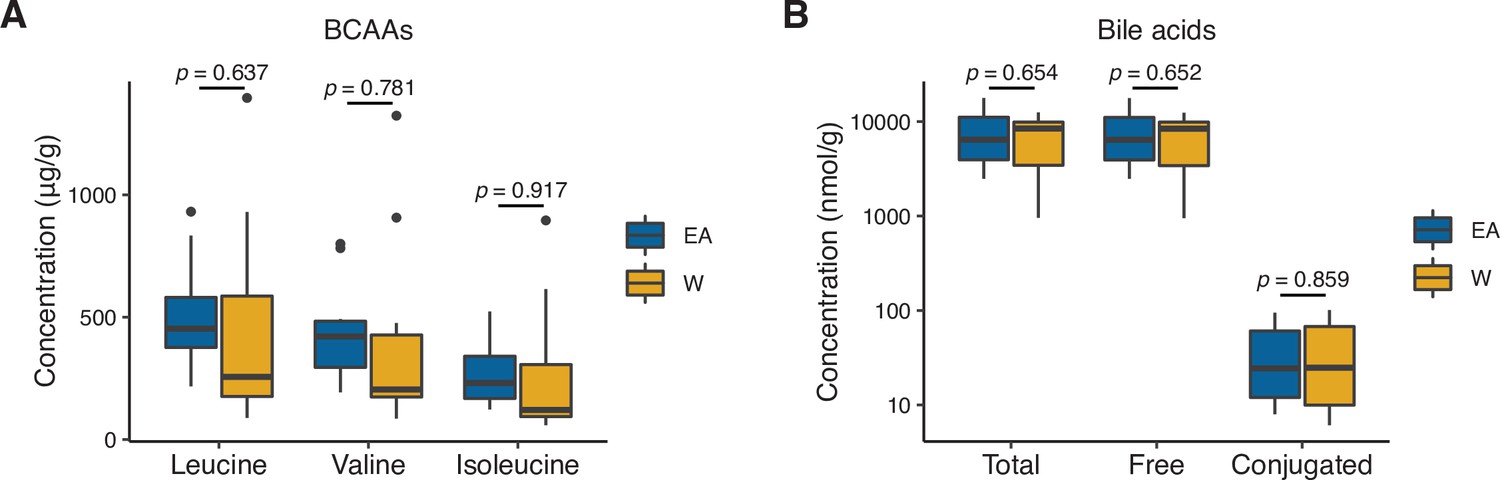
Stool concentrations of branched-chain amino acids (BCAAs) and bile acids are comparable between East Asian (EA) and White (W) subjects.
We did not detect a significant difference in the concentrations of BCAAs (A) or bile acids (B) between EA (n=10) and W (n=10) stool samples. Statistical analyses were performed using Wilcoxon rank-sum tests.
Figure 4 with 1 supplement
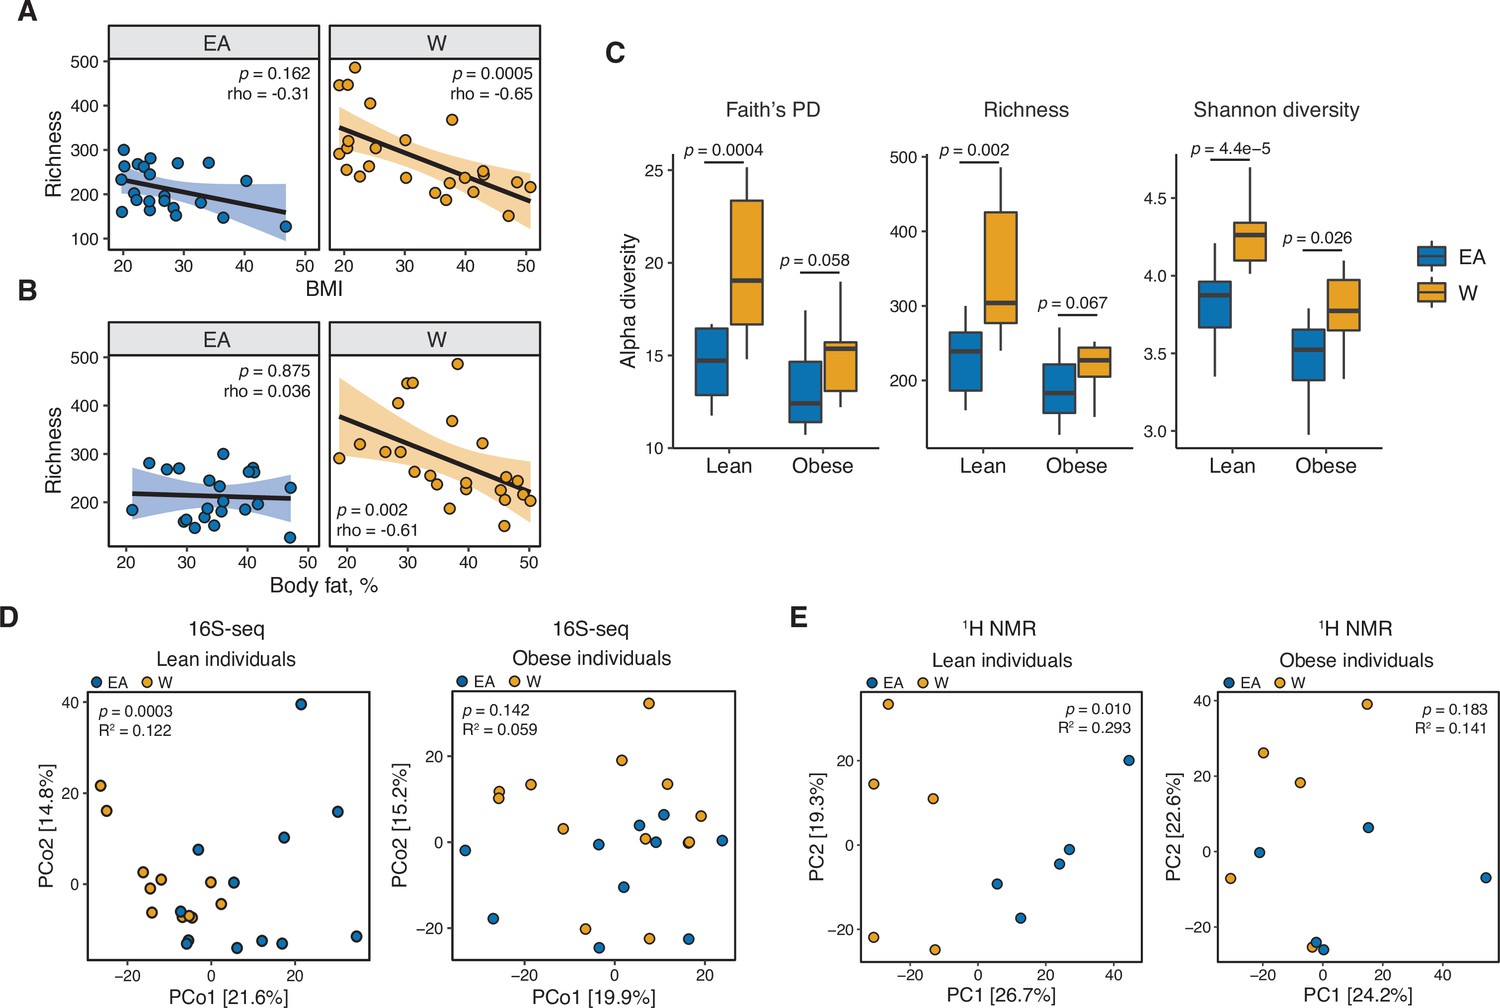
Ethnicity-associated differences in gut microbial diversity and community structure are more pronounced in lean individuals.
(A, B) Bacterial richness is negatively correlated with (A) BMI and (B) percent body fat in W but not EA individuals (Spearman rank correlation coefficients and p-values are shown for each graph). (C) Microbial diversity metrics are more distinct between ethnic groups in lean relative to obese individuals. p-values determined using Wilcoxon rank-sum tests. (D) Principal coordinate analysis of PhILR Euclidean distances reveals significant separation between the gut microbiotas of EA and W lean individuals, with no separation in obese subjects (ADONIS test values shown). (A–D) n=12 EA lean, 10 EA obese, 11 W lean, and 13 W obese individuals. Data reflects 16S-seq. (E) Global profiling of the stool metabolome by proton nuclear magnetic resonance (1H NMR) stratified by lean and obese individuals reveals a significant difference in the metabolomic profiles of lean EA and W individuals that is not detectable in obese individuals (ADONIS test values shown; n=5 individuals/group). EA, East Asian; W, White.
Figure 4—figure supplement 1
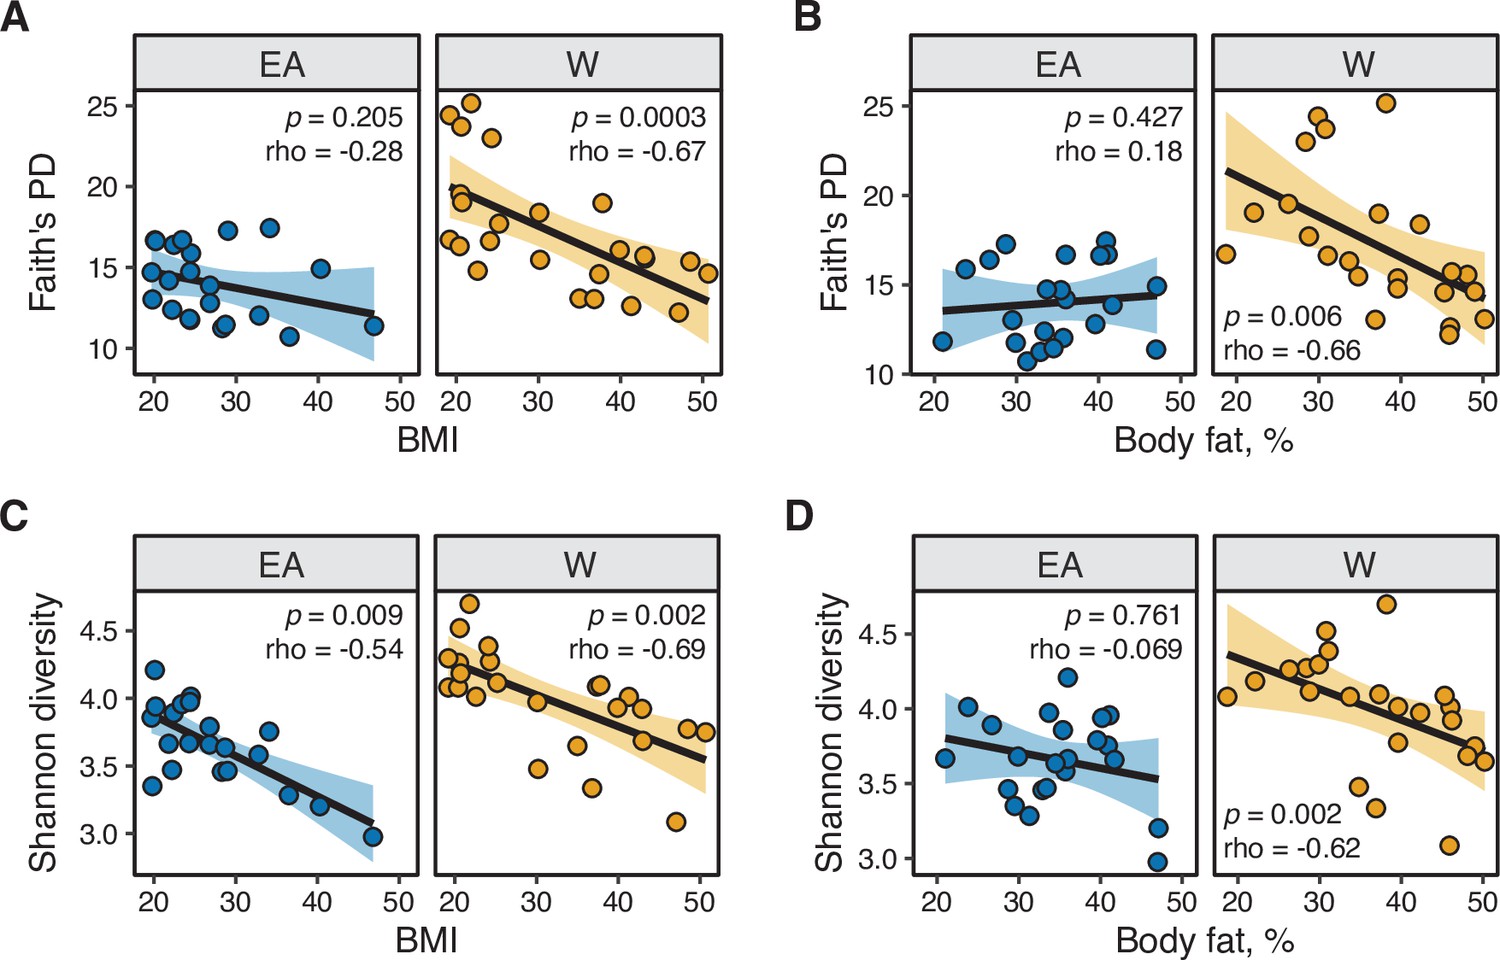
Microbial diversity metrics are consistently and negatively correlated with metabolic parameters in White individuals.
(A,B) Faith’s diversity is significantly correlated with (A) BMI and (B) percent body fat in W but not EA individuals. (C,D) Shannon diversity is significantly correlated with (C) BMI in both W and EA individuals, and with (D) percent body fat in W but not EA individuals. Spearman rank correlation coefficients and p-values are shown for each graph (n=12 EA lean, 10 EA obese, 11 W lean, and 13 W obese individuals). Data reflects 16S-seq.
Figure 5
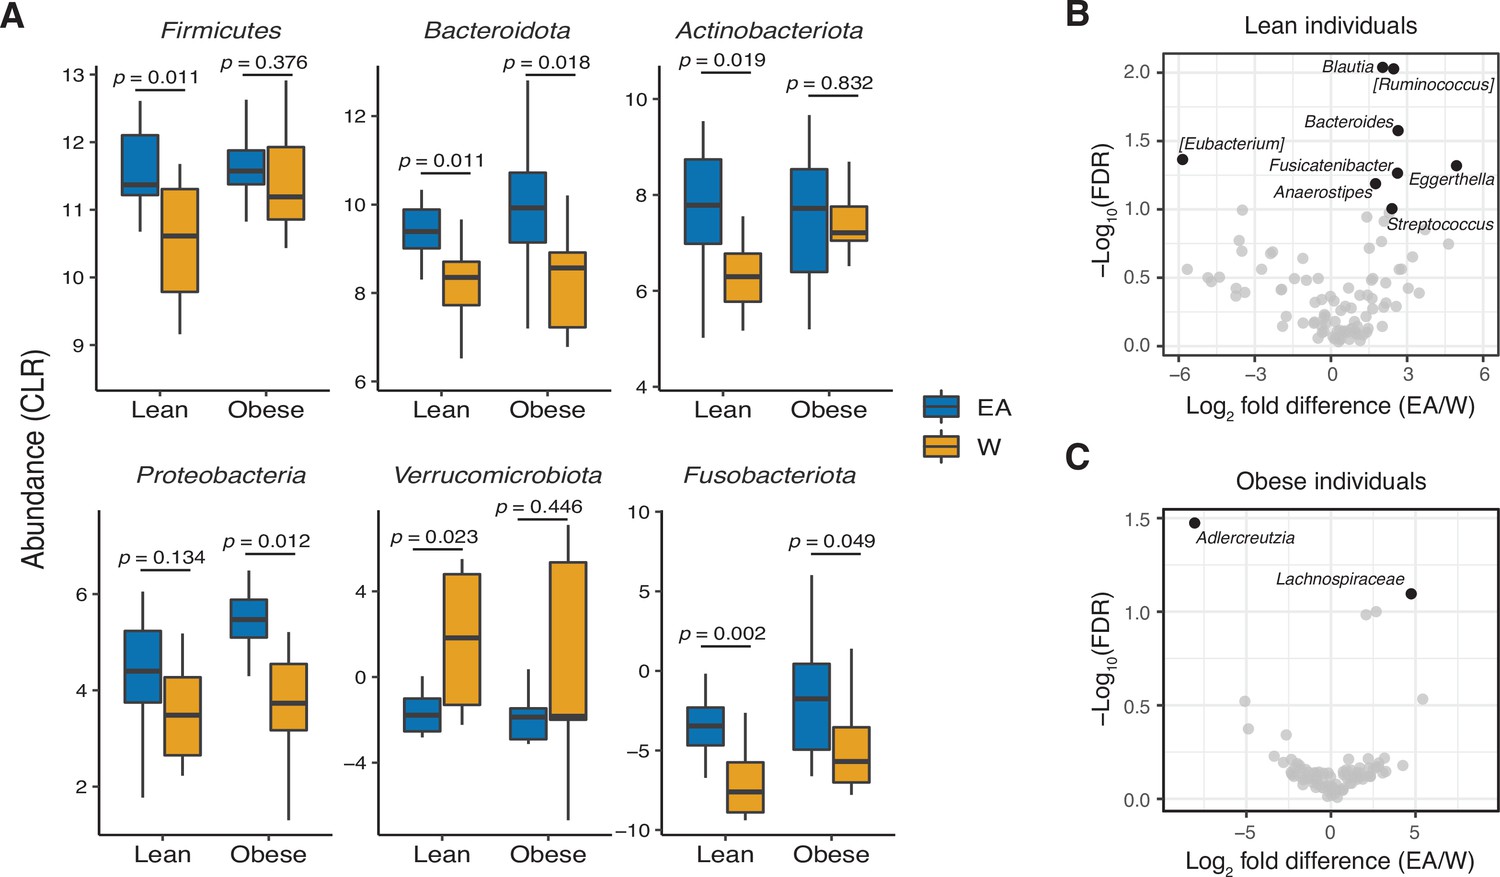
Ethnicity-associated bacterial taxa in lean and obese individuals.
(A) 5/6 phyla that were differentially abundant between ethnicities (see Figure 1C) were also significantly different between lean EA and W individuals. Three phyla were significantly different between obese EA and W individuals (p<0.05, Wilcoxon rank-sum test). (B, C) Volcano plot of ALDEx2 differential abundance testing on genera in stool microbiotas of lean (B) and obese (C) EA versus W individuals, with significantly different genera highlighted (FDR<0.1, ALDEx2). (A–C) n=12 EA lean, 10 EA obese, 11 W lean, and 13 W obese individuals. Data reflects 16S-seq. EA, East Asian; FDR, false discovery rate; W, White.
Figure 6 with 3 supplements
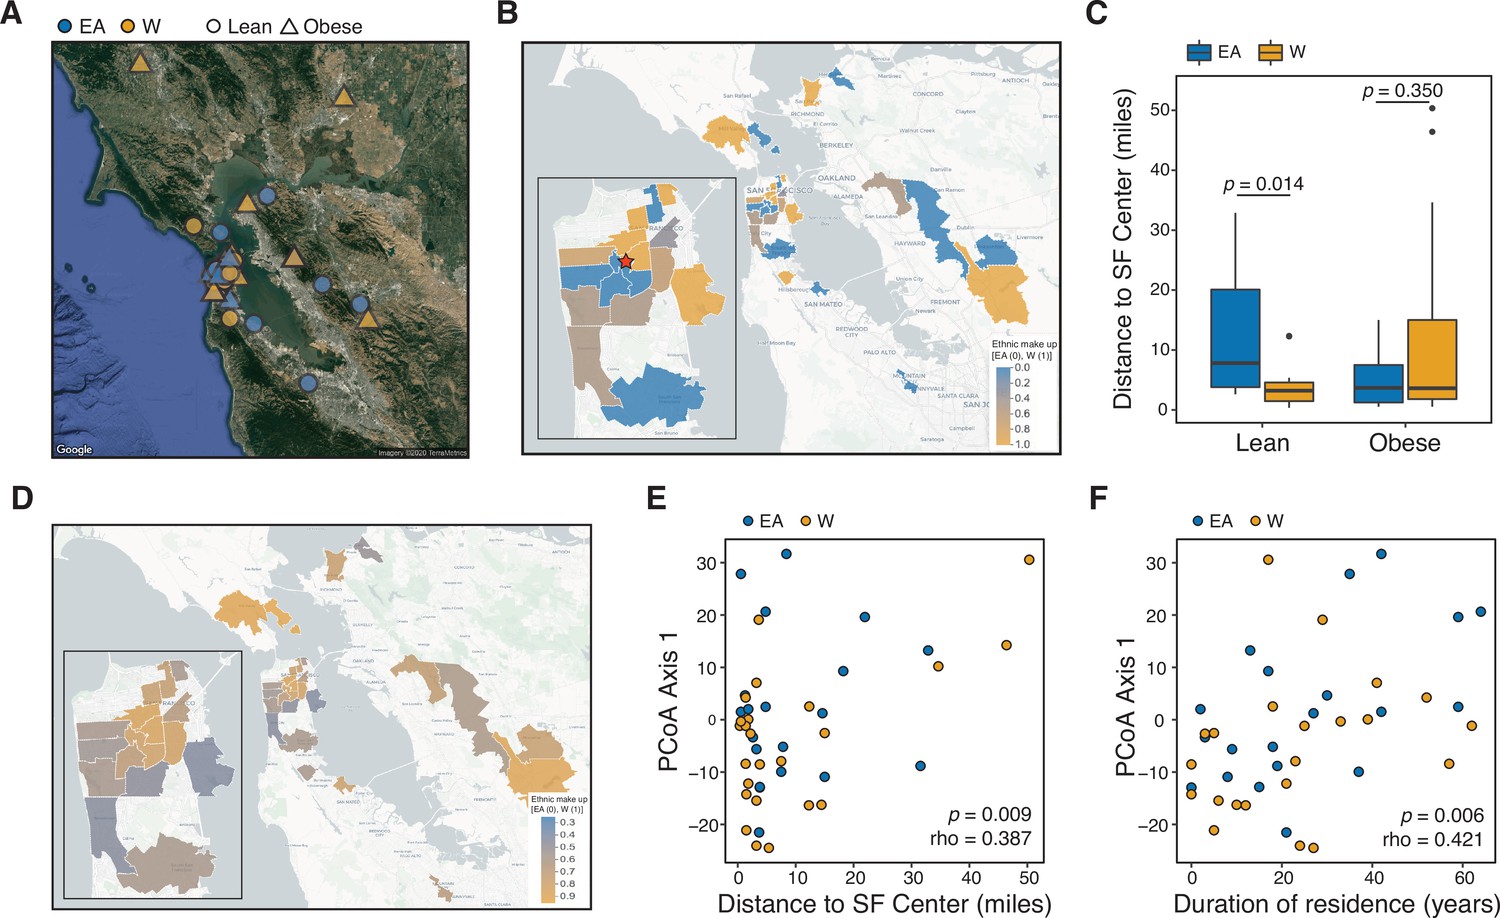
Ethnicity-associated differences in the gut microbiota of lean individuals correlate with geographic location.
(A) Each symbol represents a subject’s ZIP code. Symbols are colored by ethnicity with shape representing lean and obese subjects (n=44, data was unavailable for two subjects; Supplementary file 1B). (B) A subset of ZIP Code Tabulation Areas (ZCTAs) zoomed in to focus on San Francisco are colored by the proportion of each ethnicity (n=27 ZTCAs). The red star indicates a central point (latitude=37.7585102, longitude=−122.4539916) within San Francisco used for distances calculated in (C). (C) Distance to the center of San Francisco, which is indicated by a star in (B), for IDEO subjects stratified by ethnicity and BMI (n=9–13 individuals/group, p-values indicate Wilcoxon rank-sum test). (D) US census data for EA and W residents in ZCTAs from (B) is displayed by ethnic make-up (a total of 489,117 W and 347,200 EA individuals in these areas). (E, F) PCoA principal coordinate axis 1 from PhILR Euclidean distances of the 16S-seq data is significantly correlated with (E) the distance of subject’s ZIP code to the center of San Francisco and (F) the subject’s duration of residence in the SF Bay Area (n=44 subjects; Spearman rank correlation). Data in (E) and (F) reflects 16S-seq.
Figure 6—figure supplement 1
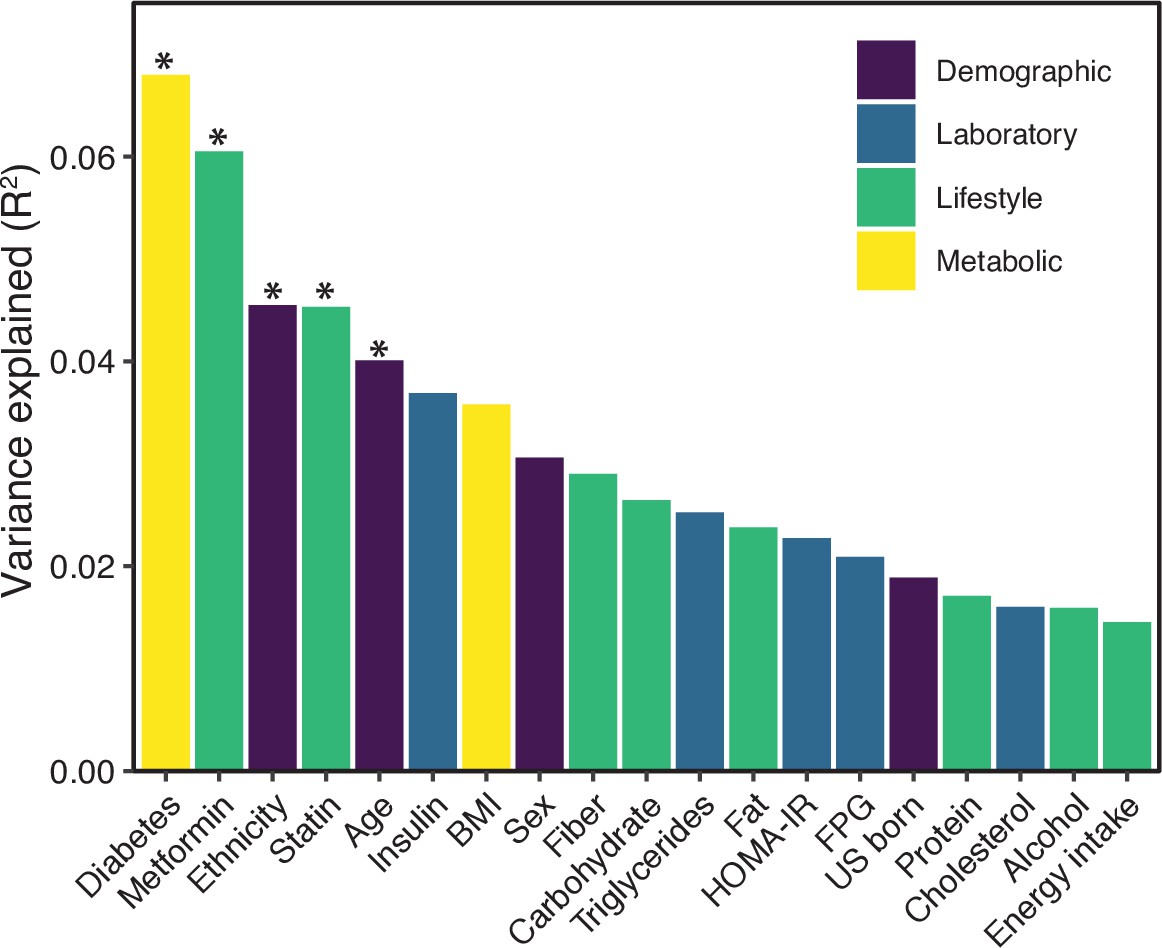
Variables associated with variance in microbial 16S-seq data.
PERMANOVA calculations for metadata variables on the x-axis with relation to variance in PhILR-transformed 16S-seq data were calculated using the vegan package “adonis”. The resulting effect size is plotted on the y-axis. Variables are colored by metadata type (see inset, *p<0.05, ADONIS).
Figure 6—figure supplement 2
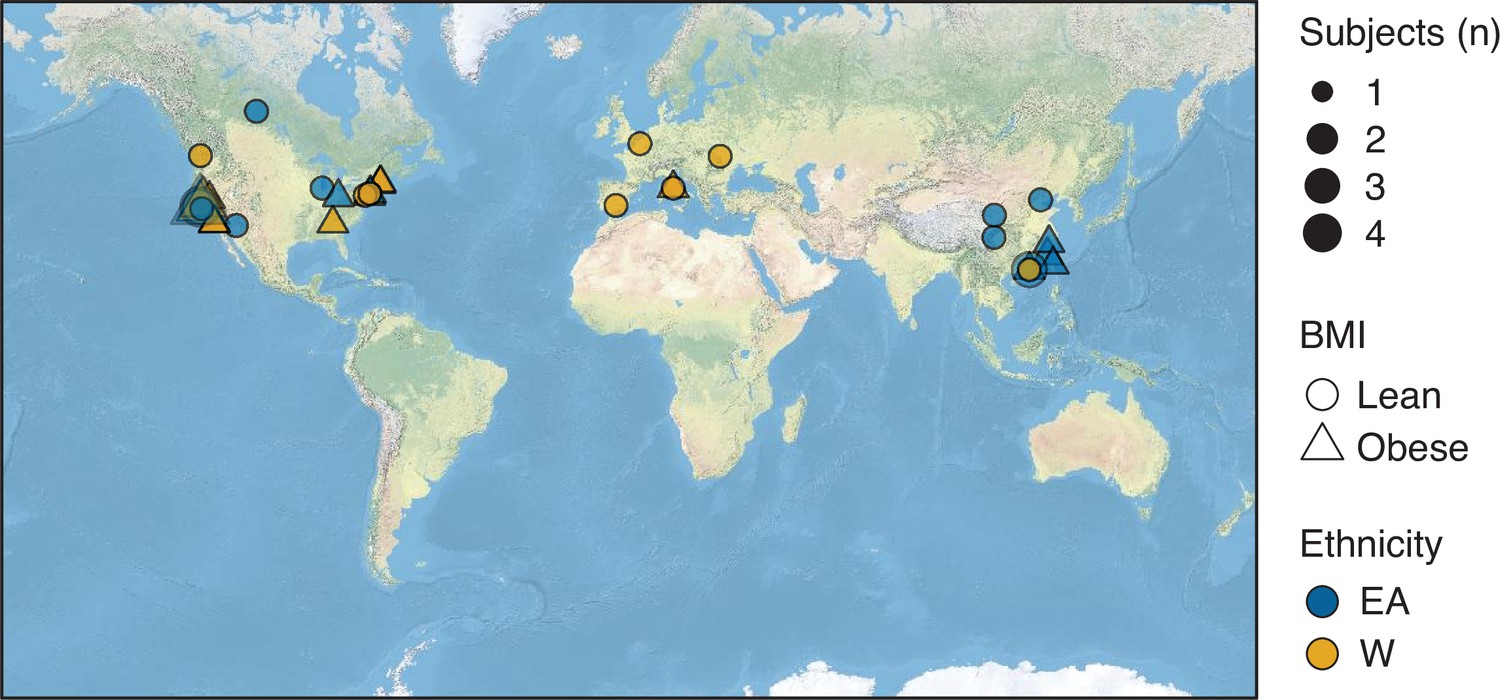
Birth location of subjects.
Symbols representing subjects’ birth locations are plotted on a world map. The size, shape, and color of the symbols represent the number, BMI, and ethnicity of subjects at each location. BMI, body mass index.
Figure 6—figure supplement 3
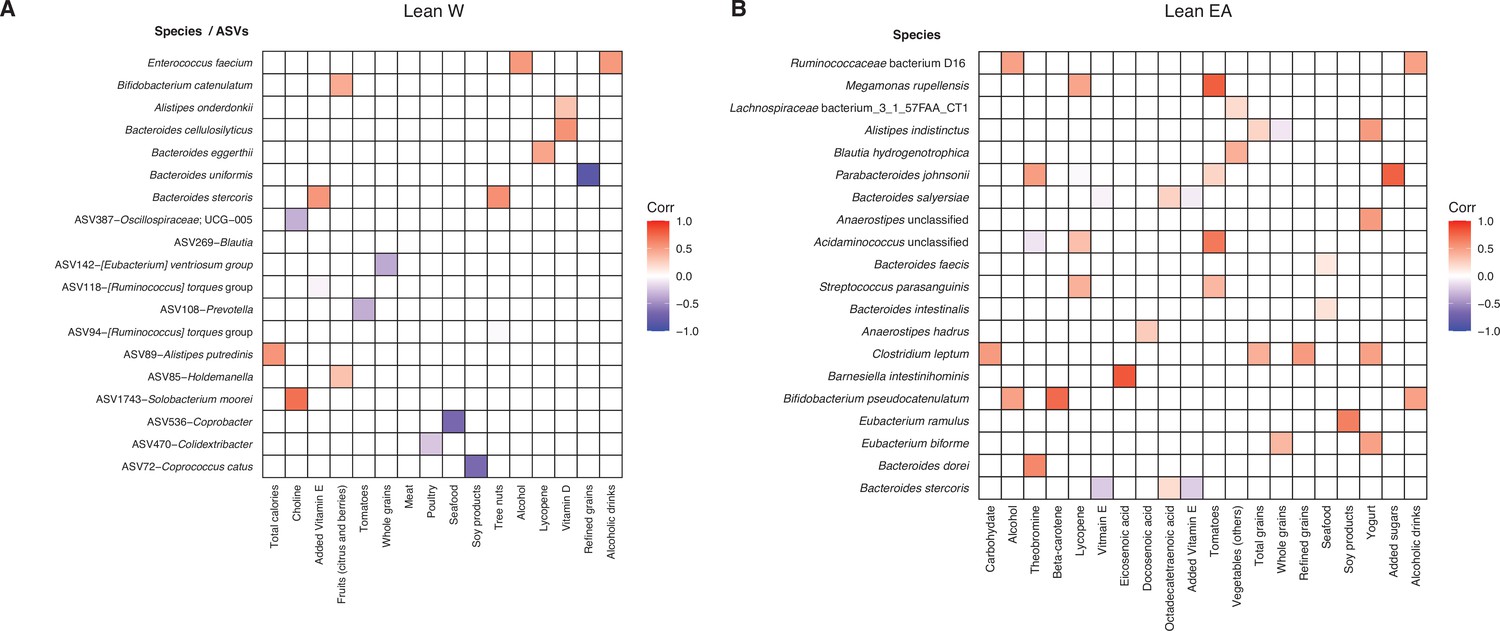
Identification of bacterial taxa associated with short-term dietary intake.
Spearman’s correlation was calculated between all 16S-seq ASVs and metagenomic species relative to ASA24 data for lean W (A) and lean EA (B) subjects. Colored boxes indicate correlations that meet an FDR<0.1 cutoff and the direction and intensity of the Spearman’s correlation are shown with correlation color indicated in the figure legend. ASVs are indicated by an ASV ID followed by the most specific taxonomic annotation available. No ASV-level associations were detected in lean EA subjects. ASV, amplicon sequence variant; EA, East Asian; FDR, false discovery rate; W, White.
Figure 7 with 3 supplements
Differences in the human gut microbiota between ethnicities are maintained following transplantation to germ-free mice.
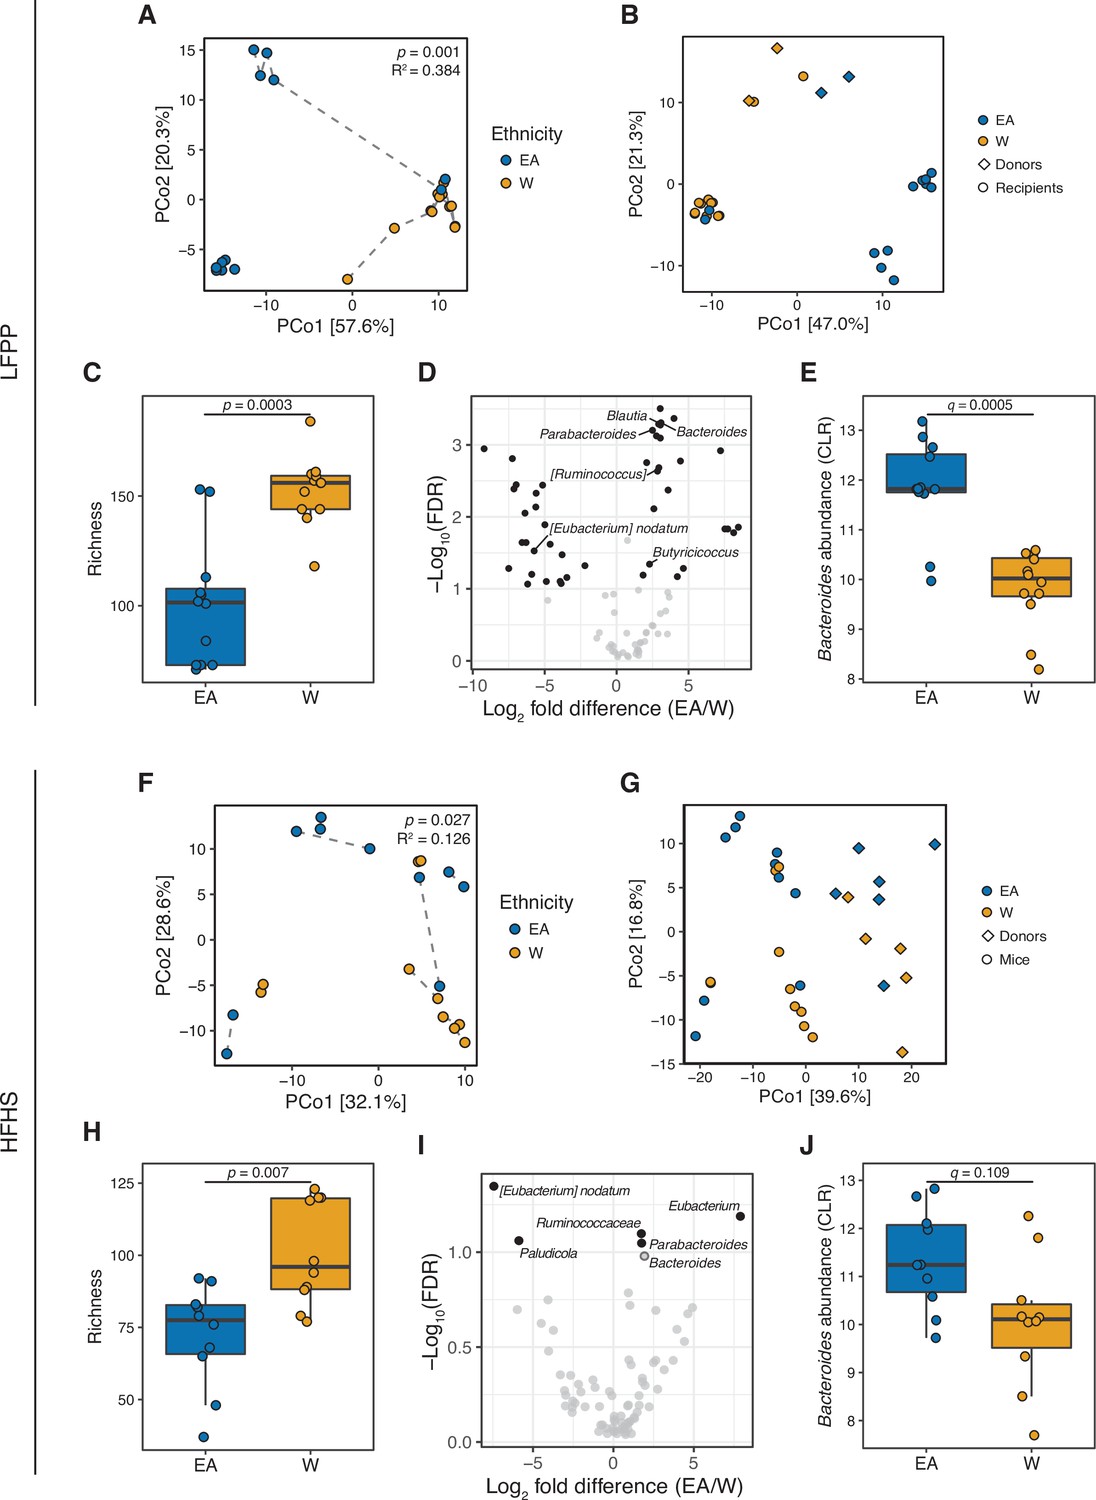
(A, F) Principal coordinate analysis of PhILR Euclidean distances of stool from germ-free recipient mice transplanted with stool microbial communities from lean EA or W donors and fed either an LFPP (A, combined results from two independent experiments; n=12 recipient mice per group) or HFHS (F, n=10 recipient mice per group) diet. Significance was assessed by ADONIS. Germ-free mice receiving the same donor sample are connected by a dashed line. Experimental designs are shown in Figure 7—figure supplement 1. (B, G) Principal coordinate analysis of PhILR Euclidean distances comparing donor input slurry (diamonds) and stool from recipient mice (circles) in the combined LFPP experiments (B, n=4 donors, 24 recipients) and HFHS experiment (G, n=10 donors, 20 recipients; for one donor sample, two separate slurries were prepared to inoculate the recipient mice on separate days due to constraints on germ-free mice availability, resulting in 11 diamonds on the plot). See also donor metadata in Supplementary file 1B,H. (C, H) Bacterial richness is significantly higher in mice who received stool samples from W donors compared to EA donors on both the LFPP (C) and HFHS (H) diets. p-values determined using Wilcoxon rank-sum tests. (D, I) Volcano plot of ALDEx2 differential abundance testing on genera in the stool microbiomes between transplant groups. The x-axis represents the fold difference between EA (numerator) and W (denominator) subjects. The y-axis is proportional to the false discovery rate (FDR). Black dots indicate significantly different genera (FDR<0.1). Bacteroides and Parabacteroides (labeled in the volcano plots) are more abundant in mice that received stool samples from EA compared to W donors on both the LFPP (D) and HFHS (I) diets. See also Supplementary file 1J for the full list of significant genera. (E, J) Abundance of the Bacteroides genus in mice fed the LFPP (E) and HFHS (J) diets (ALDEx2 FDR shown). Data reflects 16S-seq. EA, East Asian; HFHS, high-fat, high-sugar; LFPP, low-fat, high-plant-polysaccharide; W, White.
Figure 7—figure supplement 1
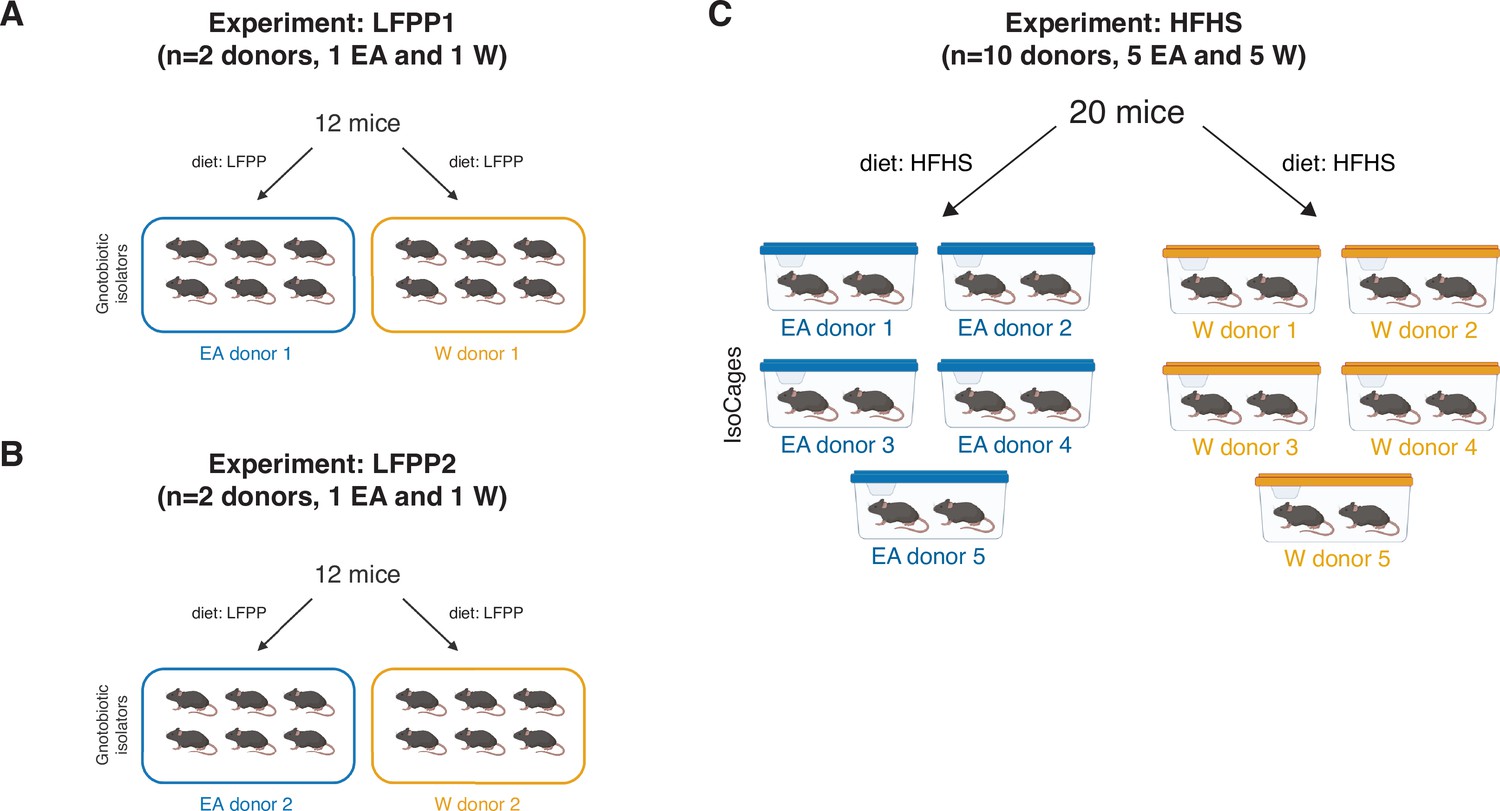
Experimental designs for gnotobiotic experiments.
(A) LFPP1 experiment: Germ-free mice fed an LFPP diet received an aliquot of stool from a donor of either ethnicity and were monitored for 6 weeks (per donor n=6 recipient mice, 1 isolator, 2 cages). (B) LFPP2 experiment: Same experimental design as LFPP1 but colonization time was shortened to 3 weeks and two new donor samples were used (per donor n=6 recipient mice, 1 isolator, 2 cages). (C) HFHS experiment: 5 lean EA and 5 W donors’ stool microbial communities were transplanted into 20 germ-free recipient mice fed an HFHS diet for 4 weeks prior to colonization and maintained on diet for another 3 weeks post-transplantation (per donor n=2 recipient mice, 1 IsoCage). EA, East Asian; HFHS, high-fat, high-sugar; LFPP, low-fat, high-plant-polysaccharide; W, White.
Figure 7—figure supplement 2
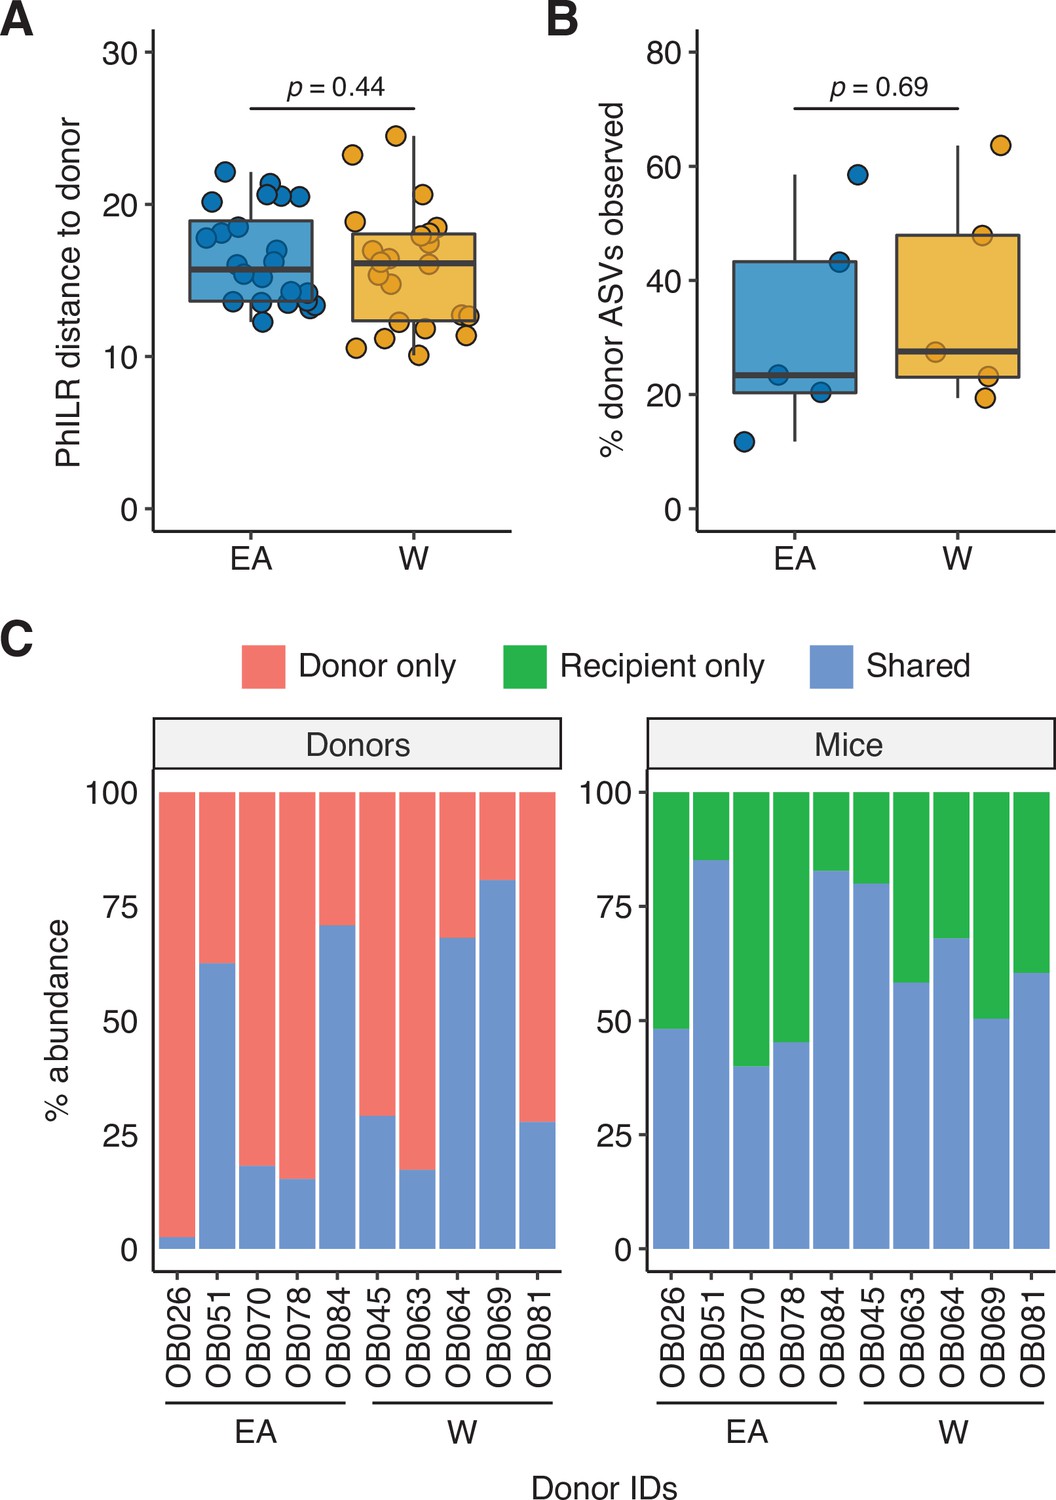
Engraftment efficiency is comparable between donor groups.
There was no significant difference between groups in (A) the PhILR distance of recipient mice to their respective donors or (B) the proportion of donor ASVs detected in the recipient mice (Wilcoxon rank-sum test). (C) Relative abundance of shared and unique ASVs in each donor and the corresponding recipient mice. ASV, amplicon sequence variant.
Figure 7—figure supplement 3
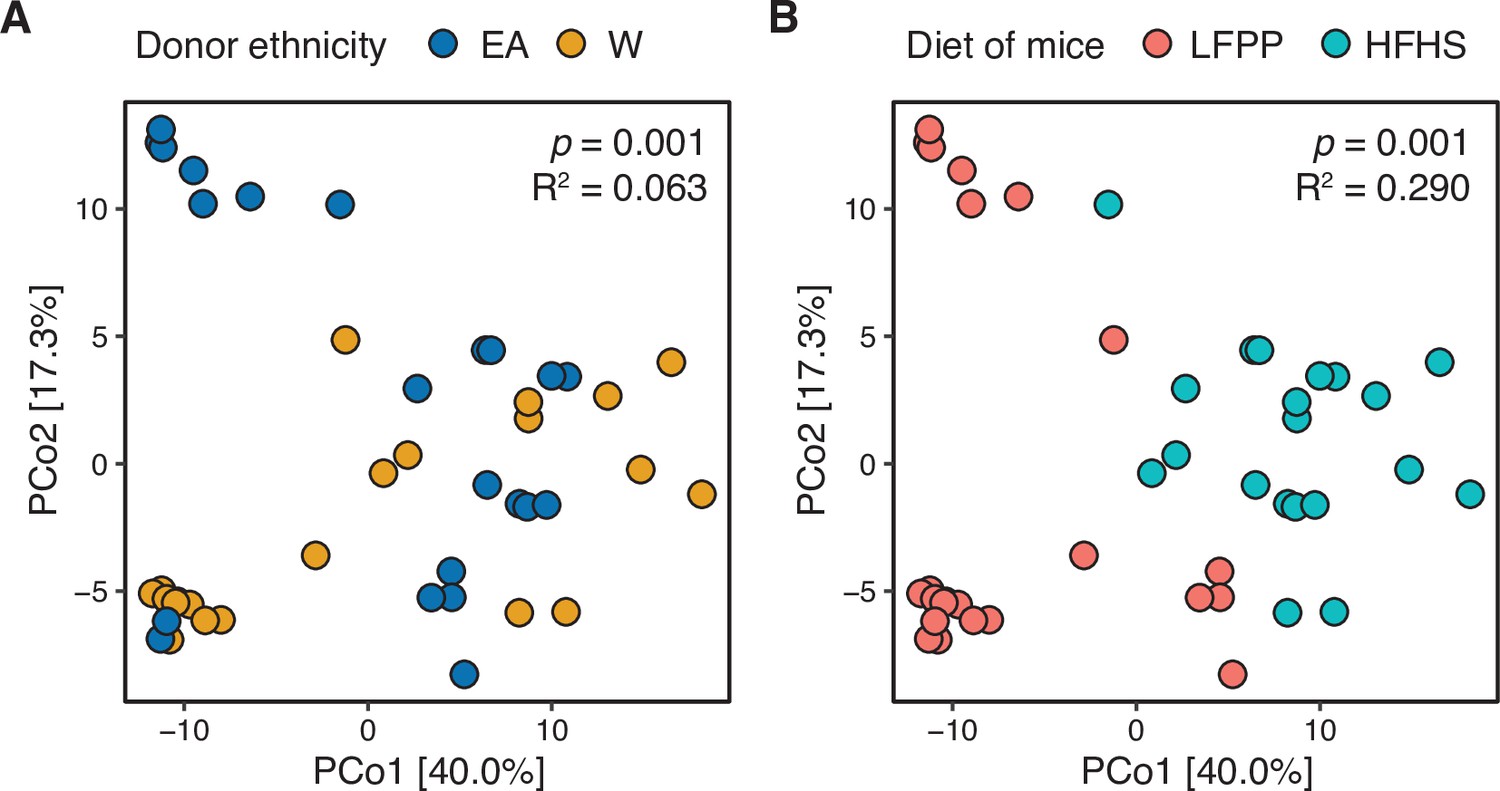
Combined analysis of recipient mice reveals significant associations with donor ethnicity and recipient diet.
A PhILR PCoA is plotted based on 16S-seq data from all gnotobiotic experiments. Individual mice are colored by (A) donor ethnicity or (B) the recipient’s diet. Both ethnicity and diet were statistically significant contributors to variance (ADONIS p-values and estimated variance displayed using blocks restricted by donor identifiers to account for one donor going to multiple recipient mice). We also observed a trend for interaction between diet and ethnicity in this model (p=0.068, R2=0.047, ADONIS).
Figure 8
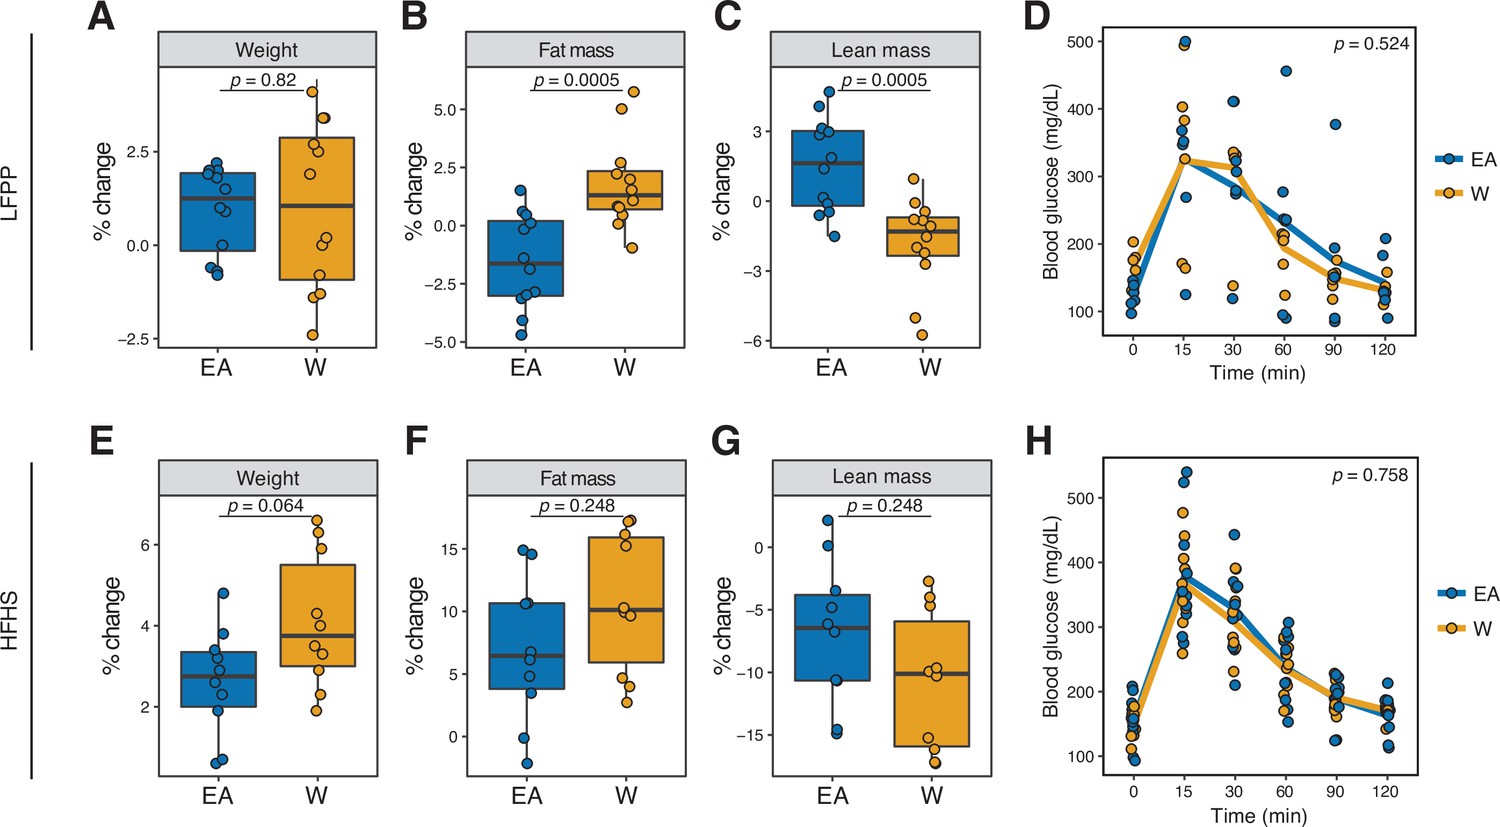
Microbiome transplantation of samples from EA and W individuals differentially affects the body composition of genetically identical recipient mice.
(A–C, E–G) Percent change in body weight (A, E), fat mass (B, F), and lean mass (C, G) relative to baseline are shown on the LFPP (A–C) and HFHS (E–G) diets. p-values determined using Wilcoxon rank-sum tests. (D, H) Glucose tolerance test results were not significantly different between groups on either diet. p-values determined using linear mixed-effects models with mouse as a random effect. (A–C) n=12 recipient mice per group (combined data from two independent experiments). (D) n=6 recipient mice per group from a single experiment. (E–H) n=10 recipient mice per group. Experimental designs are shown in Figure 7—figure supplement 1 and donor phenotypic data is in Supplementary file 1H. EA, East Asian; HFHS, high-fat, high-sugar; LFPP, low-fat, high-plant-polysaccharide; W, White.
Author response image 1
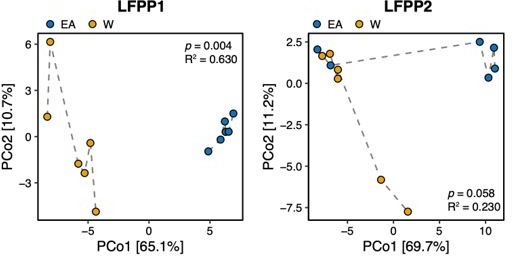
Principal coordinate analysis of PhILR Euclidean distances of stool from germ-free recipient mice transplanted with stool microbial communities from lean EA or W donors and fed a LFPP diet in two independent experiments (LFPP1 and LFPP2, n=12 recipient mice per group in each experiment).
Significance was assessed by ADONIS. Each data point represents a single mouse. Germ-free mice receiving the same donor sample are connected by a dashed line. Experimental designs are shown in Figure S7.
Tables
Key resources table
| Reagent type (species) or resource | Designation | Source or reference | Identifiers | Additional information |
|---|---|---|---|---|
| Biological sample (Homo sapiens) | Stool | This paper | n=46 subjects (22 EA, 24 W) | |
| Commercial assay or kit | Wizard SV 96 Genomic DNA kit | Promega | Cat #A2370 | |
| Commercial assay or kit | ZymoBIOMICS 96 MagBead DNA Kit | Zymo Research | Cat #D4302 | |
| Software, algorithm | R | CRAN | v3.5.3, v4.0.2 | https://cran.r-project.org |
| Software, algorithm | QIIME2 | Bolyen et al., 2019 | v2020.2 | http://qiime2.org |
| Software, algorithm | DADA2 | Callahan et al., 2016 | http://benjjneb.github.io/dada2 | |
| Software, algorithm | MicrobeR | Bisanz, 2017 | v0.3.2 | https://github.com/jbisanz/MicrobeR |
| Software, algorithm | qiime2R | Bisanz, 2018 | v0.99.34 | http://github.com/jbisanz/qiime2R |
| Software, algorithm | MetaPhlAn2 | Truong et al., 2015 | v2.7.7 | http://huttenhower.sph.harvard.edu/metaphlan2 |
| Software, algorithm | Vegan | Oksanen et al., 2013 | v2.5–6 | https://CRAN.R-project.org/package=vegan |
| Software, algorithm | APE | Paradis and Schliep, 2019 | v5.3 | http://ape-package.ird.fr |
| Software, algorithm | Picante | Kembel et al., 2010 | v1.8.1 | http://github.com/skembel/picante |
| Software, algorithm | PhILR | Silverman et al., 2017 | v1.12.0 | http://github.com/jsilve24/philr |
| Software, algorithm | ALDEx2 | Fernandes et al., 2013 | v1.18.0 | http://github.com/ggloor/ALDEx_bioc |
| Software, algorithm | GGMaps | Kahle and Wickham, 2013 | v3.0.0.902 | https://github.com/dkahle/ggmap |
| Software, algorithm | Open Street Maps | https://www.openstreetmap.org | https://wiki.openstreetmap.org/wiki/Main_Page | |
| Software, algorithm | Leaflet | https://www.openstreetmap.org | v1.6.0 | http://rstudio.github.io/leaflet |
| Software, algorithm | Imap | Wallace, 2012 | v1.32 | https://rdrr.io/cran/Imap |
| Strain, strain background(Mus musculus) | C57BL/6J mice, germ-free | UCSF Gnotobiotics Core | ||
| Other | 2018 US Census data | http://data.census.gov | Table B02001: Race |
Additional files
-
Supplementary file 1
This file contains 10 supplementary tables that include detailed metadata, metabolomics data, and data visualized in the main text and supplement figures for the manuscript.
- https://cdn.elifesciences.org/articles/70349/elife-70349-supp1-v3.xlsx
-
Transparent reporting form
- https://cdn.elifesciences.org/articles/70349/elife-70349-transrepform1-v3.docx
Download links
A two-part list of links to download the article, or parts of the article, in various formats.
Downloads (link to download the article as PDF)
Open citations (links to open the citations from this article in various online reference manager services)
Cite this article (links to download the citations from this article in formats compatible with various reference manager tools)
The East Asian gut microbiome is distinct from colocalized White subjects and connected to metabolic health
eLife 10:e70349.
https://doi.org/10.7554/eLife.70349


