Hematodinium sp. infection does not drive collateral disease contraction in a crustacean host
- Department of Biosciences, College of Science, Swansea University, United Kingdom
- Centre for Environment, Fisheries and Aquaculture Science (Cefas), United Kingdom
Figures
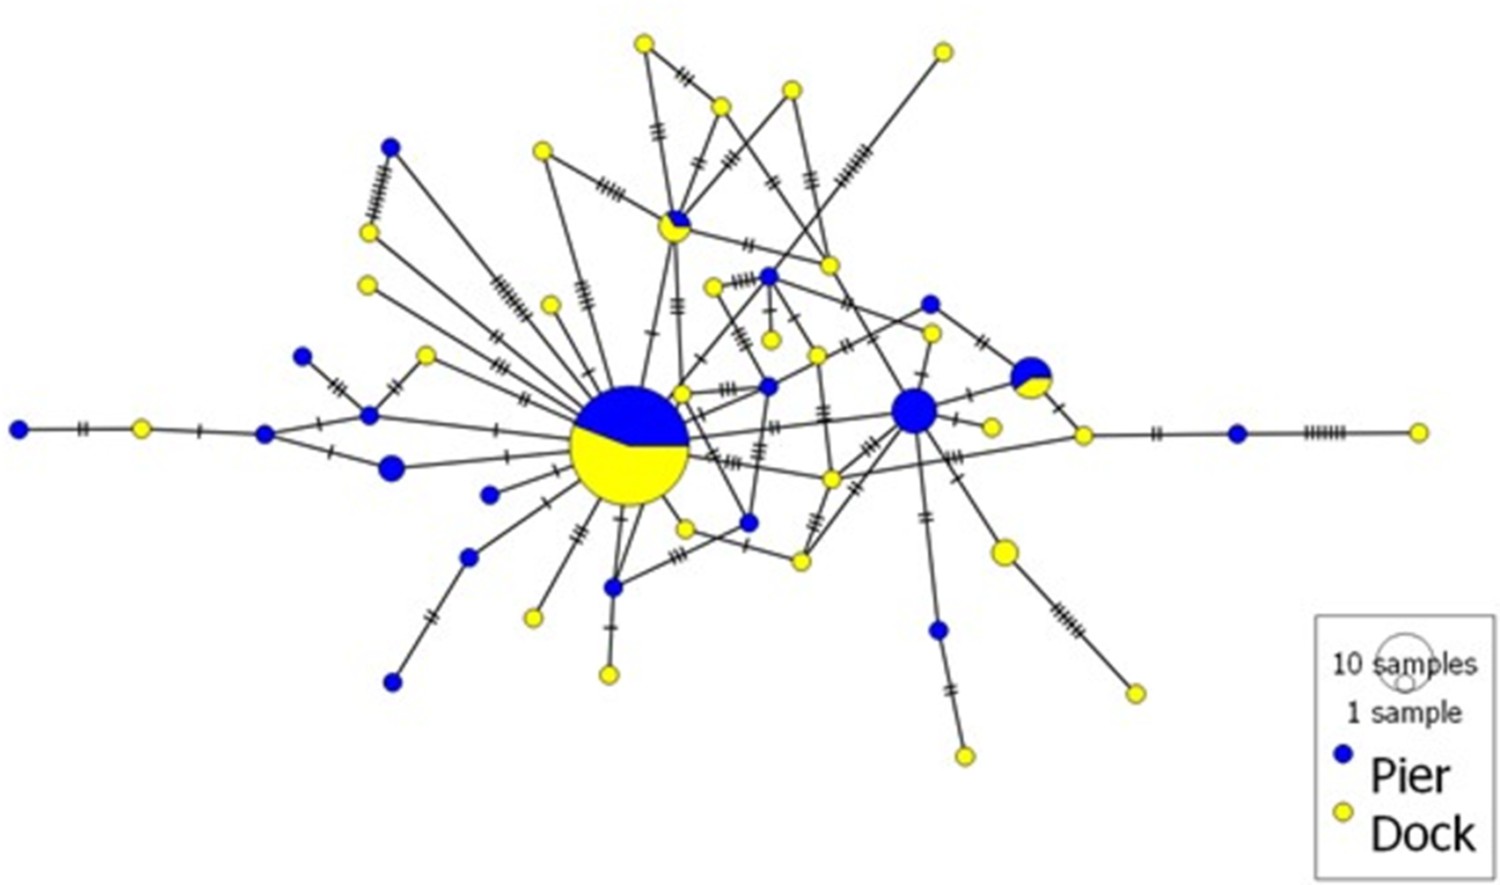
Figure 1
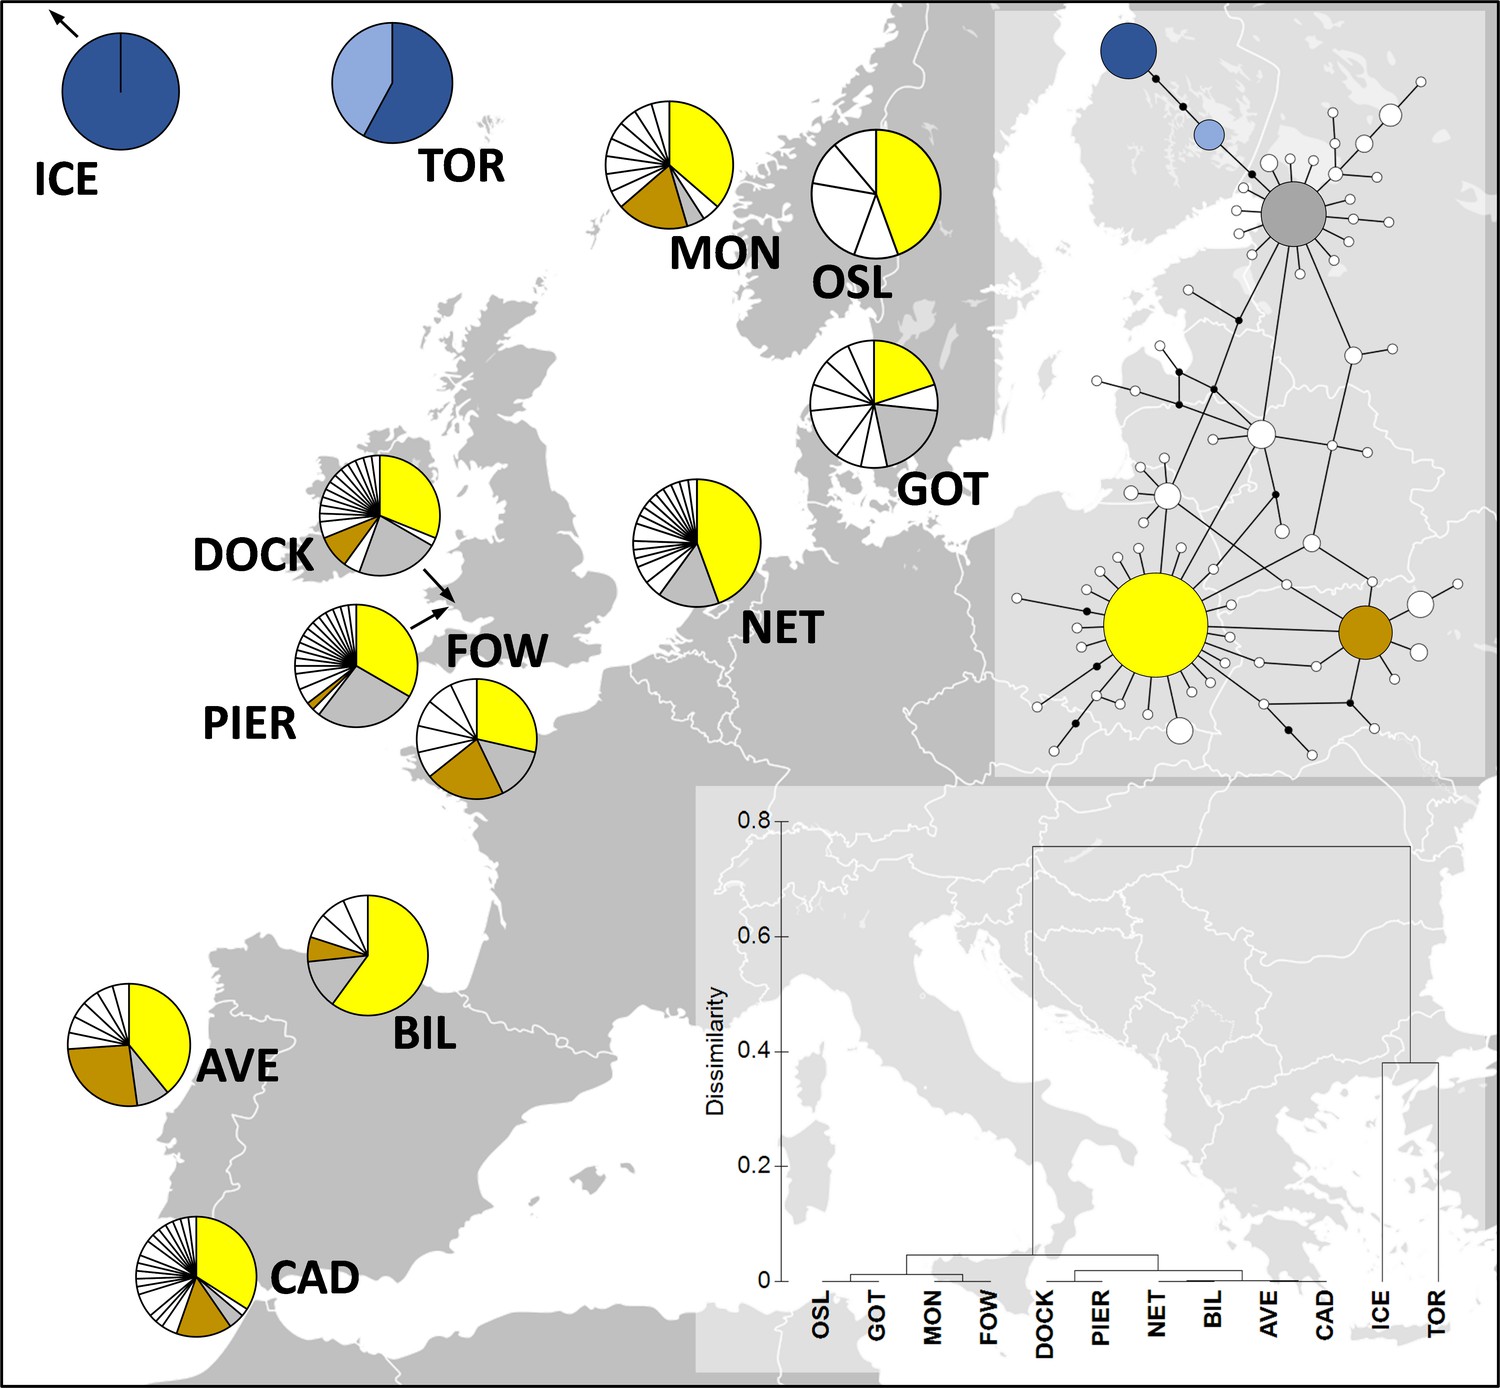
Distribution of Carcinus maenas haplotypes observed in the present study (Dock and Pier).
At the top-right corner, a median joining haplotype network of C. maenas COI sequences is shown. The size of the circles of the haplotype network corresponds to haplotype frequency, and each connection represents a single-nucleotide difference. The more common haplotypes are shown in yellow (h1), brown (h6), grey (h10), dark blue (h13), and light blue (h29). The less common haplotypes are shown in white. At the bottom-right corner, a dendrogram of hierarchical clustering based on Fst values is displayed. Additional sequences were retrieved from Darling et al., 2008; ICE, Seltjarnarnes Iceland; TOR, Torshavn, Faroe Islands; MON, Mongstadt, Norway; OSL, Oslo, Norway; GOT, Goteborg, Sweden; NET, Den Helder, the Netherlands; FOW, Fowey, England; BIL, Bilbao, Spain; AVE, Aveiro, Portugal; CAD, Cádiz, Spain.
Figure 2
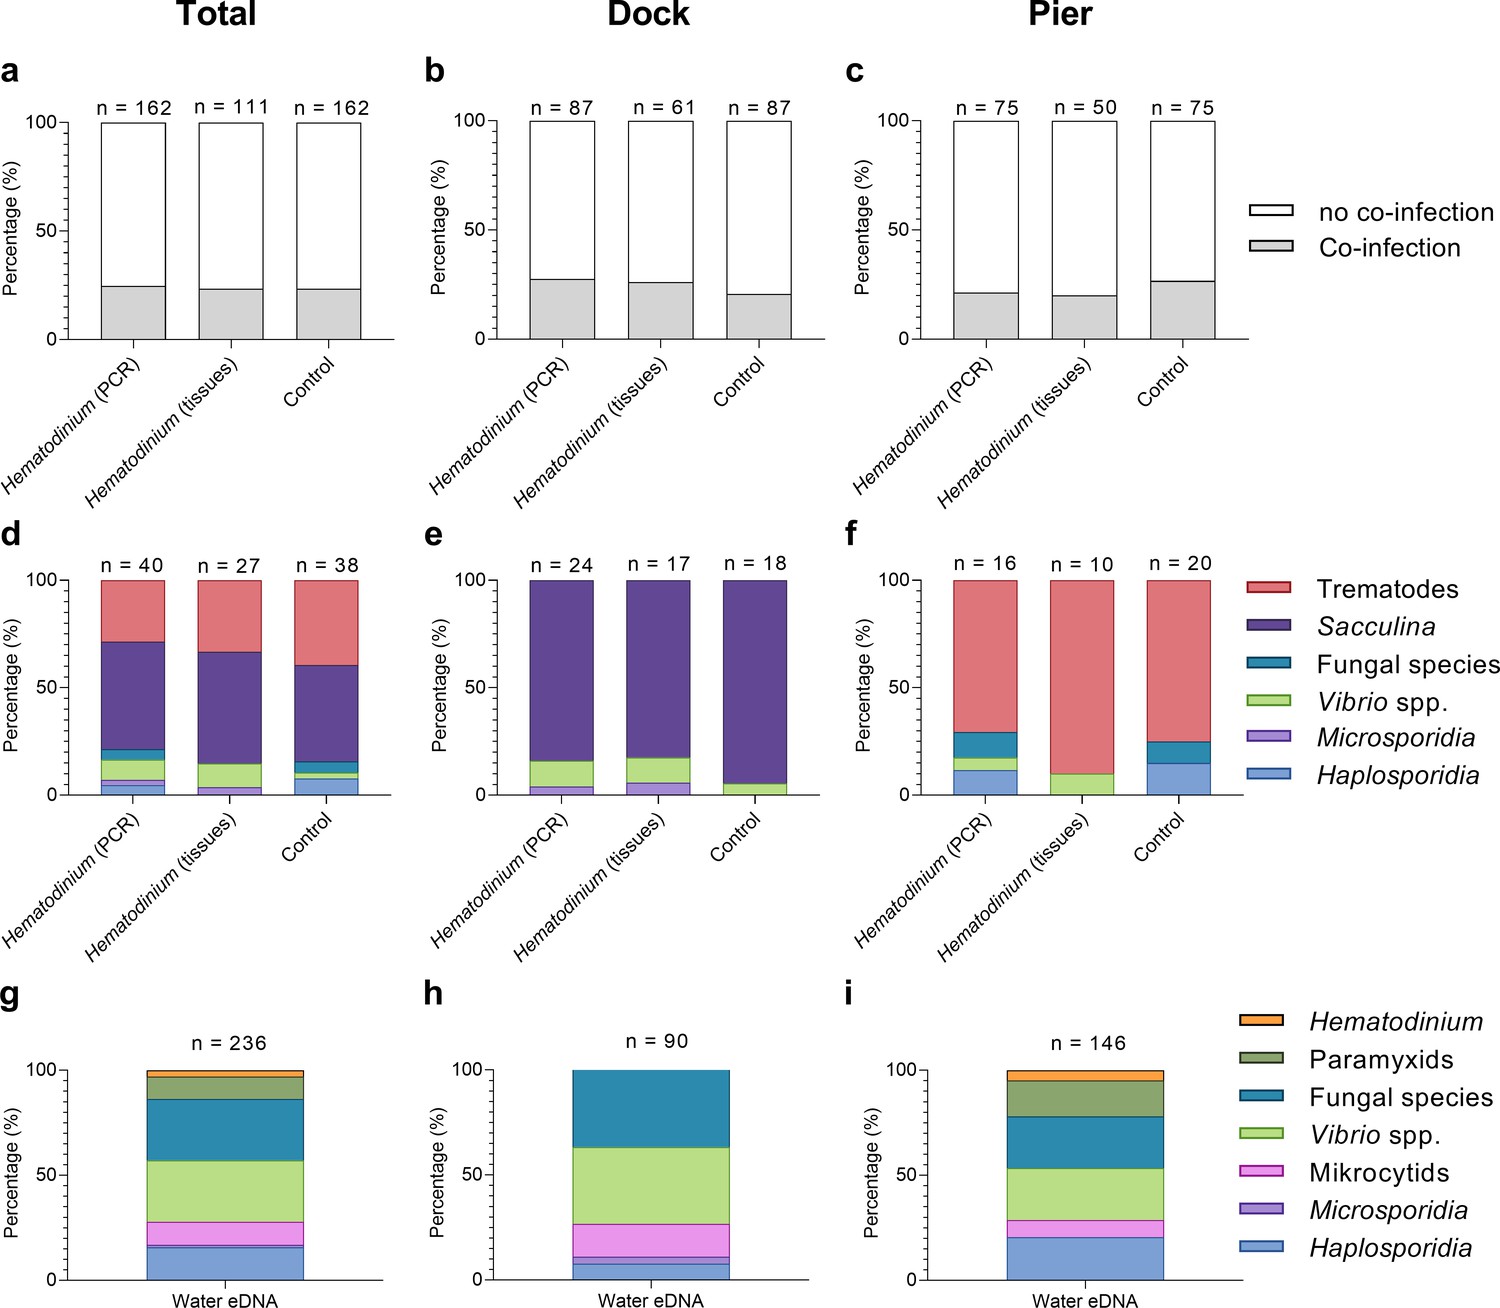
Percentage of Hematodinium-positive and Hematodinium-free (‘control’) crabs with and without collateral infections.
Total population (a), Dock (b), and Pier (c) locations. Composition of co-infection(s) from those crabs which had one or more co-infections in Hematodinium-positive and control crabs in the total population (d), Dock (e), and Pier (f) locations and composition of infections, including Hematodinium, from seawater eDNA in total. (g) Dock (h) and Pier (i) locations from three filter membranes per month over 12 months. Note: trematode and Sacculina carcini presence were not tested for in eDNA samples but via histological examination of crab tissues only. In panels (a–f), crabs are represented by those testing positive for Hematodinium sp. via ‘PCR’ alone (n = 162) which includes subclinical levels of disease, and via liquid/solid ‘tissue’ examination (n = 111), that is, crabs showing subclinical levels of disease are excluded (middle bars).
Figure 3

Diseases of shore crabs, Carcinus maenas, collected from the two reference locations.
(a, b) Dinoflagellate parasite, Hematodinium (arrows), found in the haemolymph (a) and gonadal tissue (b). Scale bars = 10 µm. (c) Co-infected crab with the parasitic barnacle, Sacculina carcini (arrowheads) and Hematodinium (He), in the hepatopancreas. Hepatopancreatic tubules (T). Scale bar = 100 µm. (d) Encysted digenean trematode parasites in the hepatopancreas. Scale bar = 100 µm. (e) Haplosporidium carcini infection showing uninucleate forms (arrows) in the haemolymph. Scale bar = 10 µm. (f) Acute co-infection of the crab haemolymph; Hematodinium (arrows) and multiple yeast like fungi. Scale bar = 10 µm. (g) Colony-forming units (CFUs) log transformed [Y = log(y + 1)] of cultivable bacteria in haemolymph of C. maenas in the presence and absence of Hematodinium per location. Values represent mean + 95% CI, * denotes significant difference (p≤0.05).
Figure 4
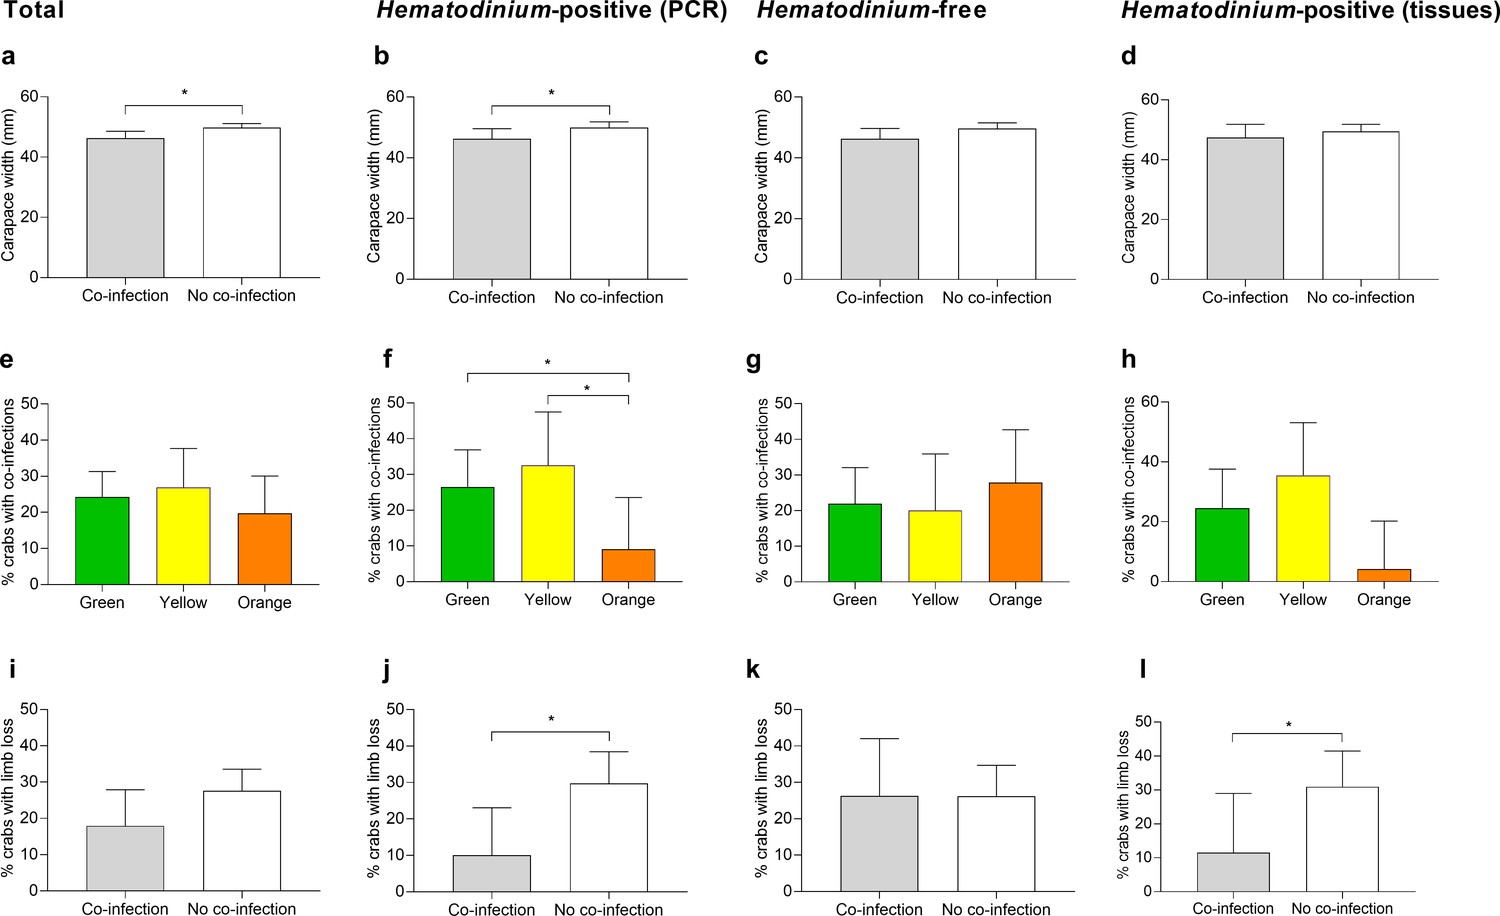
Significant factors associated with the presence of one or more co-infections.
Carapace width (mm) of C. maenas presenting co-infections and those without in the total population (a), Hematodinium-positive by PCR (b), Hematodinium-free ‘controls’ (c), and Hematodinium-positive by haemolymph (tissue) inspection (d). Percentage of C. maenas presenting one or more of the co-infections according to crab colour in the total population (e), Hematodinium-positive by PCR (f), Hematodinium-free ‘controls’ (g), and Hematodinium-positive by tissue inspection (h), and percentage of C. maenas presenting loss of one or more limbs of the total population (i), Hematodinium-positive by PCR (j), Hematodinium-free ‘controls’ (k), and Hematodinium-positive by tissue inspection (l). Values represent mean + 95% CI, * denotes significant difference (p≤0.05).
Figure 5
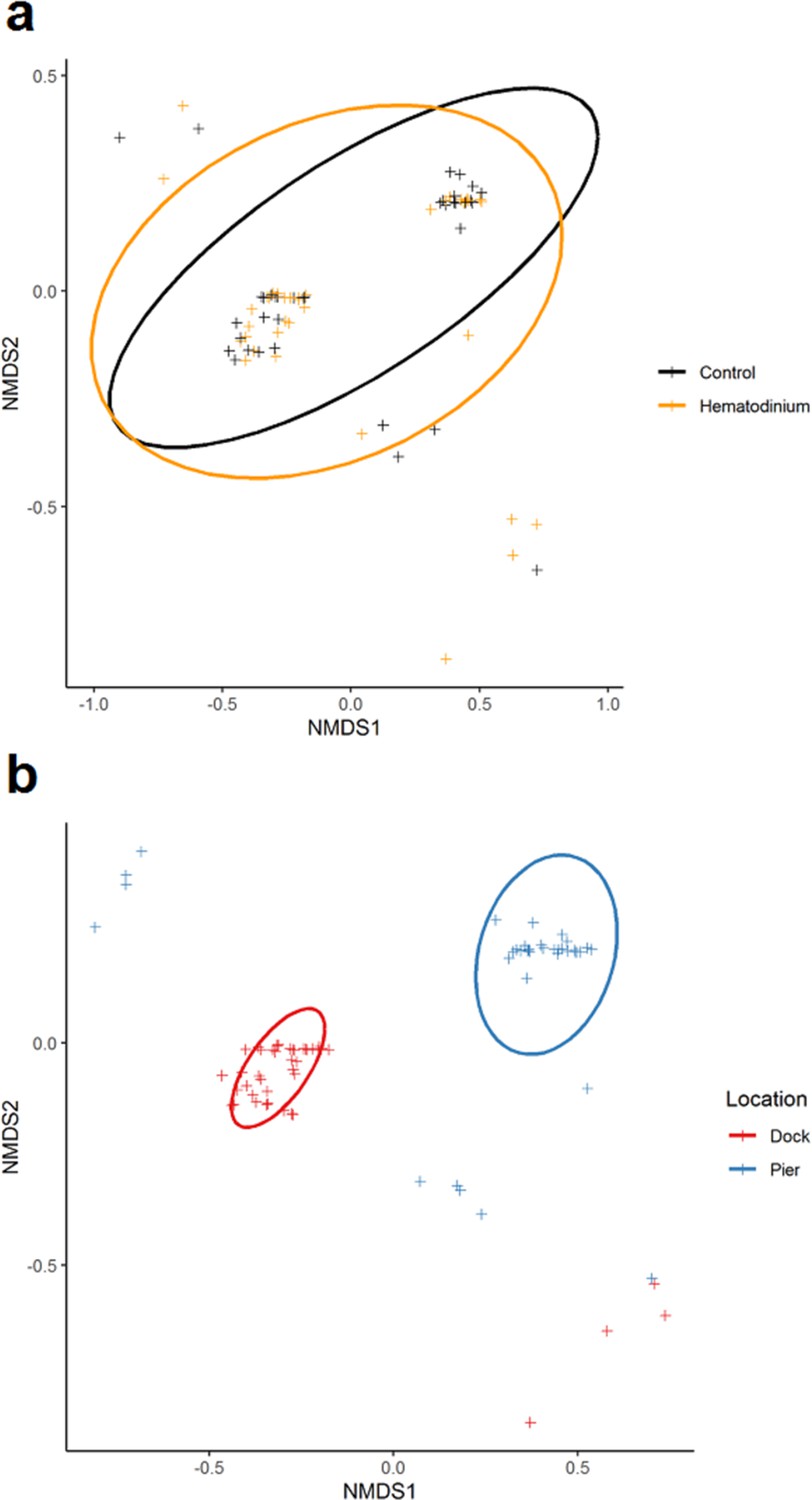
Non-metric multidimensional (nMDS) ordinations of parasite (co-infection) community structure.
(a) nMDS ordination co-infection/parasite (haplosporidians, microsporidians, Vibrio spp., fungal species, Sacculina carcini, and trematodes) community structure in crabs that were Hematodinium sp. positive (orange) and Hematodinium sp. free (black – control). (b) nMDS ordination co-infection/parasite (haplosporidians, microsporidians, Vibrio spp., fungal species, S. carcini, and trematodes) community structure in crabs from the Dock (red) and Pier (blue) locations. Analyses were done using square-root transformation of species’ abundances and Bray–Curtis similarity. Each point denotes an individual crab with one or more co-infections.
Figure 6
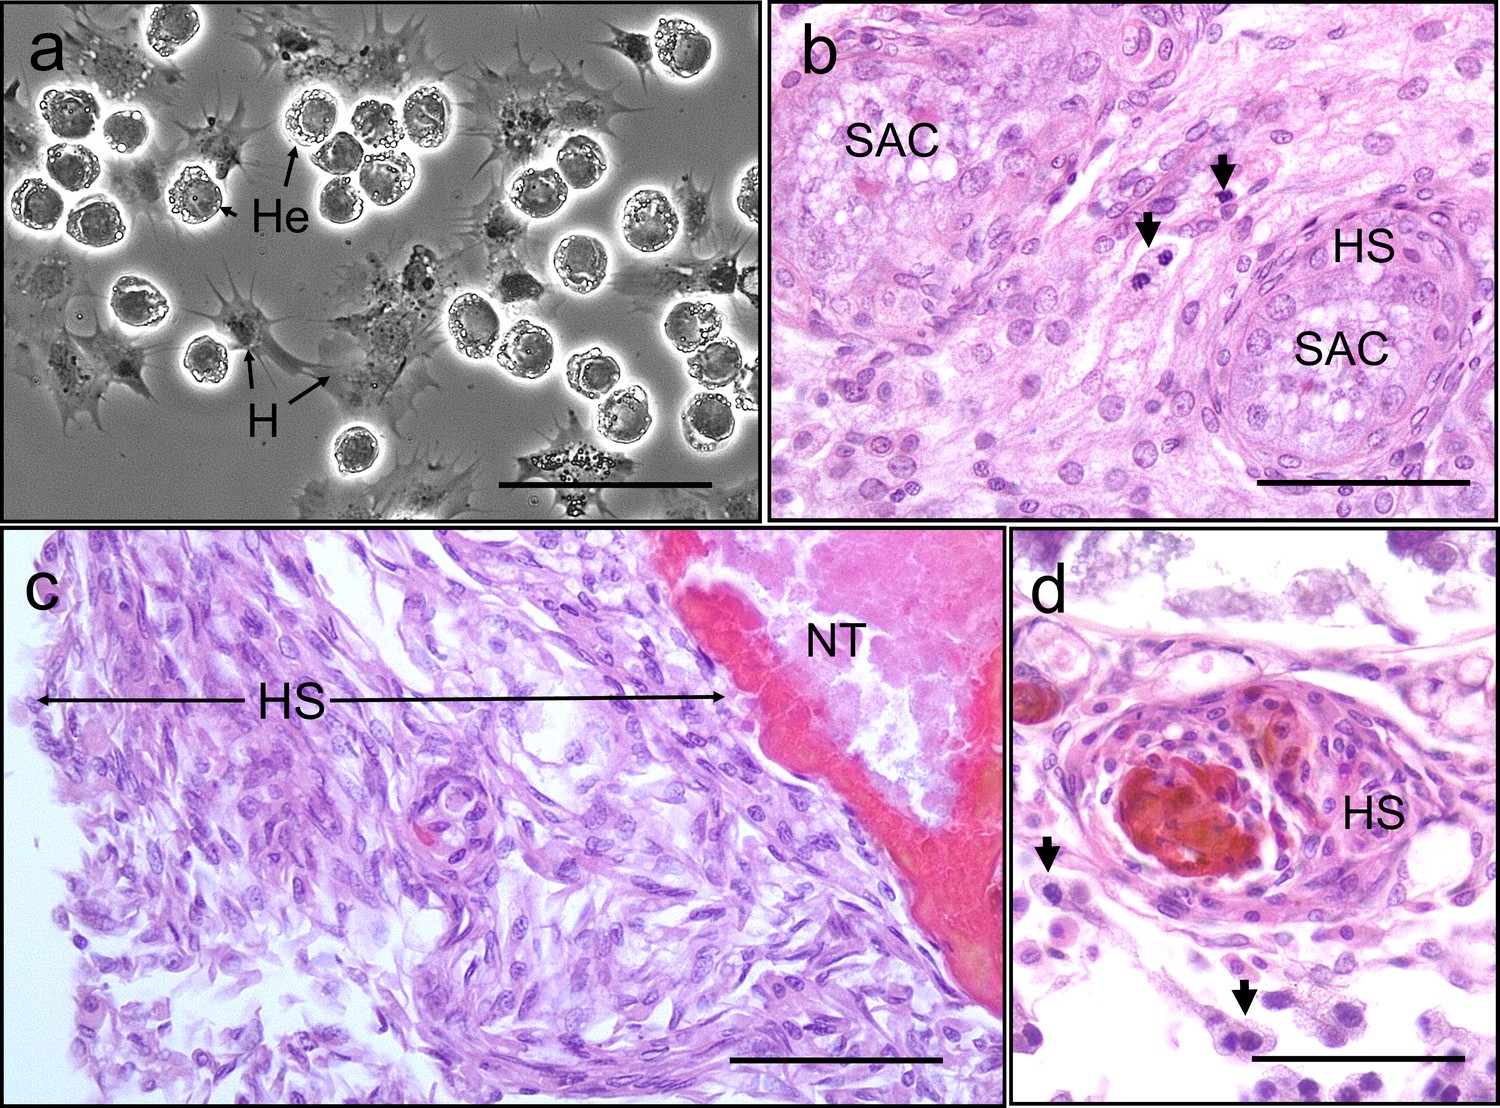
Interaction between Hematodinium and cellular defences of the shore crab, Carcinus maenas.
(a). Phase-contrast micrograph of living cells including Hematodinium trophonts (He) and host’s haemocytes (H). Note the lack of contact and interaction between the trophonts and these immune cells. (b) Host reaction in a crab with co-infection with Hematodinium and the rhizocephalan parasite, Sacculina carcini, with ensheathment by haemocytes (HS) around rootlets of S. carcini (SAC) in the hepatopancreas. Note that the trophonts of Hematodinium (unlabelled arrows) escape incorporation into the sheath around the rhizocephalan. (c) Infiltration and encapsulation of necrotic tissue (NT) in the hepatopancreas of a crab with a severe Hematodinium infection. Note that despite large numbers of this parasite in the adjacent tissues (out of shot) they do not become enmeshed within the large haemocyte sheath (HS). (d) Cellular response of haemocyte ensheathment (HS) around unknown debris. Note the large numbers of Hematodinium (unlabelled arrows) in the surrounding connective tissue but not within the haemocyte sheath. Scale bars = 50 µm.
Appendix 1—figure 1
Haplotype network of partial ITS region (252 bp) from Hematodinium species infecting shore crabs.
In total, 102 Hematodinium sequences from two sites (n = 49/Pier; n = 53/Dock) were analysed. The size of each circle depicted is proportional to the frequency of a haplotype within the dataset. The network was visualised using POPART (Leigh and Bryant, 2015).
Tables
Table 1
Binomial logistic regression models (reduced from the full models, Supplementary file 2—table 1: model S6) testing the effects of biometric and environmental predictor variables on the overall presence of one or more co-infections.
| Model | Predictor variable | Estimate (slope) | SE | p-Value |
|---|---|---|---|---|
| Model 1 | ||||
| CoInfect1 ~ CW + LimbLoss | CW | –0.03368 | 0.01366 | 0.0137* |
| Limb loss | –0.53384 | 0.33121 | 0.1070. | |
| df = 320 | ||||
| AIC: 352.13 | ||||
| Model 2 | ||||
| CoInfect1HEMAT ~ CW + Colour | CW | –0.03928 | 0.01905 | 0.0392* |
| + LimbLoss | Colour (orange) | –1.36238 | 0.66462 | 0.0404* |
| Colour (yellow) | 0.39885 | 0.43242 | 0.3563 | |
| df = 157 | Limb loss | –1.37492 | 0.57801 | 0.0174* |
| AIC: 168.19 | ||||
-
AIC = Akaike information criterion.
-
SE = standard error; CW = carapace width.
-
Statistically significant *p≤0.05.
Table 2
Detection of pathogens and parasites across sites.
| Pathogen | C. maenas | Seawater eDNA | ||
|---|---|---|---|---|
| Dock | Pier | Dock | Pier | |
| Haplosporidia | ✗ | ✓ | ✓ | ✓ |
| Microsporidia | ✓ | ✗ | ✓ | ✗ |
| Mikrocytids | ✗ | ✗ | ✓ | ✓ |
| Paramyxids | ✗ | ✗ | ✗ | ✓ |
| Vibrio spp. | ✓ | ✓ | ✓ | ✓ |
| Fungal species | ✗ | ✓ | ✓ | ✓ |
| Trematode parasites | ✗ | ✓ | NA | NA |
| Sacculina sp. | ✓ | ✗ | NA | NA |
Appendix 1—table 1
Genetic diversity indices of C. maenas COI sequences (481 bp).
| Location | Code | N | H | P | Hd (SD) | π (SD) |
|---|---|---|---|---|---|---|
| Seltjarnarnes, Iceland | ICE | 18 | 1 | 0 | 0 | 0 |
| Torshavn, Faroe Islands | TOR | 19 | 2 | 1 | 0.515 (0.052) | 0.0032 (0.0022) |
| Mongstad, Norway | MON | 22 | 12 | 5 | 0.853 (0.065) | 0.0044 (0.0028) |
| Oslo, Norway | OSL | 9 | 5 | 1 | 0.806 (0.120) | 0.0067 (0.0043) |
| Goteborg, Sweden | GOT | 15 | 10 | 3 | 0.933 (0.045) | 0.0067 (0.0041) |
| Den Helder, the Netherlands | NET | 45 | 17 | 7 | 0.784 (0.059) | 0.0043 (0.0027) |
| Dock, Swansea, UK | DOCK | 45 | 18 | 8 | 0.855 (0.038) | 0.0042 (0.0027) |
| Mumbles Pier, UK | PIER | 48 | 19 | 10 | 0.823 (0.041) | 0.0039 (0.0025) |
| Fowey, England | FOW | 14 | 8 | 3 | 0.890 (0.060) | 0.0047 (0.0031) |
| Bilbao, Spain | BIL | 15 | 6 | 3 | 0.648 (0.134) | 0.0031 (0.0022) |
| Aveiro, Portugal | AVE | 23 | 9 | 3 | 0.795 (0.065) | 0.0037 (0.0025) |
| Cádiz, Spain | CAD | 47 | 21 | 12 | 0.864 (0.042) | 0.0039 (0.0025) |
-
N = number of individuals analysed; H = number of haplotypes; P = private haplotypes; Hd (SD) = haplotype diversity (standard deviation); π (SD), nucleotide diversity (standard deviation).
Appendix 1—table 2
Pairwise genetic differentiation (Fst) of C. maenas samples estimated using COI sequence data.
| 1 ICE | 2 TOR | 3 MON | 4 OSL | 5 GOT | 6 NET | 7 DOCK | 8 PIER | 9 FOW | 10 BIL | 11 AVE | 12 CAD | |
|---|---|---|---|---|---|---|---|---|---|---|---|---|
| 2 | 0.381 | 0.000 | ||||||||||
| 3 | 0.839 | 0.688 | 0.000 | |||||||||
| 4 | 0.859 | 0.670 | 0.022 | 0.000 | ||||||||
| 5 | 0.789 | 0.604 | 0.013 | –0.024 | 0.000 | |||||||
| 6. | 0.802 | 0.678 | 0.019 | 0.064 | 0.038 | 0.000 | ||||||
| 7 | 0.797 | 0.666 | 0.028 | 0.083 | 0.016 | 0.001 | 0.000 | |||||
| 8 | 0.805 | 0.675 | 0.070 | 0.123 | 0.045 | 0.010 | –0.006 | 0.000 | ||||
| 9 | 0.857 | 0.675 | –0.016 | 0.015 | –0.018 | –0.019 | –0.012 | 0.003 | 0.000 | |||
| 10 | 0.902 | 0.730 | 0.054 | 0.118 | 0.067 | –0.018 | 0.006 | 0.007 | 0.012 | 0.000 | ||
| 11 | 0.859 | 0.710 | –0.006 | 0.068 | 0.040 | –0.013 | 0.001 | 0.027 | –0.011 | –0.012 | 0.000 | |
| 12 | 0.821 | 0.710 | 0.032 | 0.108 | 0.103 | 0.005 | 0.042 | 0.057 | 0.016 | –0.009 | –0.006 | 0.000 |
-
Values in bold are statistically significant (p<0.05).
Appendix 1—table 3
Genetic diversity indices of Hematodinium sp.
ITS-1 sequences from infected C. maenas collected in the Swansea Dock and in the Mumbles Pier during winter, spring, summer, and autumn.
| Location | Season | n | h | Hd (SD) | π (SD) |
|---|---|---|---|---|---|
| Pier | Winter | 8 | 3 | 0.464 (0.200) | 0.0305 (0.0182) |
| Spring | 20 | 15 | 0.958 (0.033) | 0.0180 (0.0105) | |
| Summer | 13 | 11 | 0.961 (0.050) | 0.0201 (0.0123) | |
| Autumn | 8 | 8 | 1.000 (0.0625) | 0.0191 (0.0120) | |
| Total | 49 | 31 | 0.917 (0.0343) | 0.0199 (0.0109) | |
| Dock | Winter | 13 | 9 | 0.872 (0.091) | 0.0322 (0.0181) |
| Spring | 14 | 11 | 0.934 (0.061) | 0.0261 (0.0149) | |
| Summer | 15 | 15 | 1.000 (0.024) | 0.0289 (0.0162) | |
| Autumn | 11 | 10 | 0.982 (0.046) | 0.0274 (0.0159) | |
| Total | 53 | 41 | 0.951 (0.025) | 0.0274 (0.0146) | |
| Both sites | Overall | 102 | 70 | 0.935 (0.021) | 0.0228 (0.0122) |
-
n = number of individuals analysed; h = number of haplotypes; P = private haplotypes; Hd (SD) = haplotype diversity (standard deviation); π (SD), nucleotide diversity (standard deviation).
Appendix 2—table 1
Forward (Fwd) and reverse (Rev) primer sequences used for the amplification of pathogens from C. maenas and host DNA, by PCR.
Each PCR run included initial denaturation and final extension steps, according to the first and final temperatures, respectively, noted in the thermocycler settings.
| Target pathogen (Reference) | Primers | Cycling conditions | |||
|---|---|---|---|---|---|
| Dir. | Name | Sequence (5'–3') | Final conc. (µM) | Temp (°C) | Time | Cycles | |
| Hematodinium sp. (Gruebl et al., 2002) | For, HematF1487: | 0.5 | 94 | 10 min | 30 |
| CCTGGCTCGATAGAGTTG | 94 | 15 s | |||
| Rev, HematR1654: | 54 | 15 s | |||
| GGCTGCCGTCCGAATTATTCAC | 72 | 30 s | |||
| [Amplicon size, 187 bp] | 72 | 10 min | |||
| Fungi (Gardes and Bruns, 1993; White et al., 1990) | For, ITS1F: | 0.4 | 95 | 2 min | 30 |
| CTTGGTCATTTAGAGGAAGTAA | 95 | 30 s | |||
| Rev, ITS2: | 55 | 30 s | |||
| GCTGCGTTCTTCATCGATGC | 72 | 1 min | |||
| [Amplicon size, 320 bp] | 72 | 10 min | |||
| Haplosporidia spp. (round 1) (Hartikainen et al., 2014a ) | For, C5fHap: | 1 | 95 | 5 min | 30 |
| GTAGTCCCARCYATAACBATGTC | 95 | 30 s | |||
| Rev, Sb1n: | 65 | 45 s | |||
| GATCCHTCYGCAGGTTCACCTACG | 72 | 1 min | |||
| [Amplicon size, NA bp] | 72 | 10 min | |||
| Haplosporidia spp. (round 2) (Hartikainen et al., 2014a) | For, V5fHapl: | 1 | 95 | 5 min | 30 |
| GGACTCRGGGGGAAGTATGCT | 95 | 30 s | |||
| Rev, Sb2nHap: | 65 | 45 s | |||
| CCTTGTTACGACTTBTYCTTCCTC | 72 | 1 min | |||
| [Amplicon size, 650 bp] | 72 | 10 min | |||
| Mikrocytids (round 1) (Hartikainen et al., 2014b) | For, mik451F: | 0.5 | 95 | 5 min | 30 |
| GCCGAGAYGGTTAAWGAGCCTCCT | 95 | 30 s | |||
| Rev, mik1511R: | 64 | 45 s | |||
| CCTATTCAGCGCGCTCTGTTGAGA | 72 | 1 min | |||
| [Amplicon size, 967 bp] | 72 | 10 min | |||
| Mikrocytids (round 2) (Hartikainen et al., 2014b) | For, mik868F: | 0.5 | 95 | 5 min | 30 |
| GGACTACCAGWGGCGAAAGCGCCT | 95 | 30 s | |||
| Rev, mik1340R: | 62 | 45 s | |||
| TGCATCACGGACCTACCTTWGACC | 72 | 1 min | |||
| [Amplicon size, 481 bp] | 72 | 10 min | |||
| Vibrio spp. (Thompson et al., 2004; Vezzulli et al., 2012) | For, 567 F: | 0.5 | 94 | 10 min | 30 |
| GGCGTAAAGCGCATGCAGGT | 94 | 30 s | |||
| Rev, 680 R: | 58 | 30 s | |||
| GAAATTCTACCCCCCTCTACAG | 72 | 1 min | |||
| [Amplicon size, 113 bp] | 72 | 10 min | |||
| Microsporidia (Fedorko et al., 1995; Stentiford et al., 2018) | For, CTMicrosp-G: | 0.5 | 94 | 5 min | 35 |
| CACCAGGTTGATTCTGCCTGAC | 94 | 30 s | |||
| Rev, Microsp1342r: | 63 | 30 s | |||
| ACGGGCGGTGTGTACAAAGAACAG | 72 | 90 s | |||
| [Amplicon size, 1100–1300 bp] | 72 | 10 min | |||
| Paramyxid (round 1) (Ward et al., 2016 ) | For, Para1+ fN: | 1 | 95 | 3 min | 42 |
| GCGAGGGGTAAAATCTGAT | 95 | 30 s | |||
| Rev, ParaGENrDBn: | 67 | 1 min | |||
| GTGTACAAAGGACAGGGACT | 72 | 1 min | |||
| [Amplicon size, NA bp] | 72 | 5 min | |||
| Paramyxid (round 2) (Ward et al., 2016) | For, Para3+ fN: | 1 | 95 | 3 min | 42 |
| GGCTTCTGGGAGATTACGG | 95 | 30 s | |||
| Rev, Para2+ rN: | 62 | 1 min | |||
| TCGATCCCRACTGRGCC | 75 | 1 min | |||
| [Amplicon size, 450 bp] | 75 | 5 min | |||
| Cytochrome c oxidase I (COI) gene (Roman and Palumbi, 2004) | For, Cm_F: | 0.5 | 94 | 2 min | 30 |
| GCTTGAGCTGGCATAGTAGG | 94 | 1 min | |||
| Rev, Cm_R: | 50 | 1 min | |||
| GAATGAGGTGTTTAGATTTCG | 72 | 1 min | |||
| [Amplicon size, 588 bp] | 72 | 10 min | |||
Additional files
-
Supplementary file 1
Additional data analysis.
Linear regression of Hematodinium intensity in the liquid tissue (parasites per mL haemolymph) log transformed [Y = log(y + 1)] (liquid tissues) against average histology severity rating from gills and hepatopancreas (solid tissues) for infection severity (n = 108).
- https://cdn.elifesciences.org/articles/70356/elife-70356-supp1-v1.docx
-
Supplementary file 2
Statistical outputs from full binomial logistic regression models using Hematodinium-positive crabs determined via PCR alone n = 162 (table 1, models S1–S6) and models run using crabs with clinical signs of Hematodinium sp. (n = 111) determined via PCR as well as liquid/sold tissue inspections, and intensity of Hematodinium sp. infection (table 2, models S7–S14).
- https://cdn.elifesciences.org/articles/70356/elife-70356-supp2-v1.docx
-
Supplementary file 3
Additional data analysis. Non-metric multidimensional (nMDS) ordination collateral infection community structure(s) in crabs that were Hematodinium sp. positive (orange) for clinical signs of disease (diagnosed by PCR as well as liquid/tissue inspection), and Hematodinium sp. free (black – control), and collateral infection community structure(s) in crabs from the Dock (red) and Pier (blue) locations.
- https://cdn.elifesciences.org/articles/70356/elife-70356-supp3-v1.docx
-
Supplementary file 4
Complete list of BLAST search results and genetic identifiers for all ‘collateral infections’ amplified via PCR and sequenced using Sanger’s method.
- https://cdn.elifesciences.org/articles/70356/elife-70356-supp4-v1.docx
-
Transparent reporting form
- https://cdn.elifesciences.org/articles/70356/elife-70356-transrepform1-v1.docx
-
Source data 1
Data underpinning Figures 2–5.
- https://cdn.elifesciences.org/articles/70356/elife-70356-data1-v1.xlsx
-
Source code 1
(‘R’) for BLR models.
- https://cdn.elifesciences.org/articles/70356/elife-70356-code1-v1.zip
-
Source code 2
(‘R’) for revised BLR models (excluding subclinical).
- https://cdn.elifesciences.org/articles/70356/elife-70356-code2-v1.zip
Download links
A two-part list of links to download the article, or parts of the article, in various formats.
Downloads (link to download the article as PDF)
Open citations (links to open the citations from this article in various online reference manager services)
Cite this article (links to download the citations from this article in formats compatible with various reference manager tools)
Hematodinium sp. infection does not drive collateral disease contraction in a crustacean host
eLife 11:e70356.
https://doi.org/10.7554/eLife.70356


