Sterically confined rearrangements of SARS-CoV-2 Spike protein control cell invasion
- Center for Theoretical Biological Physics, Rice University, United States
- Department of Physics and Astronomy, Rice University, United States
- Department of Chemistry, Rice University, United States
- Department of Biosciences, Rice University, United States
- Center for Theoretical Biological Physics, Northeastern University, United States
- Department of Physics, Northeastern University, United States
Figures
Figure 1
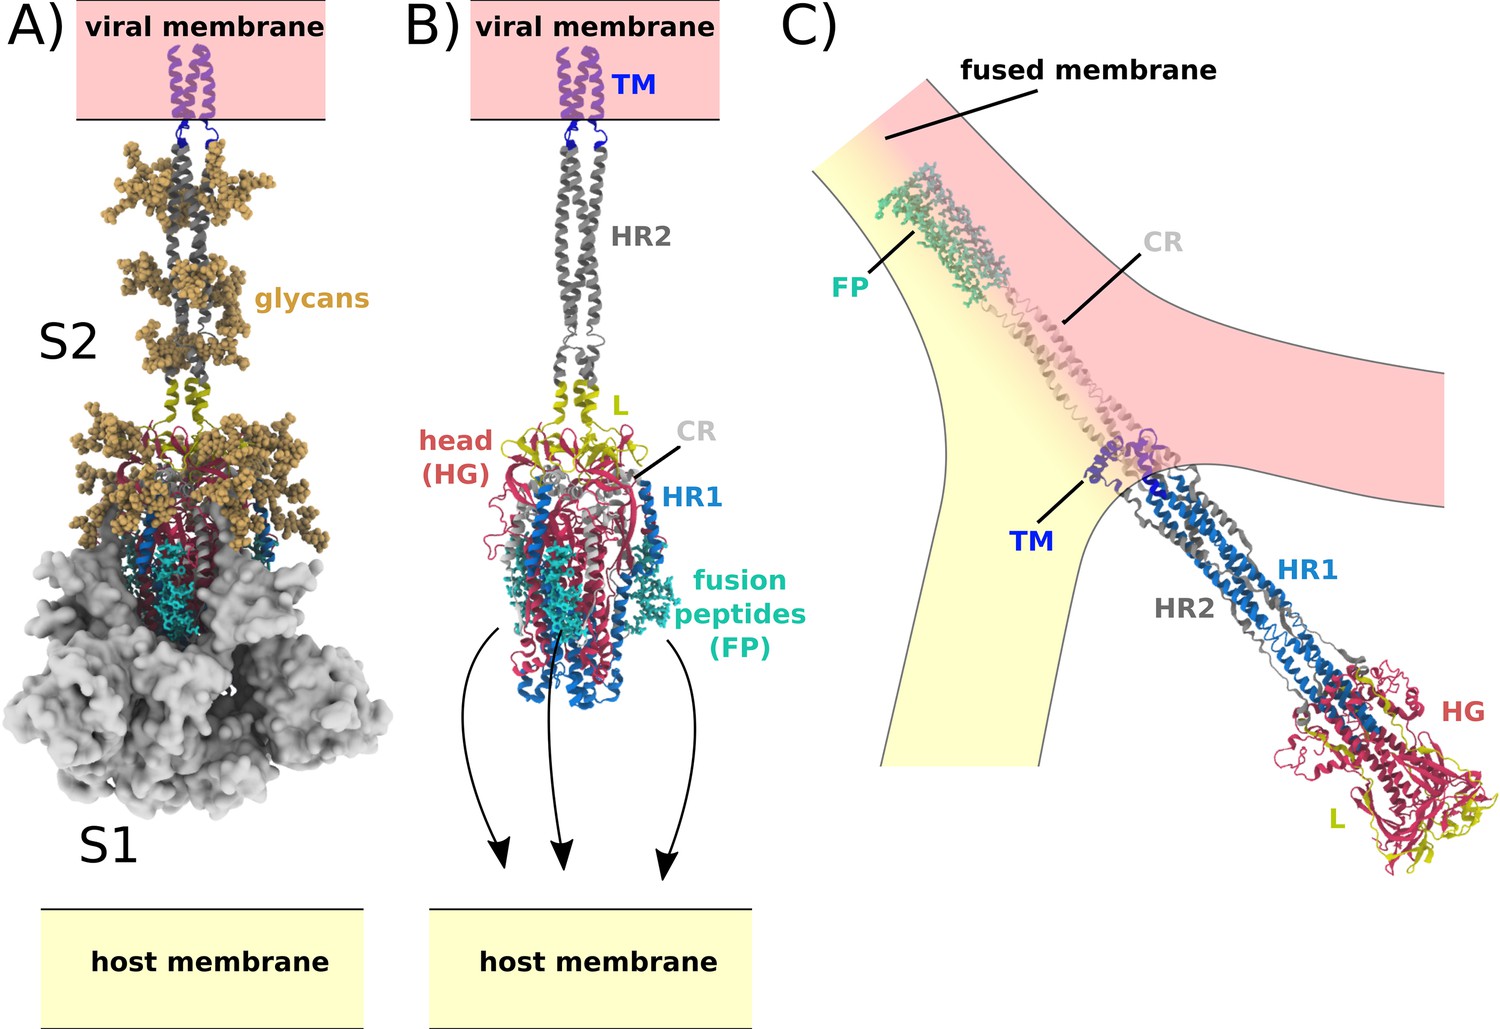
Spike-protein-mediated membrane fusion.
(A) The active Spike protein assembly is composed of the subunits S1 (white surface) and S2 (cartoon representation) (Walls et al., 2020), which remain bound through nonbonded interactions. Numerous glycosylation sites (glycans shown in orange) are present in the Head Group (HG) and Heptad Repeat 2 (HR2) regions. The modeled glycans are consistent with previous studies (Casalino et al., 2020; Turoňová et al., 2020). (B) Upon recognition of the ACE2 receptor and cleavage at the S2’ site, S1 dissociates. In addition to the HG and HR2 regions, S2 is composed of the Heptad Repeat 1 (HR1), Linker (L), Fusion Peptide (FP), Connector (CR), and Transmembrane (TM) regions. Since the HR2 and TM regions were not resolved in the prefusion structure (PDB ID: 6VXX [Walls et al., 2020]), they were modeled as a helical bundle, consistent with previous studies (Casalino et al., 2020). (C) Release of S1 allows for the FPs to associate with and recruit the host membrane. The HG and HR1 regions undergo a large-scale rotation (>90 degrees), which leads to fusion of the host and viral membranes. Since the CR and FP regions were not resolved in the postfusion structure (PDB ID: 6M3W [Fan et al., 2020]), they were modeled as an extended helical bundle.
Figure 2
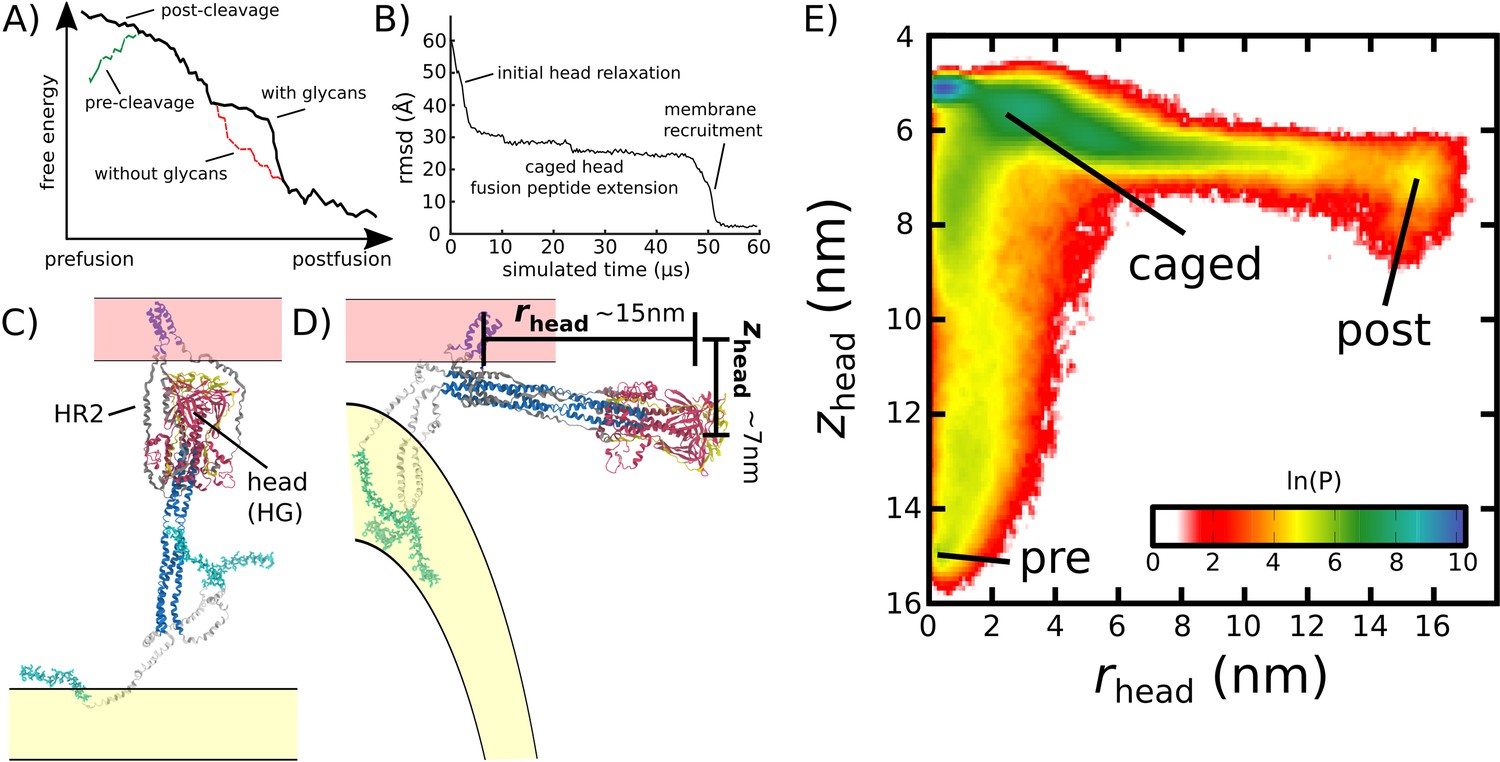
Simulating Spike-protein-mediated membrane fusion. Simulations with an all-atom structure-based model (Whitford et al., 2009; Noel et al., 2016) allow for transitions between prefusion and postfusion configurations to be observed.
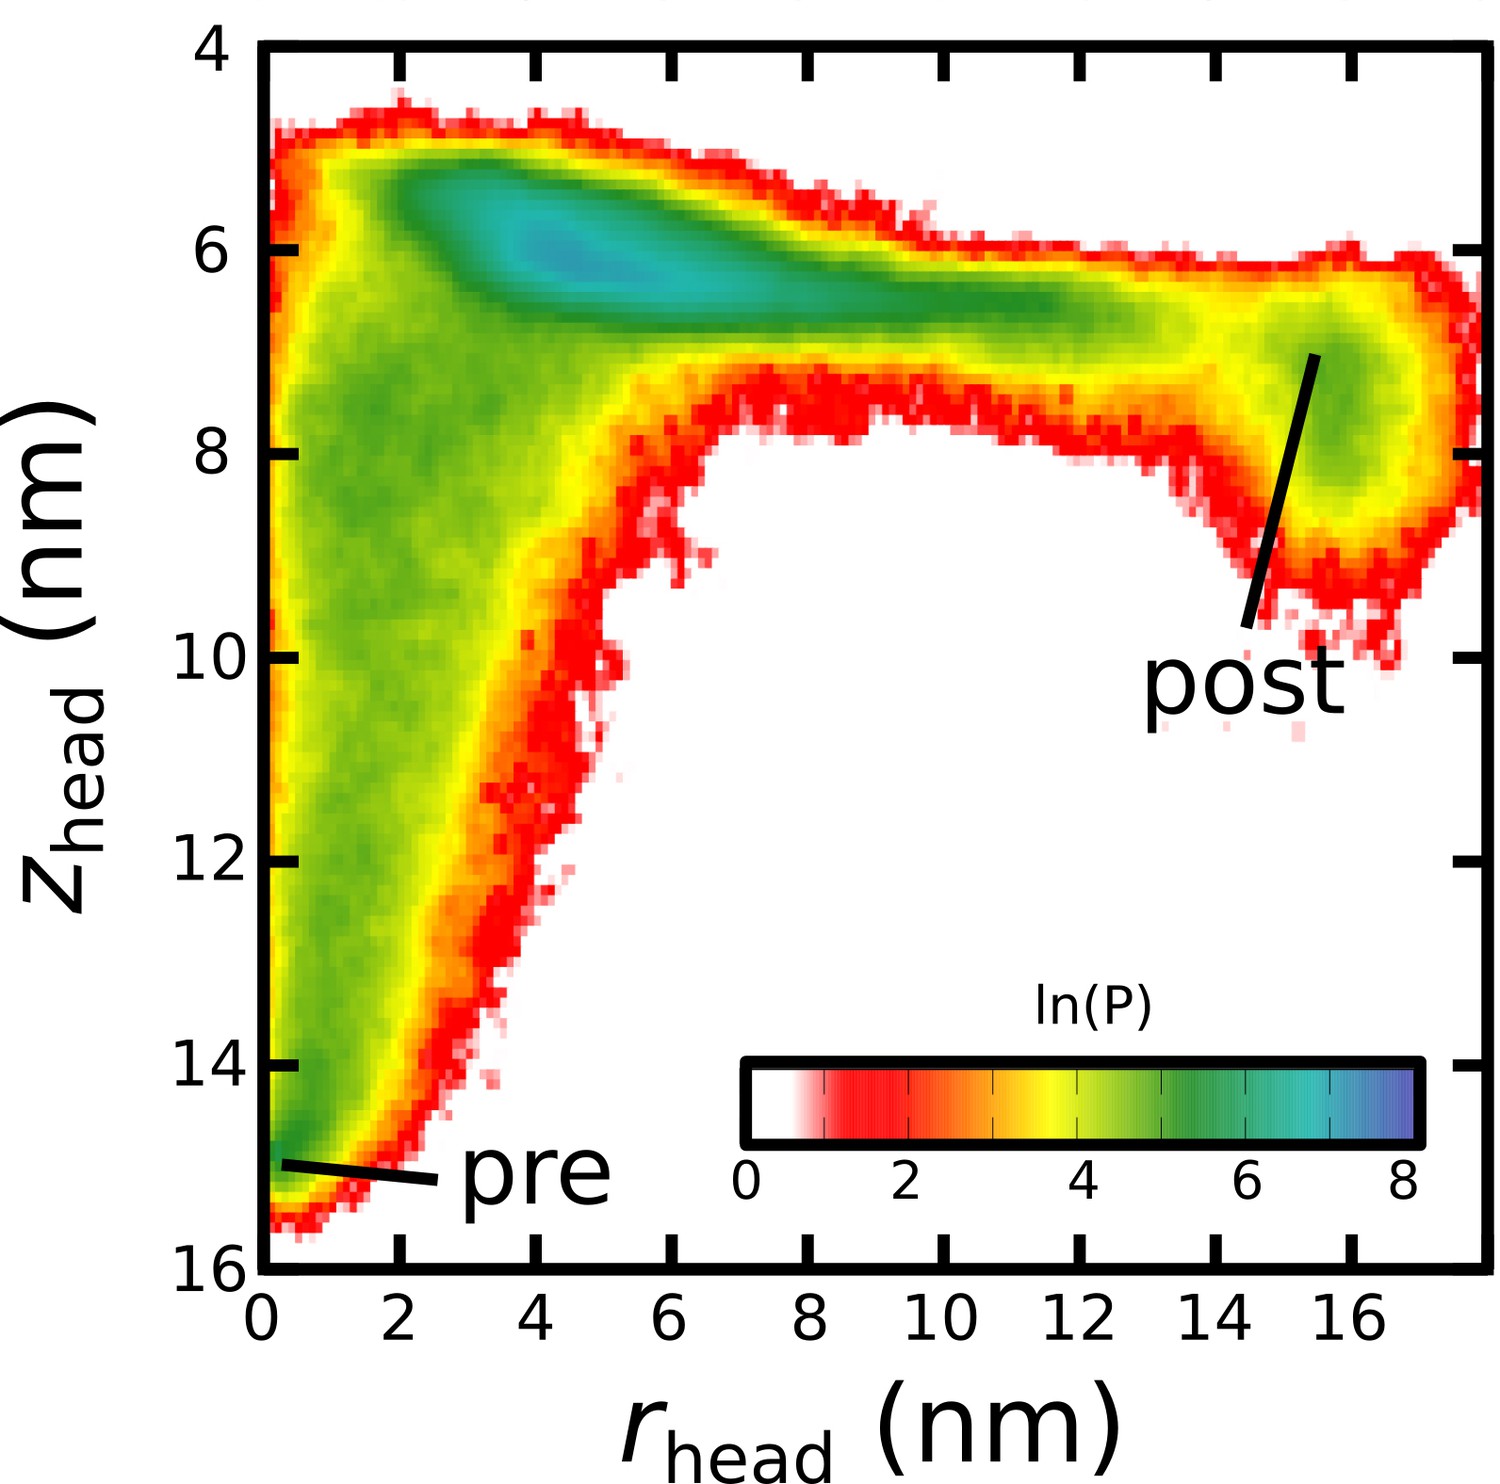
(A) Schematic representation of the energetics in the structure-based model. The postfusion configuration was defined as the global potential energy minimum. The pre-cleavage state (green) is assumed to be stable, where cleavage and release of S1 leads to an unstable prefusion configuration (black). While, in the employed model, stabilizing energetic terms favor the postfusion configuration, steric interactions between the protein and glycans may impede the motion (black vs. red). (B) Representative simulation (1 of 1000) of the pre-to-post transition. Spatial rmsd from the post configuration (excluding TM, CR, and FPs) is shown, as a function of time. The simulation included explicit glycans, as well as an effective viral membrane potential. (C) After an initial relaxation phase (panel B), the head (red) appears to become caged by the HR2 strands (gray), allowing it to sample configurations near the viral membrane (pink). While the host membrane (yellow) was not included in the simulations, it is depicted for illustrative purposes. (D) After reaching the caged ensemble, the head escapes and the HR1-HR2 superhelix assembles. The position of the head group, relative to the TM region (blue), is described by the cylindrical coordinates rhead and zhead. The origin is defined as the geometric center of TM, and the cylindrical axis is perpendicular to the viral membrane. See Materials and methods for details. (E) Probability distribution of simulated events (with glycans) reveals an obligatory cage-like intermediate.
Figure 3
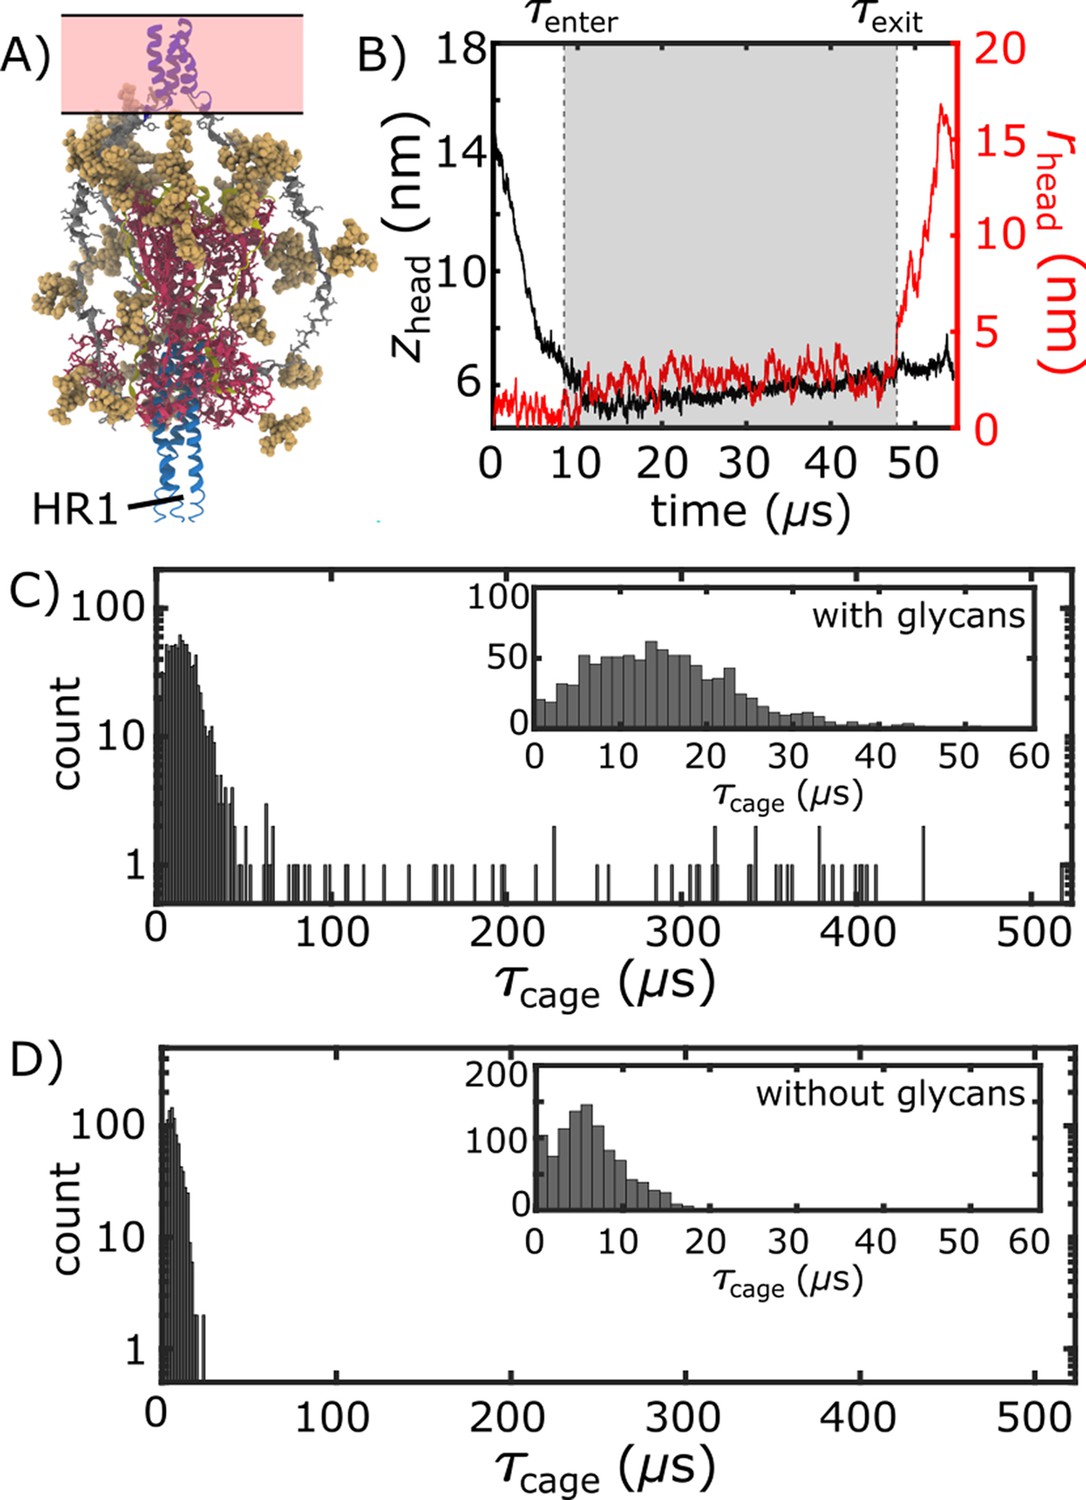
Glycan-induced caging of the head domain. Glycans impede head rearrangement by introducing a steric cage.
(A) Snapshot from the caged ensemble illustrates the high density of glycans surrounding the head. (B) To define the duration of each caging event (), we measured zhead and rhead (Figure 2D). Based on the 2D probability distribution (Figure 2E), the system was defined as entering the cage when zhead first drops below 6.5 nm: . is the time at which the head moves laterally, relative to the trans-membrane region ( nm). (C) Distribution of values when glycans are present. There is an extended tail at large values (). (D) When glycans are absent, the values are narrowly distributed around short timescales.
Figure 4
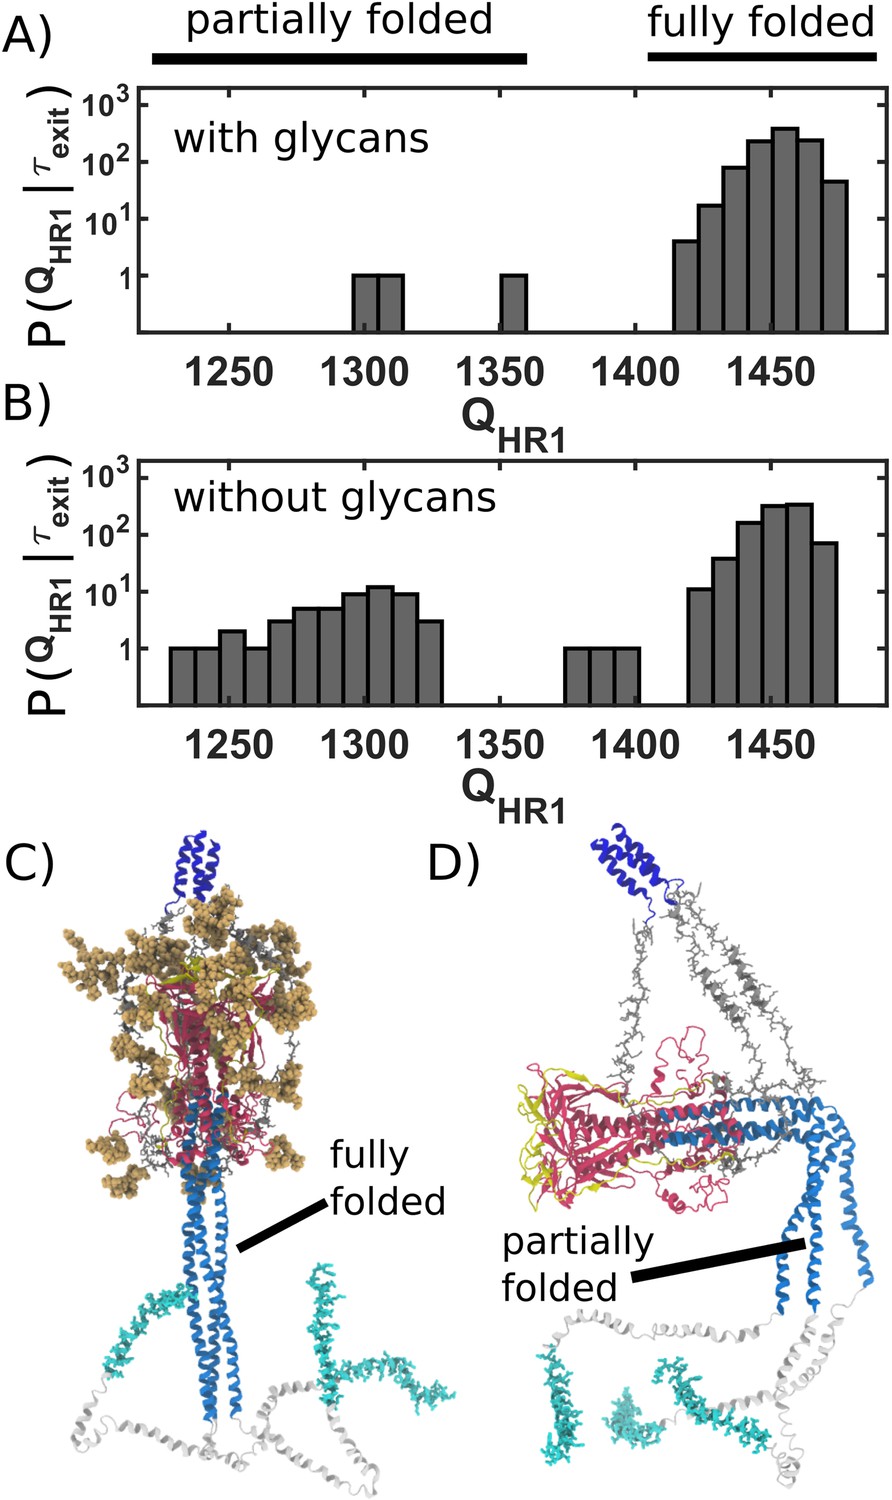
Caging of head allows for extension of HR1 helix.
(A) Distribution of (number of postfusion-specific HR1 contacts) values when glycans are present. Distribution describes the first frame in each simulation for which the head is outside of the steric cage. In all but three simulations, nearly all HR1 contacts (>1420 of 1489) are formed upon exit of the cage. (B) Distribution when glycans are not included. When glycans are absent, it is common that HR1 is not completely formed (i.e. 1350) prior to HG escape. (C) Representative snapshot of a caged structure in which HR1 is fully formed and extended toward the host. (D) Representative snapshot of a glycan-free case where the head escapes prior to fully forming HR1. As a result, HR1 can adopt bent configurations.
Figure 5
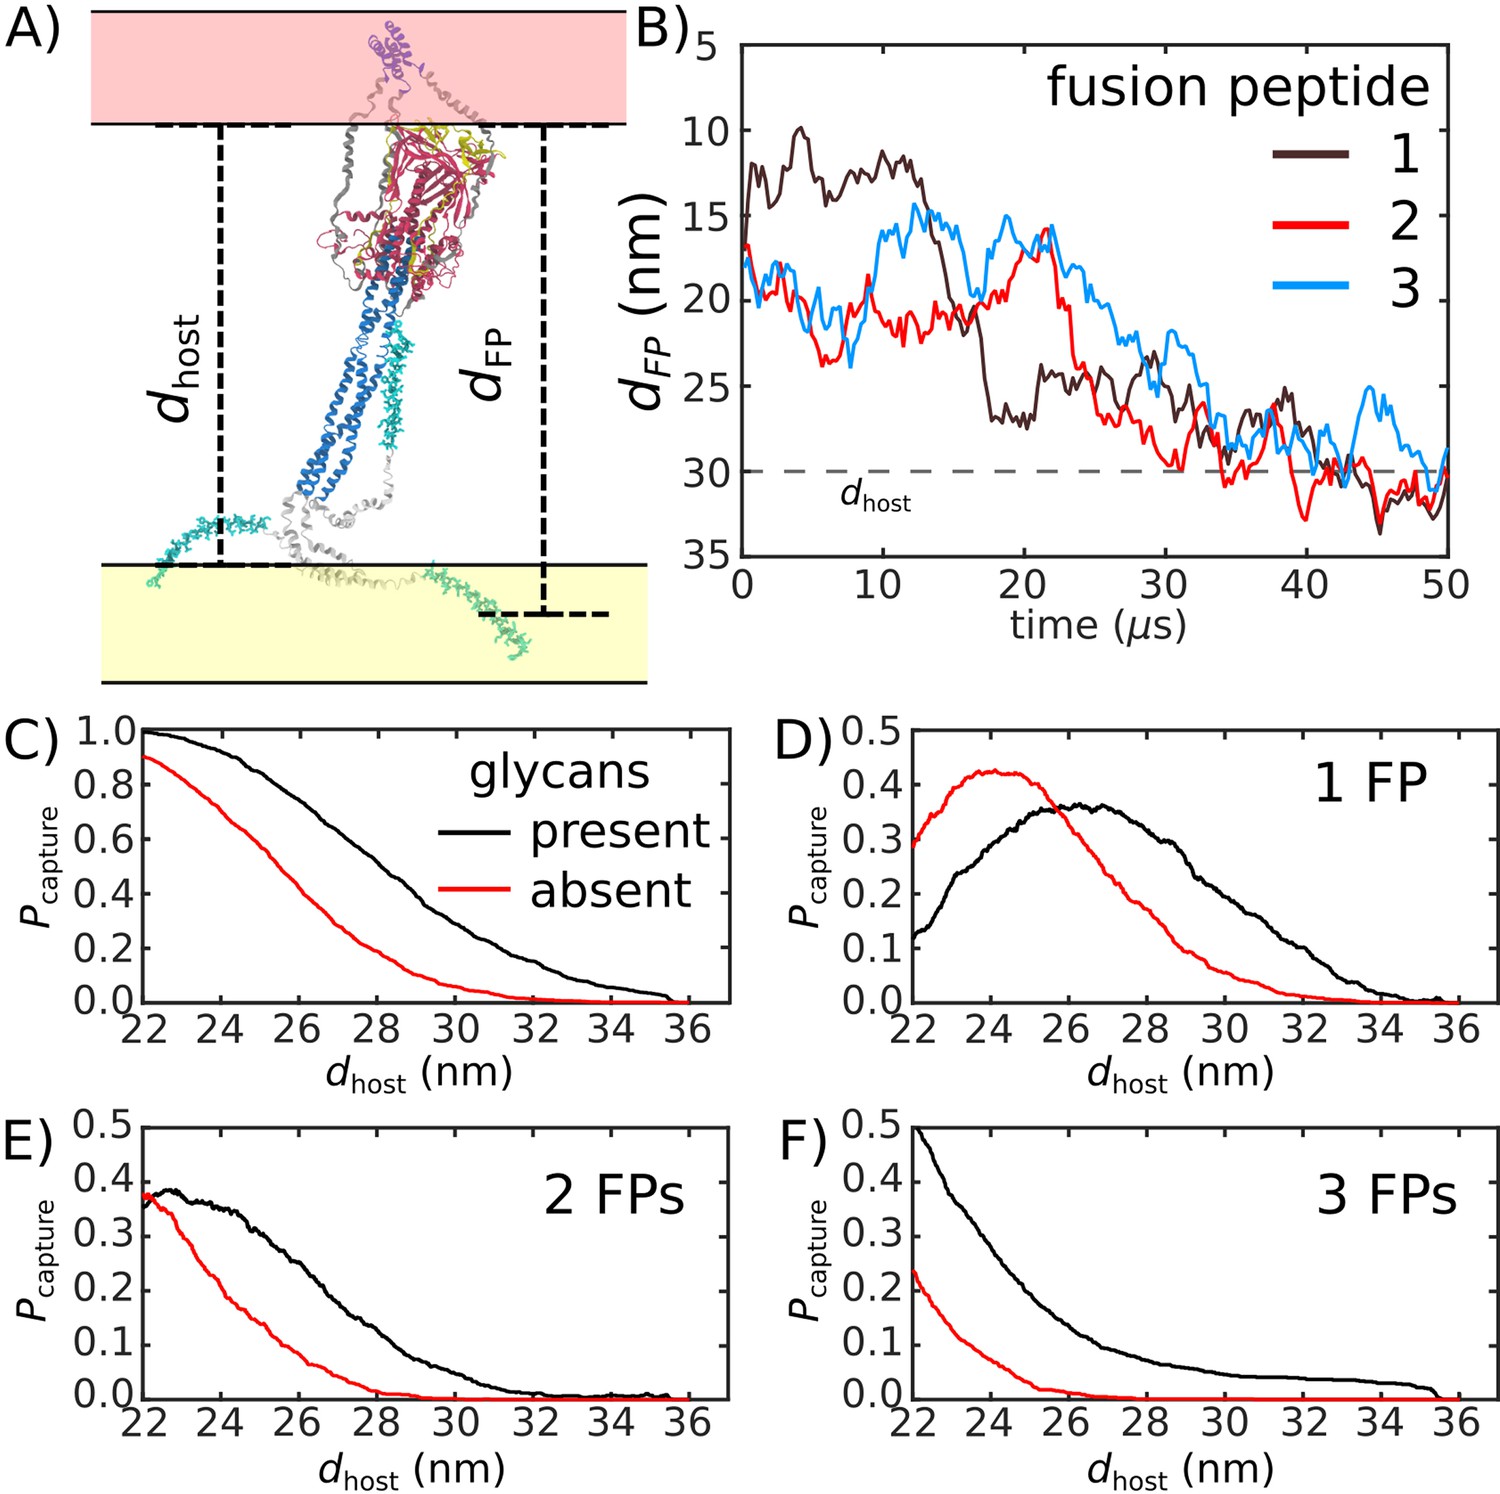
Glycans promote host capture.
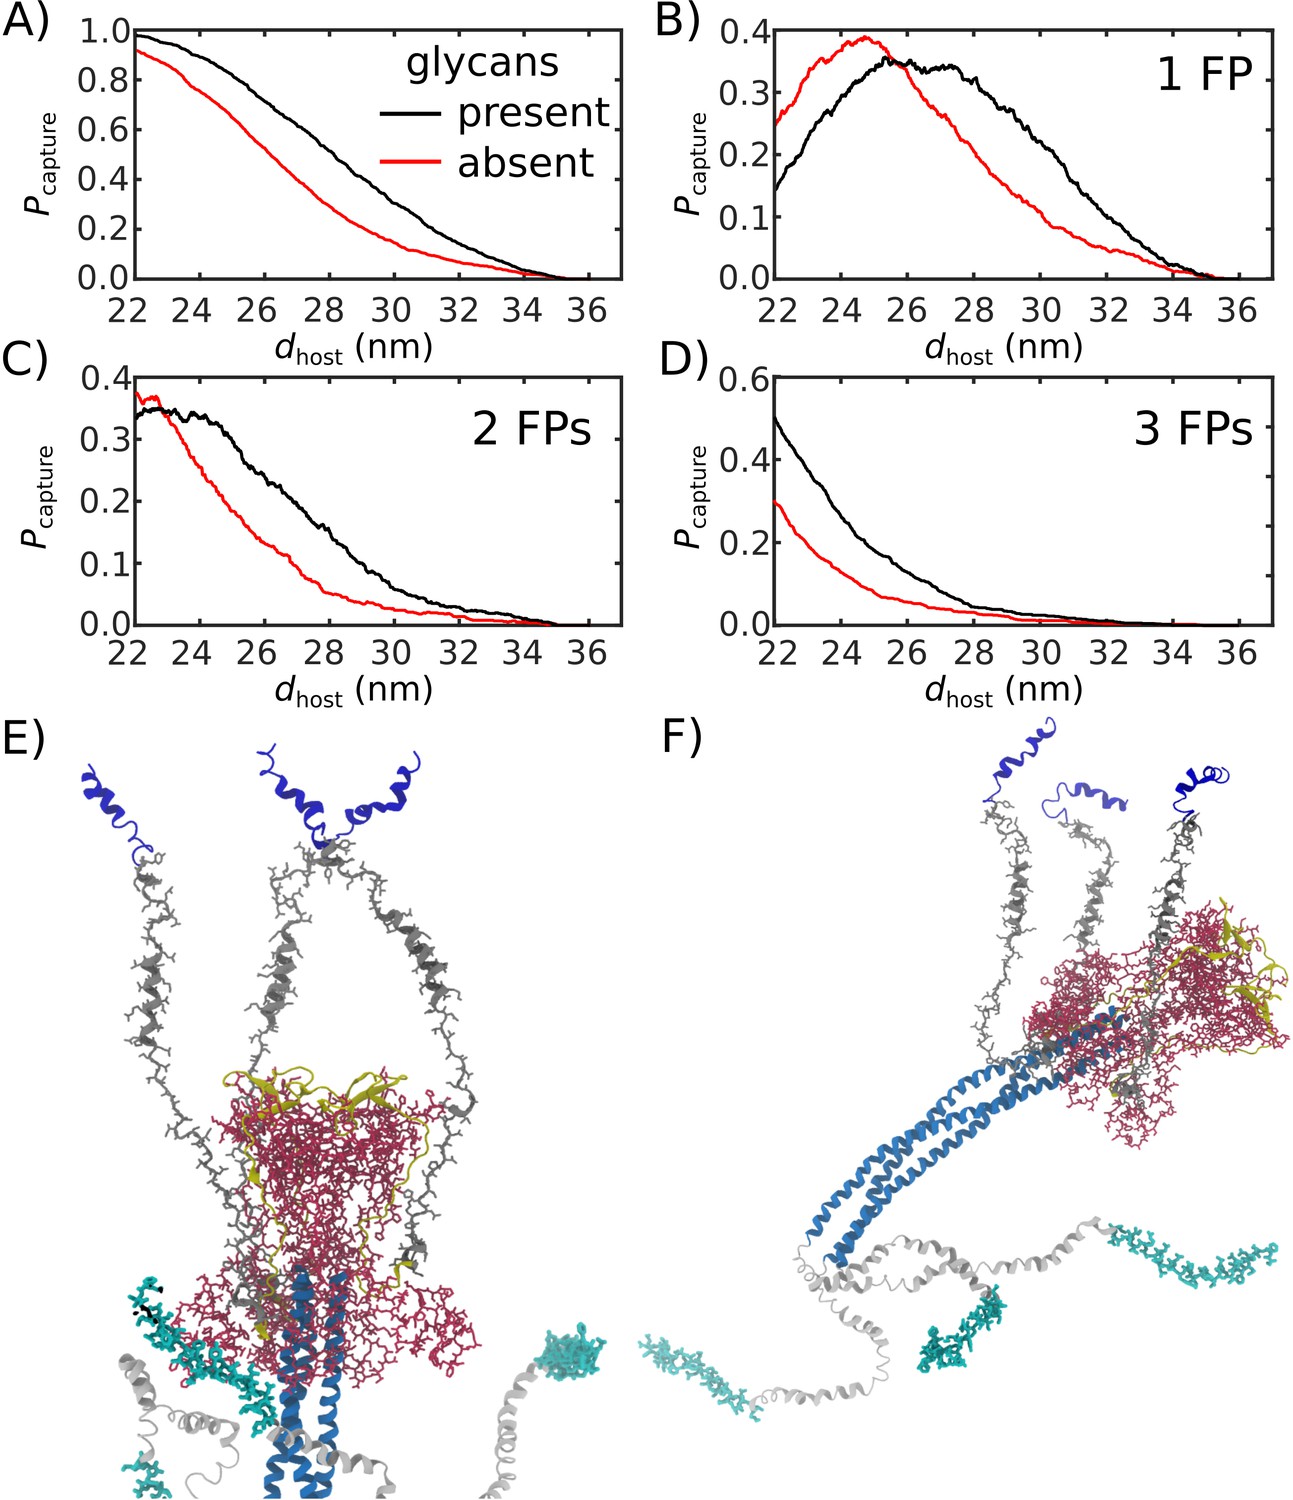
(A) Snapshot of the glycosylated Spike protein with the head domain in a caged configuration (glycans not shown). Caging allows the fusion peptide tails to extend toward and engage the host membrane. is the distance of the center of mass of each fusion peptide from the viral membrane surface. To calculate the probability of host capture, different values of the virion-host distance (dhost) were considered. (B) Representative simulated trajectory, showing for each of the fusion peptides in a single S2 subunit. For reference, a dhost value of 30 nm is indicated by a dashed line. (C) The probability of membrane fusion is expected to be proportional to the probability that at least one tail extends to the host membrane (). There is a higher probability of extending to larger dhost values when glycans are present (black vs. red curves). This is due to the glycan-induced delay of head rotation (Figure 2), which ensures the HR1 helix remains directed towards the host as the FPs sample extended configurations. (D–F) The probability that 1, 2, or 3 FPs exceed dhost. In all cases, the presence of glycans shifts the distribution to larger values of dhost, indicating an increased probability of capturing the host. This reveals a critical role for glycans during cell invasion.
Figure 6
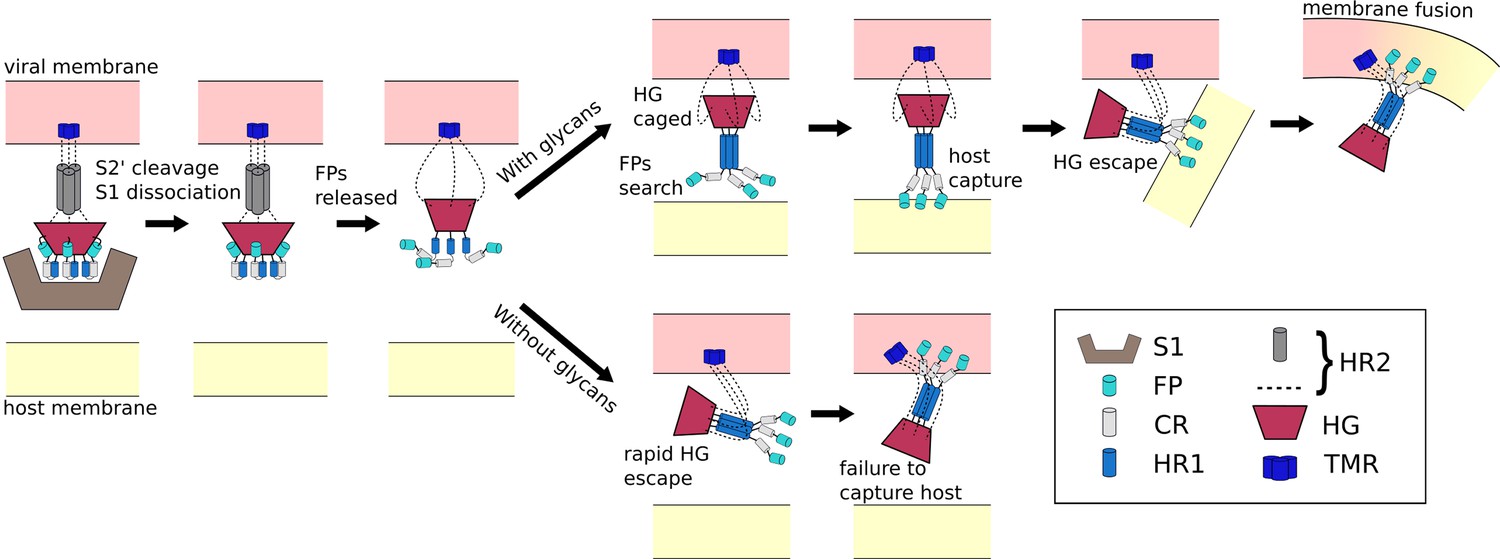
Schematic of fusion mechanism of the Spike protein.
Initial activation of the Spike protein (left) is associated with release of S1, which is triggered by cleavage at the S2’ site and ACE2 receptor binding. When glycans are present (top), HG will enter a caged ensemble where the FPs search for, and capture, the host membrane. HG can then escape the cage, which draws the viral and host membranes together and leads to fusion. In the absence of glycans (bottom), HG can bypass the caged ensemble, resulting in a failed attempt to recruit the host.
Appendix 1—figure 1
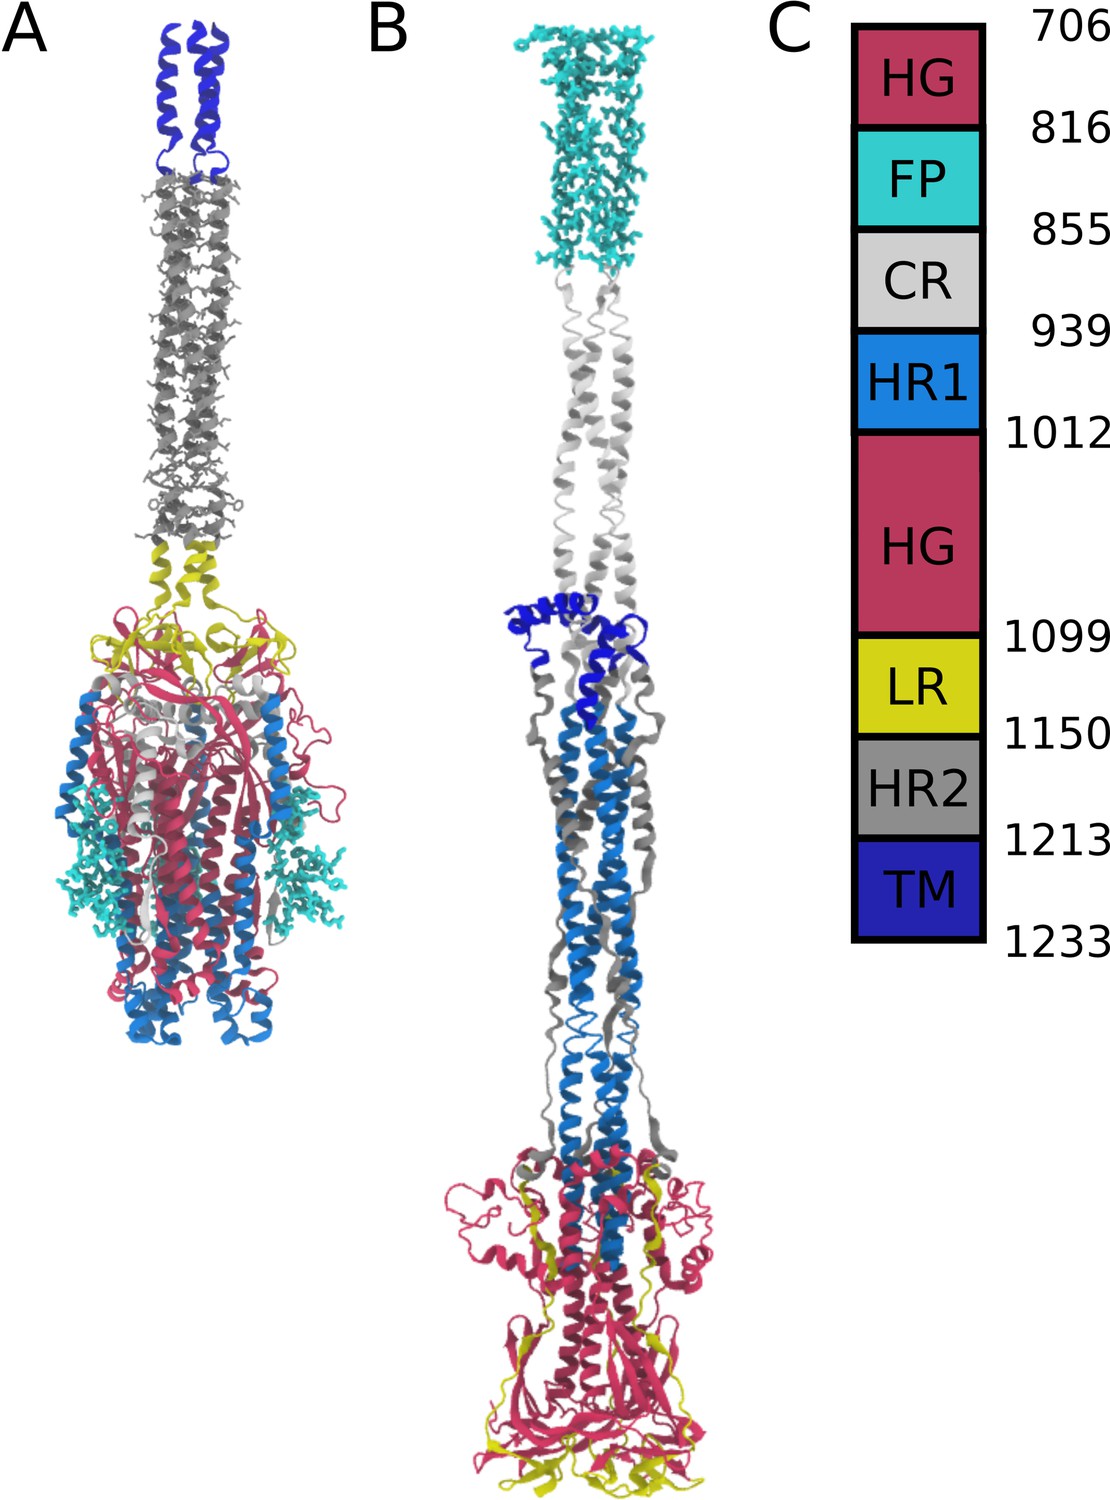
Definitions of domains within the S2 protein.
(A) Prefusion S2 subunit structure of the Spike protein. (B) Postfusion S2 subunit structure of the Spike protein. (C) Sequence range of the Head Group (HG), Fusion Peptide (FP), Connecting Region (CR), Heptad Repeat 1 (HR1), Linker Region (LR), Heptad Repeat 2 (HR2), and Transmembrane Region (TM).
Appendix 1—figure 2

TM tilt angle distributions.
(A) Distribution of TM tilt angles (defined in SI results section 1.1) sampled during simulations when glycans are present. (B) Distribution of TM tilt angles sampled during simulations when glycans are absent.
Appendix 1—figure 3
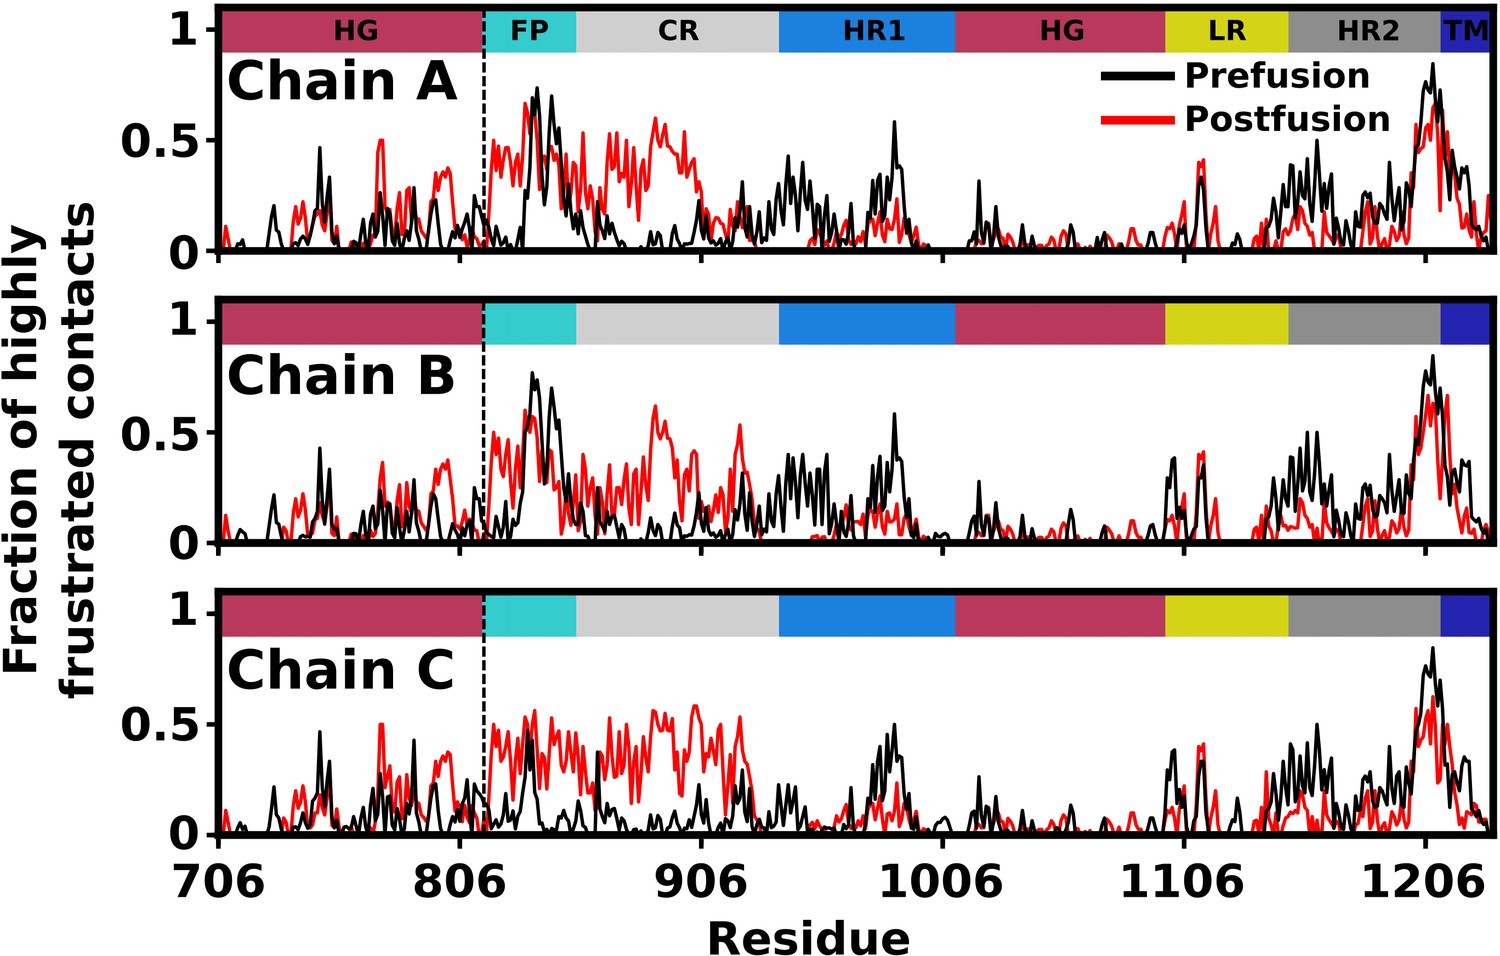
Predicted degree of frustration, by residue.
Density of highly frustrated contacts in a 5Å sphere per residue for prefusion (black) and postfusion (red) S2 subunit structures. Dashed line represents the S2’ cleavage site.
Appendix 1—figure 4
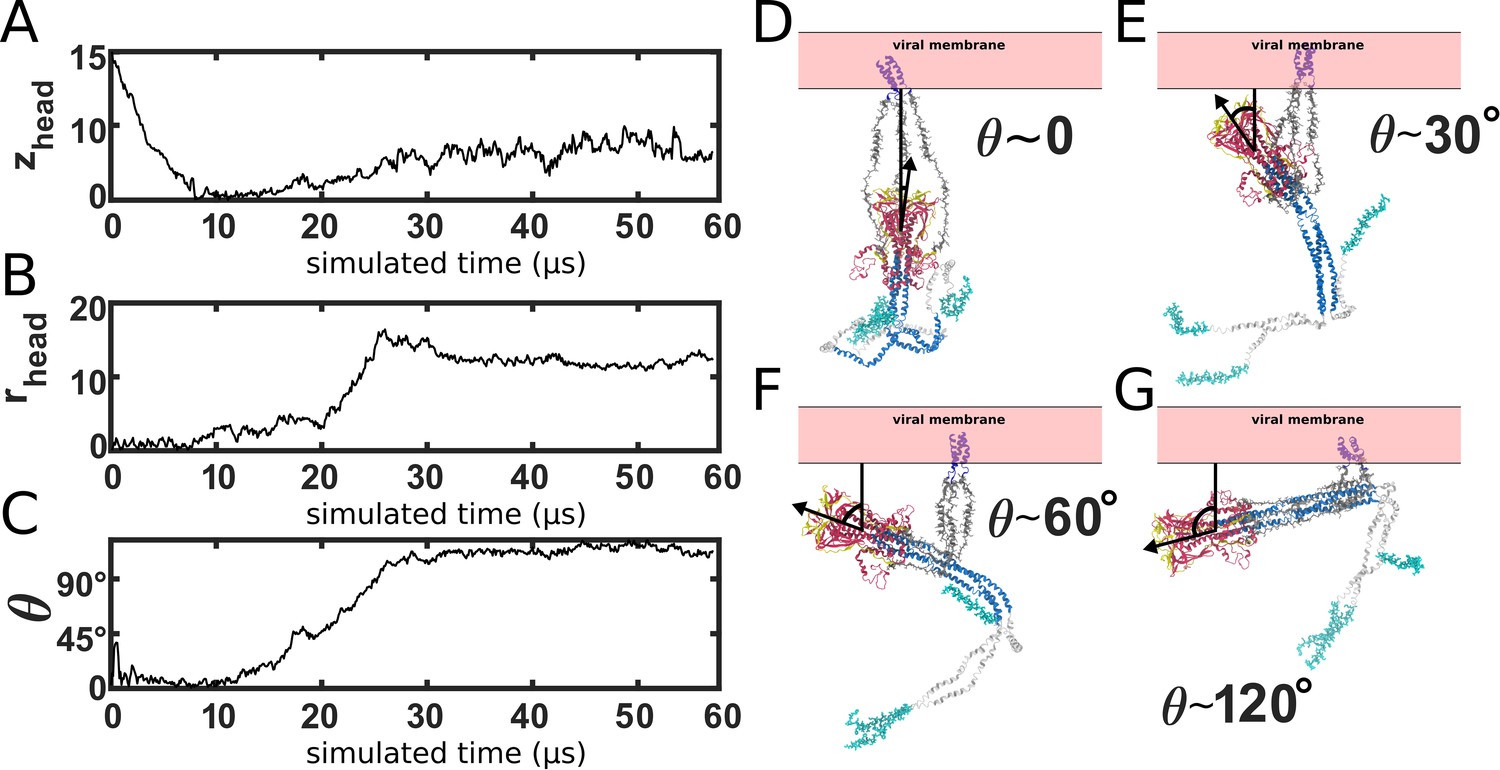
HG rotation.
(A-C) Single time trace of zhead, rhead and the HG principal axis polar angle, θ. (D–G) Snapshots of the orientation of HG, relative to the membrane. During the prefusion-to-postfusion transition, the head rotates from an orientation in which it is pointing toward the membrane, to an orientation where it is pointing away. Structural snapshots illustrate various orientations during the transition.
Appendix 1—figure 5
Probability distribution when glycans are absent.
Distribution calculated from 1000 independent simulations without glycans.
Appendix 1—figure 6

Relative influence of glycans on HR2 and HG.
(A) Structural model with only glycans shown on HG. (B) Structural model with only HR2 glycans present. (C) Distribution of timescales with only HG glycans present. (D) Distribution with only HR2 glycans present. (E) Probability that for at least one FP. There is a higher probability of extending to dhost when only HG glycans are present than when only HR2 glycans are present (black vs. red curves).
Appendix 1—figure 7
Glycans promote host capture with dissociated TM region.
(A-D) Even in the case where the TM strands are able to dissociate, the presence of the glycans increases the probability that the FPs will capture the host membrane. 1000 transitions were simulated for each system. (E–F) Snapshots of glycosylated Spike protein where the TM strands dissociate from one another (glycans are not shown).
Appendix 1—figure 8
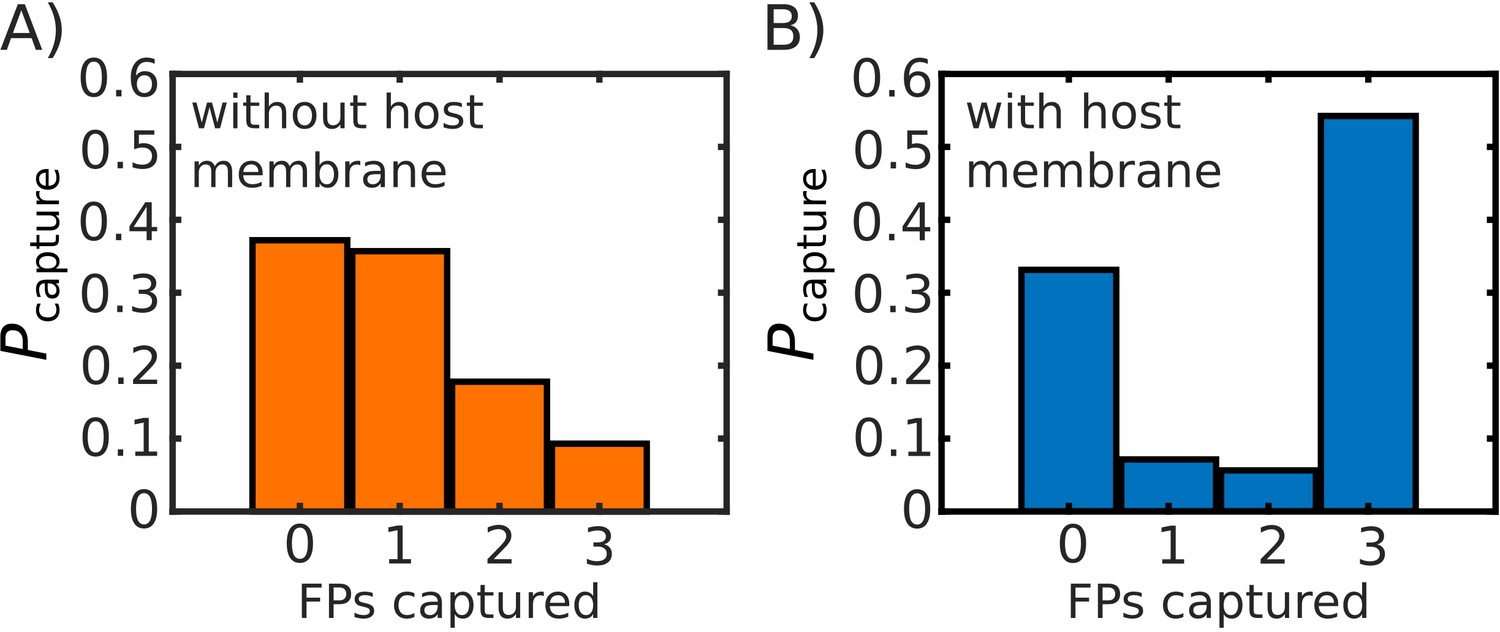
Comparison of probability of FP capture with, and without, a host membrane potential.
Probability of capture, calculated from 1000 simulated transitions. (A) Model with no host membrane, using to define capture. (B) Model with host membrane potential as defined in Equation S1, which traps (i.e. potential begins to decrease) FPs at ∼27 nm from the virtual viral membrane. Both (A) and (B) show approximately the same probability of 0 FPs being captured, while (B) shows a drastic increase on the probability that capture will involve all three FPs.
Appendix 1—figure 9
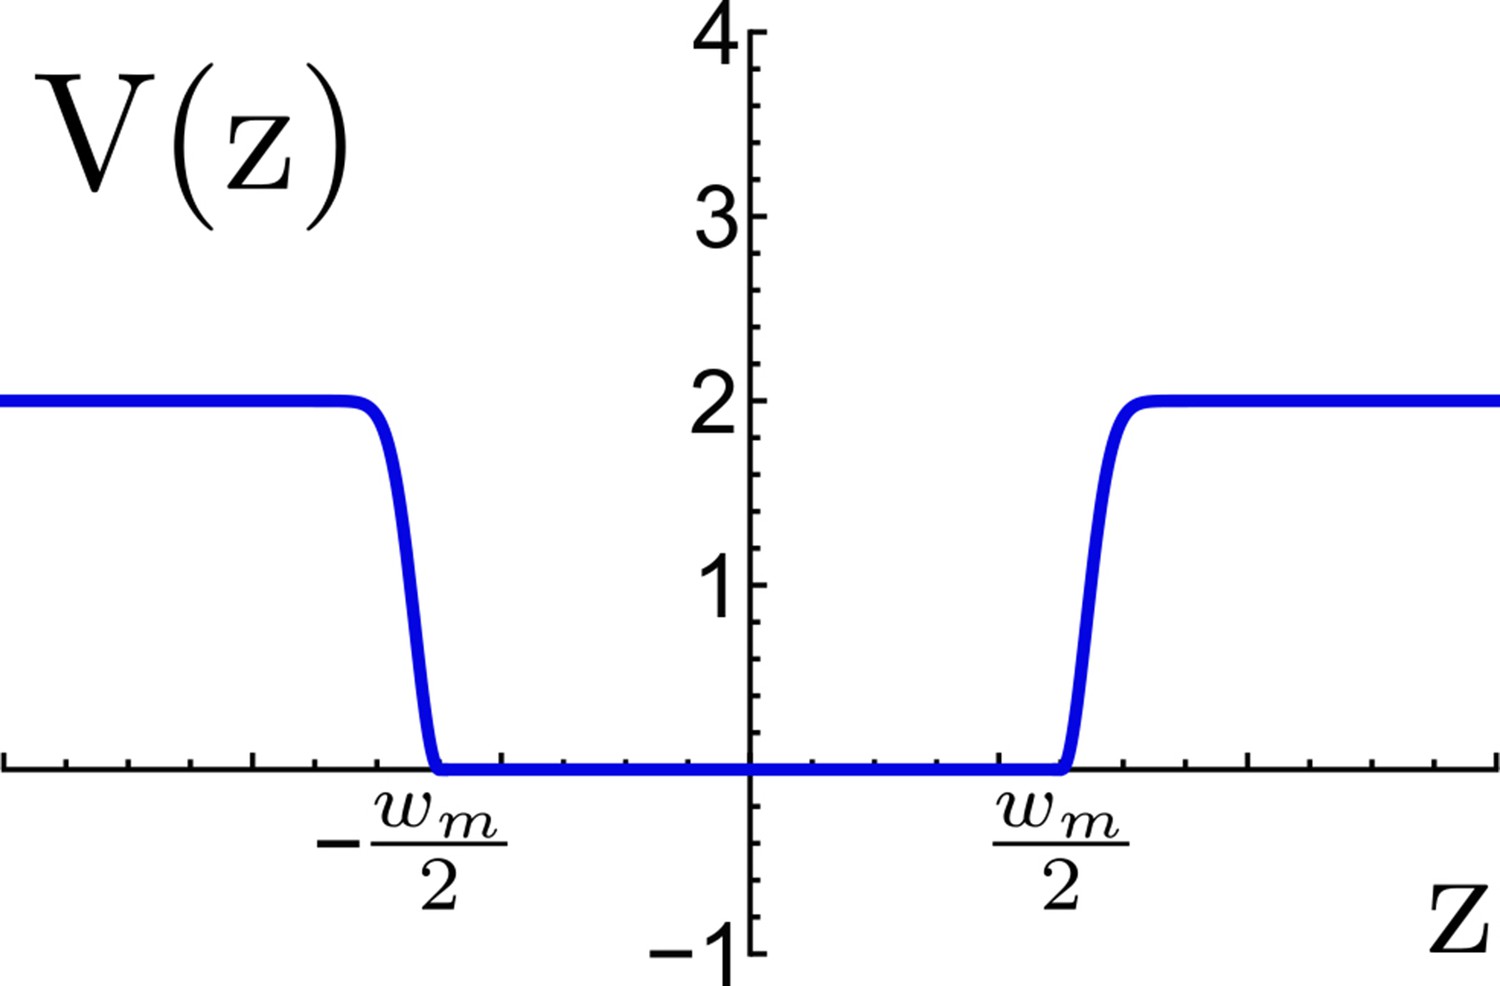
Effective potential for TM confinement in a virtual viral membrane.
The flat-bottom region represents the virtual membrane of width nm, this region allows the TM motif to move freely between the planes and , beyond the flat region an energetic penalty is included to restrain the TM to escape the virtual membrane. Energy is measured in reduced energy units.
Videos
Video 1
This video shows a representative simulation (1 of 1000) of the fully-glycosylated S2 subunit of the SARS-CoV-2 protein as it transitions from the prefusion to the postfusion configuration.
Tables
Appendix 1—table 1
N-glycan listing.
Complete list of N-glycans included in the simulations.
| N706 | aDMan(1→6)[aDMan(1→3)]aDMan(1→6)[aDMan(1→3)] bDMan(1→4)bDGlcNAc(1→4)bDGlcNAc(1→) |
| N717 | aDMan(1→6)[aDMan(1→3)]aDMan(1→6)[aDMan(1→2)aDMan(1→3)] bDMan(1→4)bDGlcNAc(1→4)bDGlcNAc(1→) |
| N801 | aDMan(1→6)[aDMan(1→3)]aDMan(1→6)[aDMan(1→3)] bDMan(1→4)bDGlcNAc(1→4)bDGlcNAc(1→) |
| N1074 | aDMan(1→6)[aDMan(1→3)]aDMan(1→6)[aDMan(1→3)] bDMan(1→4)bDGlcNAc(1→4)bDGlcNAc(1→) |
| N1098 | aDNeu5Ac(2→6)bDGal(1→4)bDGlcNAc(1→2)aDMan(1→3)[aDMan(1→6) [aDMan(1→3)]aDMan(1→6)]bDMan(1→4)bDGlcNAc(1→4)bDGlcNAc(1→) |
| N1134 | bDGlcNAc(1→2)aDMan(1→6)[bDGlcNAc(1→2)aDMan(1→3)]bDMan(1→4) bDGlcNAc(1→4)[aLFuc(1→6)]bDGlcNAc(1→) |
| N1158 | bDGlcNAc(1→2)aDMan(1→6)[bDGlcNAc(1→2)aDMan(1→3)]bDMan(1→4) bDGlcNAc(1→4)bDGlcNAc(1→) |
| N1173 | bDGlcNAc(1→6)[bDGlcNAc(1→2)]aDMan(1→6)[bDGlcNAc(1→4)[bDGlcNAc(1→2)] aDMan(1→3)]bDMan(1→4)bDGlcNAc(1→4)[aLFuc(1→6)]bDGlcNAc(1→) |
| N1198 | aDNeu5Ac(2→6)bDGal(1→4)bDGlcNAc(1→6)[bDGal(1→4)bDGlcNAc(1→2)] aDMan(1→6)[bDGal(1→4)bDGlcNAc(1→4)[bDGal(1→4)bDGlcNAc(1→2)] aDMan(1→3)]bDMan(1→4)bDGlcNAc(1→4)[aLFuc(1→6)]bDGlcNAc(1→) |
Additional files
-
Supplementary file 1
Structural Model of Prefusion Structure.
- https://cdn.elifesciences.org/articles/70362/elife-70362-supp1-v1.pdb
-
Supplementary file 2
Structural Model of Postfusion Structure.
- https://cdn.elifesciences.org/articles/70362/elife-70362-supp2-v1.pdb
-
Transparent reporting form
- https://cdn.elifesciences.org/articles/70362/elife-70362-transrepform-v1.pdf
Download links
A two-part list of links to download the article, or parts of the article, in various formats.
Downloads (link to download the article as PDF)
Open citations (links to open the citations from this article in various online reference manager services)
Cite this article (links to download the citations from this article in formats compatible with various reference manager tools)
Sterically confined rearrangements of SARS-CoV-2 Spike protein control cell invasion
eLife 10:e70362.
https://doi.org/10.7554/eLife.70362


