Plasticity of olfactory bulb inputs mediated by dendritic NMDA-spikes in rodent piriform cortex
- Department of Physiology, Technion-Israel Institute of Technology, Israel
- Department of Neurobiology, University of Haifa, Israel
Figures
Figure 1 with 1 supplement
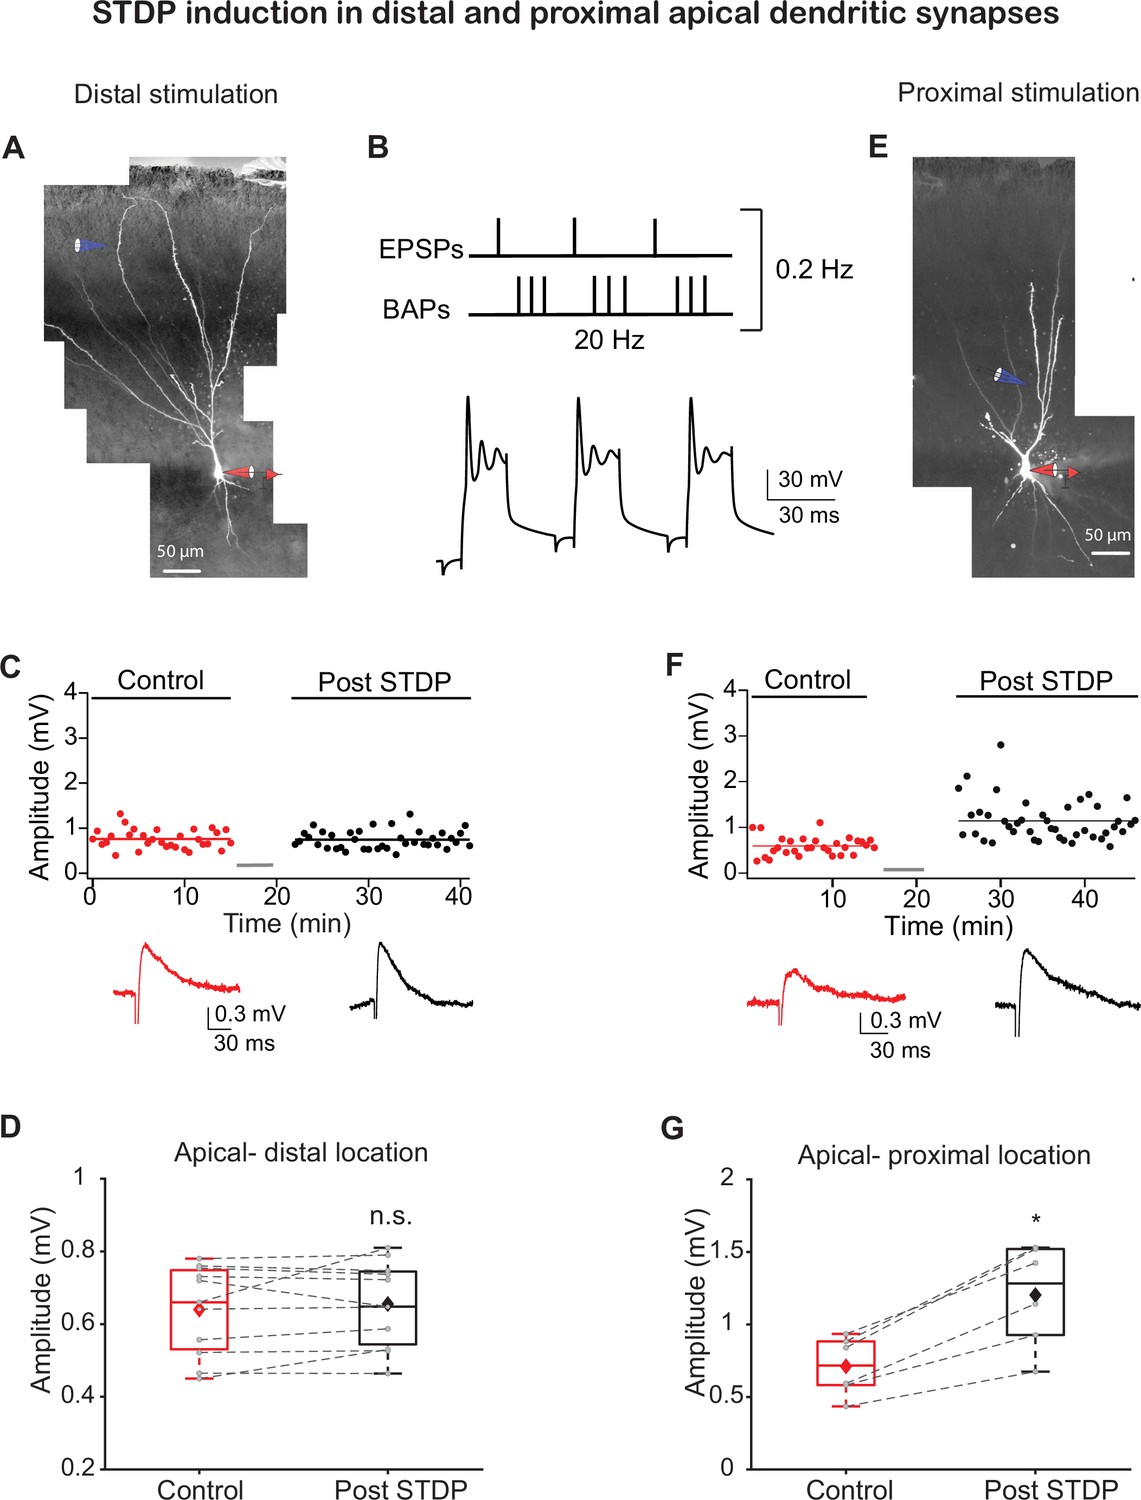
Spike timing-dependent plasticity (STDP) protocol induces long-term potentiation (LTP) in synapses at proximal apical but not distal dendritic locations.
(A) Experimental setup. A pyramidal neuron from layer IIb was loaded with fluorescent dyes CF633 (200 µM) and OGB-1 (200 µM) via a somatic patch electrode (red electrode). Focal stimulation was performed using a theta electrode located nearby a distal apical dendrite in layer Ia (blue electrode; 299 ± 6.29 µm from soma), while recording at the soma. (B) STDP induction protocol (top): one EPSP followed (8 ms delay) by a burst of three back-propagating action potentials (BAPs) at 150 Hz, repeated three times at 20 Hz. Further, this triplet paired EPSP-BAPs was repeated 30 times at 0.2 Hz. Bottom: example of a voltage response to this induction pairing stimulus. (C) Amplitude of single EPSPs is represented over time for control stimulation and after STDP induction protocol at distal apical dendrite (gray bar represents the time of induction stimulus). Control EPSPs were recorded at 0.033 Hz for 10–15 min, prior and after STDP induction protocol. Bottom: traces of average EPSPs for control (red) and post induction (black) from the cell shown in (A). (D) Box plot showing EPSP amplitudes pre- and post-STDP induction for layer Ia inputs. No significant change was observed, post-STDP EPSP amplitude was 103.06% ± 2.81% of the control (p=0.7658; n = 11). (E) Same as in (A) for activation of proximal apical dendrite activation site (blue electrode; 139.33 ± 5.15 µm from soma) at layer Ib. (F) Same as in (A) for proximal apical dendritic activation site. Control EPSPs were recorded at 0.03 Hz for 10–15 min, prior and after STDP induction protocol. Bottom: traces of average EPSPs for control (red) and post-induction (black) from the cell shown in (E). (G) Box plot showing EPSP amplitudes pre- and post-STDP induction for layer Ib inputs. Layer Ib EPSPs were significantly enhanced post-induction protocol, 168.93% ± 6.54% of control (p=0.01387, n = 6). In box plots, the gray dots represent the average EPSP of each experiment, and the diamond represents the mean of the entire set. Dotted gray lines connect between pairs of control and post-induction values. Data for (C), (D), (F), and (G) can be found in Figure 1—source data 1. See also Figure 1—figure supplement 1.
-
Figure 1—source data 1
Data for Figure 1C, D, F and G.
- https://cdn.elifesciences.org/articles/70383/elife-70383-fig1-data1-v2.xlsx
Figure 1—figure supplement 1
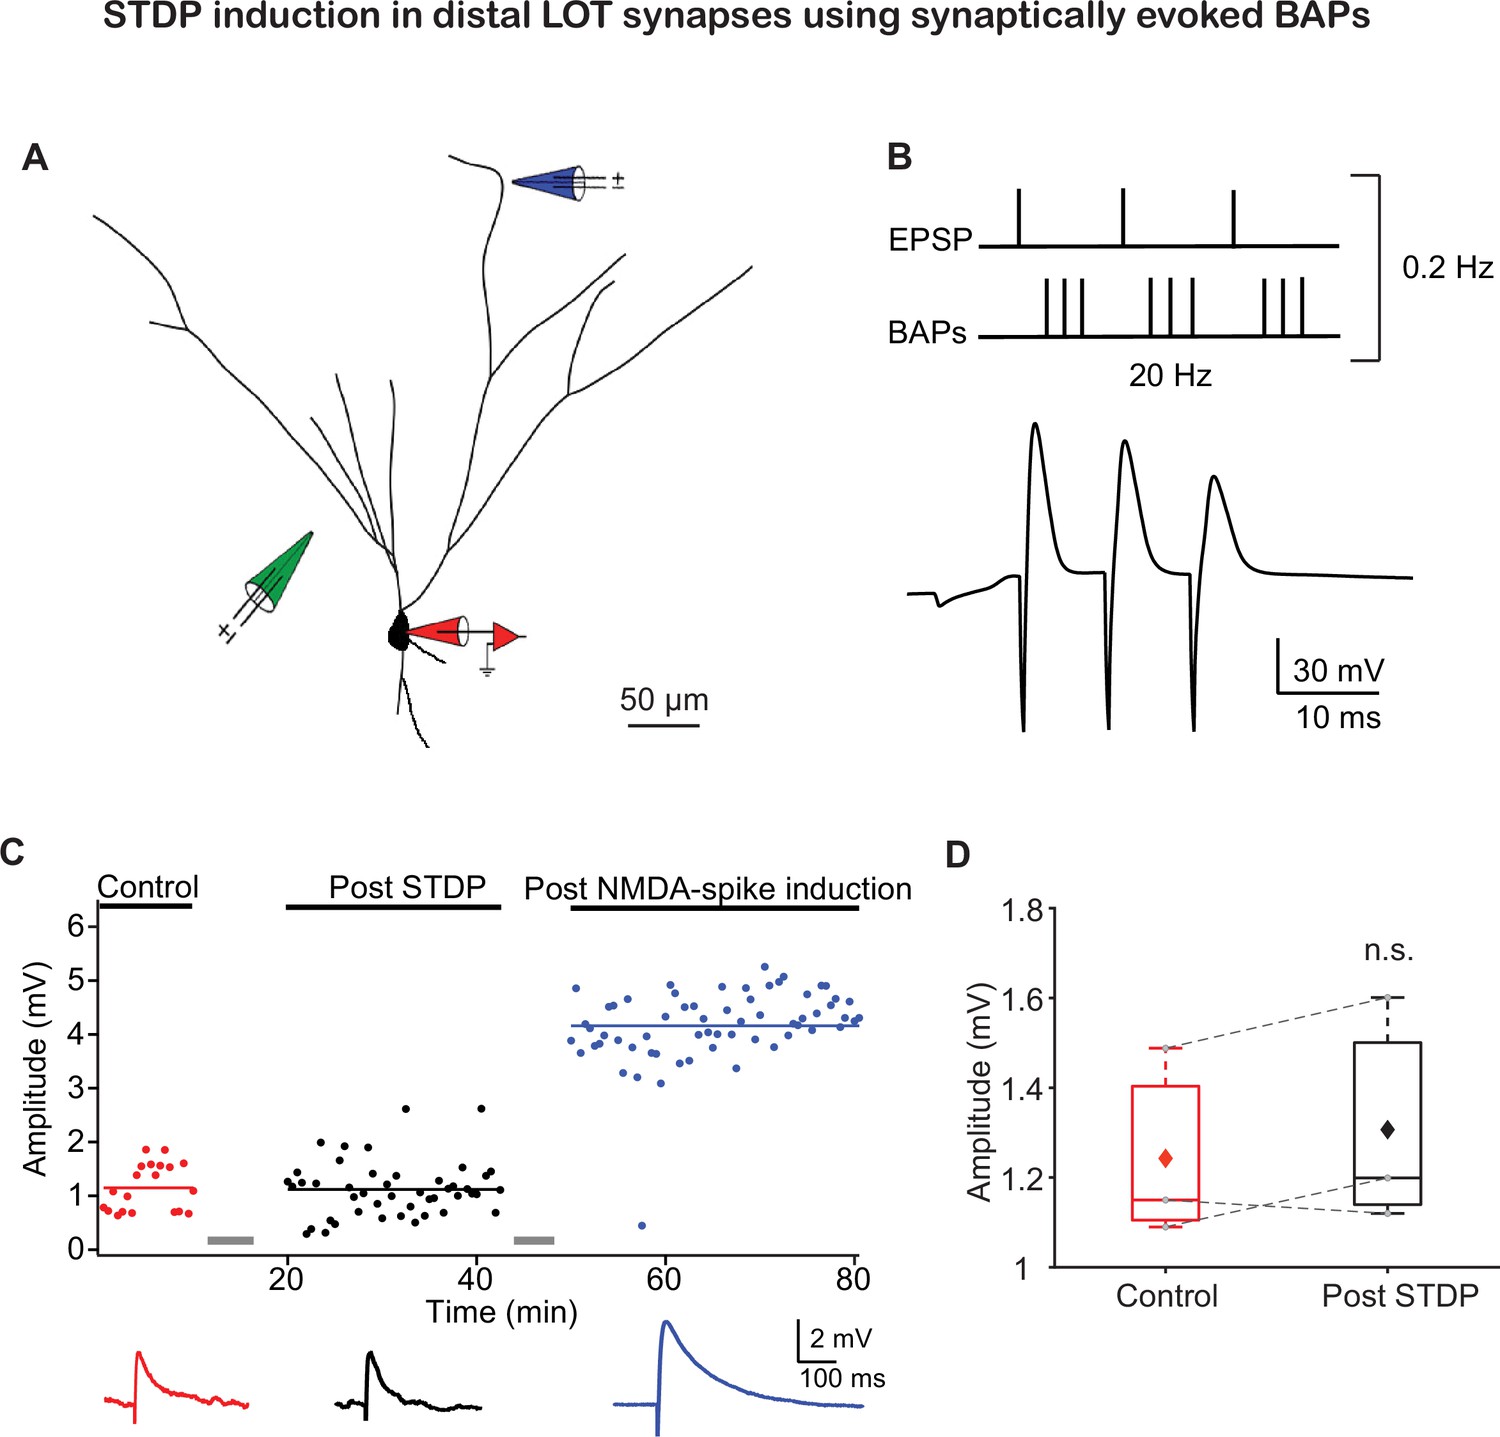
Pairing synaptically induced EPSPs and back-propagating action potentials (BAPs) also failed to induce long-term potentiation (LTP) of lateral olfactory tract (LOT) inputs.
(A) Reconstruction of a layer IIb pyramidal neuron filled with fluorescent dyes CF633 (200 µM) and OGB-1 (200 µM) via somatic recording electrode (red electrode) and focally stimulated in apical distal dendrite using a theta electrode (blue electrode; 286 ± 33.86 µm from soma). Synaptic EPSPs were evoked by a theta electrode placed in layer IIa, close to the soma (green electrode; 95 ± 7.64 µm from soma). (B) The induction protocol was the same as described in Figure 1B, except that the BAPs were evoked by synaptic stimulation close to the soma. Bottom: example trace of spike timing-dependent plasticity (STDP) induction paradigm. (C) Amplitude of single EPSPs represented over time for control (red), post-STDP induction (black), and post-NMDA-spike induction protocol (blue). Pairing EPSPs and synaptically induced BAPs failed to induce LTP. Subsequent delivery of NMDA-spikes at 4 Hz potentiated layer Ia inputs. Bottom panel: average EPSPs for control (red), post-STDP (black), and post-NMDA-spike induction protocol (blue). (D) Box plot showing EPSP amplitudes pre- and post-STDP for layer Ia inputs, when BAPs were initiated using synaptic stimulation close to the soma. Layer Ia EPSPs did not change significantly post-STDP induction (104.99% ± 3.86% of control EPSP; p=0.7577, n = 3). The gray dots represent the average EPSPs of each experiment, and the diamond represents the mean of the entire set. Dotted gray lines connect between pairs of control and post-induction values.
-
Figure 1—figure supplement 1—source data 1
Data for Figure 1—figure supplement 1C and D.
- https://cdn.elifesciences.org/articles/70383/elife-70383-fig1-figsupp1-data1-v2.xlsx
Figure 2
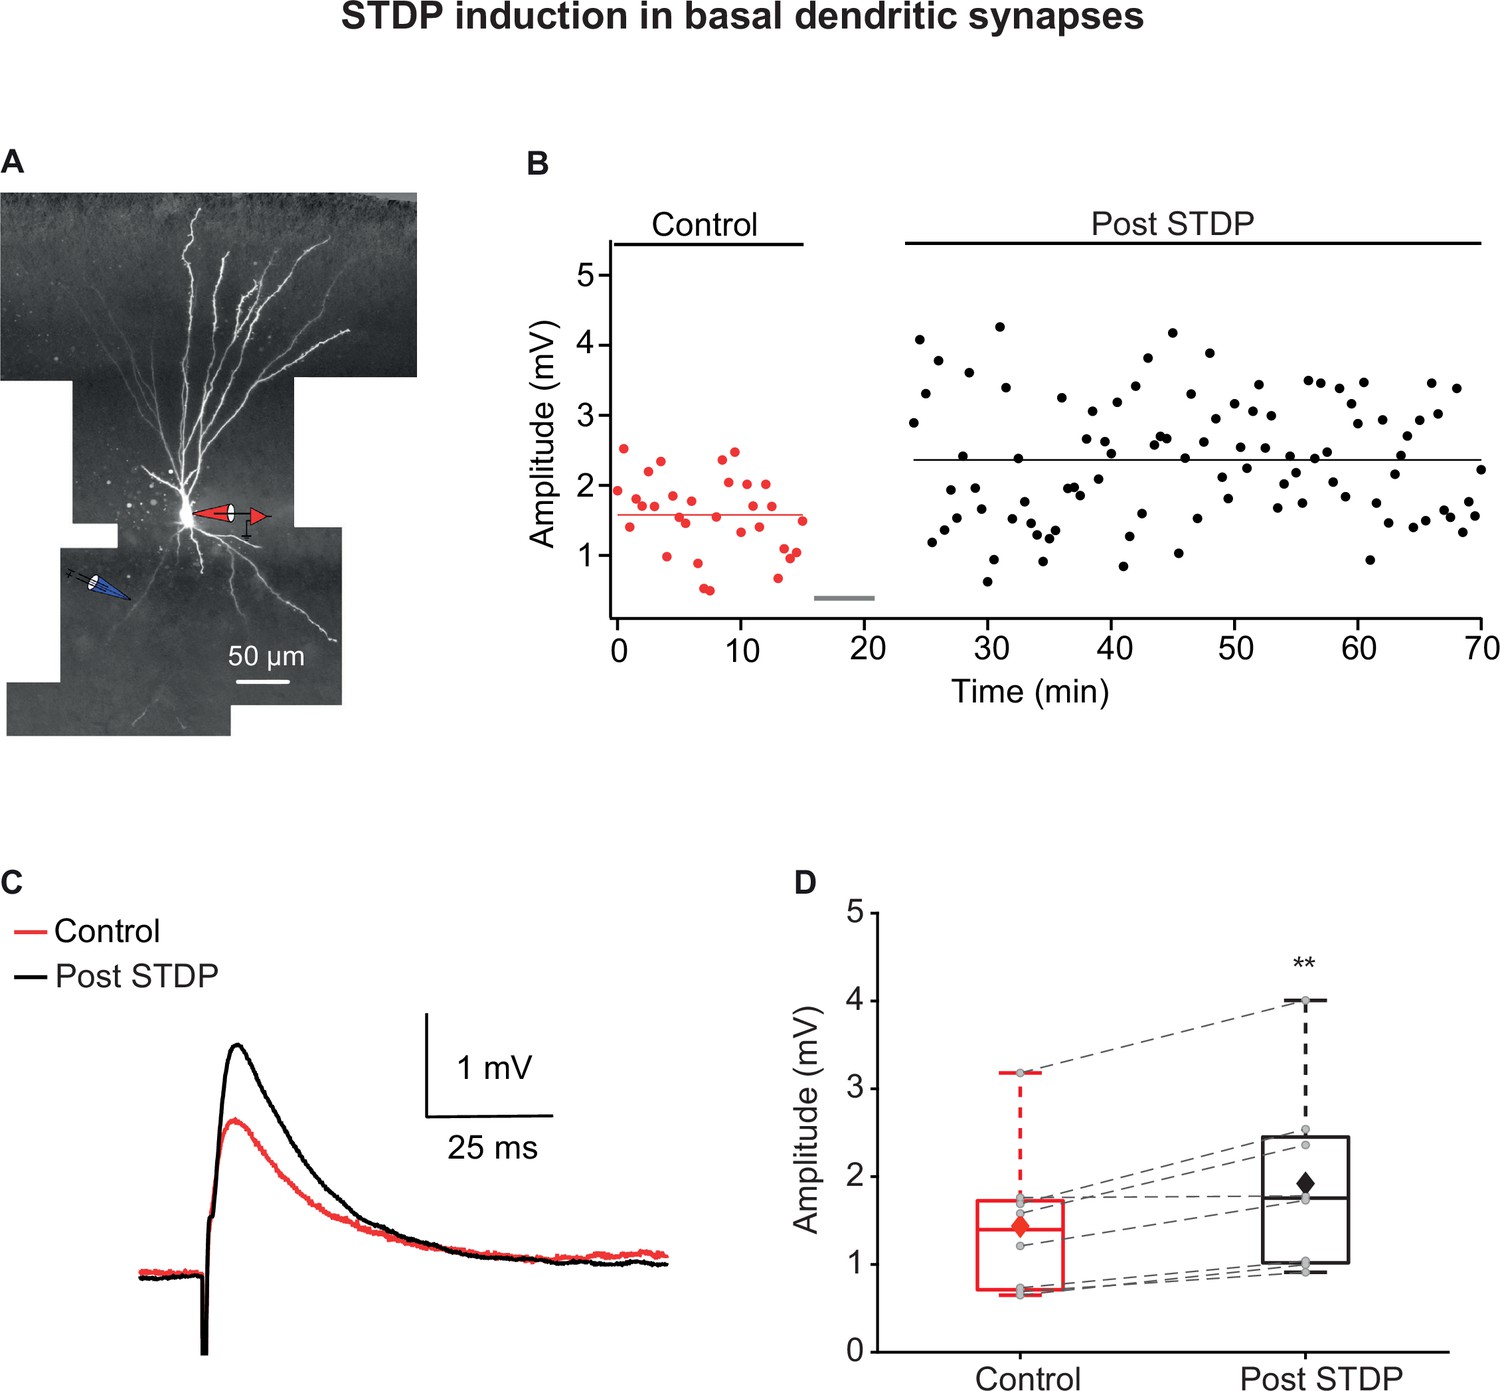
Long-term potentiation (LTP) induction via spike timing-dependent plasticity (STDP) protocol in basal dendrites of piriform cortex (PCx) pyramidal neurons.
(A) A layer IIa pyramidal neuron filled with CF633 (200 µM) and OGB-1 (200 µM) via the somatic recording electrode (red electrode). Focal stimulation was performed using a double-barrel theta electrode located nearby a distal basal dendritic site (blue electrode; 129.25 ± 8.83 µm from soma). (B) Amplitude of single EPSPs is represented over time for control stimulation and after STDP induction protocol (gray bar represents the time of induction stimulus). Induction protocol, as described in Figure 1B. Bottom: traces of average EPSPs from the cell shown in (A) for control (red) and post induction (black). (C) Traces of average EPSPs evoked during control (red) and after STDP induction (black). (D) Box plot showing EPSP amplitudes pre- and post-STDP induction during control (red), and post-STDP induction (black) for distal basal input stimulation. EPSPs were significantly enhanced post-induction protocol (137.12% ± 6.11% of the control; p=0.0031, n = 8). The gray dots represent the average EPSP for each cell, and the diamond represents the mean EPSP of the entire set. Dotted gray lines connect between pairs of control and post-induction values.
-
Figure 2—source data 1
Data for Figure 2B and D.
- https://cdn.elifesciences.org/articles/70383/elife-70383-fig2-data1-v2.xlsx
Figure 3 with 2 supplements
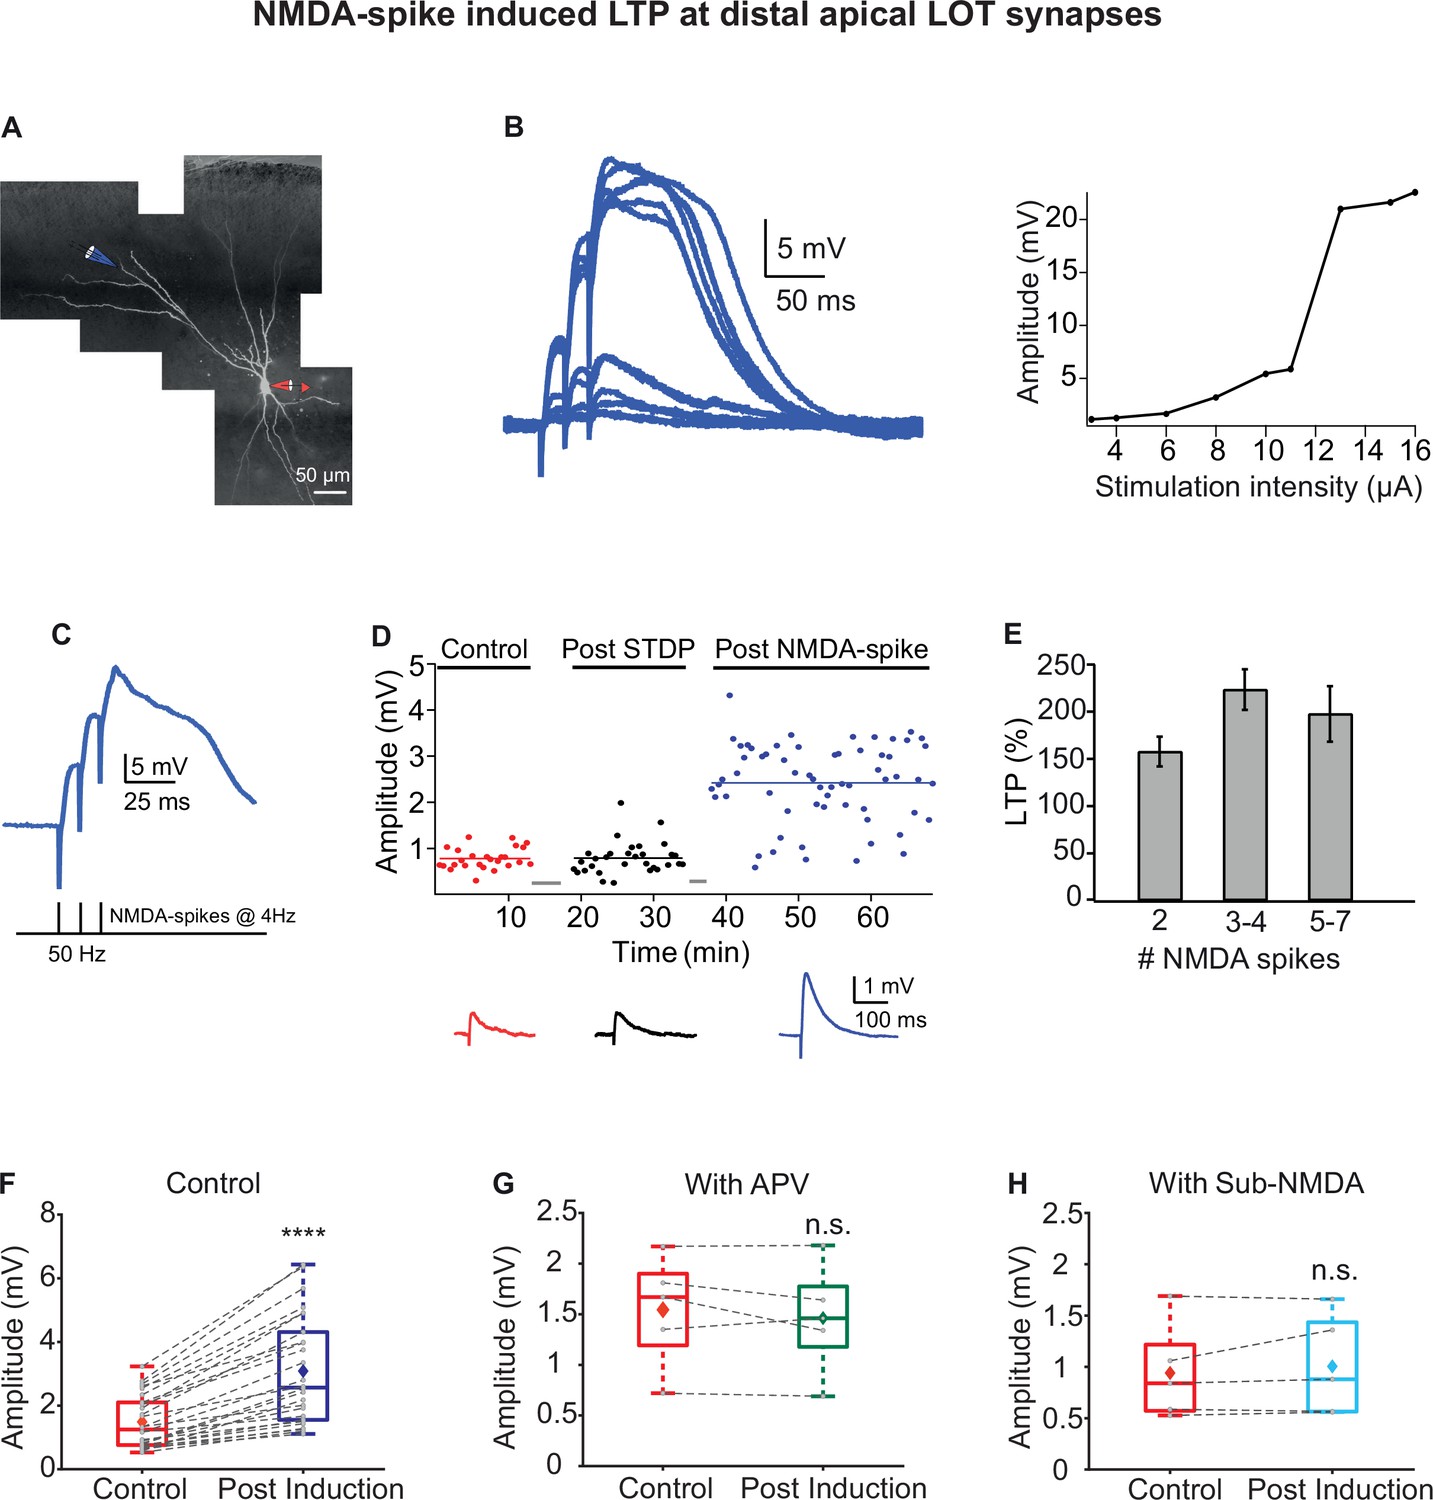
Long-term potentiation (LTP) of lateral olfactory tract (LOT) inputs by NMDA-spikes in piriform cortex (PCx) pyramidal neurons.
(A) Fluorescence image of a layer IIa pyramidal neuron filled with CF633 (200 µM) and OGB-1 (200 µM) via the patch recording electrode (red electrode). A focal synaptic stimulating theta electrode was placed at the distal apical dendrite at layer Ia (blue electrode; 272.75 ± 6.6 µm from the soma). (B) Voltage responses evoked by gradually increasing synaptic stimulation intensity (burst of three pulses at 50 Hz). Peak voltage response as a function of stimulus intensity showing an all-or-none response (left). (C) Schematic of NMDA-spike induction protocol (bottom). NMDA-spikes evoked by three pulses at 50 Hz, repeated at 4 Hz for 2–7 times. Upper panel: example voltage response to NMDA-spikes induction protocol. (D) Amplitude of single EPSPs is represented over time for control stimulation (red), after STDP induction protocol (black) and after NMDA-spike induction protocol (blue). Gray bars represent the time of induction stimulus. Control EPSPs were recorded at 0.033 Hz for 10–15 min. Potentiation was observed only after the NMDA-spike induction protocol. Bottom: traces of average EPSPs in control (red), post-STDP (black), and post-NMDA-spike induction (blue) for the cell shown in (A). (E) Plot of % LTP (relative to control EPSPs) vs. number of NMDA-spikes evoked during the induction protocol. All values are insignificant. (F) Box plot showing the EPSP amplitude during control (red) and post-NMDA-spike induction protocol (blue). NMDA-spike induction protocol induced large potentiation of the control EPSP (213.98% ± 10.81%; p=0.0000687; n = 26). (G) Box plot showing the EPSP amplitude during control NMDA-spike induction protocol (red) and after induction in the presence of APV (50 µM; green). No significant change in EPSP was observed when NMDA-spikes were blocked with APV (95.06% ± 4.69% of control; p=0.817, n = 5). (H) Box plot showing the EPSP amplitude for control NMDA-spike induction protocol (red) and after induction with sub-NMDA EPSPs (teal). No significant change in EPSP amplitudes was observed (106.79% ± 5.69%, p=0.8373, n = 5). In box plots, the gray dots represent the average EPSP for each cell, and the diamond represents the mean EPSP of the entire set. Dotted gray lines connect between pairs of control and post-induction values. See also Figure 3—figure supplements 1 and 2.
-
Figure 3—source data 1
Data for Figure 3B, D, F-H.
- https://cdn.elifesciences.org/articles/70383/elife-70383-fig3-data1-v2.xlsx
Figure 3—figure supplement 1
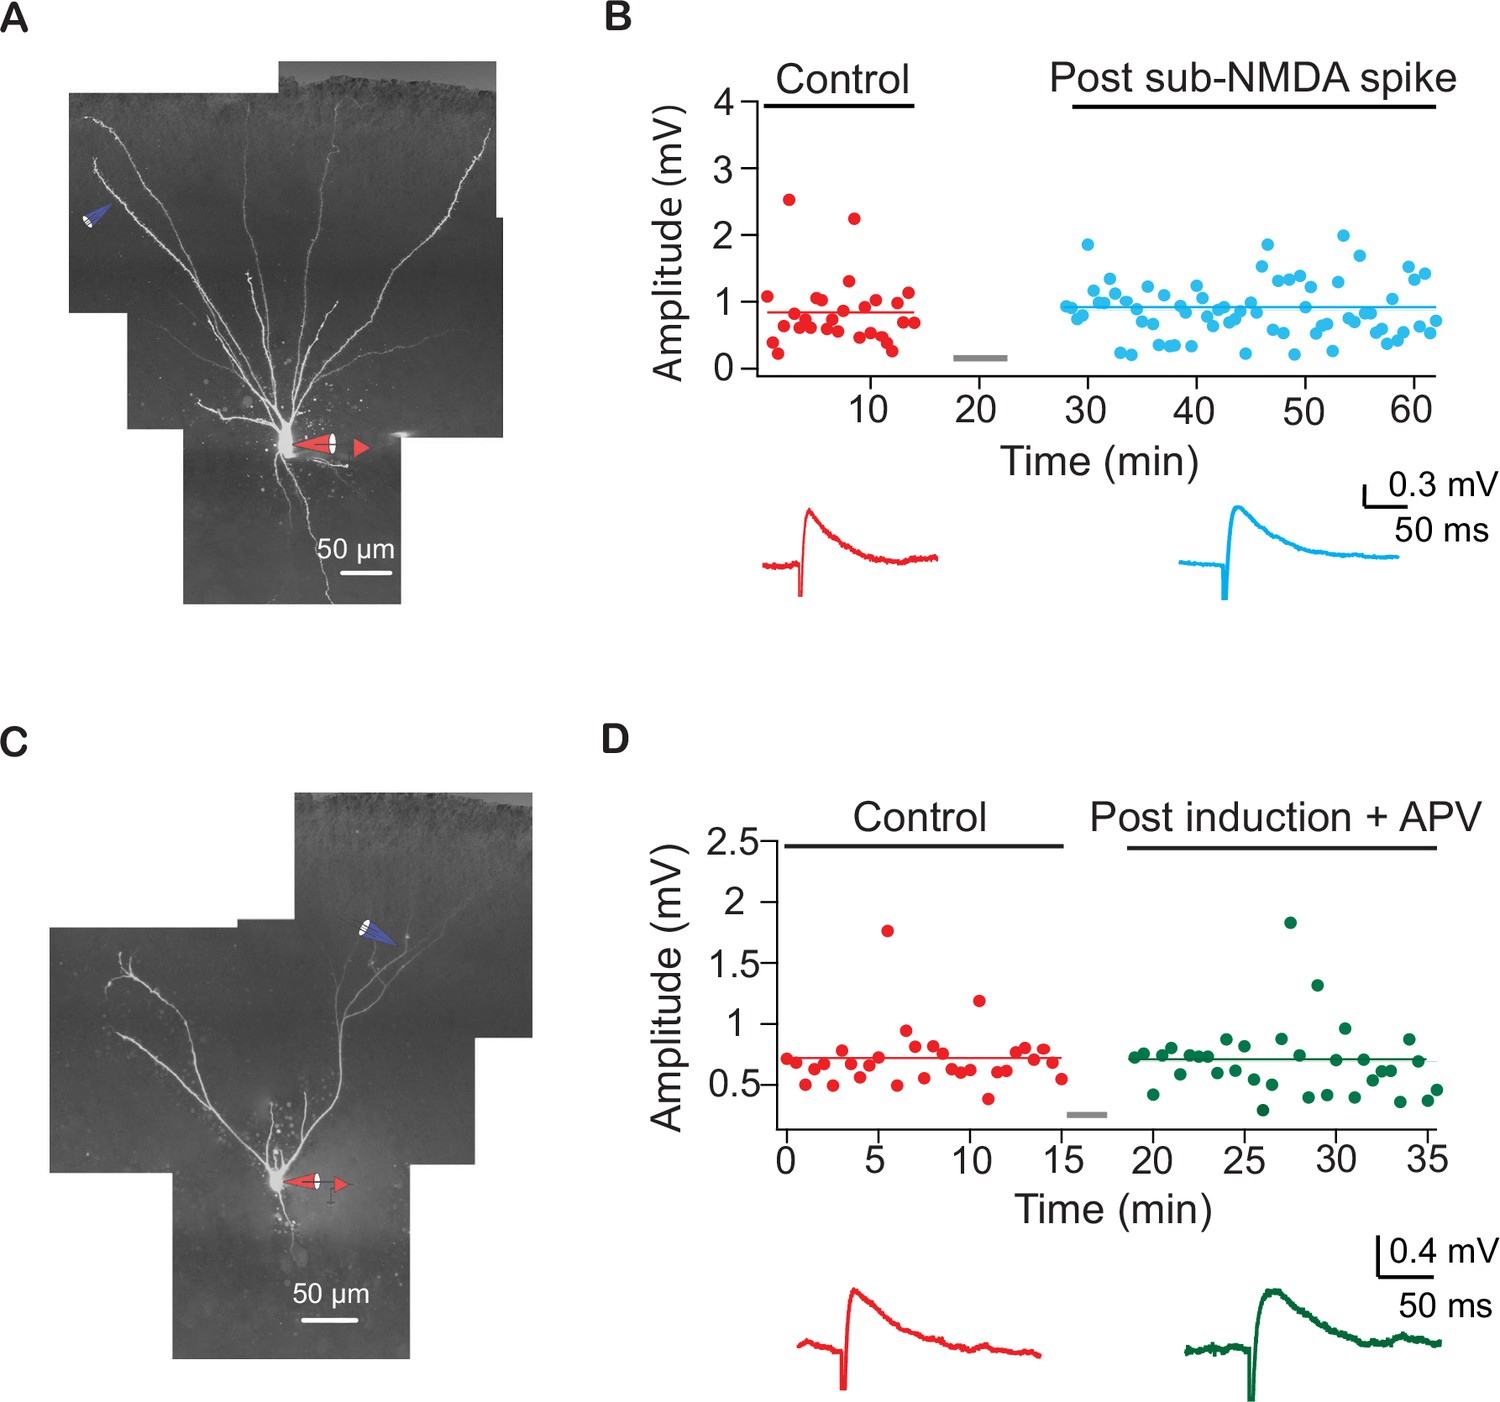
Example experiments showing NMDA-spikes are necessary for long-term potentiation (LTP) of lateral olfactory tract (LOT) synapses.
(A) Reconstruction of a layer IIa pyramidal neuron filled with CF633 (200 µM) and OGB-1 (200 µM) via the somatic recording electrode (red) and focally stimulated using a theta electrode in distal apical dendrite at layer Ia (blue; 298 ± 14.38 µm from soma). (B) Amplitude of single EPSPs is represented over time for control stimulation (red) and after EPSPs subthreshold to NMDA-spike induction protocol (teal). Same induction protocol as in Figure 3, except that stimulation was just subthreshold to NMDA-spikes initiation. Bottom panel: averaged EPSPs evoked during control (red) and post induction with sub-NMDA EPSPs (teal). (C) Reconstruction of a layer IIa pyramidal neuron filled with CF633 (200 µM) and OGB-1 (200 µM) via the somatic recording electrode (red) and focally stimulated using a theta electrode in distal apical dendrite at layer Ia (blue; 275.6 ± 11.55 µm from soma). (D) Amplitude of single EPSPs is represented over time for control stimulation (red) after NMDA-spike induction protocol in the presence of APV (50 µM; green). Same induction protocol as in Figure 3. Bottom panel: averaged EPSPs evoked during control (red) and post induction in the presence of APV (green).
-
Figure 3—figure supplement 1—source data 1
Data for Figure 3—figure supplement 1B and D.
- https://cdn.elifesciences.org/articles/70383/elife-70383-fig3-figsupp1-data1-v2.xlsx
Figure 3—figure supplement 2
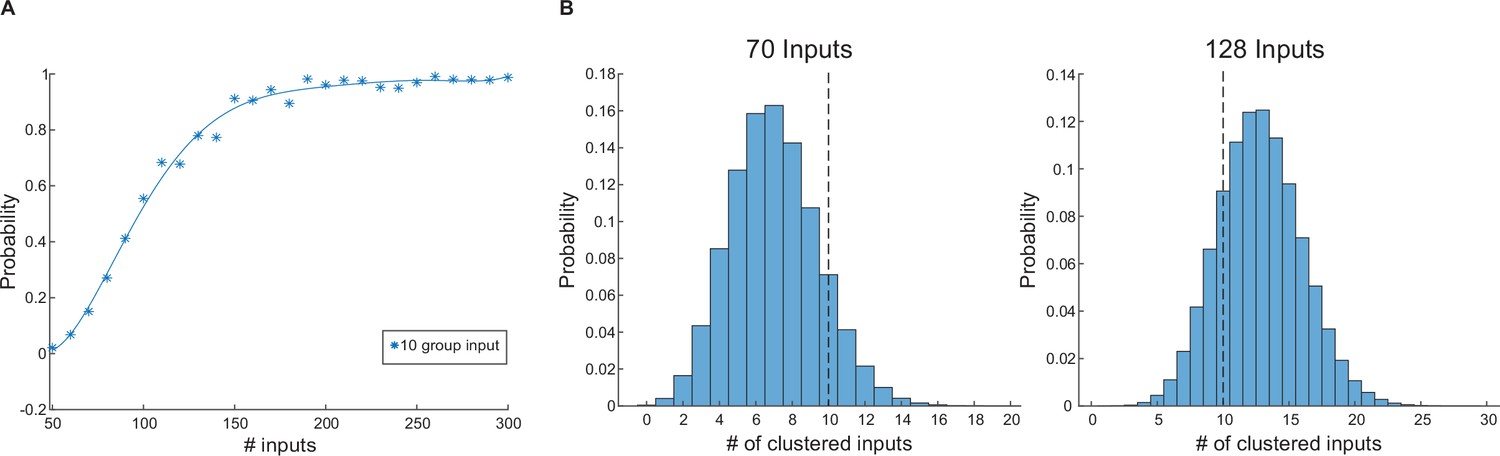
Estimation of the number of synapses needed to initiate NMDA-spikes with in vivo-like odor stimulation.
(A) The probability that at least a single branch will be simultaneously activated by 10 synapses or more during a typical odor stimulation. In this calculation, each pyramidal neuron (PN) contained 10 terminal apical branches, with a lateral olfactory tract (LOT) band of 100 µm and density of one synapse/1 µm yielding total 1000 LOT synapses/per neuron. For this calculation, a range of glomeruli inputs is explored, with each neuron randomly receiving 0.64 synapses from each glomerulus. (B) An example of the probability to randomly cluster inputs on at least a single branch given 110 activated glomeruli yielding a total of 70 synapses/neuron/odor (left) or when 200 activated glomeruli yielding 128 total active synapses/neuron/odor (right). For example, the probability to cluster 10 or more inputs (denoted by dashed line) on a single branch when a total of 70 or 128 inputs are activated was 15% or 80%, respectively.
-
Figure 3—figure supplement 2—source code 1
Source code for Figure 3—figure supplement 2 is provided.
- https://cdn.elifesciences.org/articles/70383/elife-70383-fig3-figsupp2-code1-v2.zip
Figure 4
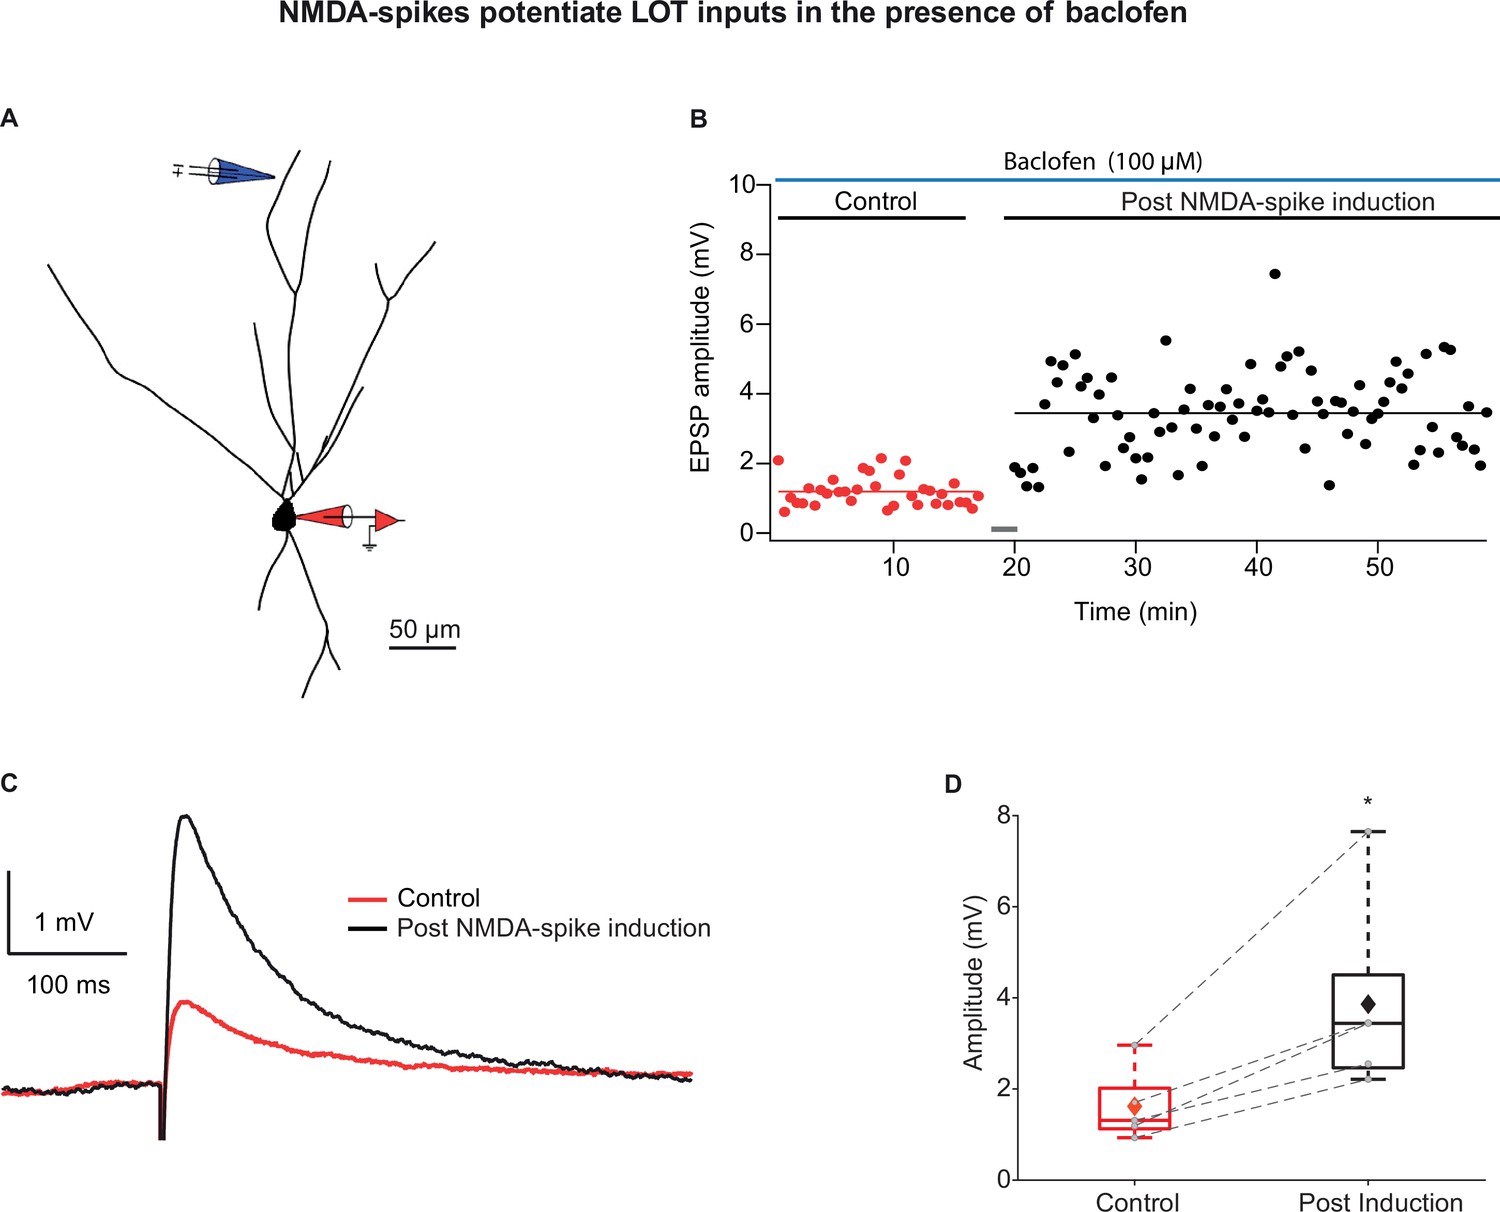
Long-term potentiation (LTP) of lateral olfactory tract (LOT) inputs by NMDA-spikes while blocking intracortical excitatory (IC) inputs with baclofen.
(A) Reconstruction of layer IIa pyramidal neuron filled with CF633 (200 µM) and OGB-1 (200 µM) via the patch recording electrode (red). A focal double-barreled synaptic stimulating electrode was placed at the distal apical dendrite in layer Ia (blue; 287 ± 4.34 µm from soma). (B) Amplitude of single EPSPs represented over time for control stimulation and after NMDA-spike induction protocol at distal apical dendrite in the presence of GABAB agonist baclofen (100 µM). Gray bar represents the time of induction stimulus. Control EPSPs were recorded at 0.033 Hz (red), prior and post-induction protocol (black). (C) Average amplitude of EPSPs during control (red) and post-NMDA-spike induction protocol (black). (D) Box plot showing EPSP amplitudes pre- (red) and post-LTP induction (black) for layer Ia inputs. Layer Ia EPSPs were significantly enhanced post-induction protocol in the presence of baclofen, 236.57% ± 17.51% of control EPSP (p=0.0246, n = 5). The gray dots represent the average EPSPs of each experiment, and the diamond represents mean of the entire set. Dotted gray lines connect between pairs of control and post-induction values.
-
Figure 4—source data 1
Data for Figure 4B and D.
- https://cdn.elifesciences.org/articles/70383/elife-70383-fig4-data1-v2.xlsx
Figure 5
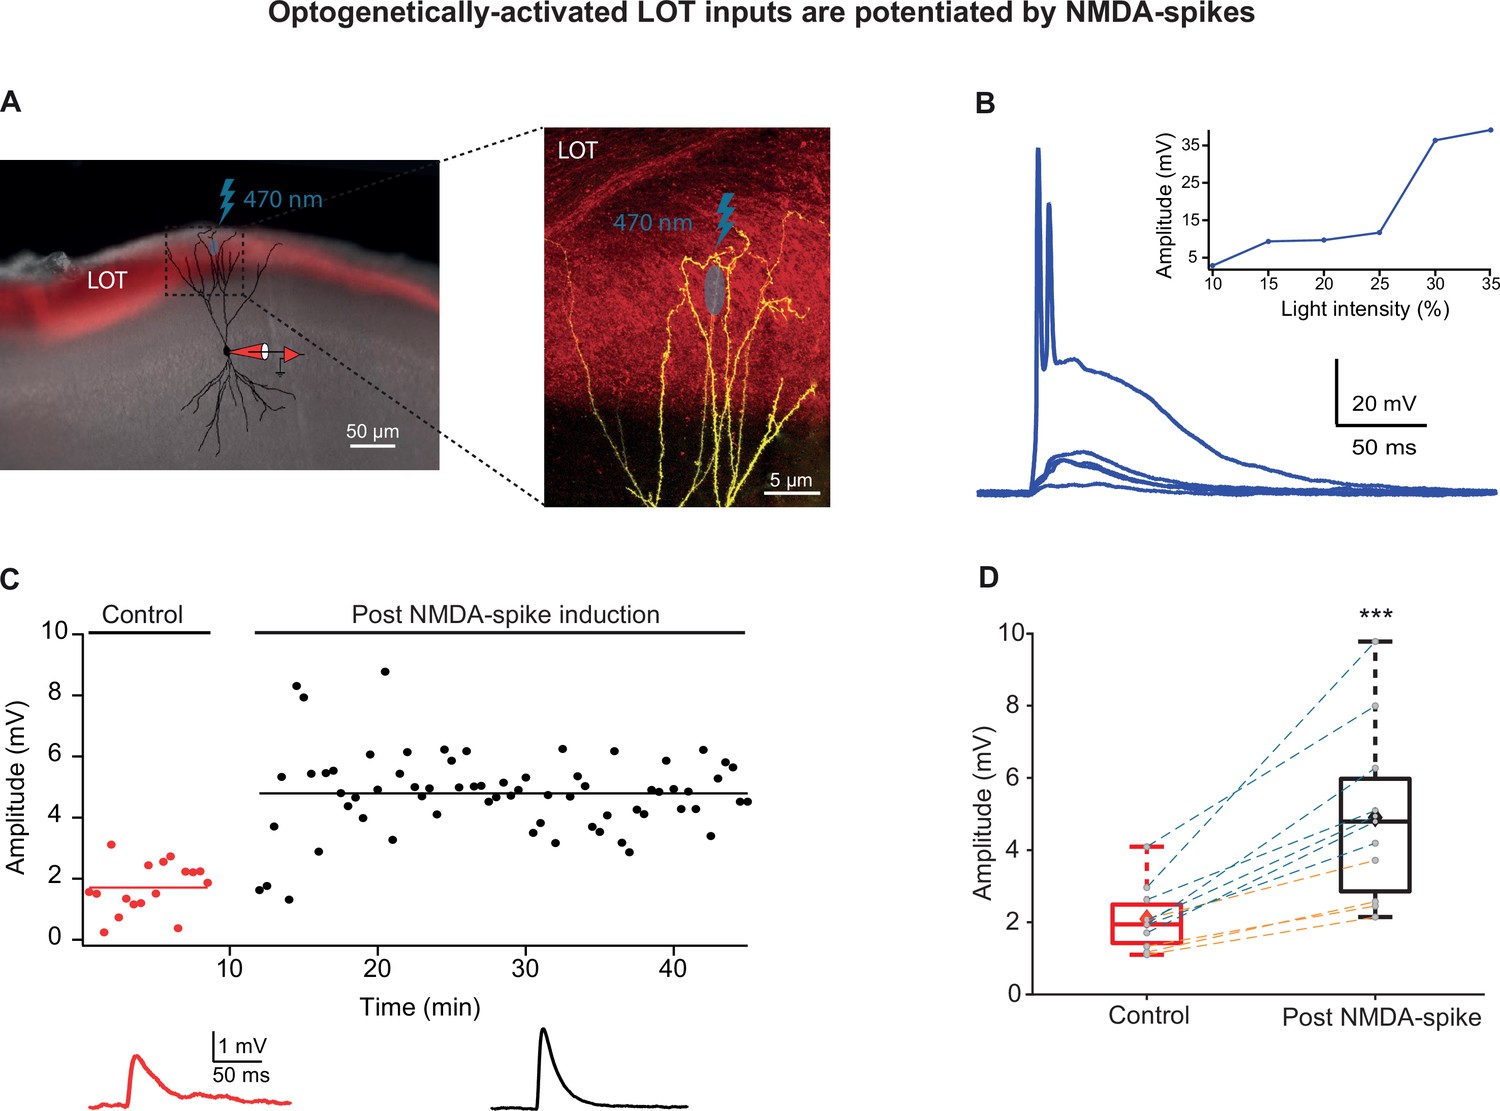
Optogenetically activated lateral olfactory tract (LOT) inputs were potentiated by NMDA-spikes.
(A) Experimental setup. Left panel: coronal slice of piriform cortex (PCx) from a mouse previously injected in olfactory bulb (OB), with a virus expressing ChR2 (pAAV.CAG.hChR2(H134R)-mCherry.WPRE.SV40) in LOT fibers (red fluorescence). A pyramidal neuron from layer IIb was loaded with CF633 (200 µM) and OGB-1 (200 µM) via a somatic patch electrode (red electrode) and was reconstructed after the recording session. Right panel: opto-EPSPs and NMDA-spikes were evoked by light stimulation (LED 470 nm) directed to a small portion of the distal apical dendrite (~5 µm2). (B) Voltage responses evoked by gradually increasing ontogenetic light intensity (three pulses of 5 ms at 50 Hz). Peak voltage responses as a function of % light intensity showing an all-or-none spike response (inset). (C) Amplitude of single opto-EPSPs is represented over time for control stimulation and after NMDA-spike induction protocol at distal apical dendrite. Bottom panel: average opto-EPSP in control (red), post-NMDA-spike induction (black). (D) Box plot showing opto-EPSP amplitudes pre- and post-NMDA-spike induction for LOT inputs. Opto-EPSPs were significantly enhanced post-NMDA-spike optogenetic induction protocol, 232.45% ± 16.55% of control (p=0.000286; n = 11). The gray dots represent the average EPSP of each experiment, and the diamond represents the mean of the entire set. Experiments with optogenetic activation of LOT inputs (blue lines) and experiments with glutamate uncaging (orange lines) were pooled together. There was no significant difference in the level of potentiation between these two activation methods (194.2% ± 9.2%, n = 4, and 254.3% ± 23.6%, n = 7, for glutamate uncaging and opto-EPSPs, respectively, p=0.08). Dotted gray lines connect between pairs of control and post-induction values.
-
Figure 5—source data 1
Data for Figure 5B-D.
- https://cdn.elifesciences.org/articles/70383/elife-70383-fig5-data1-v2.xlsx
Figure 6
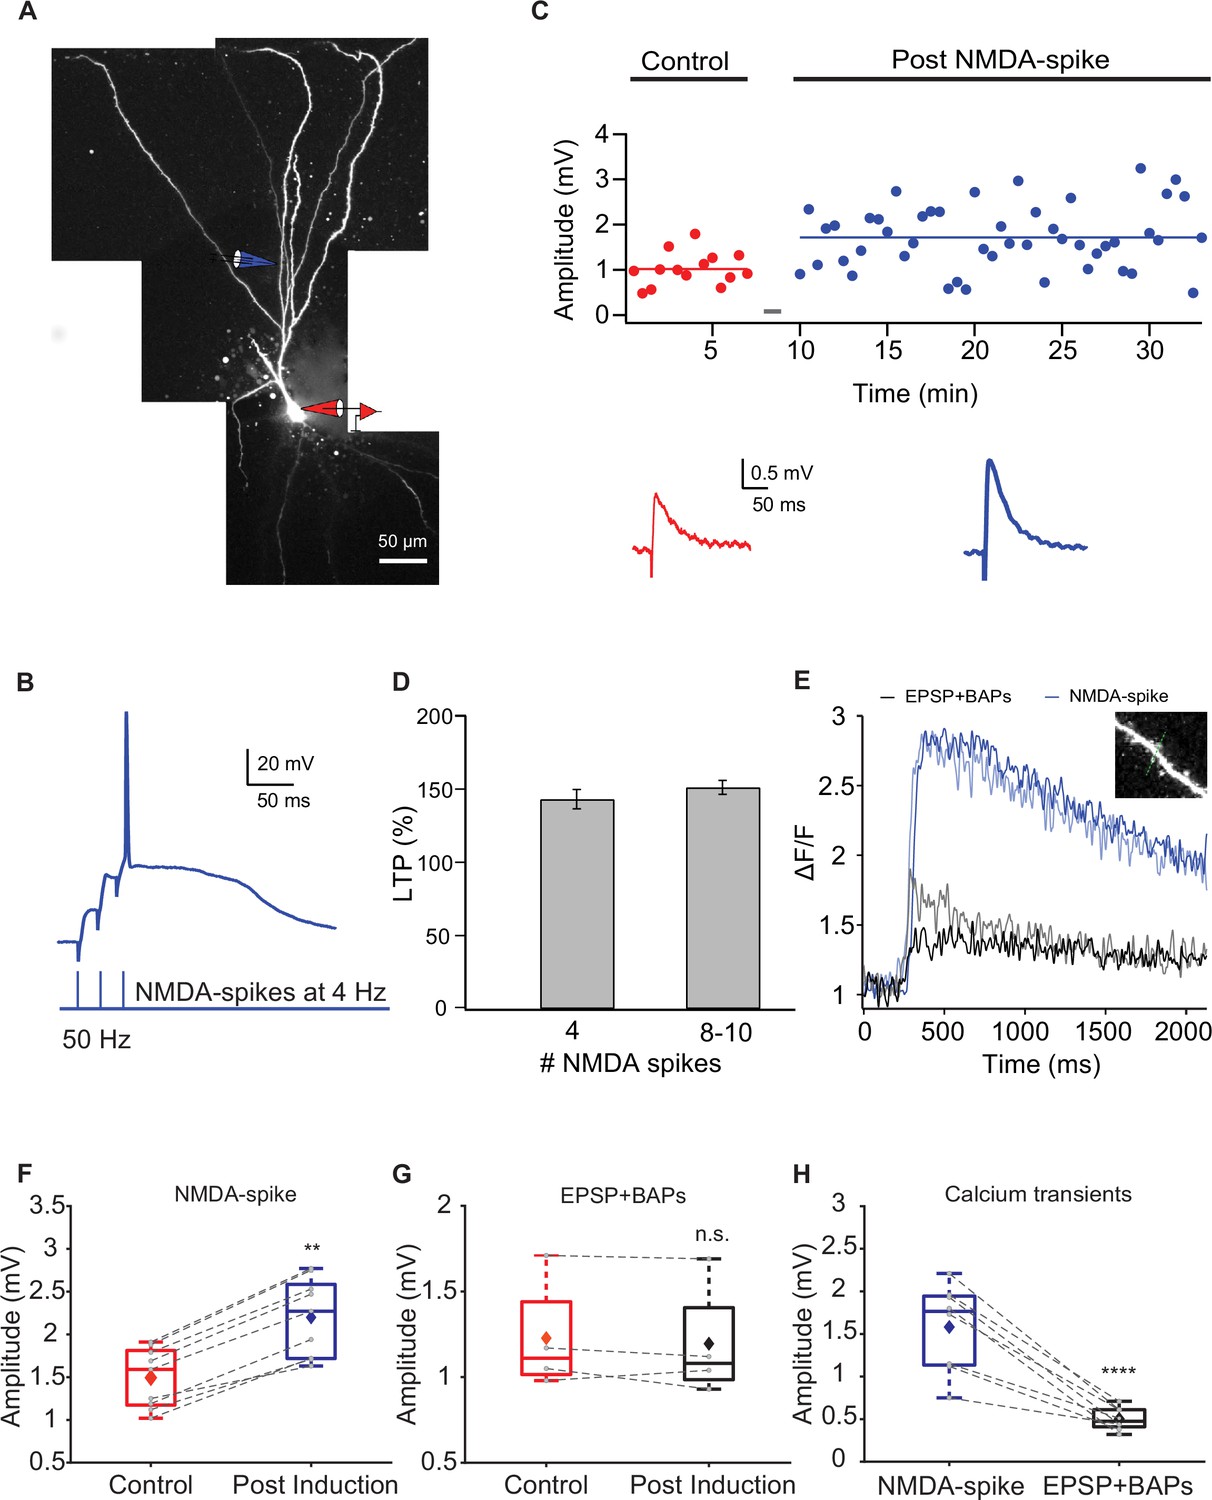
Long-term potentiation (LTP) of layer Ib intracortical (IC) inputs evoked by local NMDA-spikes.
(A) Fluorescence reconstruction of a layer IIa piriform cortex (PCx) pyramidal neuron filled with CF633 (200 μM) and OGB-1 (200 μM) via the somatic patch electrode (in red). Focal stimulation was performed using a double-barrel theta electrode located nearby a proximal apical site in IC layer Ib (in blue; 127 ± 4.39 μm from soma). (B) Schematic of NMDA-spike induction protocol: NMDA-spikes evoked by three pulses at 50 Hz, repeated at 4 Hz for 4-10 times. Upper panel: an example trace of NMDA-spike delivered at 4 Hz during the LTP induction protocol. (C) Amplitude of single EPSPs represented over time during control (red) and post-NMDA-spike induction (blue). Gray bars indicate the time of the LTP induction protocol. Lower panel: average EPSP in control (red) and post-NMDA-spike induction (blue). (D) Plot of % LTP (relative to control EPSPs) vs. number of NMDA-spikes evoked during the induction protocol. All values are not significant. (E) Calcium transients are shown as ΔF/F for spine (lighter color tone) and nearby dendritic shaft (darker color tone) evoked during local NMDA-spikes (blue) and spike timing-dependent plasticity (STDP) stimulation (one EPSP paired with three BAPs at 150 Hz; black). Inset: the dendritic shaft and spine corresponding to the traces shown in (E). line scan through spine and shaft (dashed green line, 2 ms per line). (F) Box plot showing EPSP amplitudes during control and post-NMDA-spike induction at 4 Hz. There was a significant change in the EPSP amplitude (148.48% ± 3.85% of control; p=0.002, n = 9). The gray dots represent the average EPSP for each cell, and the diamond represents the mean EPSP of the entire set. (G) Box plot showing EPSP amplitudes during control and post-pairing protocol (one EPSP with three BAPs at 150 Hz), delivered five times at 4 Hz. There was no significant change in EPSP amplitude (97.31% ± 3.64% of control; p=0.895, n = 4). The gray dots represent the average EPSP for each cell, and the diamond represents the mean EPSP of the entire set. (H) Box plot showing average ΔF/F evoked during local NMDA-spikes and during pairing protocol (one EPSP with three BAPs at 150 Hz) at proximal apical dendrites (127 ± 4.39 μm from soma). The calcium transients evoked during local NMDA-spikes were significantly higher than those evoked during pairing (p<0.0001). The gray dots represent the average ΔF/F for each cell, and the diamond represents the mean ΔF/F of the entire set. Dotted gray lines connect between pairs of control and post-induction values.
-
Figure 6—source data 1
Data for Figure 6C, F-H.
- https://cdn.elifesciences.org/articles/70383/elife-70383-fig6-data1-v2.xlsx
Figure 7 with 1 supplement
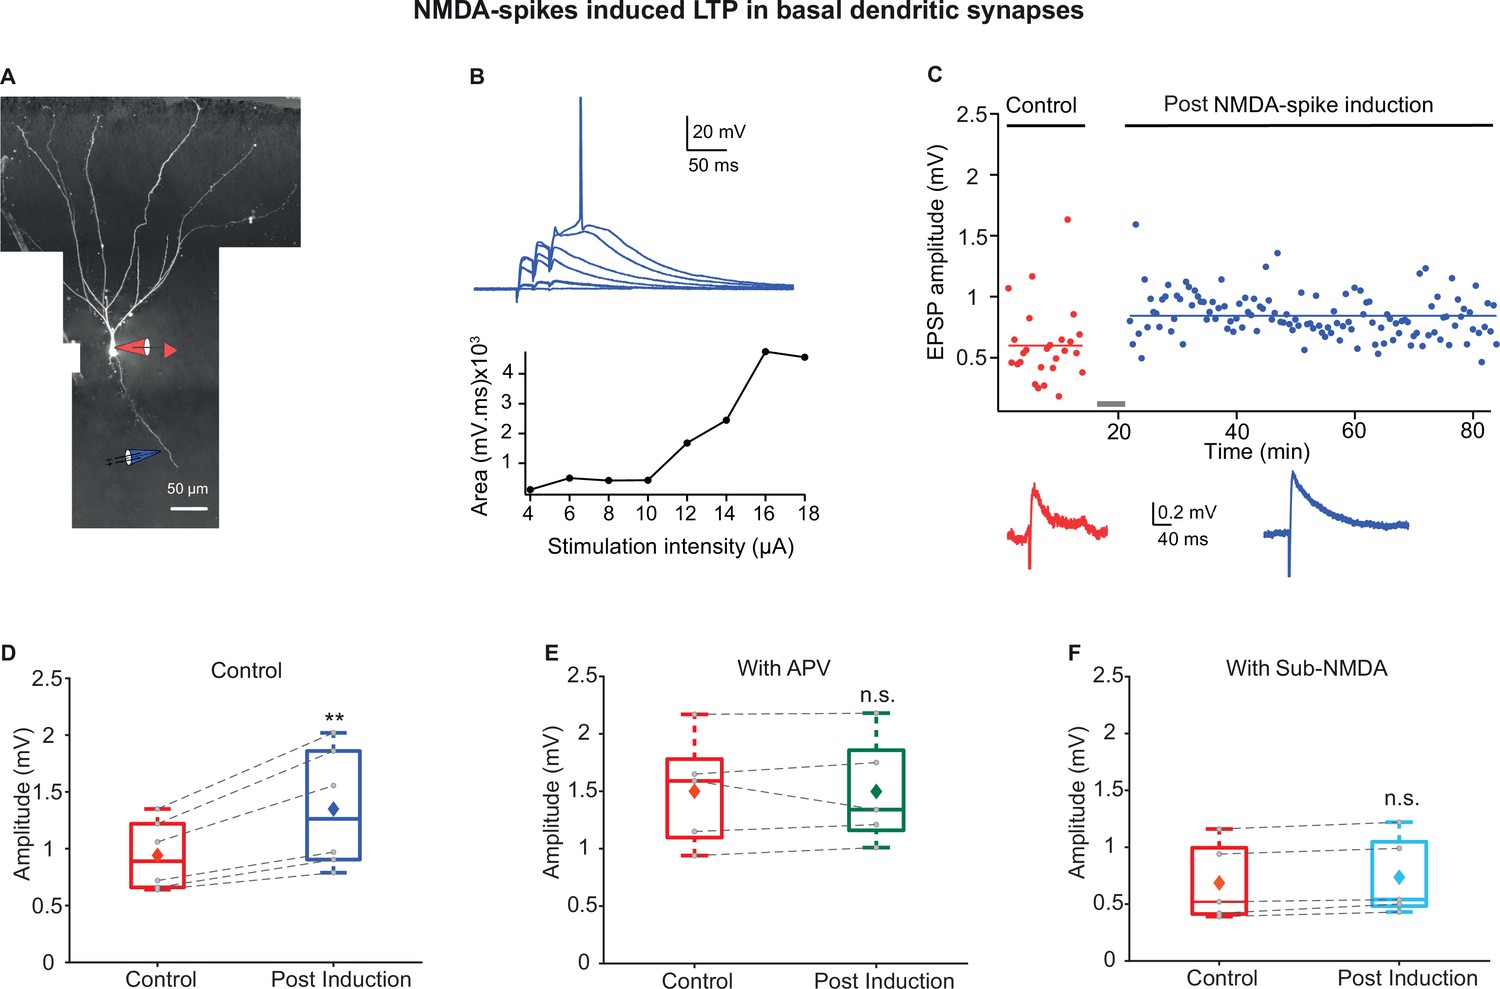
Long-term potentiation (LTP) of basal inputs induced by local NMDA-spikes in piriform cortex (PCx) pyramidal neurons.
(A) Fluorescence image reconstruction of a layer IIa pyramidal neuron filled with CF633 (200 µM) and OGB-1 (200 µM) via a somatic patch electrode (red electrode). Focal stimulation was performed using a theta electrode placed nearby a distal basal dendrite (blue electrode; 144.83 ± 9.21 µm from soma), while recording at soma. (B) Voltage responses evoked by gradually increasing synaptic stimulation consisting of a burst of three pulses at 50 Hz. With gradually increasing stimulus intensity, an NMDA-spike was evoked (top). The peak voltage response is presented as a function of stimulation intensity for the voltage responses shown above (bottom). (C) Amplitude of single EPSPs is represented over time for control stimulation and NMDA-spike induction protocol at a basal dendrite. EPSPs were recorded at 0.033 Hz before and after the induction. Down: average EPSPs during control (red) and post-NMDA-spike induction paradigm (blue). (D) Box plot depicting EPSP amplitudes pre- and post-NMDA-spike induction protocol. NMDA-spike induction protocol induced potentiation of the control EPSP, 140.64% ± 4.5% of control (p=0.006526, n = 6). The gray dots represent the average EPSPs for each cell, and the diamond represents the mean EPSPs of the entire set. (E) Box plot showing EPSP amplitudes pre- and post-LTP induction protocol in the presence of APV. No significant change in EPSP amplitudes was observed, 100.69% ± 4.27% of control (p=0.9948, n = 5). (F) Box plot showing EPSP amplitudes pre- and post-LTP induction with sub-NMDA EPSPs at 4 Hz. No significant change in EPSP amplitudes was observed, 108.73% ± 3.13% of control (p=0.825, n = 5). In the box plots, the gray dots represent the average EPSPs of each experiment, and the diamond represents the mean of the entire set. Dotted gray lines connect between pairs of control and post-induction values. Data for (B–F) can be found in Figure 7—source data 1. See also Figure 7—figure supplement 1.
-
Figure 7—source data 1
Data for Figure 7B-F.
- https://cdn.elifesciences.org/articles/70383/elife-70383-fig7-data1-v2.xlsx
Figure 7—figure supplement 1
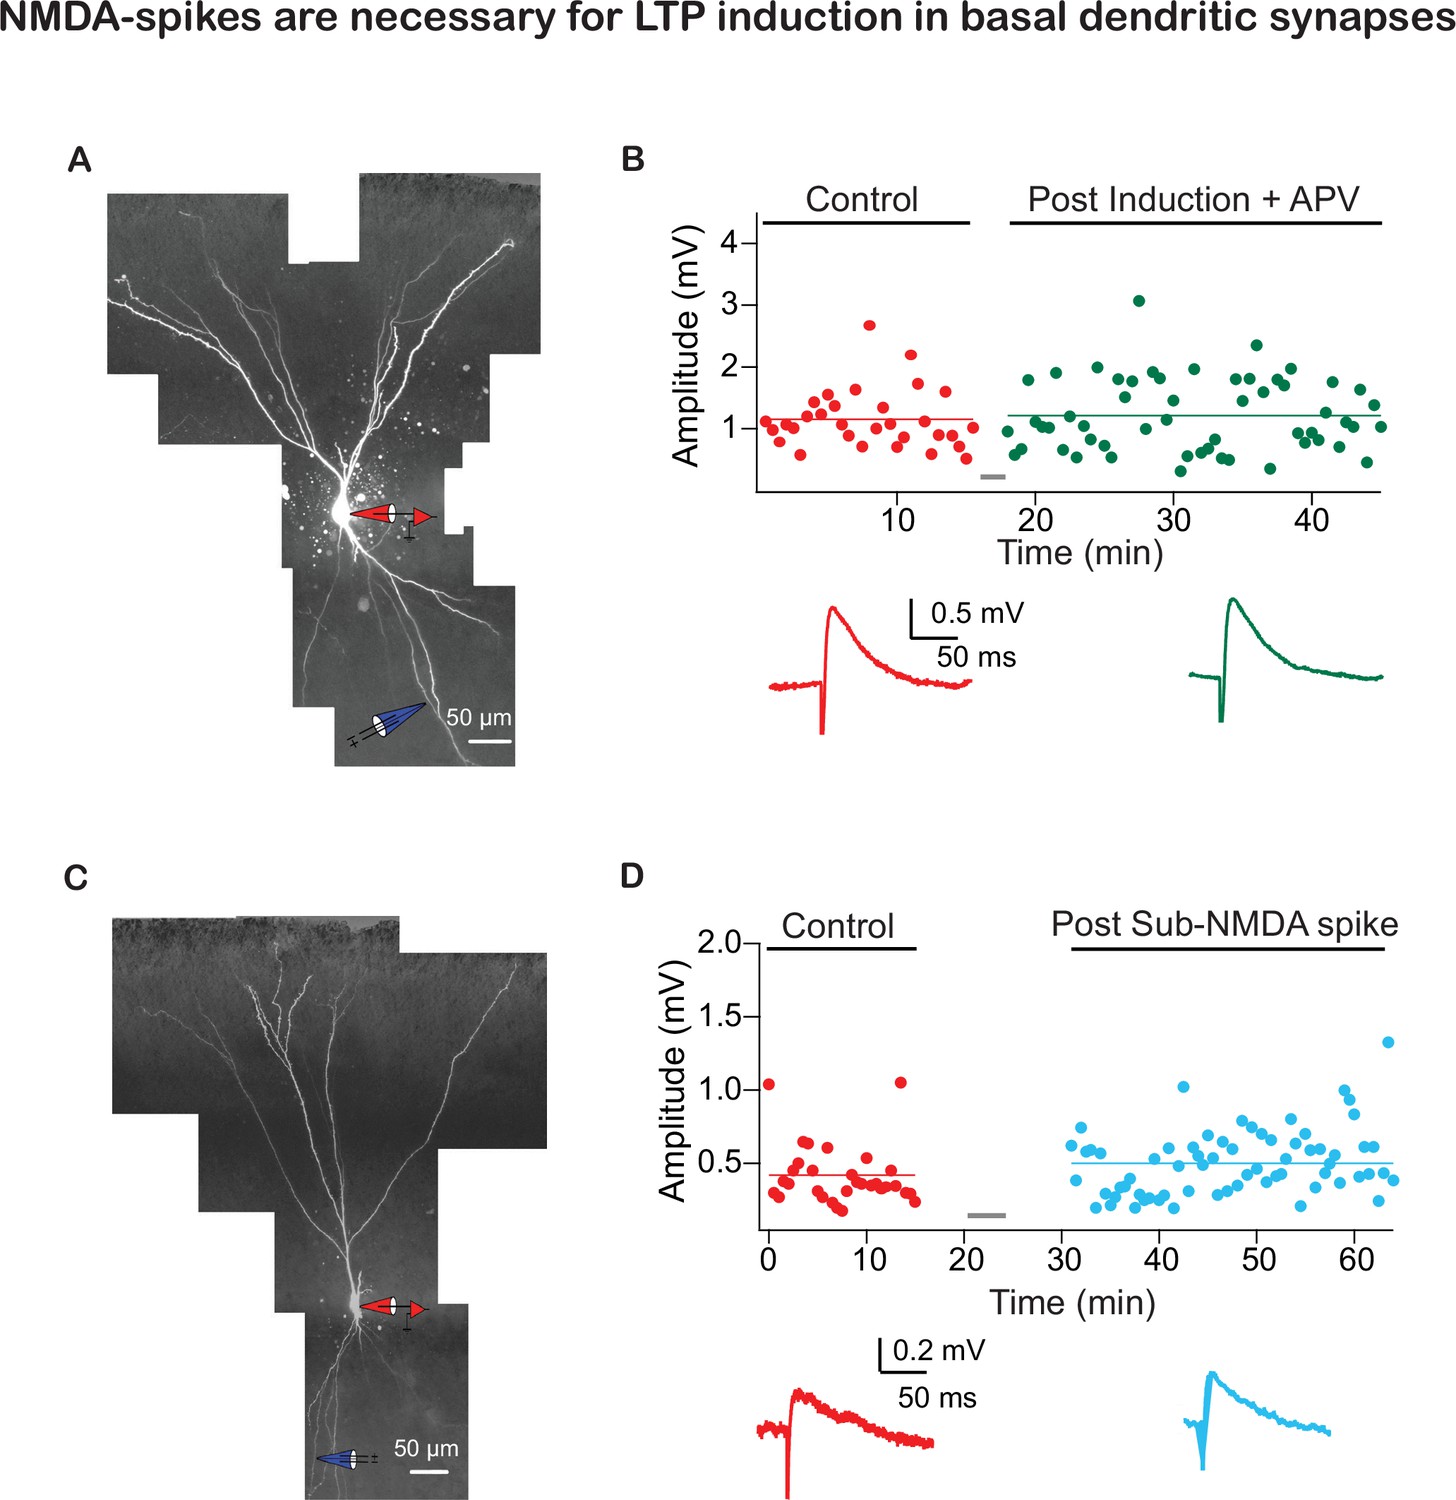
Example experiments showing NMDA-spikes are necessary for long-term potentiation (LTP) of intracortical (IC) synapses in basal dendrites.
(A) Reconstruction of a layer IIa pyramidal neuron filled with fluorescence dyes CF633 (200 µM) and OGB-1 (200 µM) via somatic patch electrode (red electrode) and focally stimulated using a theta electrode in distal apical dendrite at layer Ia (blue; 174.4 ± 11.82 µm from soma). (B) Amplitude of single EPSPs is represented over time for control (red) and post-EPSPs NMDA-spike induction protocol (green) in the presence of APV (50 µM). No significant change in EPSP amplitude was observed. Gray bar represents the time of induction stimulus. Bottom panel: traces of average EPSPs for control (red) and post induction (green). (C) Reconstruction of a layer IIa pyramidal neuron filled with fluorescence dyes CF633 (200 µM) and OGB-1 (200 µM) via somatic patch electrode (red) and focally stimulated at the distal basal dendrite using a theta electrode (blue; 154.8 ± 12.52 µm from soma). (D) Amplitude of single EPSPs represented over time for control (red) and post-sub-NMDA-spike induction (teal). Gray bar indicates the time of induction stimulus. Bottom panel: average EPSP amplitude during control (red) and post-sub-NMDA induction protocol (teal).
-
Figure 7—figure supplement 1—source data 1
Data for Figure 7—figure supplement 1B and D.
- https://cdn.elifesciences.org/articles/70383/elife-70383-fig7-figsupp1-data1-v2.xlsx
Tables
Key resources table
| Reagent type (species) or resource | Designation | Source or reference | Identifiers | Additional information |
|---|---|---|---|---|
| Genetic reagent (Mus musculus) | C57BL/6J | Jackson laboratory | RRID:IMSR_JAX:000664 | |
| Strain, strain background (Rattus norvegicus) | Wistar male/female | Envigo | RccHan:WIST | |
| Recombinant DNA reagent | pAAV.CAG. hChR2 (H134R)-mCherry.WPRE. SV40 | Addgene | ID: 100054 | |
| Chemical compound, drug | CF633 hydrazide | Biotium | Cat.#: 92156 | 200 µM |
| Chemical compound, drug | Oregon Green 488 BAPTA-1 Hexapotassium salt | Invitrogen | Cat.#: 06806 | 200 µM |
| Chemical compound, drug | MNI-Caged-L-glutamate | Tocris Bioscience | Cat.#: 1490/10 | 5–10 mM |
| Chemical compound, drug | D-AP5 | Tocris Bioscience | Cat.#: 0106/1 | 50 µM |
| Chemical compound, drug | Baclofen | Tocris Bioscience | Cat.#: 0796/10 | 100 µM |
| Software, algorithm | Igor Pro 8 | WaveMetrics | RRID:SCR_000325 | |
| Software, algorithm | pClamp 10 | Molecular devices | RRID:SCR_011323 | |
| Software, algorithm | Excel | Microsoft | RRID:SCR_016137 | |
| Software, algorithm | Adobe Illustrator | Adobe | RRID:SCR_010279 | |
| software, algorithm | MATLAB | MathWorks | RRID:SCR_001622 |
Additional files
Download links
A two-part list of links to download the article, or parts of the article, in various formats.
Downloads (link to download the article as PDF)
Open citations (links to open the citations from this article in various online reference manager services)
Cite this article (links to download the citations from this article in formats compatible with various reference manager tools)
Plasticity of olfactory bulb inputs mediated by dendritic NMDA-spikes in rodent piriform cortex
eLife 10:e70383.
https://doi.org/10.7554/eLife.70383


