Transcriptional correlates of malaria in RTS,S/AS01-vaccinated African children: a matched case–control study
- ISGlobal, Hospital Clínic - Universitat de Barcelona, Spain
- CIBER de Enfermedades Infecciosas, Spain
- Center for Global Infectious Disease Research, Seattle Children's Research Institute, United States
- Vaccine and Infectious Disease Division, Fred Hutchinson Cancer Research Center, United States
- Antigen Discovery Inc, United States
- Centro de Investigação em Saúde de Manhiça (CISM), Rua 12, Cambeve, Vila de Manhiça, Mozambique
- Ifakara Health Institute. Bagamoyo Research and Training Centre, United Republic of Tanzania
- Walter Reed Army Institute of Research (WRAIR), United States
- Institute of Tropical Medicine and German Center for Infection Research, Germany
- Centre de Recherches Médicales de Lambaréné (CERMEL), BP 242, Gabon
- Department of Global Health, Boston University School of Public Health, United States
- Broad Institute of Massachusetts Institute of Technology and Harvard, United States
- Harvard T.H. Chan School of Public Health, United States
- Swiss Tropical and Public Health Institute, Switzerland
- University of Basel, Switzerland
- Departments of Laboratory Medicine and Medicine, University of Washington, United States
- Department of Pediatrics, University of Washington, United States
- Department of Global Health, University of Washington, United States
- University of Lausanne and Centre Hospitalier Universitaire Vaudois, Switzerland
Figures
Figure 1

Schematic showing vaccination and sampling schedule.
Participants received RTS,S/AS01 (or comparator) at months 0, 1, and 2; peripheral blood mononuclear cells (PBMCs) were collected for fresh stimulations and RNA-sequencing and for cryopreservation at months 0 and 3 (1-month postfinal primary vaccination dose). Stim, stimulation.
Figure 2
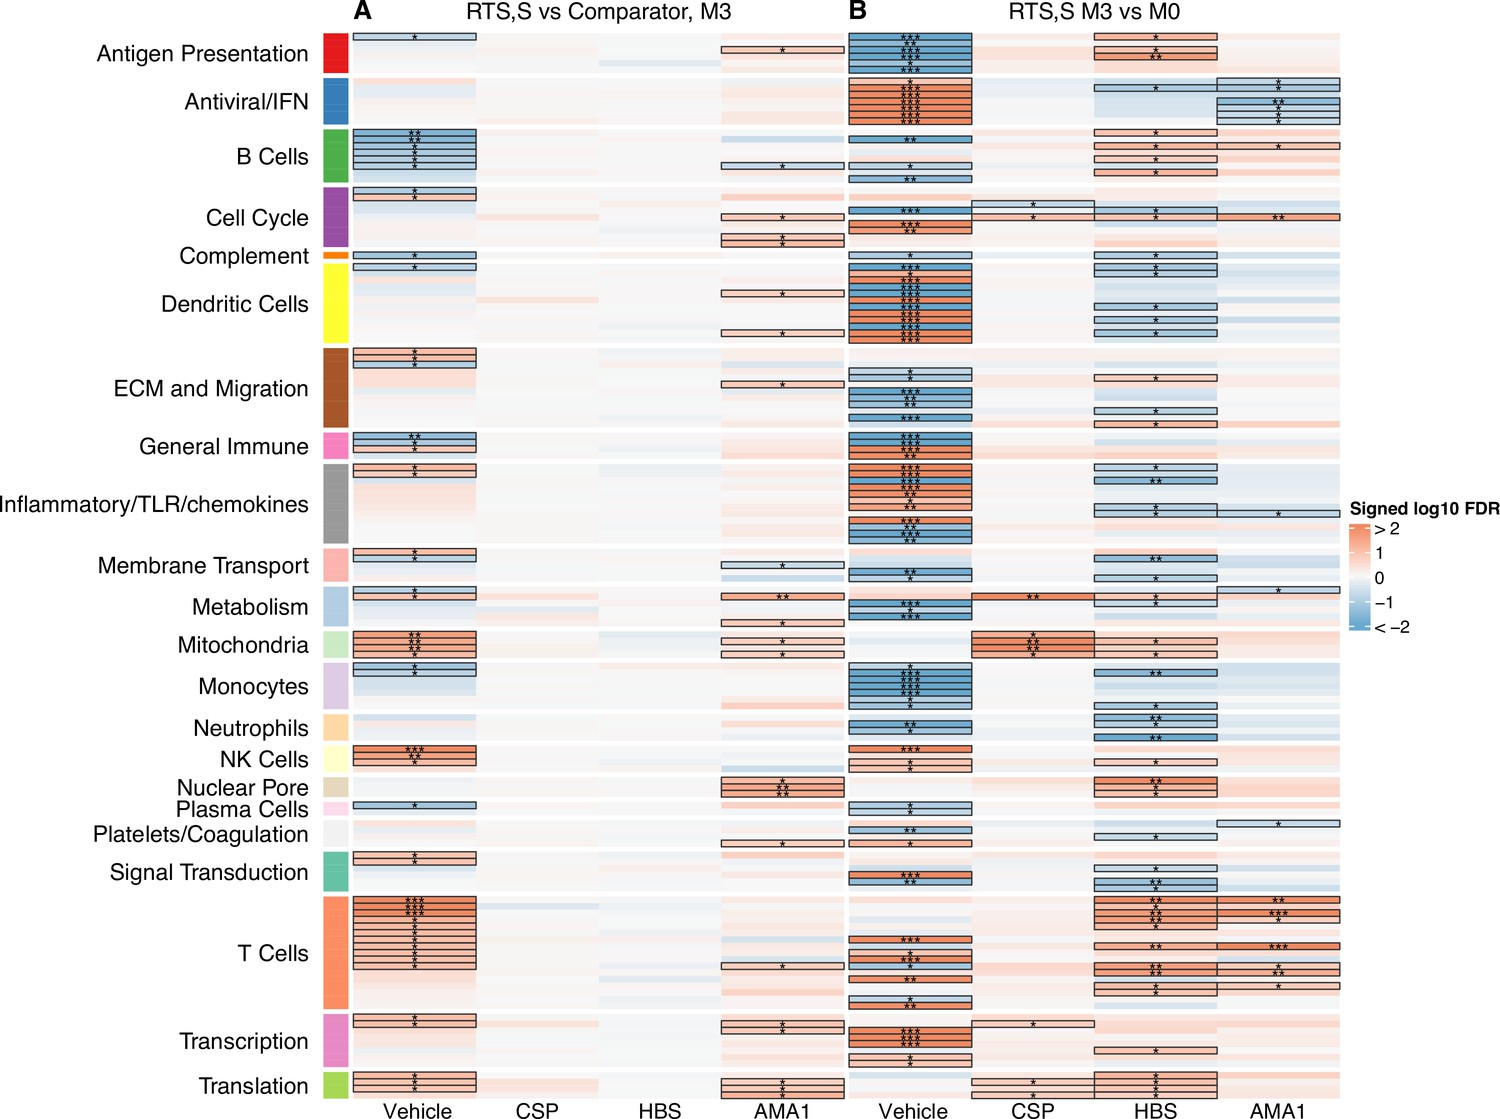
Transcriptional responses and antigen-specific transcriptional responses at 1-month postfinal dose associated with RTS,S/AS01 vaccination.
(A) Comparison 1: month 3 (M3) peripheral blood mononuclear cells (PBMC), RTS,S/AS01 vs. comparator; (B) Comparison 2: M3 PBMC vs. month 0 (M0) PBMC, RTS,S/AS01 recipients only. Cell color intensity represents the significance of the difference in the relevant comparison, expressed as signed log10 false discovery rate (FDR); blood transcriptional modules (BTMs) with significantly different expression (FDR ≤0.2) between the two compared groups are outlined in black. |FDR| < 0.2 (*), <0.05 (**), <0.01 (***). Red, higher expression in RTS,S/AS01 recipients vs. comparator recipients at M3 (Comparison 1) or higher expression in RTS,S/AS01 recipients at M3 vs. M0 (Comparison 2); blue, lower expression in RTS,S/AS01 recipients vs. comparator recipients at M3 (Comparison 1) or lower expression in RTS,S/AS01 recipients at M3 vs. M0 (Comparison 2). High-level BTM annotation groups are shown in the left-most color bar. Numbers of participants in each analysis are: (A) Vehicle: 348 (131 comparator, 217 RTS,S/AS01), CSP: 355 (135 comparator, 220 RTS,S/AS01), HBS: 353 (132 comparator, 221 RTS,S/AS01), and AMA1: 351 (132 comparator, 219 RTS,S/AS01). (B) Vehicle: 221, CSP: 224 (221 vehicle, 219 CSP), HBS: 225 (221 vehicle, 211 HBS), AMA1: 223 (221 vehicle, 195 AMA1). Numbers include participants not part of the case–control cohort, and thus exceed the numbers in Table 1. Each ‘vehicle’ column displays the vaccine effect in vehicle; each ‘stimulation’ column displays the vaccine effect for that stimulation compared to vehicle, that is adjusted for vehicle. Detailed equations are given in Methods.
-
Figure 2—source data 1
List of blood transcriptional modules (BTMs), p values, and false discovery rates (FDRs) for Comparison 1 (RTS,S/AS01 vs. comparator recipients at month 3).
- https://cdn.elifesciences.org/articles/70393/elife-70393-fig2-data1-v1.csv
-
Figure 2—source data 2
List of blood transcriptional modules (BTMs), p values, and false discovery rates (FDRs) for Comparison 2 (RTS,S/AS01 recipients at months 3 vs. 0).
- https://cdn.elifesciences.org/articles/70393/elife-70393-fig2-data2-v1.csv
Figure 3 with 1 supplement
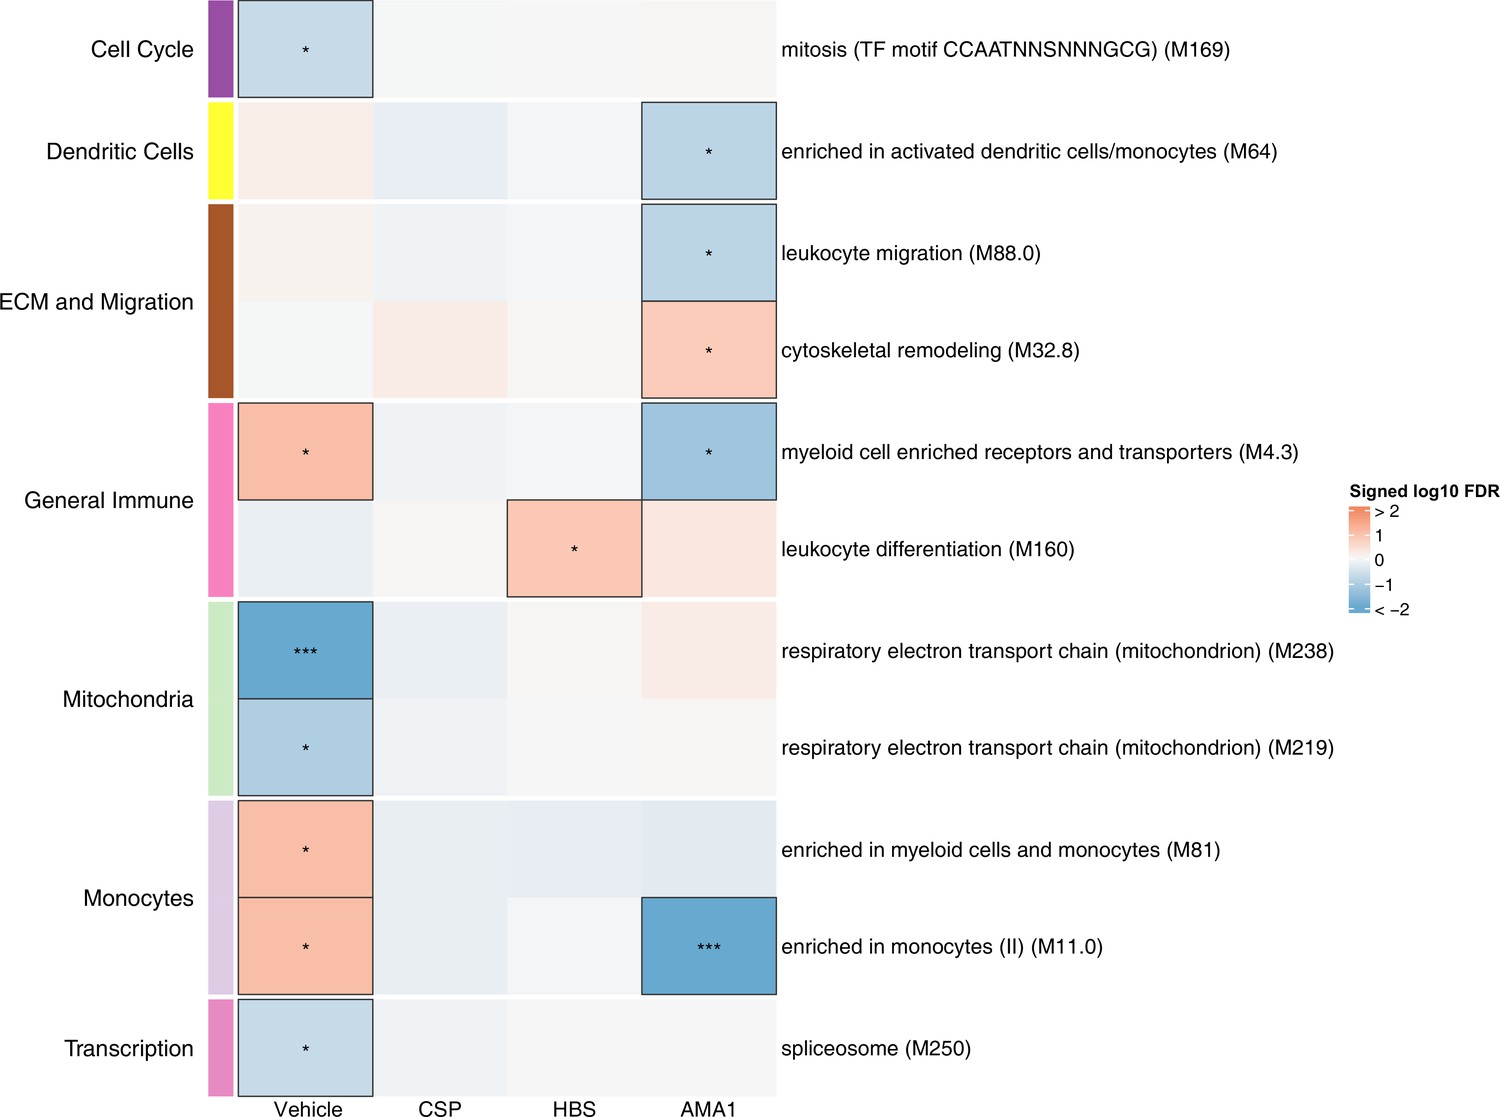
Associations of month 3 levels of RTS,S/AS01 signature blood transcriptional modules (BTMs) with malaria case status in RTS,S/AS01 recipients.
Heatmap showing downselected signature BTMs (Comparison 1) with significantly different expression (false discovery rate [FDR] ≤0.2) in month 3 peripheral blood mononuclear cells (PBMC) from RTS,S/AS01 malaria cases vs. nonmalaria controls, in at least one stimulation condition. Cell color intensity represents the significance of the difference in the relevant comparison, expressed as signed log10 FDR; BTMs with significantly different expression in the comparison are outlined in black. |FDR| < 0.2 (*), <0.05 (**), <0.01 (***). Red, higher expression in RTS,S/AS01 cases vs. controls; blue, lower expression in RTS,S/AS01 cases vs. controls. High-level BTM annotation groups are shown in the left-most color bar. Numbers of participants in each analysis are: vehicle: 122, CSP: 123 (122 vehicle, 122 CSP), HBS: 123 (122 vehicle, 115 HBS), AMA1: 123 (122 vehicle, 97 AMA1). The ‘vehicle’ column displays the vaccine effect in vehicle; each ‘stimulation’ column displays the vaccine effect for that stimulation compared to vehicle, that is adjusted for vehicle. Detailed equations are given in Methods.
-
Figure 3—source data 1
List of blood transcriptional modules (BTMs), p values, and false discovery rates (FDRs) for the comparison of RTS,S/AS01 cases vs. controls at month 3, within each stimulation condition.
- https://cdn.elifesciences.org/articles/70393/elife-70393-fig3-data1-v1.csv
Figure 3—figure supplement 1
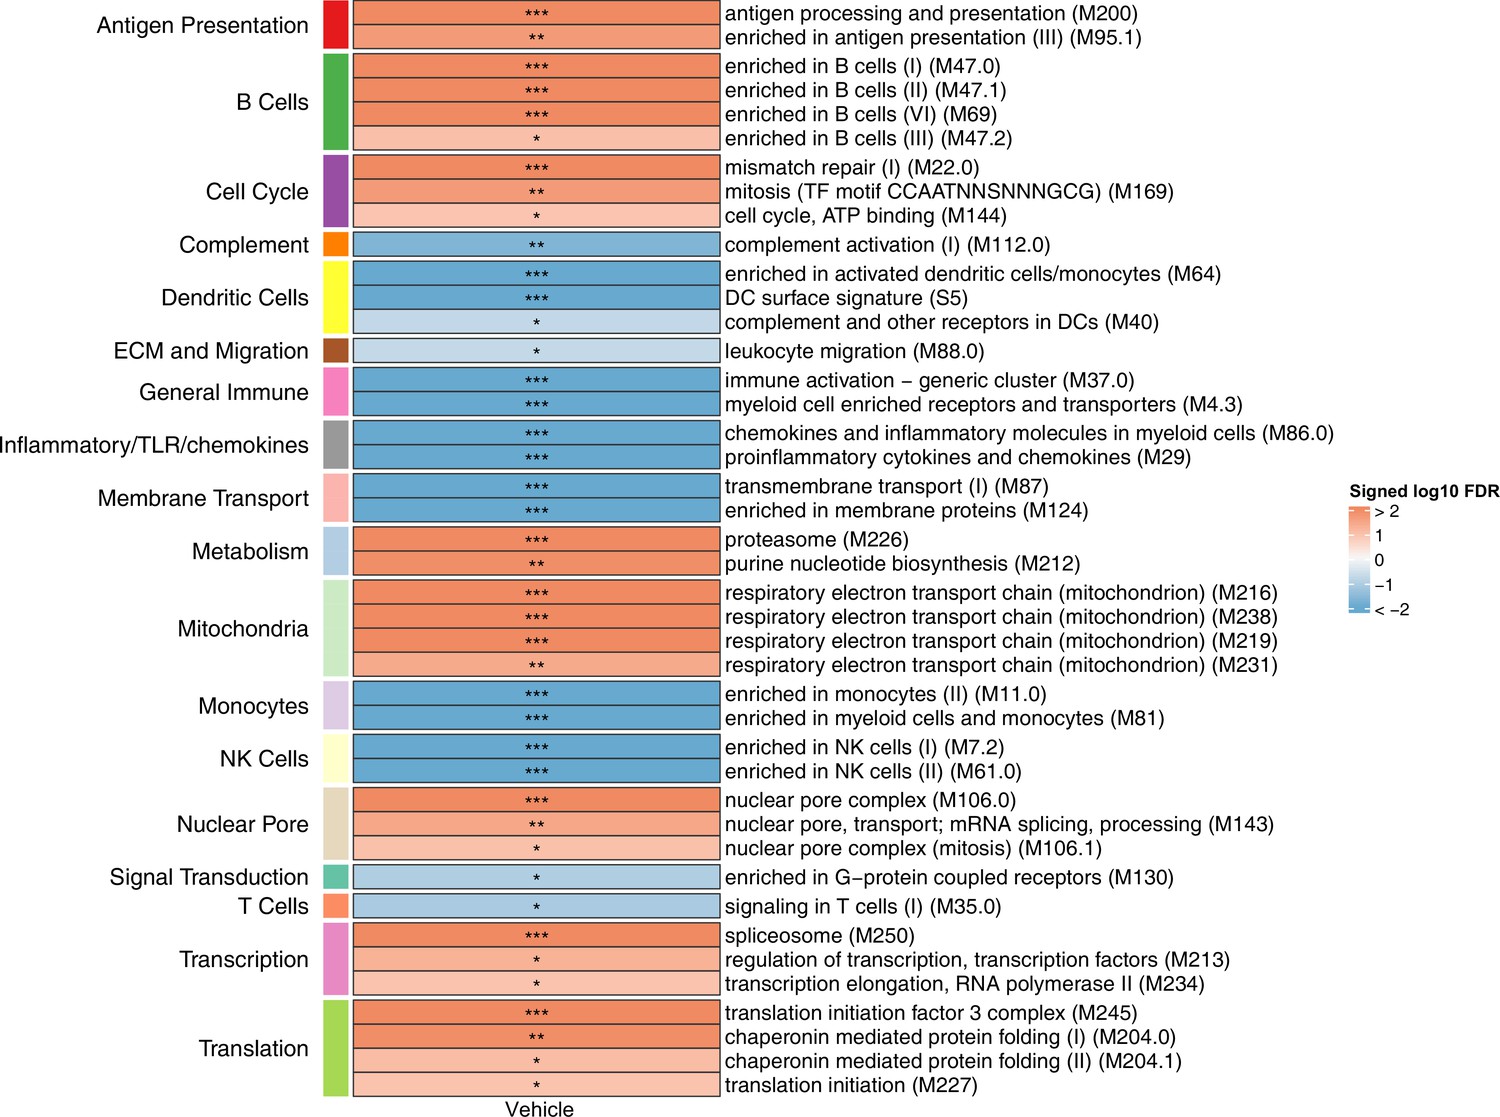
Associations of month 3 levels of RTS,S/AS01 signature blood transcriptional modules (BTMs) with malaria case status in comparator recipients.
Heatmap showing which of the 68 downselected RTS,S/AS01 signature BTMs (Comparison 1) showed significantly different expression (false discovery rate [FDR] ≤ 0.2) in month 3 peripheral blood mononuclear cells (PBMC) between comparator cases vs. nonmalaria controls in vehicle-stimulated PBMC from comparator recipients. |FDR| < 0.2 (*), <0.05 (**), and <0.01 (***). Analyses were also done with antigen-stimulated PBMC but are not shown here as none of the results were significant (only vehicle had any significant BTMs). Cell color intensity represents the strength of the difference in the relevant comparison, expressed as signed log10 FDR. Red, higher expression in comparator cases vs. controls; blue, lower expression in comparator cases vs. controls. High-level BTM annotation groups are shown in the left-most color bar.
-
Figure 3—figure supplement 1—source data 1
List of blood transcriptional modules (BTMs), p values, and false discovery rates (FDRs) for the comparison of comparator cases vs. controls at month 3, within each stimulation condition.
- https://cdn.elifesciences.org/articles/70393/elife-70393-fig3-figsupp1-data1-v1.csv
Figure 4
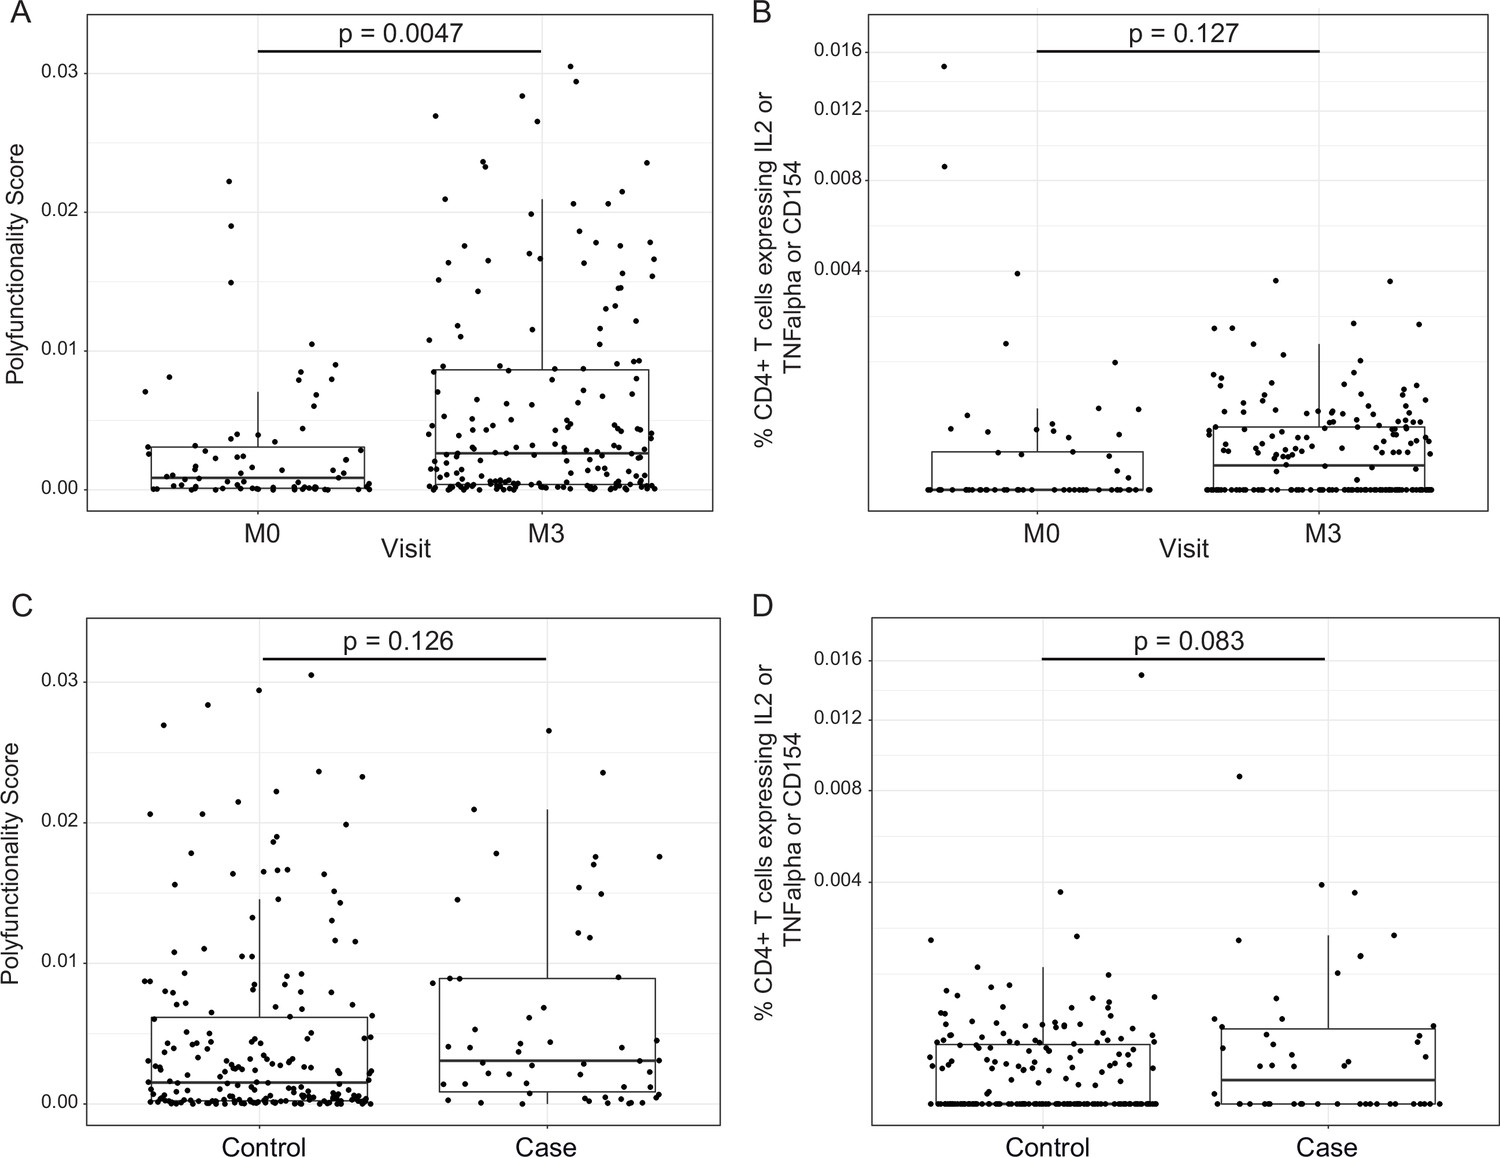
RTS,S/AS01 vaccination elicits circumsporozoite protein (CSP)-specific polyfunctional T-cell responses that do not correlate with clinical malaria risk.
Boxplots show (A) polyfunctionality score and (B) magnitude (% CD4+ T cells expressing IL2 or TNF-α or CD154) of CSP-specific CD4+ T-cell responses in RTS,S/AS01 recipients as assessed by intracellular cytokine staining of peripheral blood mononuclear cells (PBMC) collected at month 0 (M0) or at month 3 (M3). Each dot represents a single participant. Data plotted include all available months 0 and 3 samples, that is paired months 0–3 samples were not required for plotting. (C) Polyfunctionality score and (D) magnitude of CSP-specific CD4+ T-cell responses in RTS,S/AS01 vaccine recipients at month 3, stratified by case–control status. In panels A and B, p values were obtained using a mixed-effects model with participant as a random effect. In panels C and D, p values were obtained using a mixed-effects model with match_id as a random effect. Number of participants in each panel is: (A) 213 (73 M0 and 182 M3), (B) 194 (61 M0, 175 M3), (C) 37 cases and 145 controls, and (D) 36 cases and 139 controls.
Figure 5 with 1 supplement
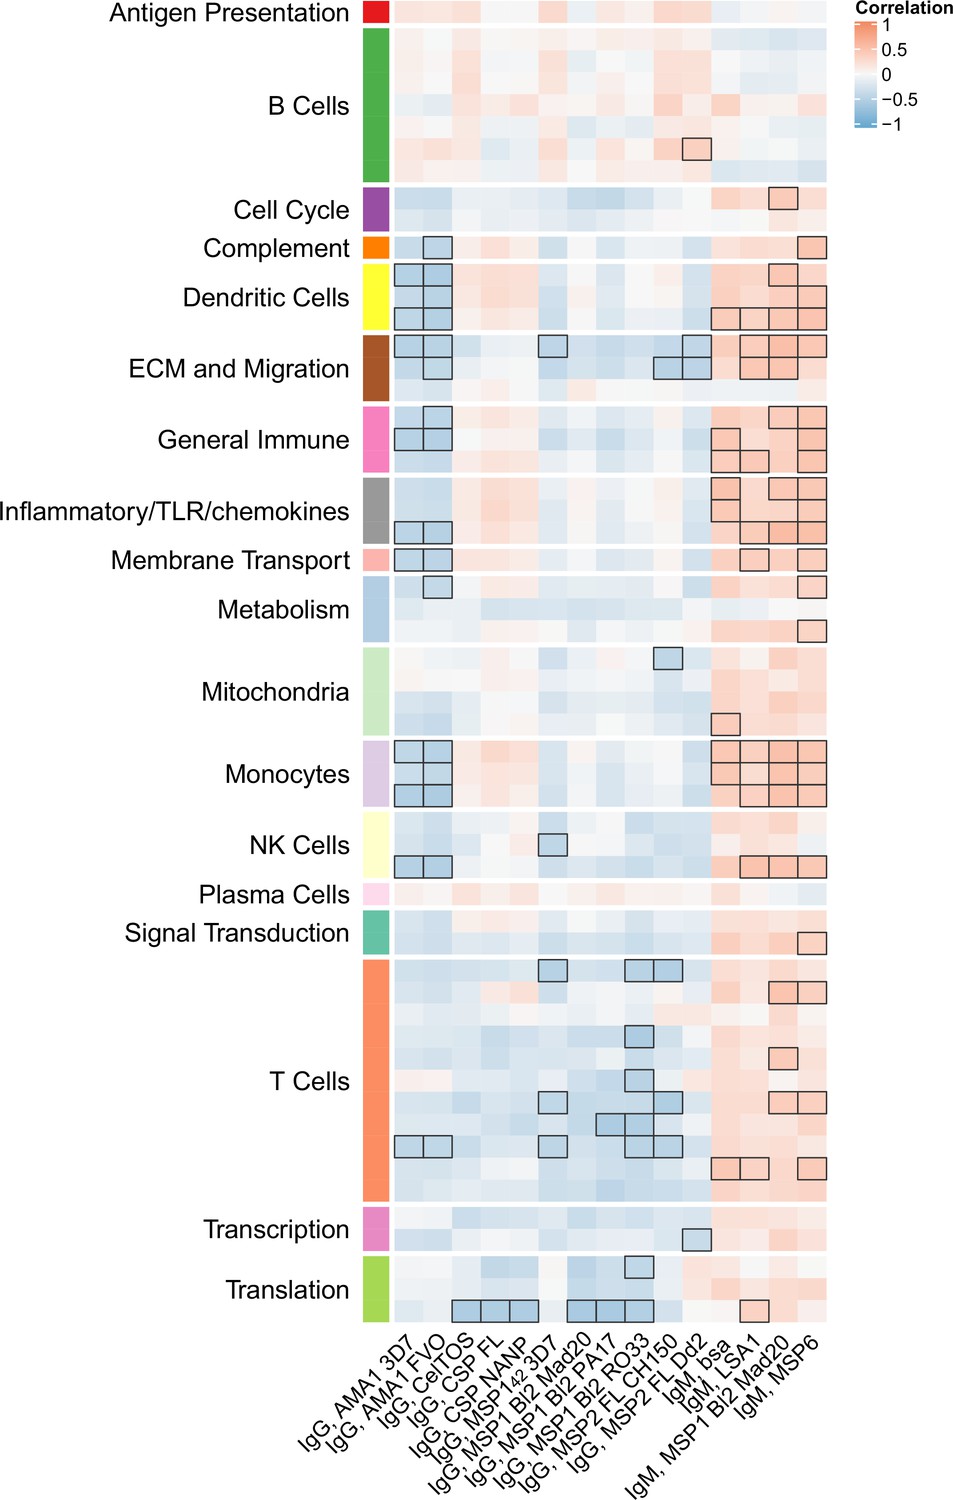
Correlations of month 3 transcriptional and adaptive responses in RTS,S/AS01 vaccine recipients.
Heatmap showing correlations between month 3 levels of RTS,S/AS01 signature blood transcriptional modules (BTMs) in vehicle-treated peripheral blood mononuclear cells (PBMC) and month 3 antibody responses. Cell color intensity represents the strength of the correlation; BTM/response pairs with significant correlations (false discovery rate [FDR] ≤0.2) are outlined in black. Cell color represents correlation direction: red, positive correlation; blue, negative correlation. High-level BTM annotation groups are shown in the left-most color bar. Number of participants: 30–42.
-
Figure 5—source data 1
List of blood transcriptional modules (BTMs) whose month 3 levels in vehicle-treated peripheral blood mononuclear cells (PBMC) correlated significantly with at least one month 3 adaptive response variable in RTS,S/AS01 vaccinees, along with variable details, p value, and false discovery rate (FDR) results.
- https://cdn.elifesciences.org/articles/70393/elife-70393-fig5-data1-v1.csv
Figure 5—figure supplement 1
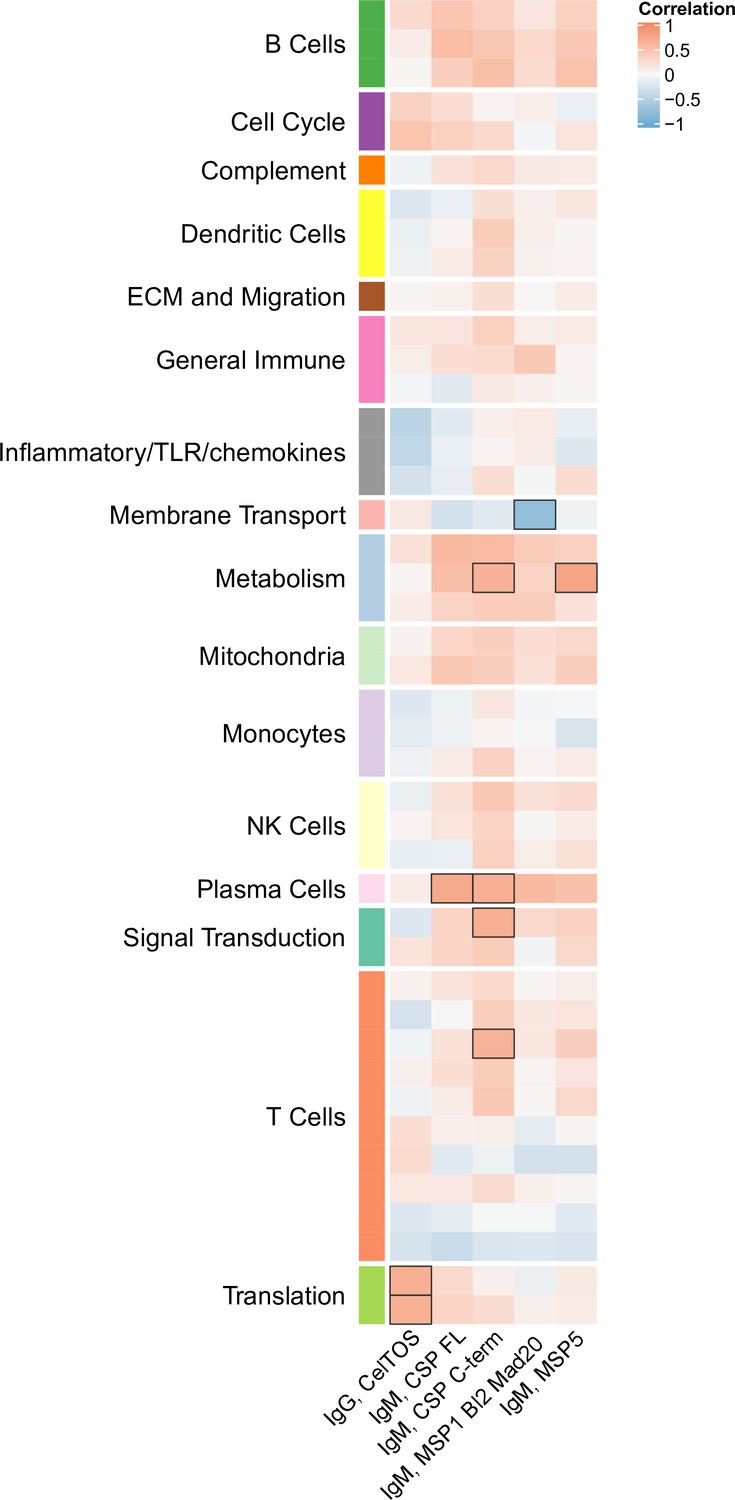
Correlations of transcriptional and adaptive responses in comparator vaccine recipients.
Heatmap showing significant correlations between month 3 levels of RTS,S/AS01 signature blood transcriptional modules (BTMs) in vehicle-treated peripheral blood mononuclear cells (PBMC) and month 3 antibody responses in comparator recipients. Cell color intensity represents the strength of the correlation; BTM/response pairs with significant correlations (false discovery rate [FDR] ≤0.2) are outlined in black. Cell color represents correlation direction: red, positive correlation; blue, negative correlation. High-level BTM annotation groups are shown in the left-most color bar. No correlations with month 3 cellular responses were seen.
-
Figure 5—figure supplement 1—source data 1
List of blood transcriptional modules (BTMs) whose month 3 levels in vehicle-treated peripheral blood mononuclear cells (PBMC) correlated significantly with at least one month 3 adaptive response variable in comparator recipients, along with variable details, p value, and false discovery rate (FDR) results.
- https://cdn.elifesciences.org/articles/70393/elife-70393-fig5-figsupp1-data1-v1.csv
Figure 6 with 10 supplements

Associations of (A) month 3 or (B) month 0 levels of downselected blood transcriptional modules (BTMs) with malaria case status RTS,S/AS01 vaccine recipients across studies sharing a common months 0, 1, and 2 RTS,S/AS01 arm.
(A) Heatmap showing the difference in month 3 peripheral blood mononuclear cell (PBMC) BTM expression between RTS,S/AS01 cases vs. controls, in each of three controlled human malaria infection (CHMI) studies, of the seven BTMs whose month 3 levels in vehicle-stimulated PBMC associated with malaria case status in MAL067 (Figure 3). ‘Month 3’ = 21-day postfinal dose in MAL068 and MAL071, and 14-day postfinal dose in WRAIR 1032. BTMs with significantly different expression (false discovery rate [FDR] ≤0.2, with adjustment done across the five BTMs) are outlined in black. |FDR| < 0.2 (*), <0.05 (**), <0.01 (***). (B) Heatmap showing the 45 BTMs whose month 0 levels showed significantly different expression in MAL067 RTS,S/AS01 malaria cases vs. nonmalaria controls. These 45 BTMs were also examined as potential correlates of challenge outcome in each of the 3 CHMI studies. Significantly different expression is defined as FDR ≤0.2, with adjustment across the 45 BTMs. All data shown are from participants who received the same vaccine regimen: a dose of RTS,S/AS01 at months 0, 1, and 2. Cell color intensity represents the significance of the difference in the case vs. control comparison, expressed as signed log10 FDR; BTMs with significantly different expression (FDR ≤0.2) between the two compared groups are outlined in black. |FDR| < 0.2 (*), <0.05 (**), <0.01 (***). Red, higher expression in RTS,S/AS01 cases vs. controls; blue, lower expression in RTS,S/AS01 cases vs. controls. High-level BTM annotation groups are shown in the left-most color bar. Numbers of participants in each analysis are: (A) MAL067, 122; WRAIR 1032, 39; MAL068 RRR, 21; MAL071 RRR, 16. (B) MAL067, 37; WRAIR 1032, 39; MAL068 RRR, 21; MAL071 RRR, 16. Detailed equations are given in Methods.
-
Figure 6—source data 1
List of the seven blood transcriptional modules (BTMs) whose month 3 levels had significantly different expression in RTS,S/AS01 cases vs. controls in MAL067, along with p values and false discovery rate (FDR) results when testing these seven BTMs for significantly different expression in cases vs. controls in the WRAIR 1032, MAL068 RRR, and MAL071 RRR studies.
- https://cdn.elifesciences.org/articles/70393/elife-70393-fig6-data1-v1.csv
-
Figure 6—source data 2
List of the 45 blood transcriptional modules (BTMs) whose month 0 levels had significantly different expression in RTS,S/AS01 cases vs. controls in MAL067, along with p values and false discovery rate (FDR) results when testing these 45 BTMs for significantly different expression in cases vs. controls in the WRAIR 1032, MAL068 RRR, and MAL071 RRR studies.
- https://cdn.elifesciences.org/articles/70393/elife-70393-fig6-data2-v1.csv
Figure 6—figure supplement 1
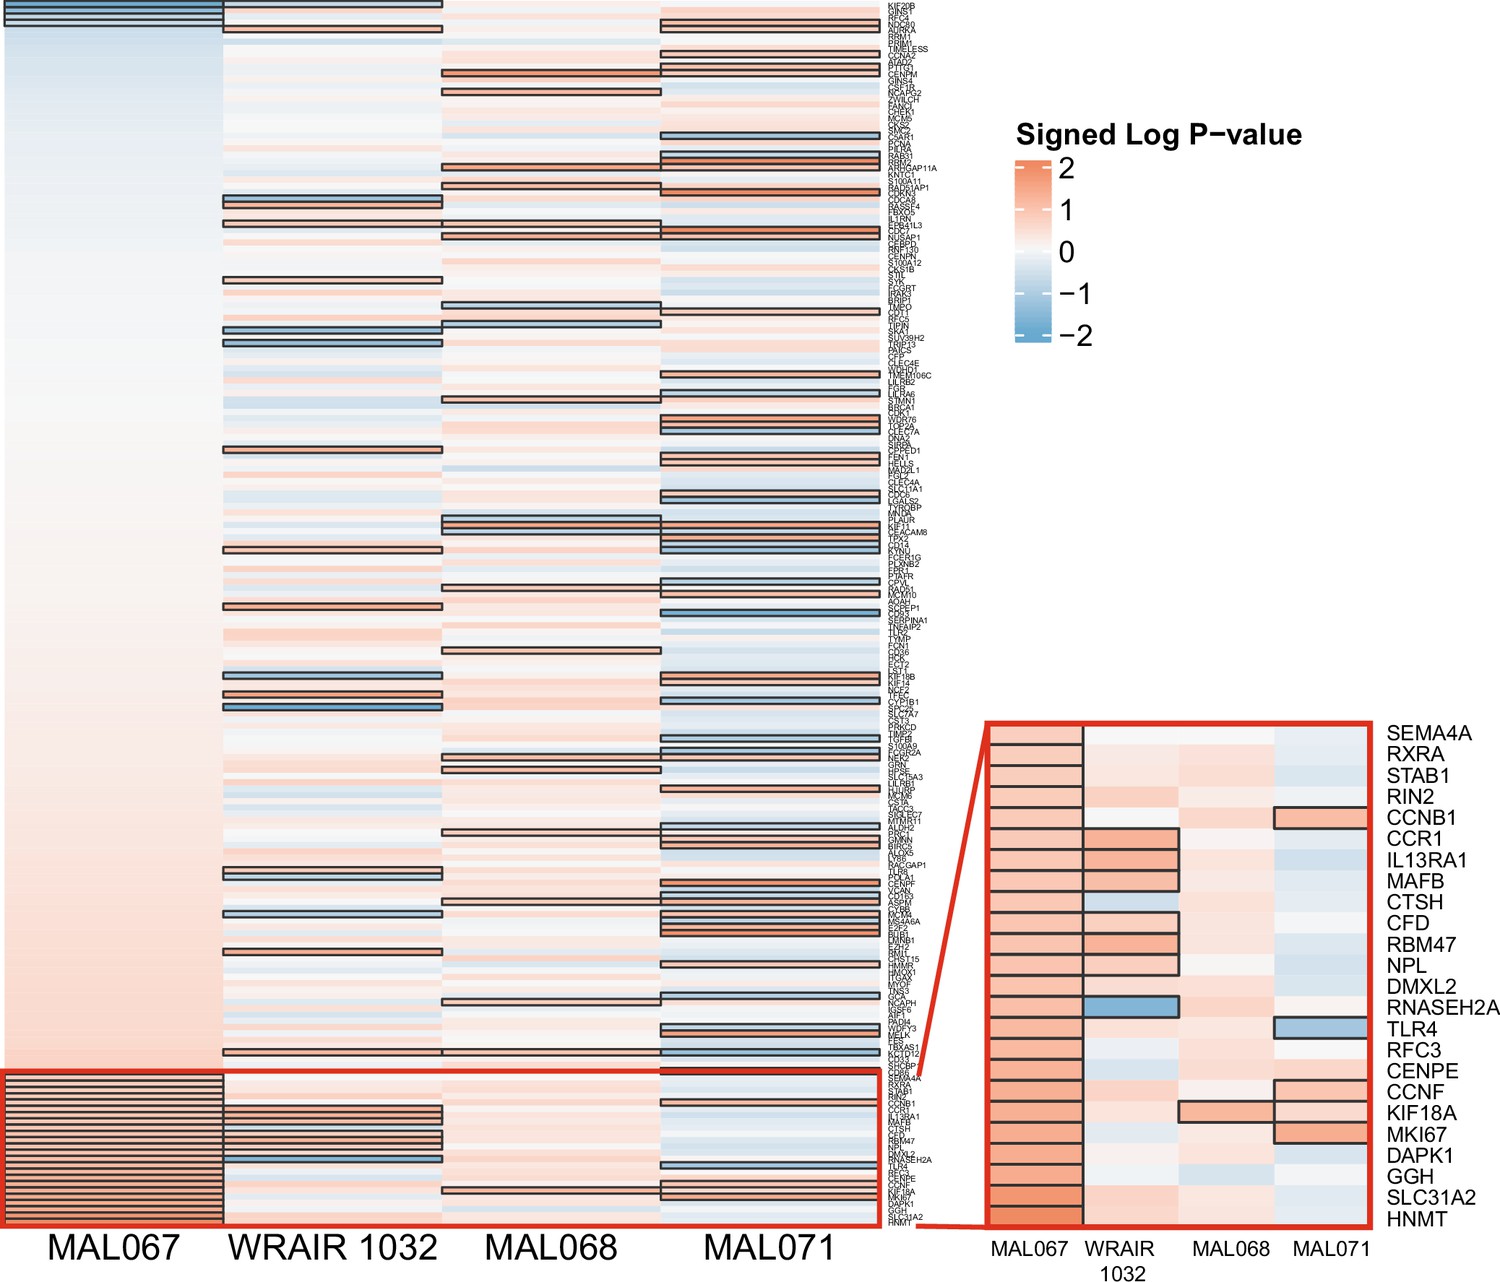
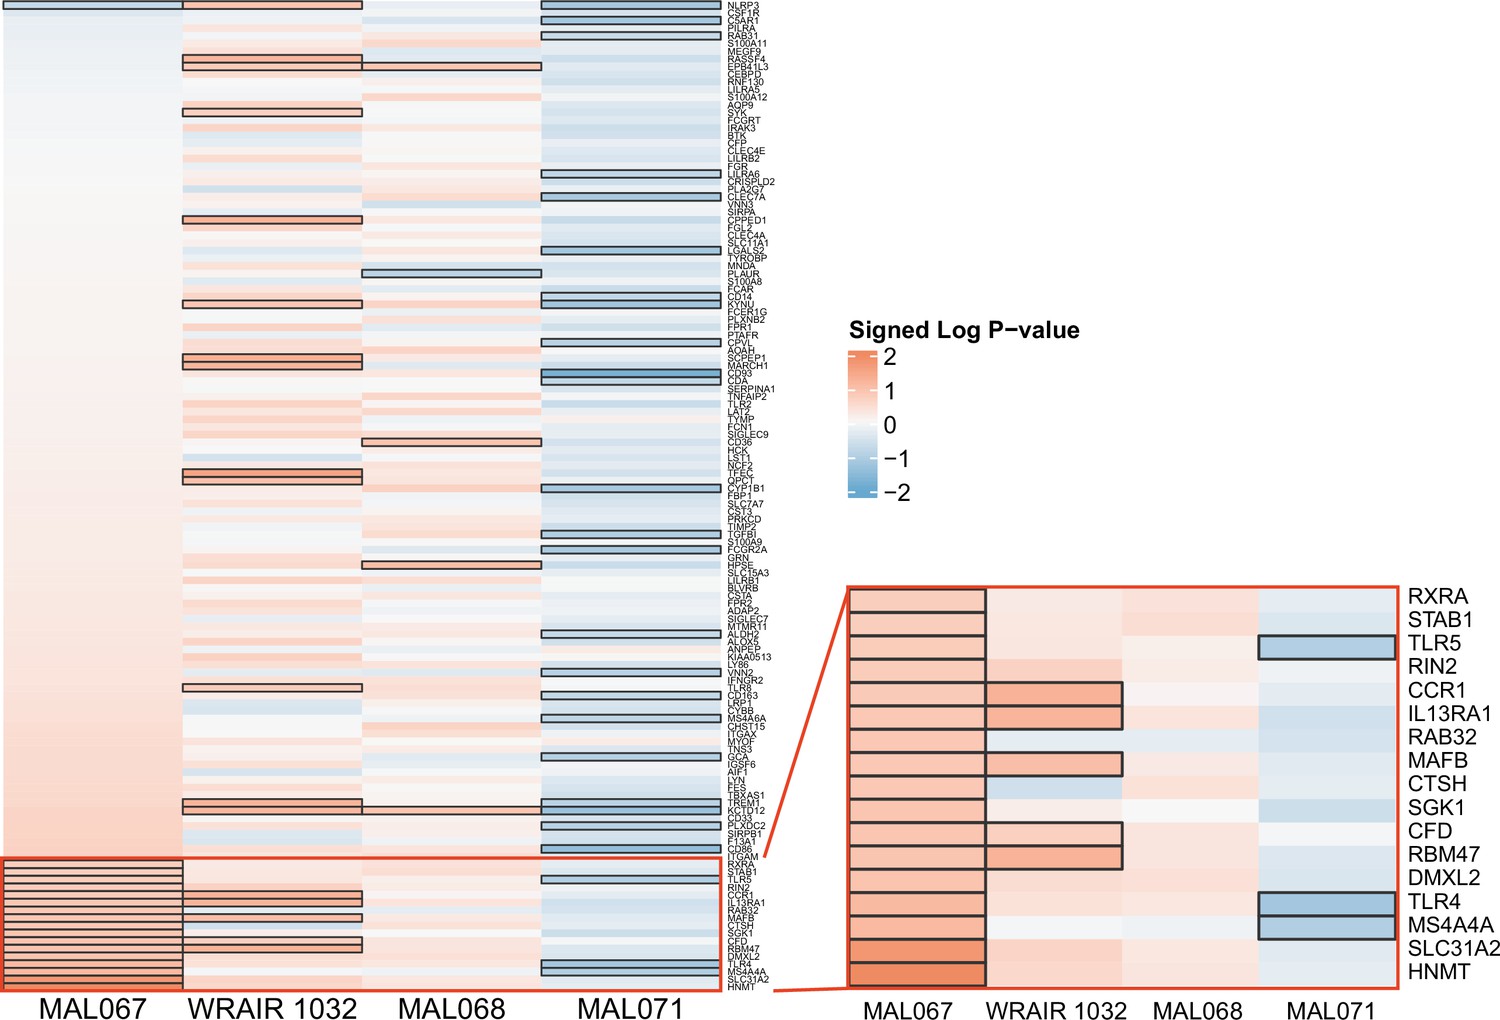
Association of month 0 level of each gene in the ‘cell cycle and transcription (M4.0)’ module with malaria case status across studies sharing a common months 0, 1, and 2 RTS,S/AS01 arm.
Cell color intensity represents the strength of the difference in the case vs. control comparison, expressed as signed log10 p value; genes with significantly different expression (false discovery rate ≤0.2) between the two compared groups are outlined in black. Red, higher expression in RTS,S/AS01 cases vs. controls; blue, lower expression in RTS,S/AS01 cases vs. controls. The red-outlined portion of the heatmap in the lower right corresponds to an expanded view of the red-outlined portion of the heatmap on the left, for increased legibility of gene names.
Figure 6—figure supplement 2
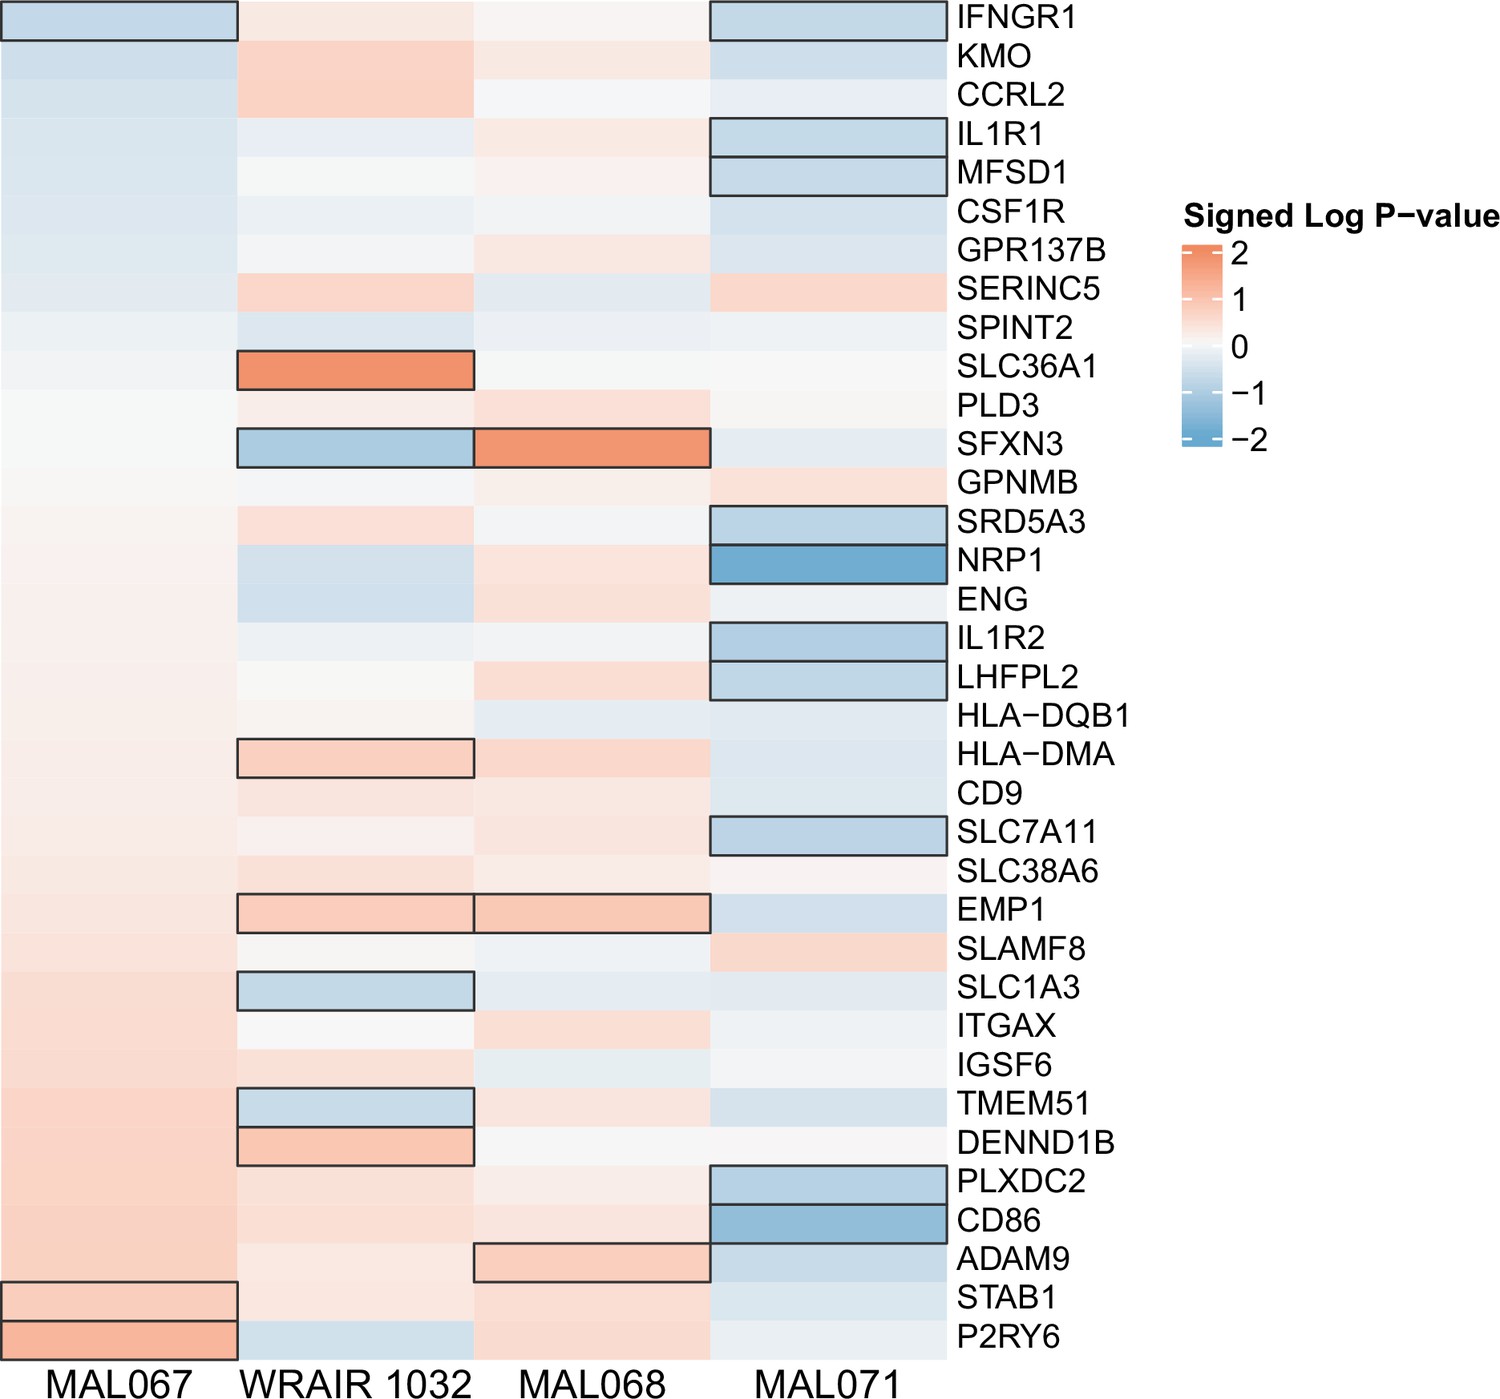
Association of month 0 level of each gene in the ‘Resting dendritic cell surface signature (S10)’ module with malaria case status across studies sharing a common months 0, 1, and 2 RTS,S/AS01 arm.
Cell color intensity represents the strength of the difference in the case vs. control comparison, expressed as signed log10 p value; genes with significantly different expression (false discovery rate ≤0.2) between the two compared groups are outlined in black. Red, higher expression in RTS,S/AS01 cases vs. controls; blue, lower expression in RTS,S/AS01 cases vs. controls.
Figure 6—figure supplement 3
Association of month 0 level of each gene in the ‘DC surface signature (S5)’ module with malaria case status across studies sharing a common months 0, 1, and 2 RTS,S/AS01 arm.
Cell color intensity represents the strength of the difference in the case vs. control comparison, expressed as signed log10 p value; genes with significantly different expression (false discovery rate ≤0.2) between the two compared groups are outlined in black. Red, higher expression in RTS,S/AS01 cases vs. controls; blue, lower expression in RTS,S/AS01 cases vs. controls.
Figure 6—figure supplement 4
Association of month 0 level of each gene in the ‘Enriched in dendritic cells (M168)’ module with malaria case status across studies sharing a common months 0, 1, and 2 RTS,S/AS01 arm.
Cell color intensity represents the strength of the difference in the case vs. control comparison, expressed as signed log10 p value; genes with significantly different expression (false discovery rate ≤0.2) between the two compared groups are outlined in black. Red, higher expression in RTS,S/AS01 cases vs. controls; blue, lower expression in RTS,S/AS01 cases vs. controls.
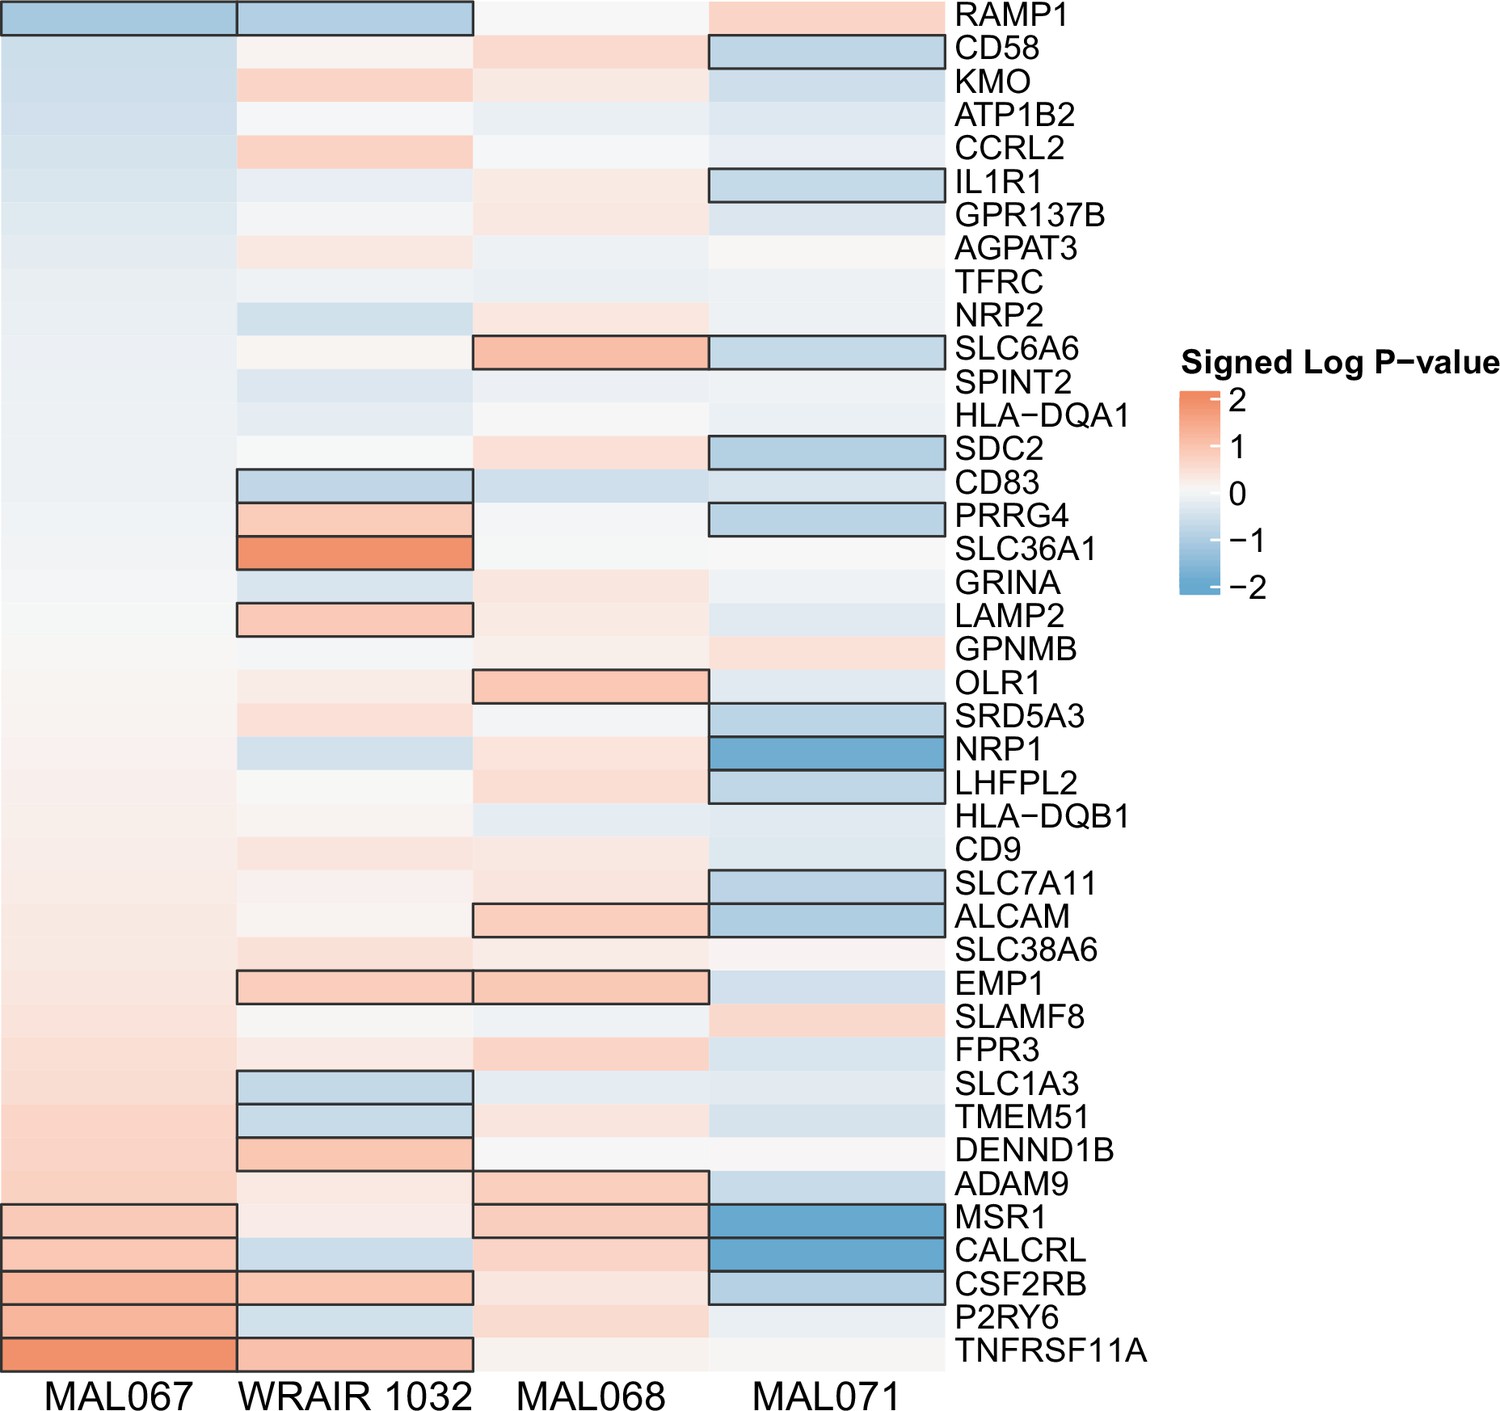
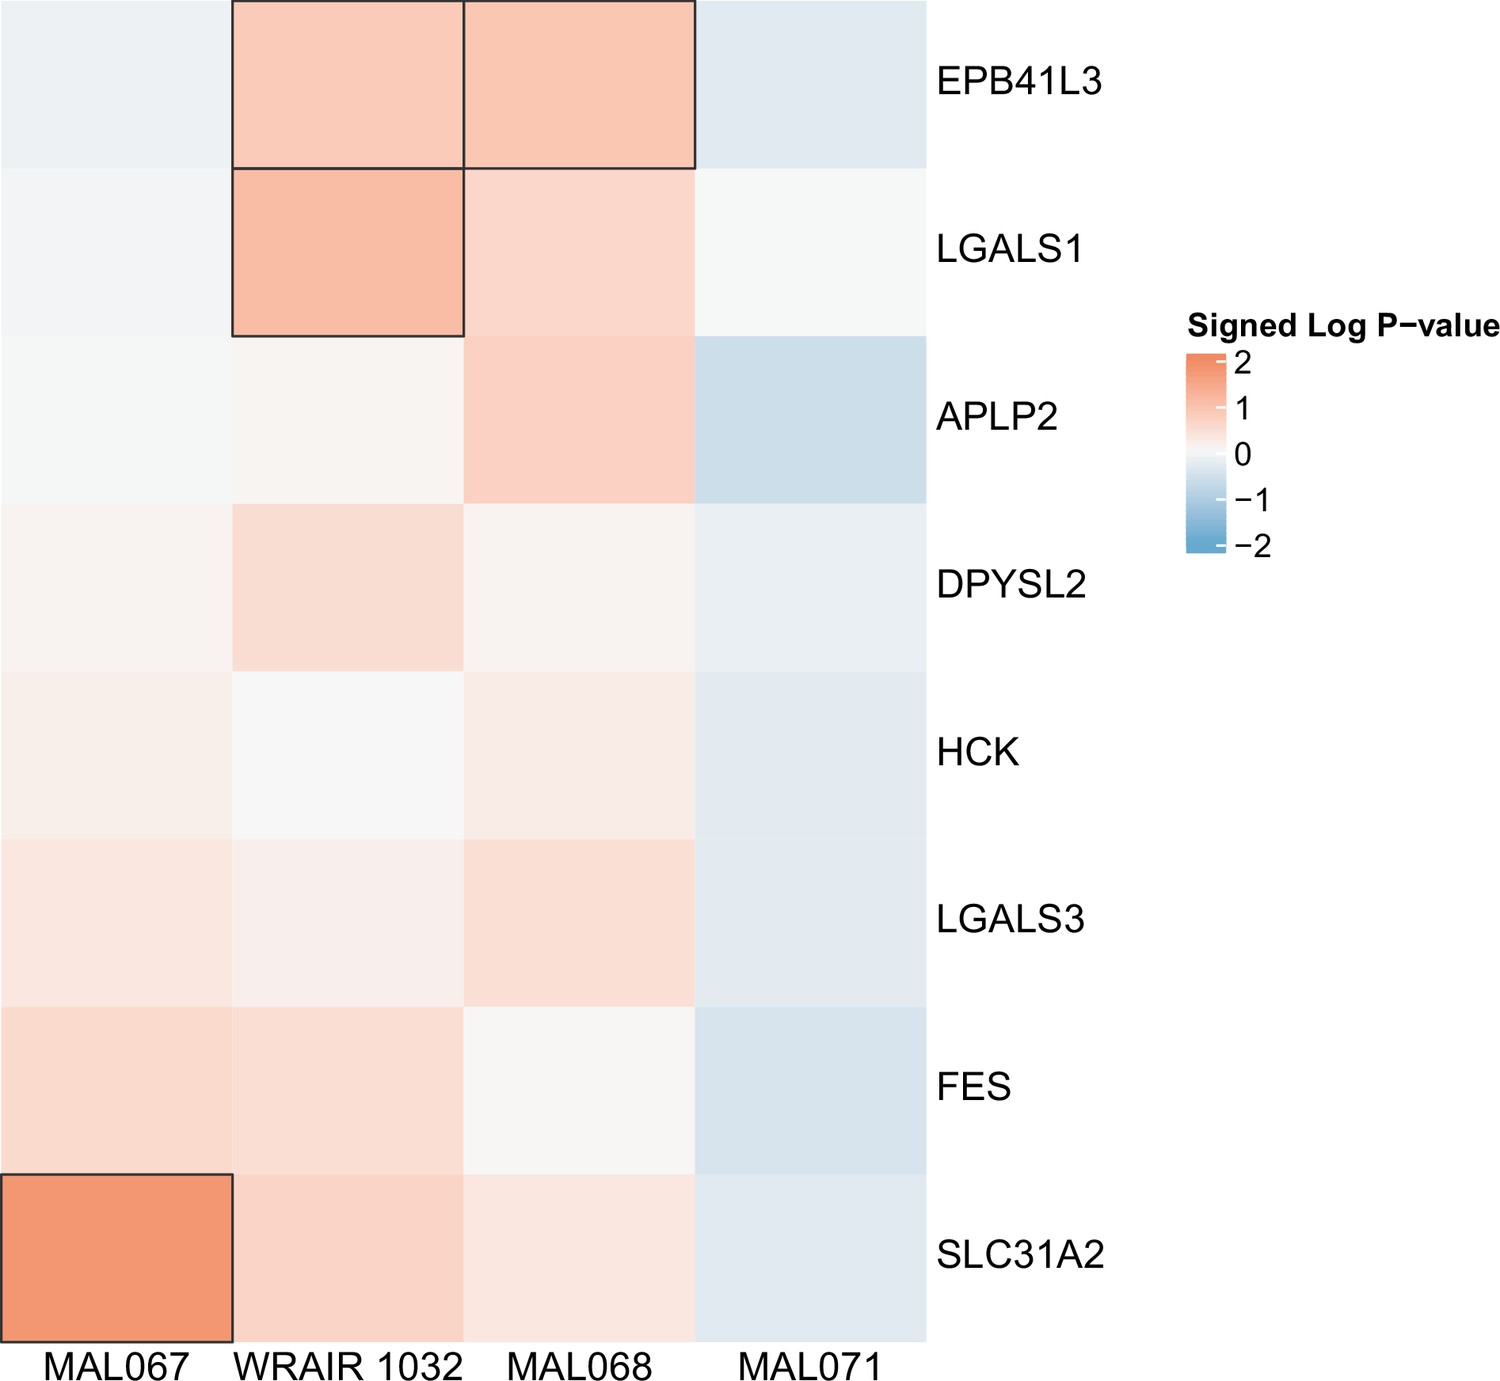
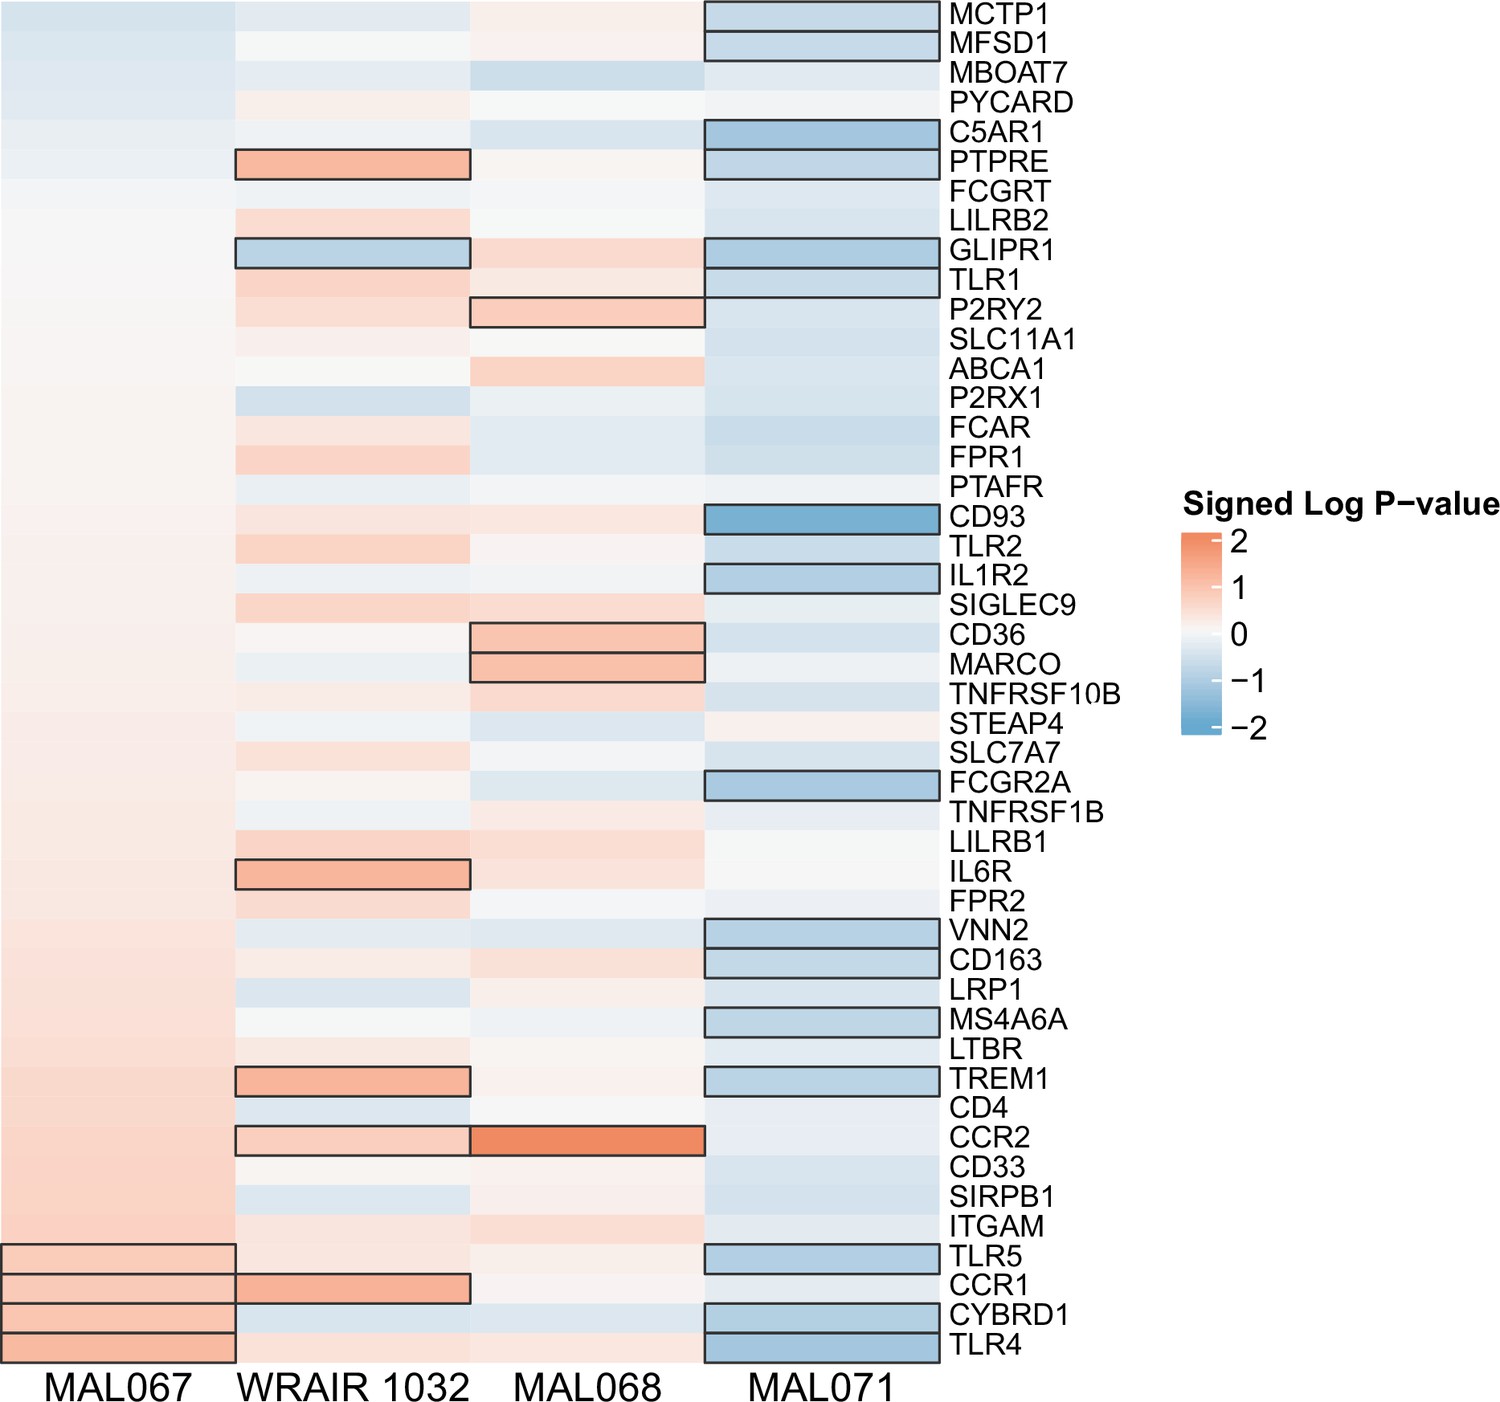
Figure 6—figure supplement 5
Association of month 0 level of each gene in the ‘Myeloid cell enriched receptors and transporters (M4.3)’ module with malaria case status across studies sharing a common months 0, 1, and 2 RTS,S/AS01 arm.
Cell color intensity represents the strength of the difference in the case vs. control comparison, expressed as signed log10 p value; genes with significantly different expression (false discovery rate ≤0.2) between the two compared groups are outlined in black. Red, higher expression in RTS,S/AS01 cases vs. controls; blue, lower expression in RTS,S/AS01 cases vs. controls.
Figure 6—figure supplement 6
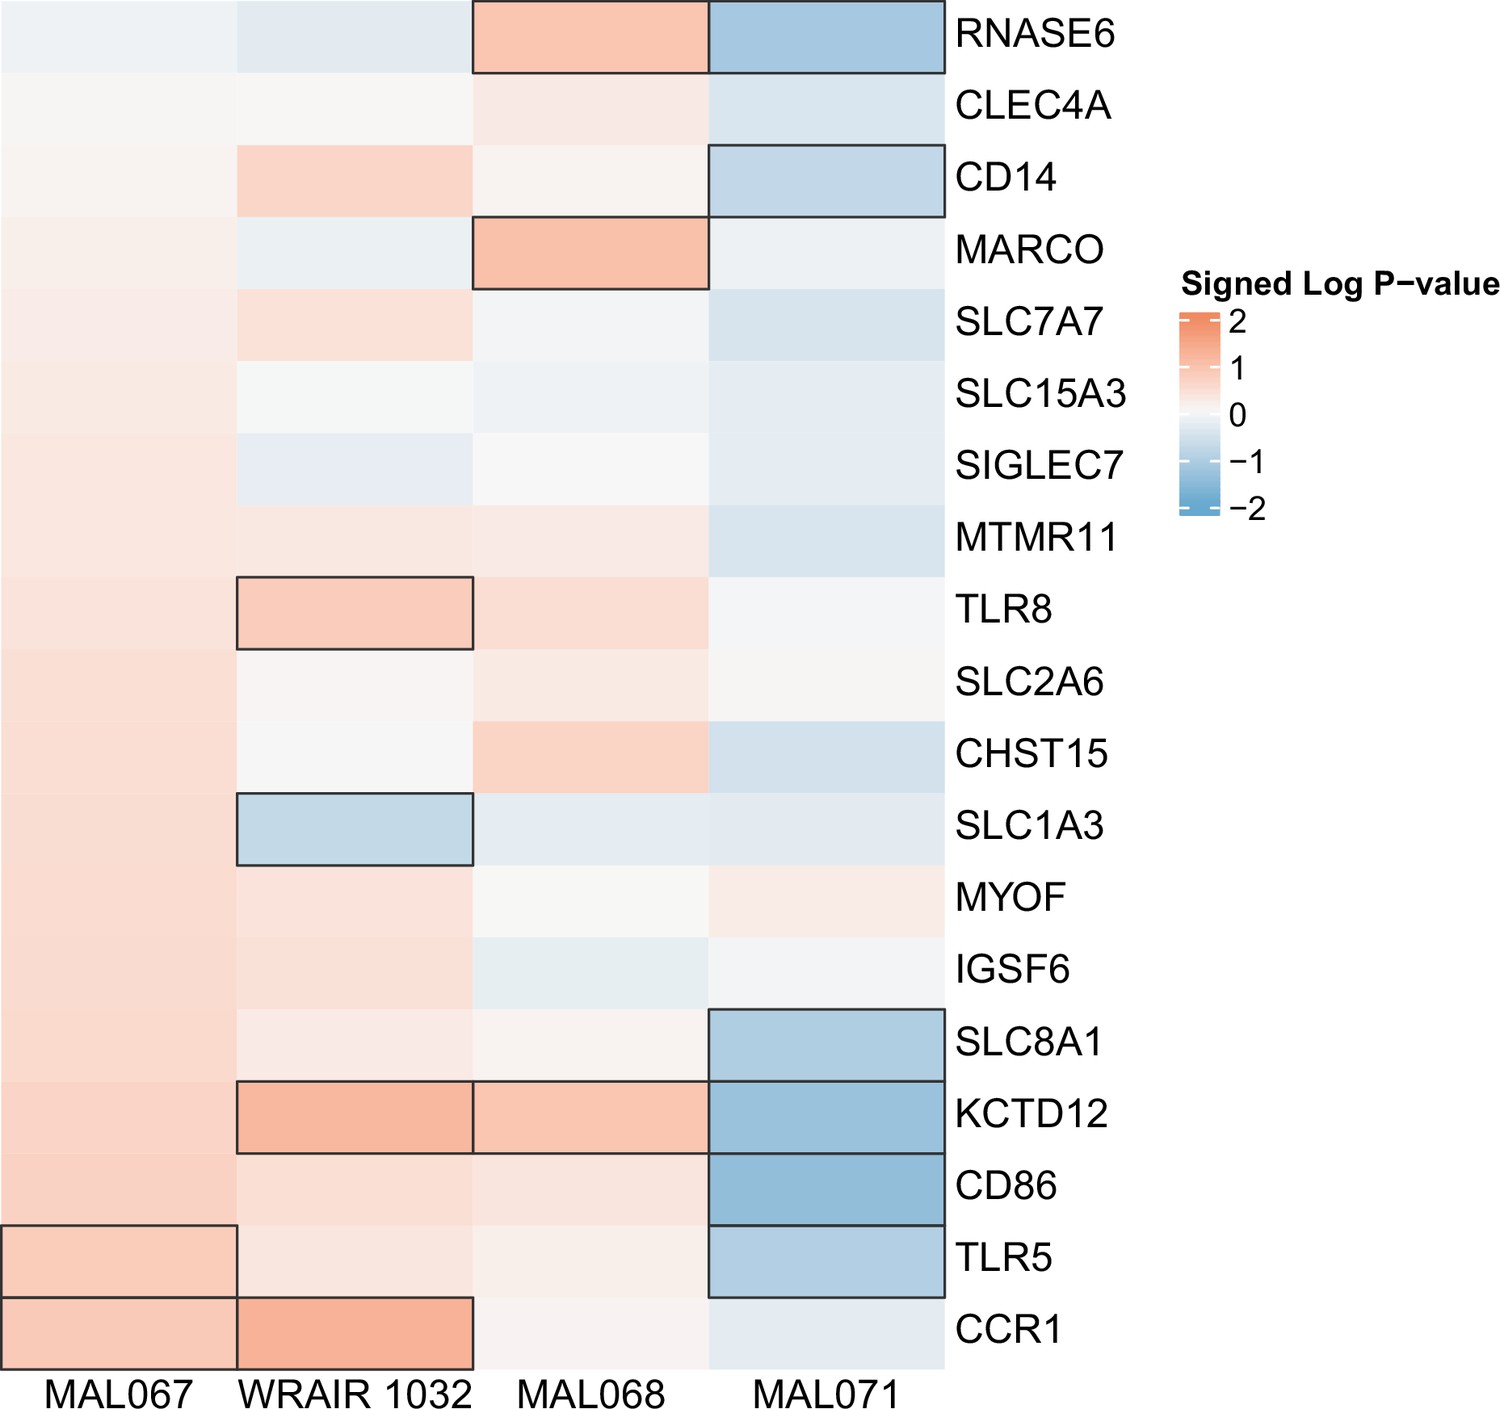
Association of month 0 level of each gene in the ‘Enriched in monocytes (II) (M11.0)’ module with malaria case status across studies sharing a common months 0, 1, and 2 RTS,S/AS01 arm.
Cell color intensity represents the strength of the difference in the case vs. control comparison, expressed as signed log10 p value; genes with significantly different expression (false discovery rate ≤0.2) between the two compared groups are outlined in black. Red, higher expression in RTS,S/AS01 cases vs. controls; blue, lower expression in RTS,S/AS01 cases vs. controls.
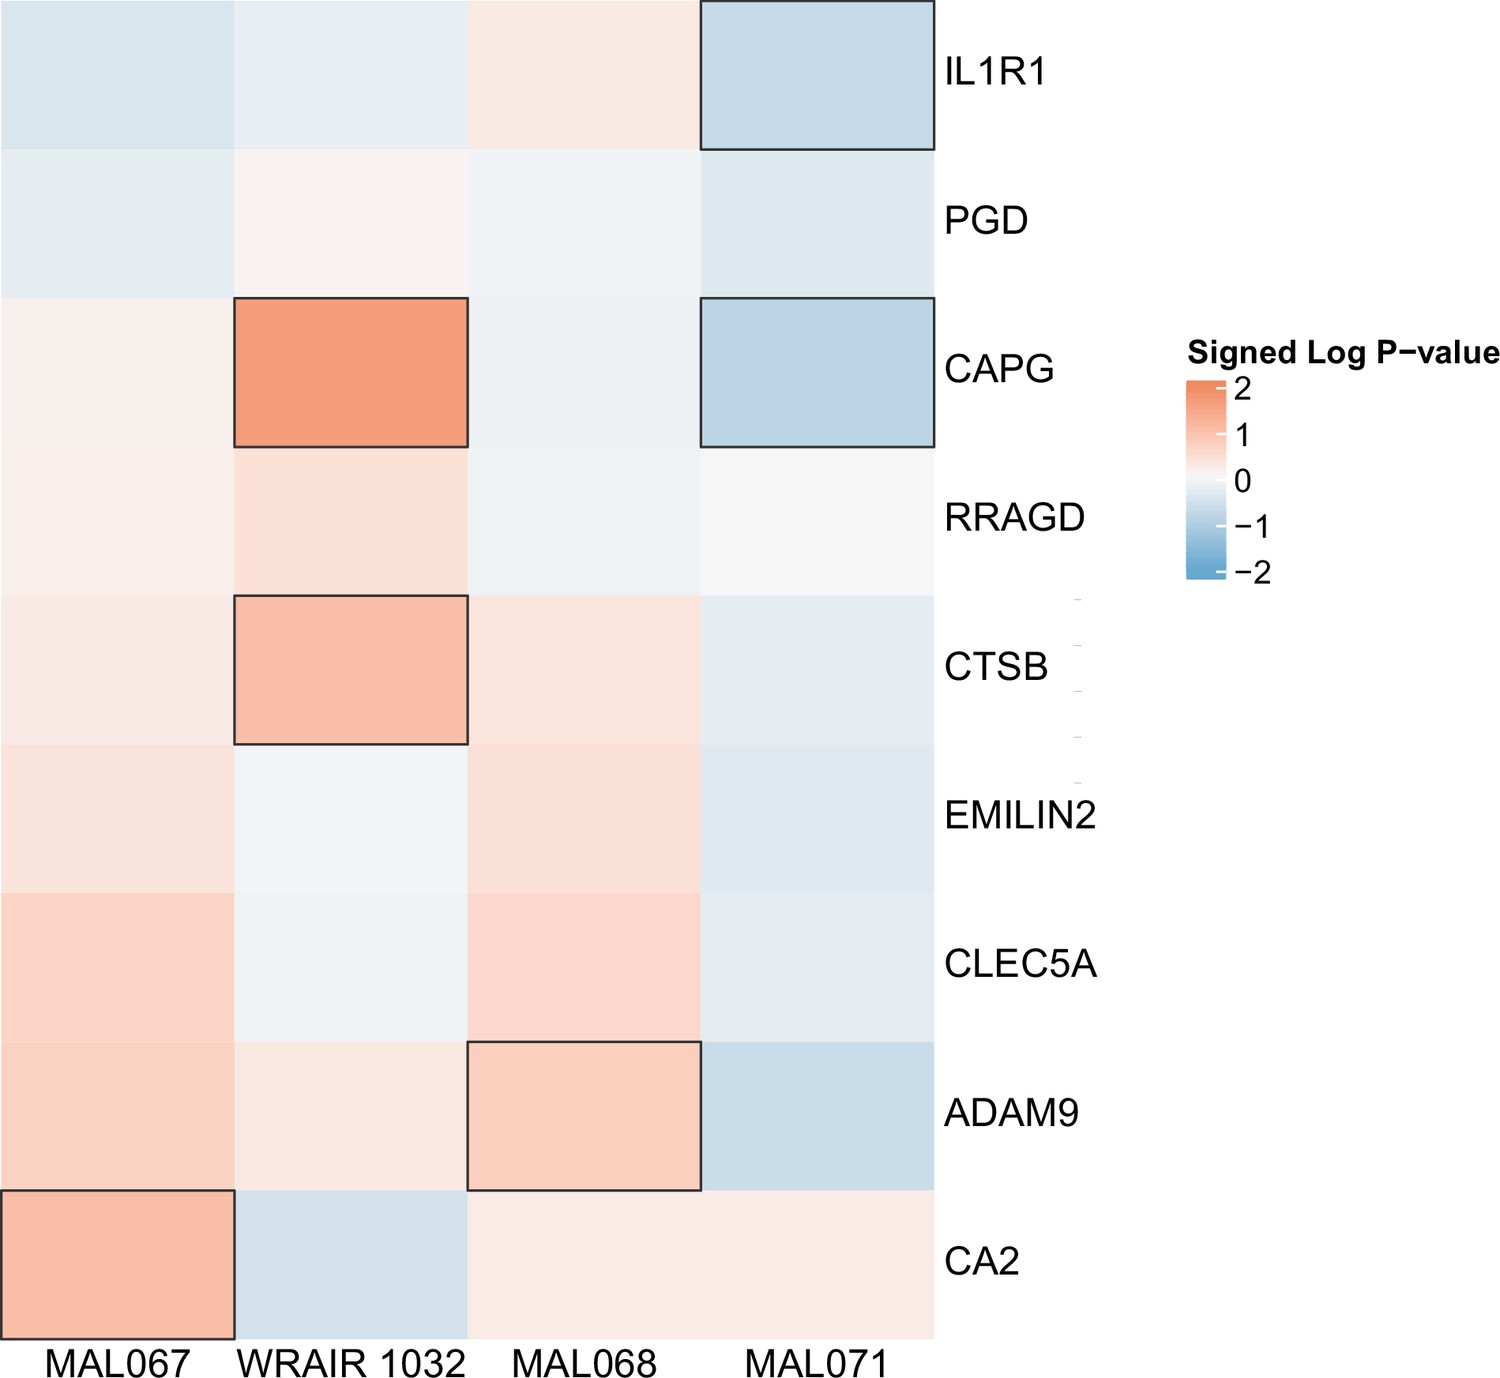
Figure 6—figure supplement 7
Association of month 0 level of each gene in the ‘Enriched in monocytes (I) (M4.15)’ module with malaria case status across studies sharing a common months 0, 1, and 2 RTS,S/AS01 arm.
Cell color intensity represents the strength of the difference in the case vs. control comparison, expressed as signed log10 p value; genes with significantly different expression (false discovery rate ≤0.2) between the two compared groups are outlined in black. Red, higher expression in RTS,S/AS01 cases vs. controls; blue, lower expression in RTS,S/AS01 cases vs. controls.
Figure 6—figure supplement 8
Association of month 0 level of each gene in the ‘Monocyte surface signature (S4)’ module with malaria case status across studies sharing a common months 0, 1, and 2 RTS,S/AS01 arm.
Cell color intensity represents the strength of the difference in the case vs. control comparison, expressed as signed log10 p value; genes with significantly different expression (false discovery rate ≤0.2) between the two compared groups are outlined in black. Red, higher expression in RTS,S/AS01 cases vs. controls; blue, lower expression in RTS,S/AS01 cases vs. controls.
Figure 6—figure supplement 9
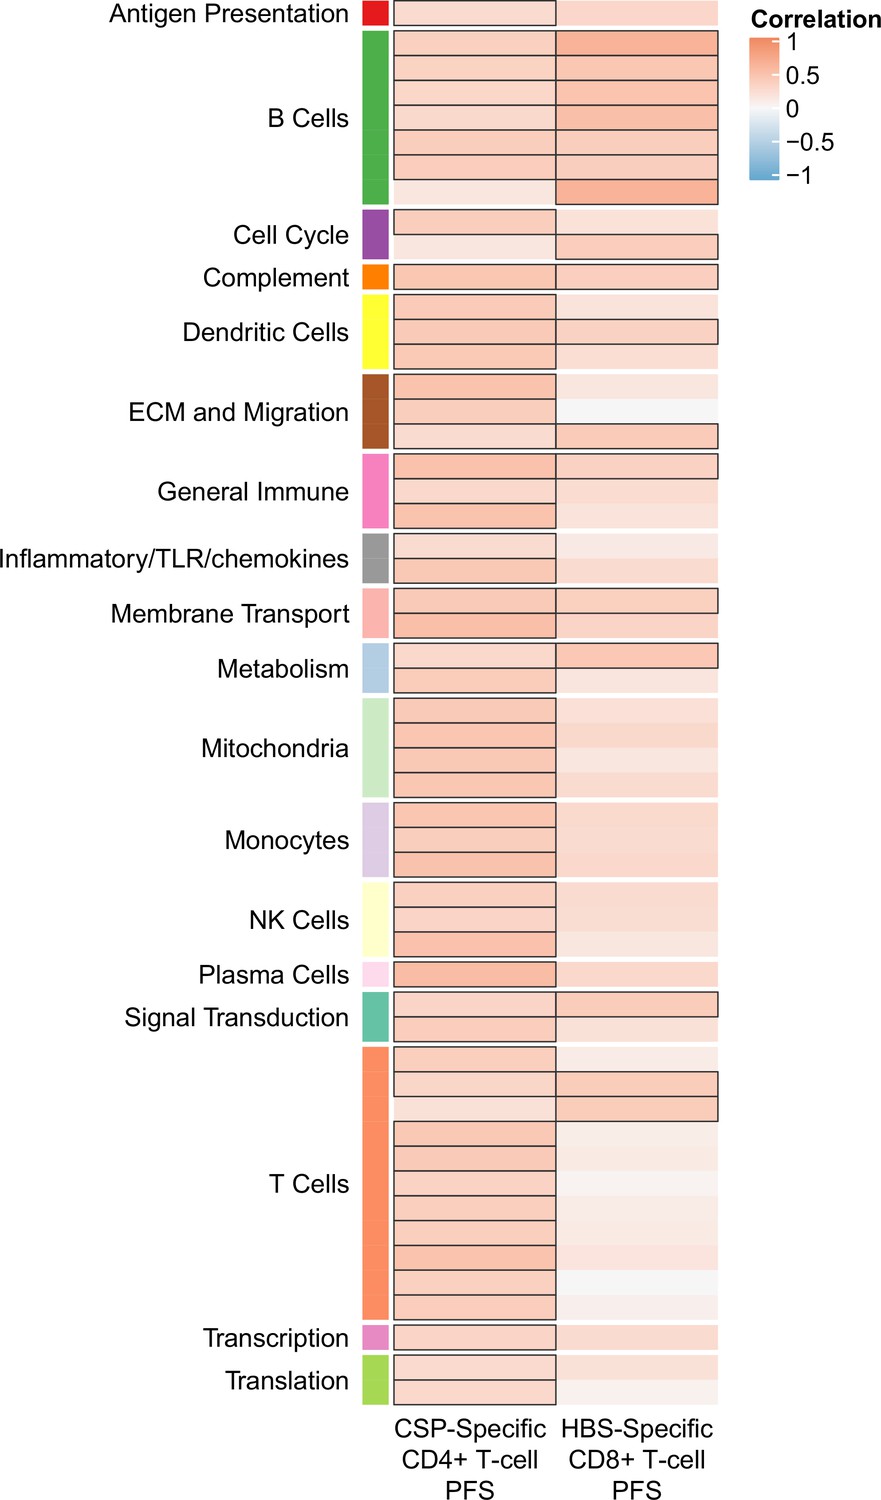
Correlations of month 0 blood transcriptional module (BTM) expression in vehicle-treated peripheral blood mononuclear cells (PBMC) with month 3 T-cell responses in RTS,S/AS01 vaccine recipients.
Heatmap showing significant correlations between month 0 levels of RTS,S/AS01 signature BTMs and month 3 cellular responses (no significant correlations were seen with any month 3 antibody responses). Cell color intensity represents the strength of the correlation; BTM/response pairs with significant correlations (false discovery rate [FDR] ≤0.2) are outlined in black. Cell color represents correlation direction: red, positive correlation; blue, negative correlation. High-level BTM annotation groups are shown in the left-most color bar. No significant correlations were seen with month 3 antibody responses. PFS, polyfunctionality score.
-
Figure 6—figure supplement 9—source data 1
List of blood transcriptional modules (BTMs) whose month 0 levels correlated significantly with at least one month 3 adaptive response variable, along with stimulation, variable details, p value, and false discovery rate (FDR) results.
- https://cdn.elifesciences.org/articles/70393/elife-70393-fig6-figsupp9-data1-v1.csv
Figure 6—figure supplement 10
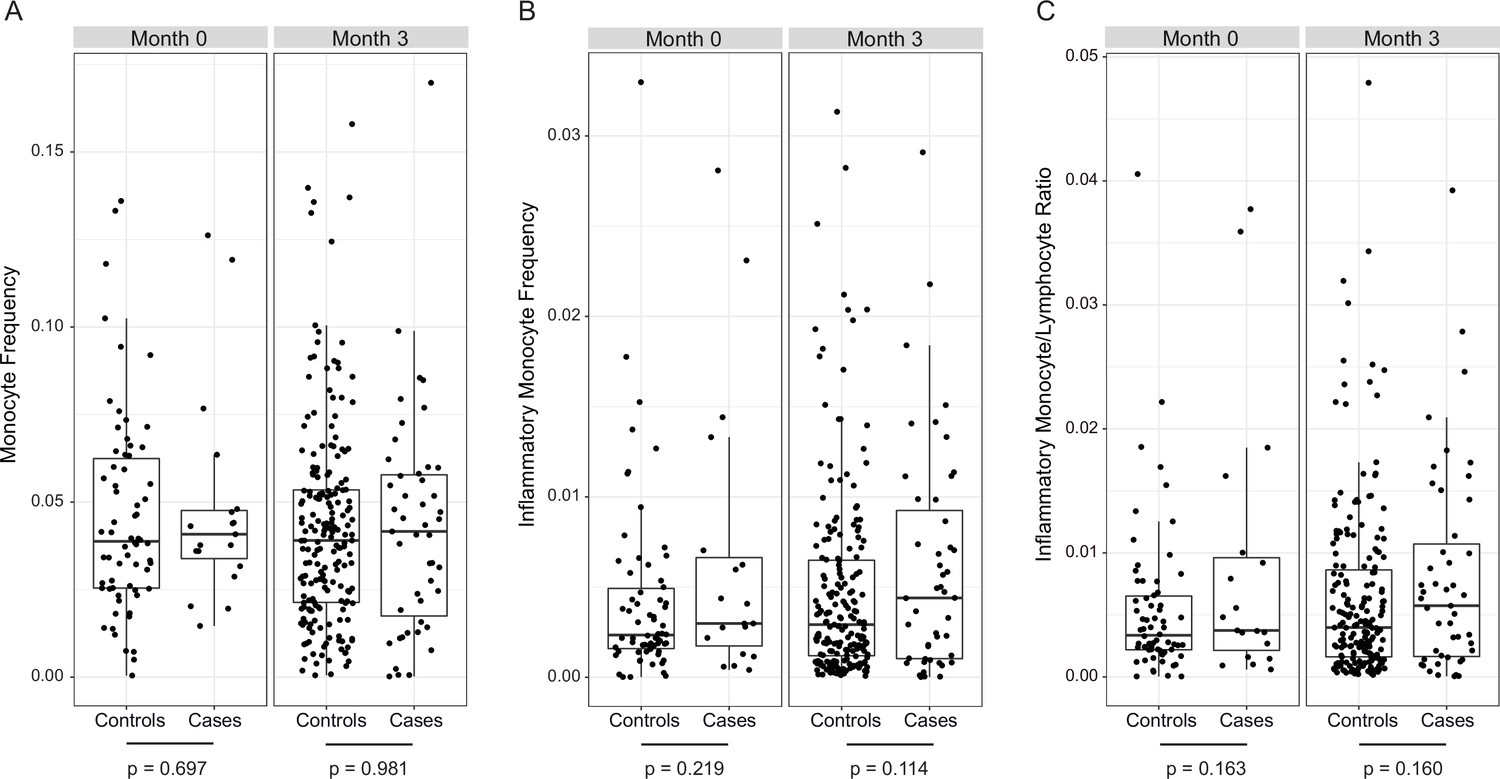
No significant differences in monocyte frequencies in cases vs. controls in RTS,S/AS01 vaccinees at either month 0 or 3.
(A) Monocyte frequency, (B) inflammatory monocyte frequency, and (C) inflammatory monocyte/lymphocyte ratio, stratified by case/control status, in RTS,S/AS01 recipients. Flow cytometry data were analyzed using the gating strategy defined in Moncunill et al., 2017a. ‘Inflammatory monocytes’ refers to ‘HLA-DR+ CD14+ CD16++’ cells. The p values at the bottom of each panel are from testing for a significant difference in controls vs. cases within each panel, and were modeled using a mixed-effects model (using lmer) with match ID as a random effect.
Tables
Key resources table
| Reagent type (species) or resource | Designation | Source or reference | Identifiers | Additional information |
|---|---|---|---|---|
| Antibody | anti-CD4, clone SK3 (mouse monoclonal) | BD | Cat# 563,550 | 1.5 µl/50 µl staining volume; doi:10.1002/cyto.a.22580 |
| Antibody | anti-CD19, clone SJ25C1 (mouse monoclonal) | BD | Cat# 564,303 | 1 µl/50 µl staining volume; doi:10.1002/cyto.a.22580 |
| Antibody | anti-CD25, clone M-A251 (mouse monoclonal) | BD | Cat# 562,442 | 5 µl/50 µl staining volume; doi:10.1002/cyto.a.22580 |
| Antibody | anti-HLA-DR, clone B169414 (mouse monoclonal) | BioLegend | Cat# 307,637 | 0.625 µl/50 µl staining volume; doi:10.1002/cyto.a.22580 |
| Antibody | anti-CD56, clone HCD56 (mouse monoclonal) | BioLegend | Cat# 318,334 | 0.625 µl/50 µl staining volume; doi:10.1002/cyto.a.22580 |
| Antibody | anti-CD45RA, clone HI100 (mouse monoclonal) | BioLegend | Cat# 304,135 | 0.625 µl/50 µl staining volume; doi:10.1002/cyto.a.22580 |
| Antibody | anti-CD14, clone MφP9 (mouse monoclonal) | BD | Cat# 563,373 | 0.2 µl/50 µl staining volume; doi:10.1002/cyto.a.22580 |
| Antibody | anti-CCR7, clone G043H7 (mouse monoclonal) | BioLegend | Cat# 353,229 | 4 µl/50 µl staining volume; doi:10.1002/cyto.a.22580 |
| Antibody | anti-CD57, clone NK-1 (mouse monoclonal) | BD | Cat# 555,619 | 5 µl/50 µl staining volume; doi:10.1002/cyto.a.22580 |
| Antibody | anti-CD8, clone SK1 (mouse monoclonal) | BD | Cat# 341,051 | 2 µl/50 µl staining volume; doi:10.1002/cyto.a.22580 |
| Antibody | anti-Vδ2 TCR, clone B6 (mouse monoclonal) | BioLegend | Cat# 331,408 | 0.156 µl/50 µl staining volume; doi:10.1002/cyto.a.22580 |
| Antibody | anti-CD3, clone UCHT1 (mouse monoclonal) | Beckman Coulter | Cat# IM2705U | 1 µl/50 µl staining volume; doi:10.1002/cyto.a.22580 |
| Antibody | anti-CD38, clone HIT2 (mouse monoclonal) | BD | Cat# 555,461 | 10 µl/50 µl staining volume; doi:10.1002/cyto.a.22580 |
| Antibody | anti-γ/δ TCR, clone 11F2 (mouse monoclonal) | BD | Cat# 655,434 | 1.25 µl/50 µl staining volume; doi:10.1002/cyto.a.22580 |
| Antibody | anti-CD127, clone A019D5 (mouse monoclonal) | BioLegend | Cat# 351,315 | 0.2 µl/50 µl staining volume; doi:10.1002/cyto.a.22580 |
| Antibody | anti-NKG2C, clone 134,591 (mouse monoclonal) | R&D Systems | Cat# FAB138N | 1.25 µl/50 µl staining volume; doi:10.1002/cyto.a.22580 |
| Antibody | anti-CD16, clone 3G8 (mouse monoclonal) | BD | Cat# 557,758 | 0.312 µl/50 µl staining volume; doi:10.1002/cyto.a.22580 |
| Antibody | anti-CD14, clone M5E2 (mouse monoclonal) | BioLegend | Cat# 301,842 | Fluorochrome: BV510 (detected in the same channel as AViD) |
| Antibody | anti-CD56, clone NCAM16.2 (mouse monoclonal) | BD | Cat# 564,447 | Fluorochrome: BUV737 |
| Antibody | anti-CD3, clone UCHT1 (mouse monoclonal) | BioLegend | Cat# 300,436 | Fluorochrome: BV570 |
| Antibody | anti-CD8, clone RPA-T8 (mouse monoclonal) | BD | Cat# 563,821 | Fluorochrome: BV650 |
| Antibody | anti-CD45RA, clone HI100 (mouse monoclonal) | BD | Cat# 560,674 | Fluorochrome: APC-H7 |
| Antibody | anti-CXCR5, clone J252D4 (mouse monoclonal) | BioLegend | Cat# 356,928 | Fluorochrome: PE-Dazzle594 |
| Antibody | anti-PD-1, clone eBioJ105 (mouse monoclonal) | eBioscience | Cat# 25-2799-42 | Fluorochrome: PE-Cy7 |
| Antibody | anti-IFN-γ, clone B27 (mouse monoclonal) | BD | Cat# 560,371 | Fluorochrome: V450 |
| Antibody | anti-IL-2, clone MQ1-17H12 (rat monoclonal) | BD | Cat# 559,334 | Fluorochrome: PE |
| Antibody | anti-IL-4, clone MP4-25D2 (rat monoclonal) | BioLegend | Cat# 500,822 | Fluorochrome: PerCP-Cy5.5 |
| Antibody | anti-IL-13, clone JES10-5A2 (rat monoclonal) | BD | Cat# 564,288 | Fluorochrome: BV711 |
| Antibody | anti-IL-21, clone 3A3-N2 (mouse monoclonal) | Miltenyi Biotec | Cat# 130-120-702 | Fluorochrome: APC |
| Antibody | anti-TNF-α, clone mAb11 (mouse monoclonal) | eBioscience | Cat# 11-7349-82 | Fluorochrome: FITC |
| Antibody | anti-CD40L, clone 24–31 (mouse monoclonal) (mouse monoclonal) | BioLegend | Cat# 310,825 | Fluorochrome: BV605 |
| Antibody | anti-Granzyme B, clone GB11 (mouse monoclonal) | BD | Cat# 560,213 | Fluorochrome: Alx700 |
| Chemical compound, drug | BD FACS Lyse Solution, 10× | BD | Cat #349,202 | doi:10.1002/cyto.a.22590 VC |
| Chemical compound, drug | BD FACS Perm II, 10× | BD | Cat #340,973 | doi:10.1002/cyto.a.22590VC |
| Chemical compound, drug | Brefeldin A | Sigma Chemical Co. | Cat #B-7651 | Final concentration of 10 µg/mldoi:10.1002/cyto.a.22590 VC |
| Chemical compound, drug | CD28/49d (BD Biosciences) | BD | Cat #347,690 | Final concentration of 1 µg/mldoi:10.1002/cyto.a.22590 VC |
| Chemical compound, drug | Golgi Stop containing monensin | BD | Cat #554,724 | doi:10.1002/cyto.a.22590 VC |
| Peptide, recombinant protein | Recombinant AMA1 | WRAIR | FVO strain, GMP produced in E. coli | |
| Peptide, recombinant protein | CSP peptide pool | doi: 10.3389/fimmu.2017.01008Biosynthan (RNA-sequencing stimulations) and Biosynthesis (ICS stimulations) | ||
| Peptide, recombinant protein | HBS peptide pool | doi: 10.3389/fimmu.2017.01008Biosynthan (RNAseq stimulations) and Biosynthesis (ICS stimulations) | ||
| Sequence-based reagent | Universal adapter E5V6NEXT: 5′-iCiGiCACACTCT TTCCCTACACGACGCrGrGrG-3′ | Integrated DNA Technologies | iC: iso-dC, iG: iso-dG, rG: RNA G | |
| Sequence-based reagent | Barcoded adapter E3V6NEXT: 5′-/5Biosg/ACACTCTTTCCCT ACACGACGCTCTTCCGATC T[BC6]N10T30VN-3′ | Integrated DNA Technologies | 5Biosg = 5′ biotin, [BC6] = 6 bp barcode specific to each cell/well, N10 = unique molecular identifiers, 10 bp | |
| Sequence-based reagent | SINGV6 primer: 5′-/5Biosg/ACACTC TTTCCCTACACGACGC-3′ | Integrated DNA Technologies | ||
| Sequence-based reagent | P5NEXTPT5 primer: 5′- AATGATACGGCGACC ACCGAGATCTACACT CTTTCCCTACACGAC GCTCTTCC*G*A*T*C*T-3′ | Integrated DNA Technologies | * = phosphorothioate bonds | |
| Chemical compound, drug | SEB | Sigma Chemical Co. | Cat #S4881 | |
| Commercial assay or kit | SV96 Total RNA Isolation System | Promega | Cat# Z3500 | |
| Commercial assay or kit | DNA Clean & Concentrator-5 column | Zymo Research | Cat# D4004 | |
| Commercial assay or kit | Advantage 2 Polymerase Mix | Takara Bio | Cat# 639,202 | |
| Commercial assay or kit | dsDNA HS Assay | Life Technologies | Cat# Q32851 | |
| Commercial assay or kit | Nextera XT library preparation kit | Illumina | Cat# FC-131–1096 | |
| Commercial assay or kit | QIAquick Gel Extraction Kit | Qiagen | Cat# 28706 × 4 | |
| Chemical compound, drug | DMSO | Sigma | Cat# D2650 | |
| Software, algorithm | R | The R Foundation | R version 4.0.4 (2021-02-15) | |
| Software, algorithm | Burrows-Wheeler Aligner (BWA) | https://sourceforge.net/projects/bio-bwa/ | BWA Aln version 0.7.10 | |
| Software, algorithm | FlowJo | BD Life Sciences | FlowJo version 9.9 Tree Star | |
| Other | RLT buffer | Qiagen | Cat# 79,216 | |
| Other | RNA protect | Qiagen | Cat# 76,104 | |
| Other | 96-Well V-bottomed plate | Kisker, AttendBio | Cat# G096-VB | |
| Other | Adhesive foil | Kisker, AttendBio | Cat# G071-P | |
| Other | AviD | Invitrogen | Cat# L34957 | 0.5 µl reagent/50 µl staining volumedoi:10.1002/cyto.a.22590 VC |
| Other | Maxima H Minus Reverse Transcriptase | Thermo Scientific | Cat# EP0751 | |
| Other | Exonuclease I | New England BioLabs | Cat# M0293S | |
| Other | Agencourt AMPure XP magnetic beads | Beckman Coulter | Cat# A63881 | 0.6× |
| Other | E-Gel EX Gel, 2% | Thermo Fisher | Cat# G401002 | |
| Other | RNA 6000 Pico Chip | Agilent | Cat# 5067-1513 |
Table 1
Numbers, age group, and case–control status of participants by site for whom peripheral blood mononuclear cells (PBMC) RNA-seq data were available at months 0 and/or 3.
| Month 0 | ||||||||||||
|---|---|---|---|---|---|---|---|---|---|---|---|---|
| Cases (n = 14) | Controls (n = 43) | Not included in the case–control (n = 70) | ||||||||||
| Bagomoyo | Manhiça | Bagomoyo | Manhiça | Bagomoyo | Manhiça | |||||||
| Infants | Children | Infants | Children | Infants | Children | Infants | Children | Infants | Children | Infants | Children | |
| RTS,S/AS01 (n = 88) | 0 | 9 | 0 | 0 | 0 | 29 | 0 | 0 | 0 | 41 | 0 | 9 |
| Comparator (n = 39) | 0 | 5 | 0 | 0 | 0 | 12 | 0 | 2 | 0 | 19 | 0 | 1 |
| Month 3 | ||||||||||||
| Cases (n = 54) | Controls (n = 142) | Not included in the case–control (n = 161) | ||||||||||
| Bagomoyo | Manhiça | Bagomoyo | Manhiça | Bagomoyo | Manhiça | |||||||
| Infants | Children | Infants | Children | Infants | Children | Infants | Children | Infants | Children | Infants | Children | |
| RTS,S/AS01 (n = 222) | 0 | 19 | 12 | 0 | 0 | 51 | 41 | 0 | 0 | 56 | 28 | 15 |
| Comparator (n = 135) | 0 | 16 | 6 | 1 | 0 | 30 | 16 | 4 | 0 | 29 | 29 | 4 |
Author response table 1
| Present manuscript: Baseline signature associated with risk | Moncunill et al. 2020 STM: Protective signature | |
|---|---|---|
| PBMC sampling timepoint | Baseline | 1 month post-third vaccination |
| PBMC stimulation | Vehicle (DMSO); stimulated on site before cryopreservation of cell pellets for subsequent RNA extraction. | 24-hour antigen (CSP) stimulation adjusted by vehicle (DMSO); PBMC were cryopreserved before stimulation |
| Background correction | N/A | Yes, subtraction of expression in vehicle-stimulated PBMC (thus the observed response is specific to antigen stimulation, i.e. recall response) |
| Presence of monocyte-related BTMs | Yes, of the 45 BTMs, 7 were monocyte-related: M81, M118.1, M11.0, M118.0, S4, M73, M4.15 | Yes, of the 24 BTMs, 3 were monocyte-related: M81, M118.1, M11.0 |
| Gene expression measurement | RNA-seq | Microarray |
| Hypothesis: | Stabilin-1high immunosuppressive monocytes circulating at baseline may inhibit protective RTS,S-induced T-cell responses [supported by (18)] or another RTS,S-induced protective adaptive response. | Protected individuals may have monocytes that are qualitatively superior in mediating, e.g., Fc receptor/antibody-dependent responses (reflected by an altered transcriptional profile), resulting in improved control of infection. |
Additional files
-
Supplementary file 1
Complete information on study participant site, case–control matching ID, age cohort, sex assigned at birth, vaccine group, date of first dose vaccination, and case–control status.
- https://cdn.elifesciences.org/articles/70393/elife-70393-supp1-v1.zip
-
Supplementary file 2
Numbers, age group, and case–control status of RTS,S/AS01 recipients by site for whom months 0 and/or 3 peripheral blood mononuclear cell (PBMC) samples were included in the ICS/immunophenotyping analysis.
- https://cdn.elifesciences.org/articles/70393/elife-70393-supp2-v1.docx
-
Supplementary file 3
List of the 68 ‘RTS,S/AS01 signature BTMs’ (Comparison 1 in Figure 2) tested as immune correlates.
- https://cdn.elifesciences.org/articles/70393/elife-70393-supp3-v1.csv
-
Supplementary file 4
List of 35 individual genes whose baseline expression in vehicle-treated peripheral blood mononuclear cell (PBMC) significantly associated with risk in MAL067.
These individual genes were obtained by looking at gene-level correlate heatmaps (Figure 6—figure supplements 2–9) of the eight blood transcriptional modules (BTMs) (M4.0, S10, S5, M168, M4.3, M11.0, M4.15, and S4) that significantly associated with risk in MAL067 and in two controlled human malaria infection (CHMI studies). The table also contains information on whether each individual gene also significantly associated with risk in a CHMI study (check mark; columns 2 through 4).
- https://cdn.elifesciences.org/articles/70393/elife-70393-supp4-v1.docx
-
Transparent reporting form
- https://cdn.elifesciences.org/articles/70393/elife-70393-transrepform1-v1.docx
Download links
A two-part list of links to download the article, or parts of the article, in various formats.
Downloads (link to download the article as PDF)
Open citations (links to open the citations from this article in various online reference manager services)
Cite this article (links to download the citations from this article in formats compatible with various reference manager tools)
Transcriptional correlates of malaria in RTS,S/AS01-vaccinated African children: a matched case–control study
eLife 11:e70393.
https://doi.org/10.7554/eLife.70393


