Calcium dependence of neurotransmitter release at a high fidelity synapse
- Carl-Ludwig-Institute for Physiology, Medical Faculty, University of Leipzig, Germany
Figures
Figure 1
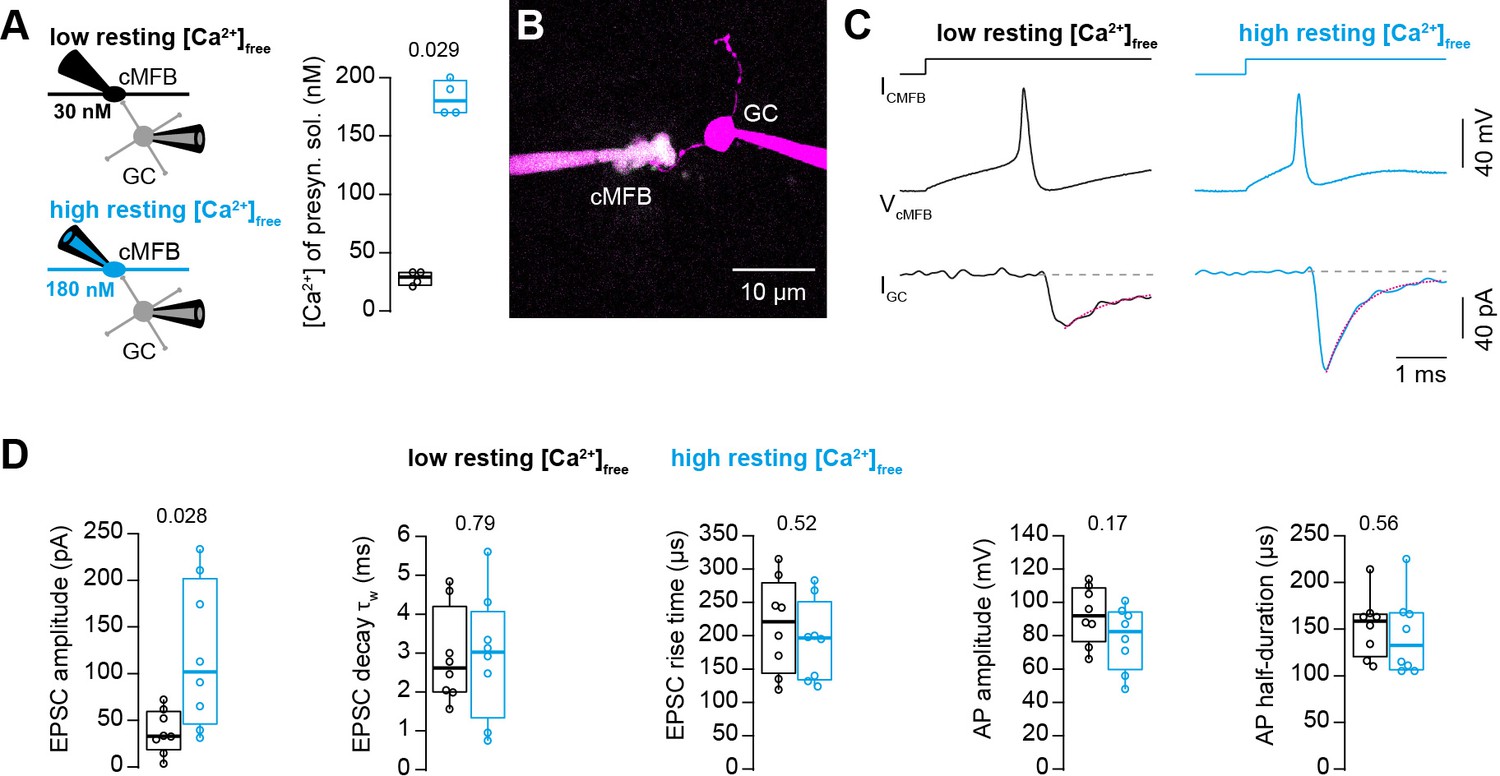
Action potential-evoked synaptic release critically depends on basal intracellular Ca2+ concentration.
(A) Left: Illustration of the cellular connectivity of the cMFB to GC synapse during simultaneous pre- and postsynaptic patch-clamp recording. The presynaptic terminal was loaded with an intracellular solution having either low or high free basal Ca2+ concentration (top and bottom, respectively). Right: Comparison of the average free Ca2+ concentration in the presynaptic patch pipette (quantified by two-photon Ca2+ imaging) for the intracellular solutions with low and high basal Ca2+ (n = 4 each). (B) Example two-photon microscopic image of a cMFB and a GC in the paired whole-cell configuration. (C) Example traces of a paired cMFB-GC recording with current injection (IcMFB) (top) eliciting an action potential in the cMFB (middle) and an EPSC in the postsynaptic GC (bottom). Black and blue color code corresponds to low and high free basal Ca2+ concentration in the presynaptic solution, respectively. The decay of the EPSC was fitted with a bi-exponential function (magenta line). (D) Comparison of the properties of presynaptic action potentials and EPSCs evoked after eliciting an action potential in the presynaptic terminal using solutions having either low (black) or high (blue) free Ca2+ concentration. From left to right: peak amplitude of the EPSC, weighted decay time constant of the EPSC, 10-to-90% rise time of the EPSC, amplitude of the presynaptic action potential, and action potential half-duration (n = 8 and 8 paired cells for the conditions with low and high resting Ca2+ concentration, respectively). Boxplots show median and 1st/3rd quartiles with whiskers indicating the whole data range. Values of individual experiments are superimposed as circles. The numbers above the boxplots represent p-values of Mann-Whitney U tests.
-
Figure 1—source data 1
Action potential-evoked synaptic release critically depends on basal intracellular Ca2+ concentration.
- https://cdn.elifesciences.org/articles/70408/elife-70408-fig1-data1-v1.xlsx
Figure 2 with 1 supplement
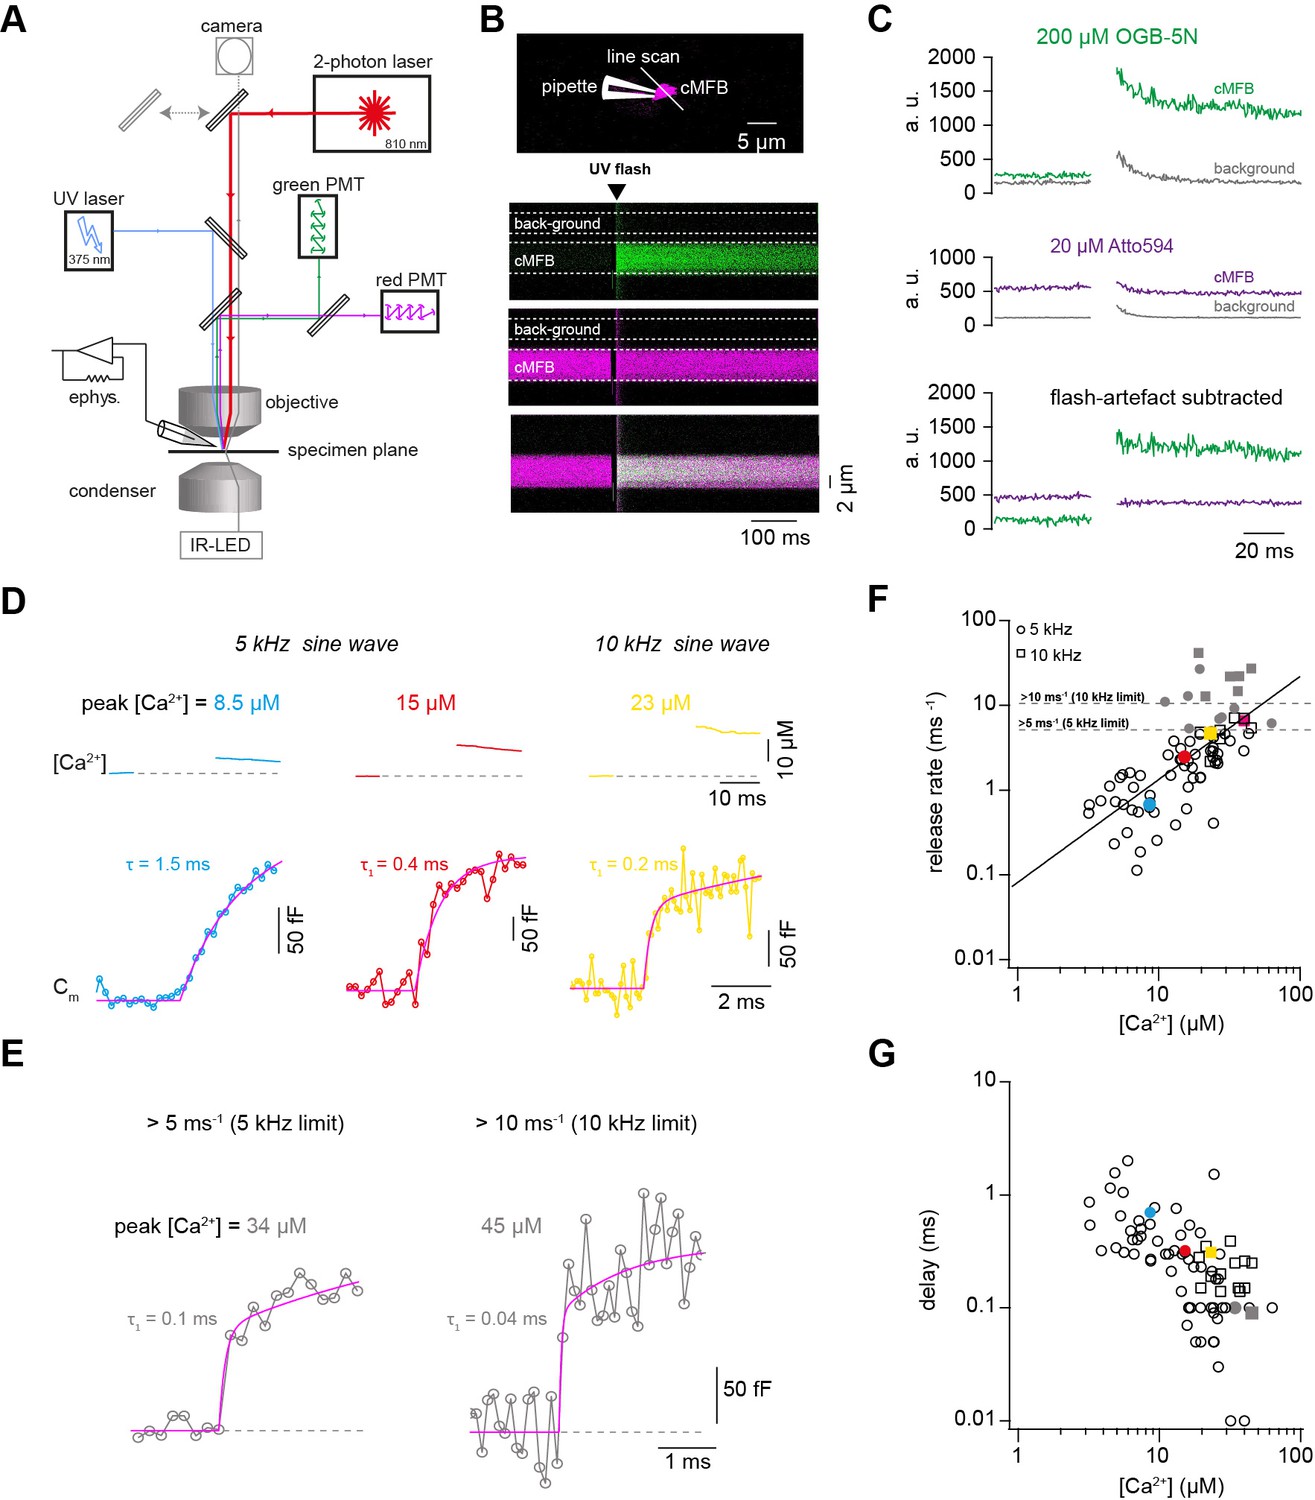
Ca2+ uncaging dose-response curve measured with presynaptic capacitance measurements.
(A) Illustration of the experimental setup showing the light path of the two-photon laser illumination (red line), the UV laser illumination (blue line), the electrophysiology amplifier (‘ephys.’), the red and green gate-able photomultiplier tubes (PMTs), and infrared LED illumination with oblique illumination via the condenser for visualization of the cells at the specimen plane by the camera (gray line) when the upper mirror is moved out of the light path (gray arrow). (B) Top: Two-photon microscopic image of a cMFB in the whole-cell configuration loaded with OGB-5N, Atto594, and DMn/ Ca2+. Positions of the patch pipette and line scan are indicated. Bottom: Two-photon line scan showing the fluorescence signal as measured through the green PMT, red PMT, and an overlay of the green and red channels. Arrow indicates the onset of the UV flash and dashed lines represent the flash-induced luminescence artefact as detected outside the cMFB. The lookup tables for the green and red channel were arbitrarily adjusted independent of the absolute values in C. (C) Top: change in fluorescence intensity within the cMFB for the green channel along with the corresponding flash-induced green artefact measured in the background. Middle: change in fluorescence intensity within the cMFB for the red channel along with the corresponding flash-induced red artefact. Bottom: green and red fluorescence signal after subtracting the flash-induced artefacts. (D) Top: Ca2+ signals of different concentrations elicited through Ca2+ uncaging in three different cells, the flash was blanked. Bottom: corresponding traces of capacitance recordings measured using a 5 kHz (left and middle) or 10 kHz sinusoidal stimulation (right). represents the time constant from a mono-exponential fit, represents the time constant of the fast component of a bi-exponential fit. (E) Traces of capacitance recordings showing the resolution limit in detecting fast release rates of >5 ms−1 using 5 kHz sinusoidal stimulation or >10 ms−1 using 10 kHz sinusoidal stimulation. (F) Plot of release rate versus post-flash Ca2+ concentration (n = 65 from 5-kHz- and from 15 10-kHz-recordings obtained from 80 cMFBs). The line represents a fit with a Hill equation (Equation 2) with best-fit values Vmax = 1.7*107 ms−1, KD = 7.2*106 µM, and n = 1.2. Color coded symbols correspond to traces in (D – E). Gray symbols represent values above the resolution limit. (G) Plot of synaptic delay versus post-flash Ca2+ concentration (n = 64 from 5-kHz- and 15 from 10-kHz-recordings obtained from 79 cells). Note that one recording was removed from the analysis because the exponential fit led to a negative value of the delay. Color coded symbols correspond to traces in (D – E).
-
Figure 2—source data 1
Ca2+ uncaging dose-response curve measured with presynaptic capacitance measurements.
- https://cdn.elifesciences.org/articles/70408/elife-70408-fig2-data1-v1.xlsx
Figure 2—figure supplement 1
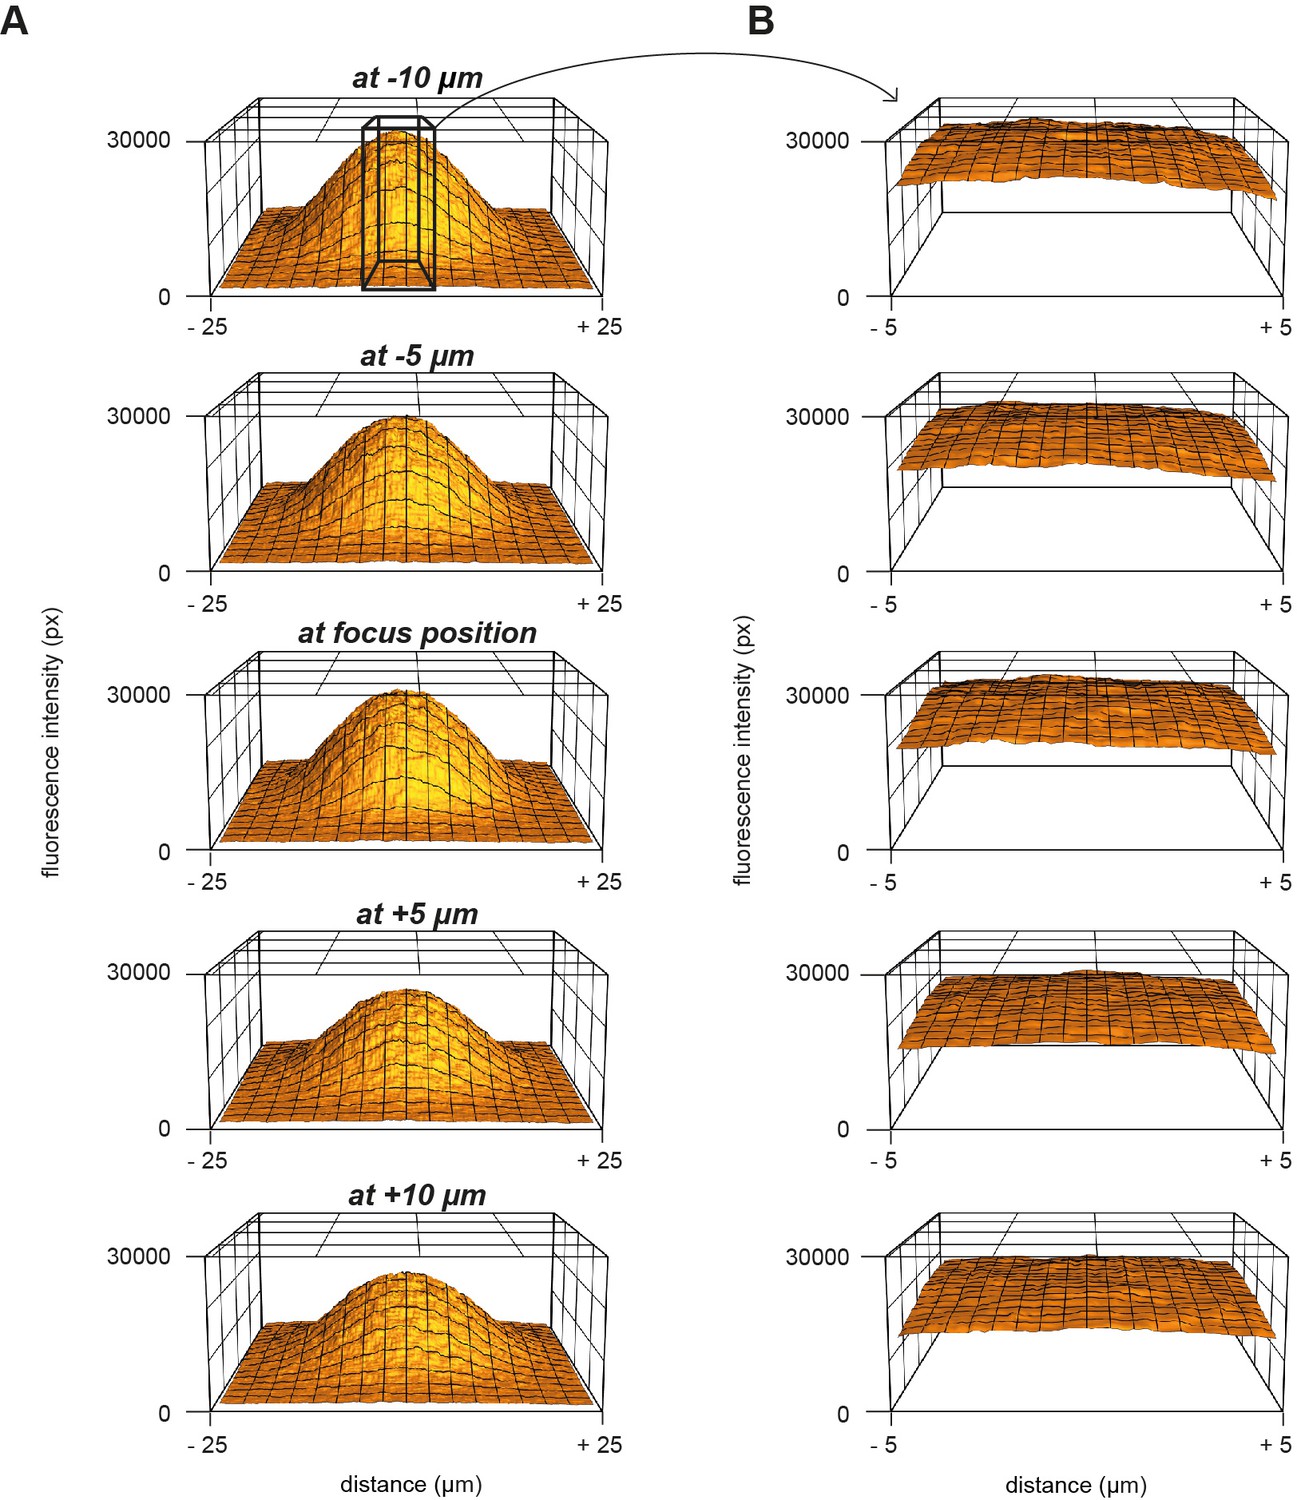
Measurement of the UV energy profile with caged fluorescein.
(A) 3D plot of the fluorescence profile in response to UV uncaging of caged-fluorescein at different z-positions. (B) Magnification of the middle part in panel (A) over a range of 10 μm.
Figure 3 with 4 supplements
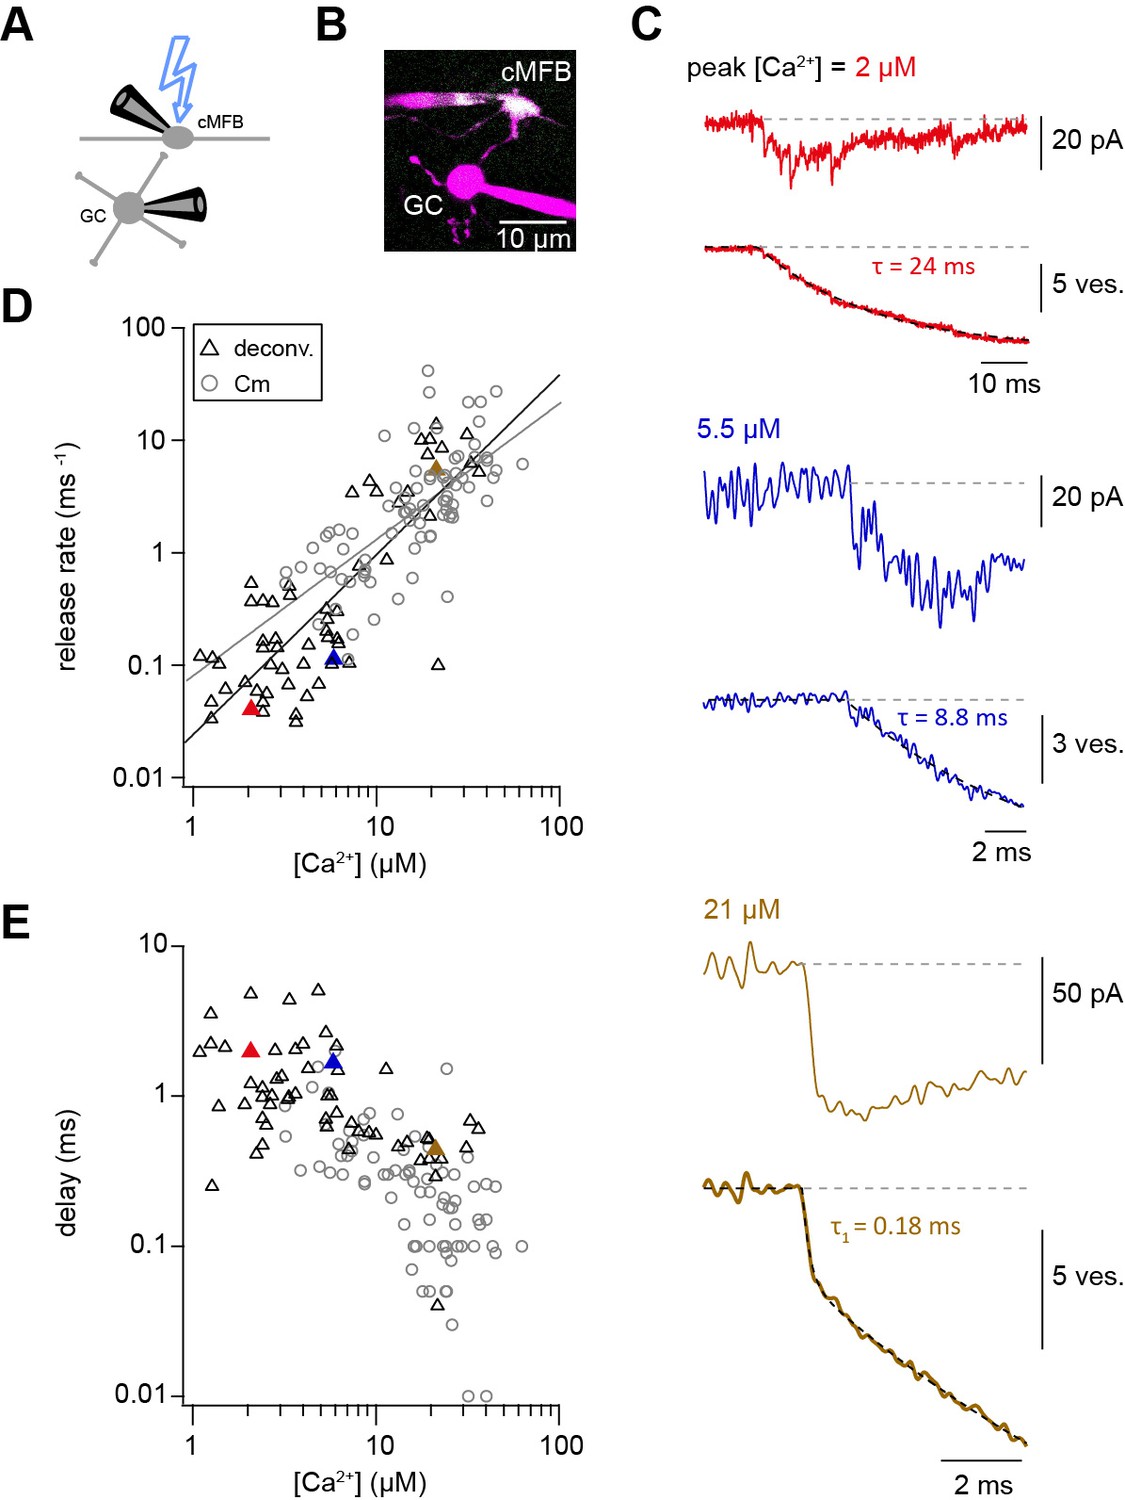
Ca2+ uncaging dose-response curve measured with deconvolution of EPSCs.
(A) Illustration of the cellular connectivity in the cerebellar cortex showing the pre- and postsynaptic compartments during paired whole-cell patch-clamp recordings and Ca2+ uncaging with UV-illumination. (B) Two-photon microscopic image of a cMFB and a GC in the paired whole-cell patch-clamp configuration. (C) Three different recordings showing UV-flash evoked EPSC (top trace) and cumulative release rate measured by deconvolution analysis of the EPSCs (bottom trace). The peak Ca2+ concentration, quantified with two-photon Ca2+ imaging, is indicated in each panel. represents the time constant from mono-exponential fit, represents the time constant of the fast component of bi-exponential fit. Note the different lengths of the baselines in the three recordings. (D) Plot of release rate versus post-flash Ca2+ concentration. Gray open circles represent data from capacitance measurements (Figure 2) and black triangles represent data from deconvolution analysis of EPSC (n = 57 recordings obtained from 42 paired cells). Gray and black lines represent fits with a Hill equation of the capacitance (as shown in Figure 1F) and the deconvolution data, respectively. The best-fit parameters for the fit on the deconvolution data were Vmax = 6*107 ms−1, KD = 7.6*105 µM, and n = 1.6. Red, blue, and brown symbols correspond to the traces in (C). (E) Plot of synaptic delay versus post-flash Ca2+ concentration (n = 59 recordings obtained from 43 paired cells). Note that two recordings was removed from the analysis because the exponential fit led to a negative value of the delay Gray open circles represent data from capacitance measurements, and black triangles represent data from deconvolution analysis of EPSC. Red, blue, and brown symbols correspond to the traces in (C).
-
Figure 3—source data 1
Ca2+ uncaging dose-response curve measured with deconvolution of EPSCs.
- https://cdn.elifesciences.org/articles/70408/elife-70408-fig3-data1-v1.xlsx
Figure 3—figure supplement 1

Measuring the KD of the Ca2+ sensitive dyes.
(A) Green (OGB-5N) over red (Atto594) fluorescence ratio for different Ca2+ concentrations, measured using either a Ca2+ calibration buffered kit or by clamping the free Ca2+ using EGTA in the intracellular patching solution. The free Ca2+ concentration was predicted from the kit, calculated with software like Maxchelator (MaxC) or measured by potentiometry using a Ca2+-sensitive electrode. The indicated KD values were obtained from superimposed fits with Hill equations. (B) Top: illustration of the Ca2+-sensitive electrode. Bottom: Example of a calibration curve of the Ca2+-sensitive electrode fitted with a straight line. (C) Effect of Tetraethylammonium (TEA) on the Ca2+-sensitive electrode at different Ca2+ concentrations. 20 mM TEA induced ~10-fold increase in the potential (left axis) and thus the read-out Ca2+ concentration (right axis) of intracellular solutions which had free Ca2+ concentrations clamped by EGTA to 3 μM, 30 μM, or 4 mM (pH was kept constant; bargraphs represent the mean; line-connected circles represent two independent repetitions). (D) Effect of TEA on G/R fluorescence ratio. The ratio of the intracellular solution containing only 10 mM EGTA (Rmin), free Ca2+ clamped with EGTA to 30 μM (R30μM), or 10 mM Ca2+ (Rmax) did not change upon adding 20 mM TEA indicating that TEA is not contaminated with Ca2+ but instead TEA specifically interferes with the Ca2+-sensitive electrode.
Figure 3—figure supplement 2

Comparison of brief versus long UV illumination to rule out fast Ca2+ overshoots.
(A) Post-flash Ca2+ concentration obtained from long flashes of 1 ms duration and 10% UV intensity, normalized to post-flash Ca2+ concentration obtained from brief flashes of 0.1 ms duration and 100% UV intensity. Two consecutive weak flashes (brief and long) were applied on each cell (n = 6 paired cells). (B) Release rates obtained from long flashes of 1 ms duration and 10% UV intensity, normalized to release rates obtained from brief flashes of 0.1 ms duration and 100% UV intensity. Color code matches the data in A and B. Two consecutive weak flashes (brief and long) were applied on each cell (n = 6 paired cells).
Figure 3—figure supplement 3

Correction for the post-flash changes in the fluorescent properties of the intracellular solution.
(A) Green over red fluorescence (G/R) ratios measured in situ normalized to G/R ratios measured in cuvettes. Data represent the different solutions used throughout the study. (a–g) represent measurements obtained from different solutions prepared using different pre-stocks of the fluorescent indicators or a different DMn/Ca2+ concentration. (B) Green over red fluorescence (G/R) ratios measured in cMFBs normalized to G/R ratios measured in GCs. Data represent different solutions used throughout the study. (a–f) represent measurements obtained from different solutions prepared using different pre-stocks of the fluorescent indicators or a different DMn/Ca2+ concentration. (C) Example traces of in situ post-flash alterations in the green fluorescence, in the red fluorescence, and the overall drop in the G/R ratio (in black) in response to a UV flash of 0.1 ms duration and 100% intensity. (D) Comparison of the UV-flash-induced bleaching of fluorescent indicators measured in cells to the UV-flash-induced bleaching of fluorescent indicators measured in cuvettes, in response to a UV flash of 0.1 ms duration and 100% intensity. (E) Example traces of UV-flash-induced changes occurring in cuvettes in response to UV flashes of different intensities or duration. (F) Average UV-flash-induced changes occurring in cuvettes in response to UV flashes of different intensities or duration.
Figure 3—figure supplement 4
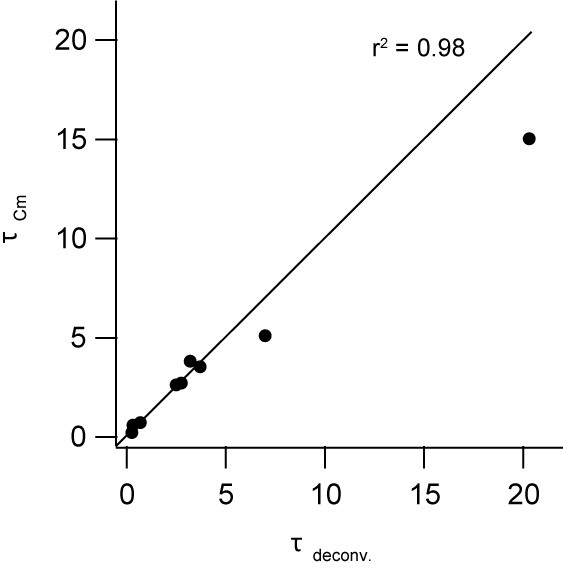
Comparison of the time constants obtained from presynaptic capacitance measurements (τCm) and analysis of postsynaptic current recordings (τdeconv).
The time constants were obtained from the initial fast component of exponential fits of the capacitance trace and the cumulative release trace obtained from the deconvolution analysis of the simultaneously recorded postsynaptic current. The line represents the identity relation (r2 = 0.98; n = 9 paired cMFB-GC recordings).
Figure 4
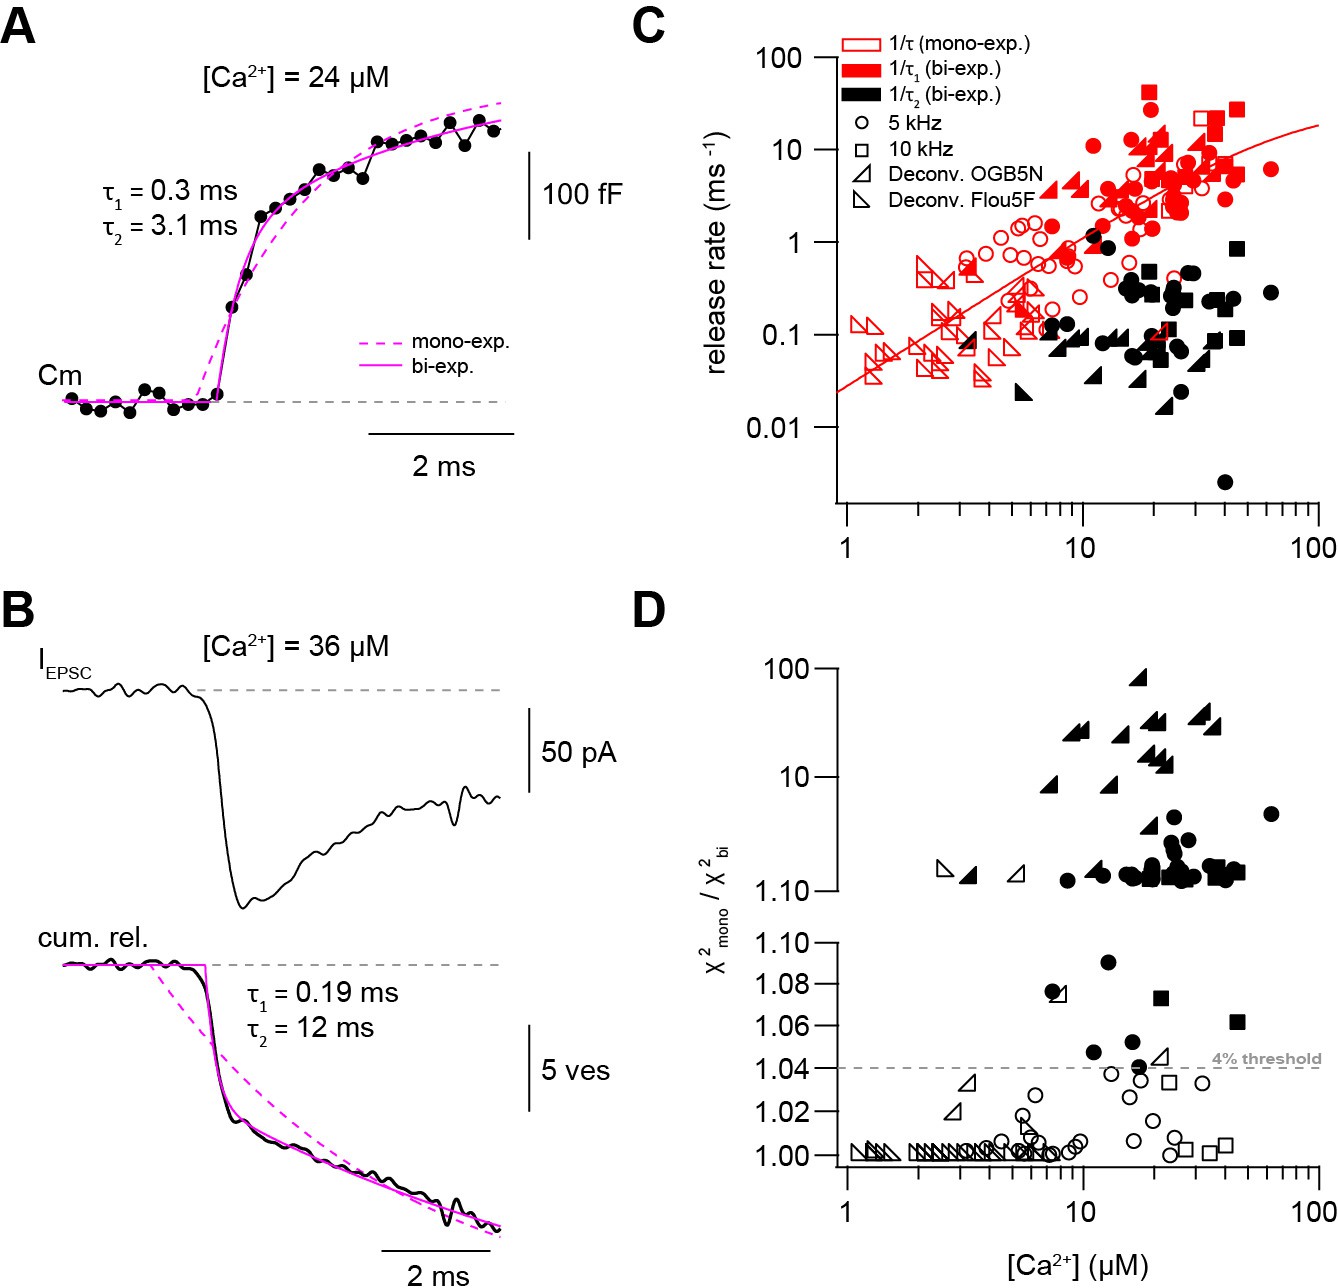
Presynaptic and postsynaptic measurements reveal two kinetic processes of neurotransmitter release.
(A) Example of a capacitance trace showing the two components of release observed within the first 10 ms in response to UV-flash-evoked increase in Ca2+ concentration to 24 μM. The solid magenta line represents the bi-exponential fit and the dashed magenta line represents mono-exponential fit (see Equation 1). (B) Top: example trace of an EPSC recording in response to UV-flash evoked increase in Ca2+ concentration to 36 μM. Bottom: the corresponding cumulative release trace obtained from deconvolution analysis, showing the two components of release observed within the first 10 ms. The solid magenta line represents the bi-exponential fit and the dashed magenta line represents mono-exponential fit (see Equation 1). (C) Top: plot of neurotransmitter release rates as a function of peak Ca2+ concentration (n = 80 and 59 capacitance measurements and deconvolution analysis, respectively). Data obtained from capacitance measurements with sinusoidal frequency of 5 kHz are shown as circles, data from 10 kHz capacitance measurements are shown as squares, and cumulative release data obtained from deconvolution analysis are shown as lower left- and lower right- triangles for recordings with OGB-5N and Fluo5F, respectively. Open symbols correspond to data from the mono-exponential fits and filled symbols correspond to data from the bi-exponential fits. Red symbols represent merged data of the release rates obtained from mono-exponential fit and the fast component of the bi-exponential fit, and black symbols represent the second component of the bi-exponential fit. The line represents a fit with a Hill equation with best-fit parameters Vmax = 29.9 ms−1, KD = 75.5 µM, and n = 1.61. (D) χ2 ratio for the mono-exponential compared to the bi-exponential fits. Dashed line represents the threshold of the χ2 ratio used to judge the fit quality of double compared to mono-exponential fits (as one criterion for selection). 5 kHz capacitance data are shown as circles, 10 kHz capacitance data are shown as squares, and cumulative release data (obtained from deconvolution analysis) are shown as lower left- and lower right- triangles for recordings with OGB-5N and Fluo5F, respectively. Open symbols correspond to data points judged as mono-exponential and filled symbols correspond to data points judged as bi-exponential.
-
Figure 4—source data 1
Presynaptic and postsynaptic measurements reveal two kinetic processes of neurotransmitter release.
- https://cdn.elifesciences.org/articles/70408/elife-70408-fig4-data1-v1.xlsx
Figure 5
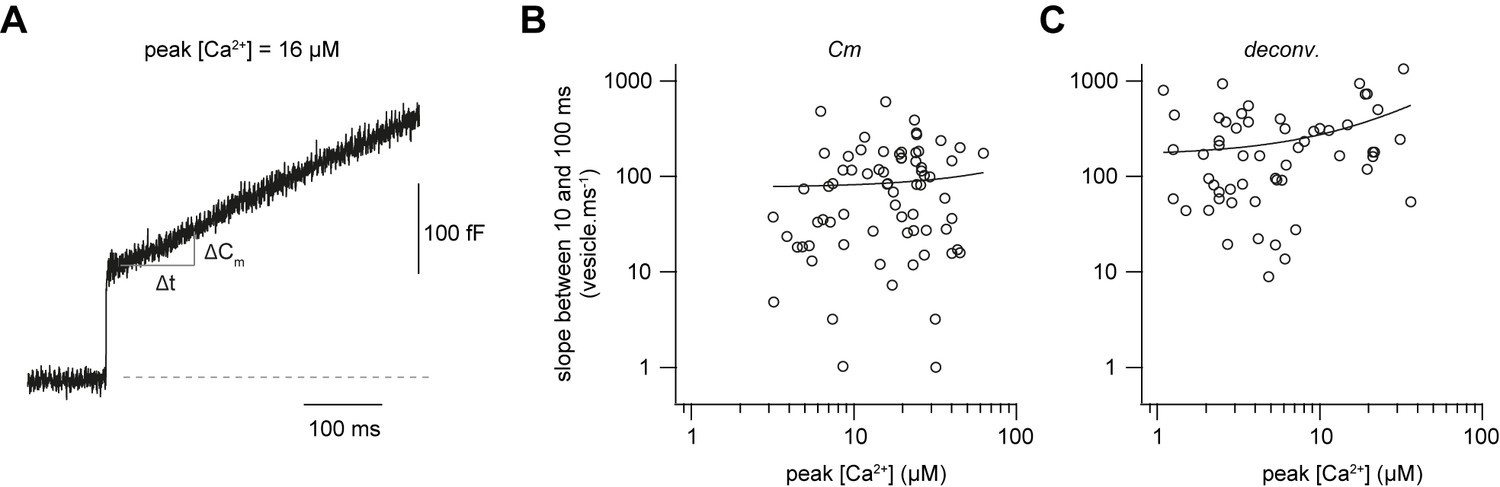
Fast sustained release with very weak Ca2+-dependence.
(A) Examples of a capacitance trace showing a sustained component of release. (B) Plot of the number of vesicles released between 10 and 100 ms as estimated from capacitance measurements divided by the time interval (90 ms) versus the post-flash Ca2+ concentration (n = 71 cMFBs). The line represents a linear fit to the data with a slope of 6 vesicles ms−1 µM−1 (Pearson correlation coefficient = 0.06, r2 = 0.003; PPearson correlation = 0.6). (C) Plot of the number of vesicles released between 10 and 100 ms as estimated from deconvolution analysis divided by the time interval (90 ms) versus the post-flash Ca2+ concentration (n = 51 cMFB-GC pairs). The line represents a linear fit to the data with a slope of 10 vesicles ms−1 µM−1 (Pearson correlation coefficient = 0.3, r2 = 0.1; PPearson correlation = 0.01).
-
Figure 5—source data 1
Fast sustained release with very weak Ca2+-dependence.
- https://cdn.elifesciences.org/articles/70408/elife-70408-fig5-data1-v1.xlsx
Figure 6
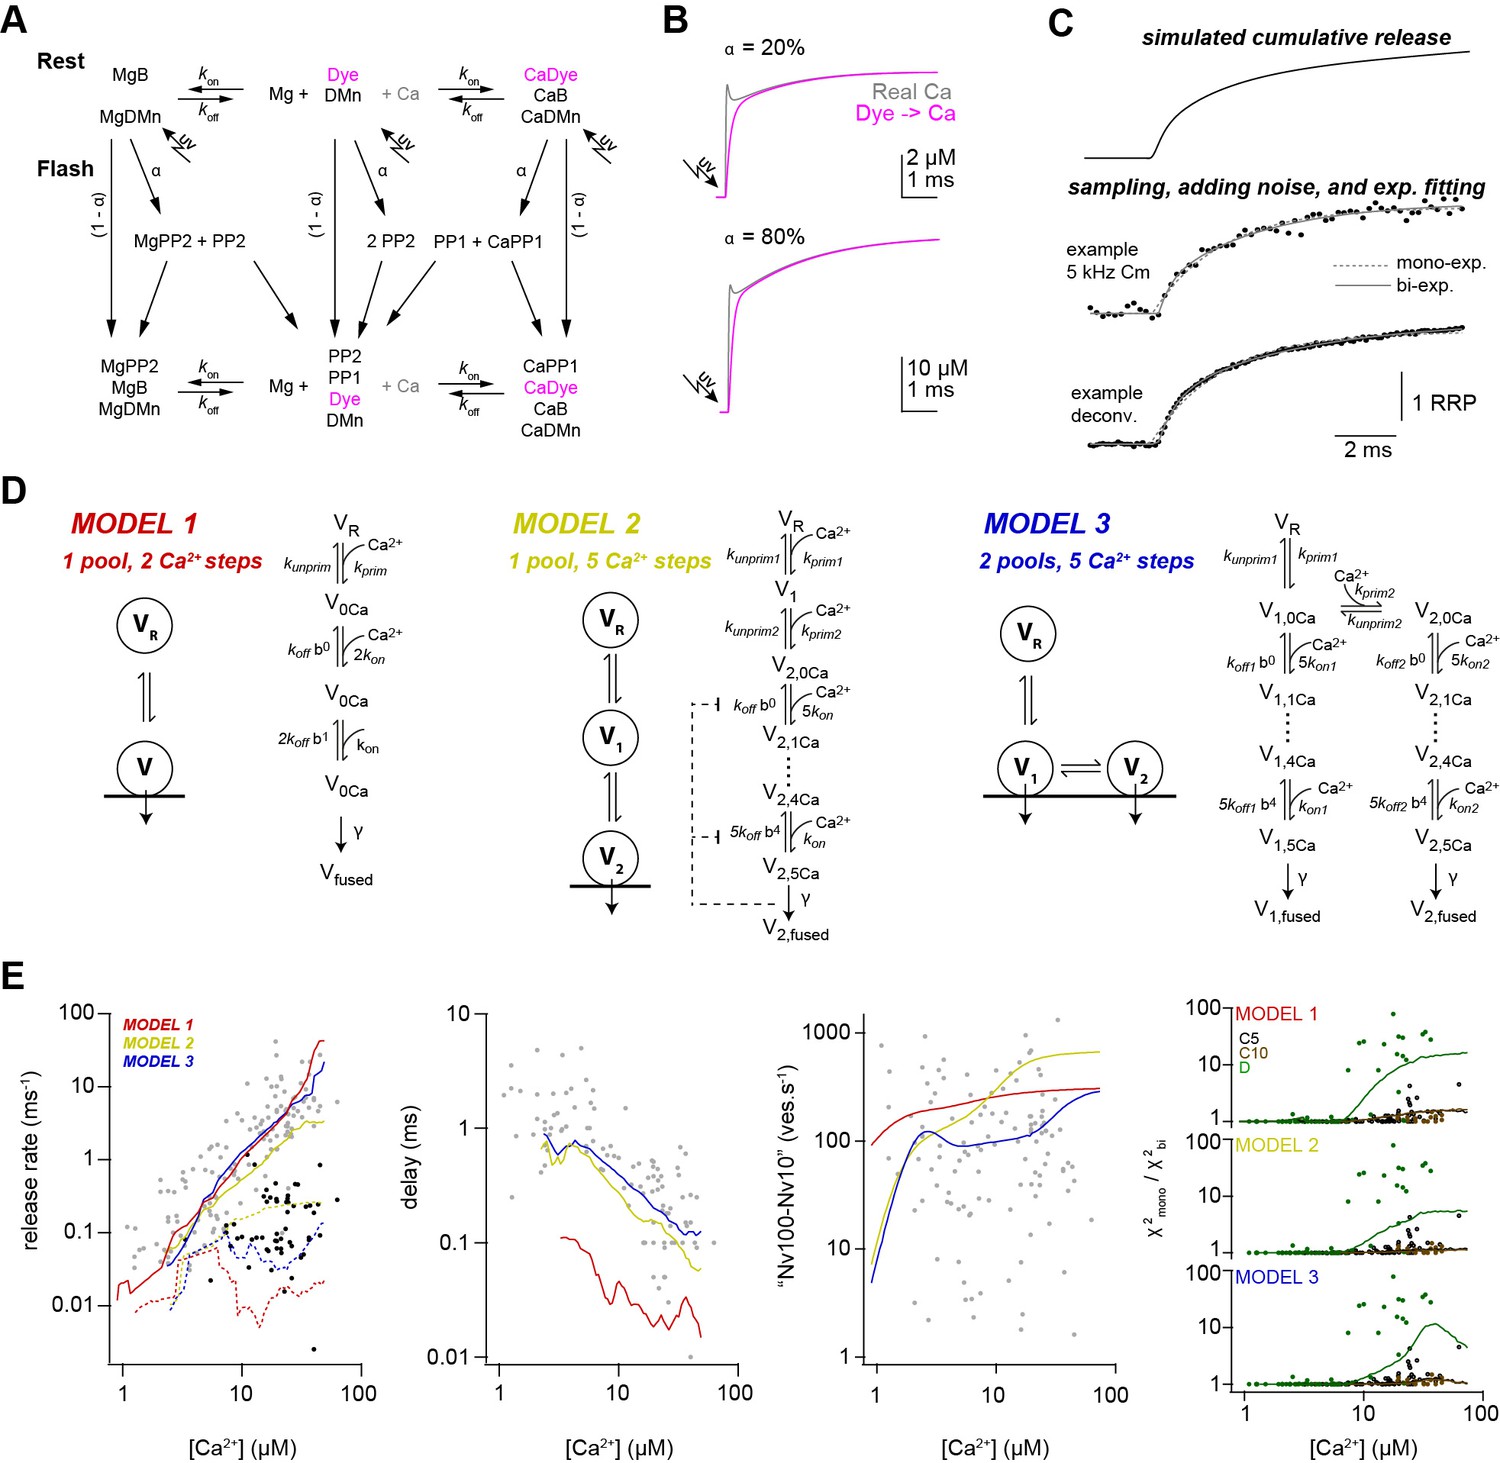
Release schemes with five Ca2+ steps and fast replenishment via parallel or sequential models can explain Ca2+-dependence of release.
(A) Scheme of the chemical reactions that were implemented in the model to calulate the UV-illumination-evoked increase in the free Ca2+ concentration. The model considered Ca2+ (Ca) and Mg2+ (Mg) binding to the indicator dye (OGB-5N or Fluo-5F), to DM-nitrophen (DMn), and to buffers (ATP and/or an endogenous buffer). The forward (kon) and backward (koff) rate constants differ between chemical species. Upon photolysis, a fraction α of metal bound and free DMn made a transition to different photoproducts (PP1 and PP2; Faas et al., 2005). For model parameters see Table 2. (B) The scheme in (A) was converted to a system of differential equations and the time courses of the ‘real’ free Ca2+ (magenta) and the free Ca2+ reported by Ca2+ dye were simulated for the indicated uncaging fractions α. Note that after less than 1 ms the dye reliably reflects the time course of Ca2+. (C) Traces showing the steps used in the simulation of the kinetic model of release. (D) Graphical illustration of the three models used during the simulations. For model parameters see Table 3. (E) From left to right, predictions of each model and the experimental data for the inverse of (gray symbols, solid lines) and inverse of (black symbols, dashed lines), delay, vesicle replenishment rate between 10 and 100 ms, and the increase in the χ2 ratio for the single- compared to the bi-exponential fits. Red, yellow, and blue lines correspond to simulations of models 1, 2, and 3, respectively. For the χ2 ratio (right plot), the experimental data and the simulations are shown separately for 5-kHz- and 10-kHz-capacitance data (C5 and C10; black and brown, respectively) and the deconvolution data (D; green).
Figure 7
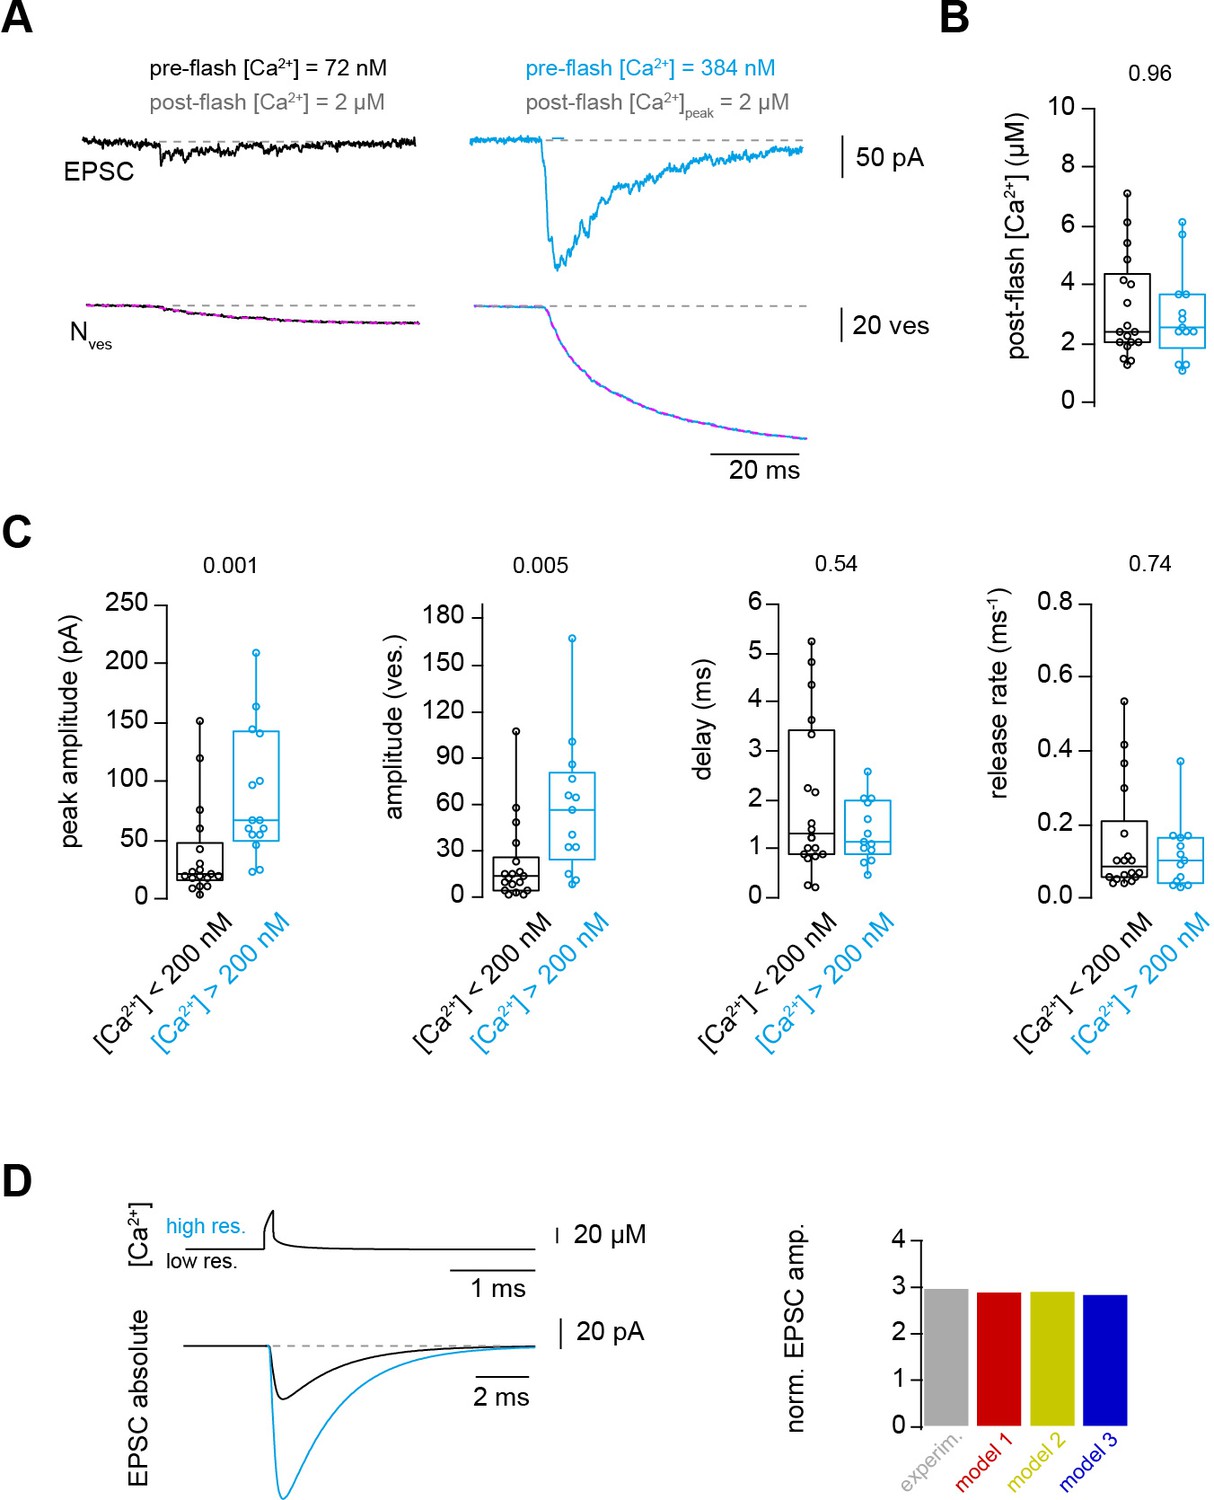
Ca2+ uncaging with different pre-flash Ca2+ concentrations indicates Ca2+-dependent vesicle priming.
(A) Two consecutive recordings from the same cell pair, with the same post-flash Ca2+ concentration but different pre-flash Ca2+ concentration in the presynaptic terminal. Top: postsynaptic current. Bottom: cumulative release of synaptic vesicles measured by deconvolution analysis of EPSCs superposed with a mono-exponential fit (magenta). Black and blue color represent low and high pre-flash Ca2+ concentration, respectively. The pre- and post-flash Ca2+ concentrations are indicated in each panel. (B) Comparison of the average post-flash Ca2+ concentration between both groups of either low (black) or high (blue) pre-flash Ca2+ concentration (n = 18 and 13 pairs, respectively). (C) From left to right: comparisons of the peak amplitude, the number of released vesicles measured as obtained from deconvolution analysis of EPSC, the delay of the release onset, and the release rate. Boxplots show median and 1st/3rd quartiles with whiskers indicating the whole data range. The values above the boxplots represent P-values of Mann-Whitney U tests. (D)Top left: simulated local action potential-evoked Ca2+concentrations at 20 nm from a Ca2+ channel taken from Delvendahl et al., 2015. Note the almost complete overlap of the two Ca2+ concertation traces with low and high basal Ca2+ concertation. Bottom left: predicted action potential-evoked EPSCs with low and high basal Ca2+ concertations. Right: ratio of the action potential-evoked EPSC amplitude with high and low basal Ca2+ concentrations for the experimental data and the model predictions.
-
Figure 7—source data 1
Ca2+ uncaging with different pre-flash Ca2+ concentrations indicates Ca2+-dependent vesicle priming.
- https://cdn.elifesciences.org/articles/70408/elife-70408-fig7-data1-v1.xlsx
Author response image 1
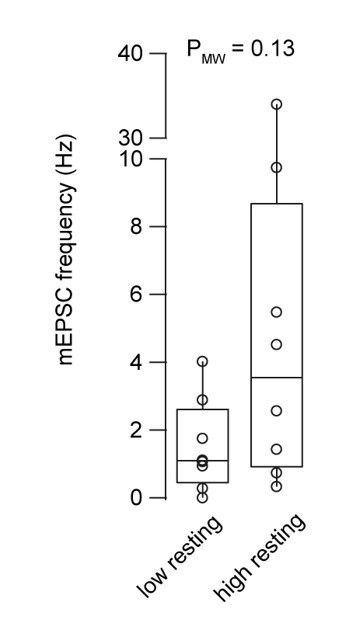
Miniature EPSC frequency with 30 and 180 nM intracellular Ca2+ concentration.
Boxplots show median and 1st/3rd quartiles with whiskers indicating the whole data range superimposed with the data from individual mossy fiber to granule cell pairs (n = 8 and 8 for the low and high basal Ca2+ conditions, respectively).
Tables
Table 1
Parameters for weak, middle, and strong post-flash Ca2+ elevations.
| weak Ca2+ elevation | middle Ca2+ elevation | strong Ca2+ elevation | |
|---|---|---|---|
| UV illumination | |||
| Duration (ms) | 0.1 or 1 | 0.1 | 0.1 or 0.2 |
| Intensity (%) | 10–100 | 20–100 | 100 |
| Concentration in intracellular solution (mM) | |||
| ATTO 594 | 0.010 | 0.020 | 0.020 |
| Fluo 5F | 0.050 | 0 | 0 |
| OGB 5N | 0 | 0.200 | 0.200 |
| CaCl2 | 0.500 | 2.000 | 10.000 |
| DM-N | 0.500 | 2.000 | 10.000 |
| Obtained peak post-flash Ca2+ (µM) | |||
| Min | 1.1 | 2.7 | 15.7 |
| Max | 7.1 | 36.0 | 62.6 |
| Median | 2.4 | 8.8 | 25.1 |
| Simulated uncaging fraction of DMn | |||
| α | 0.08–0.5 | 0.15–0.55 | 0.14–0.25 |
Table 2
Parameters for simulations of Ca2+ release from DMN cage.
| Parameters | Values | References number / Notes | |
|---|---|---|---|
| Resting Ca2+ | [Ca2+]rest | 227*10−9 M | Measured |
| Total magnesium | [Mg2+]T | 0.5*10−3 M | Pipette concentration |
| Fluo-5F | [Fluo] | 0 or 50 *10−6 M (see Table 1) | Pipette concentration |
| KD | 0.83 *10−6 M | Delvendahl et al., 2015 | |
| koff | 249 s-1 | ibid | |
| kon | 3*108 M−1s−1 | Yasuda et al., 2004 | |
| OGB-5N | [OGB] | 0 or 200*10−6 M (see Table 1) | Pipette concentration |
| KD | 31.4*10−6 M | Measured (Figure 3—figure supplement 1A) | |
| koff | 6000 s−1 | ibid. | |
| kon | 2.5*108 M−1s−1 | DiGregorio and Vergara, 1997 | |
| ATP | [ATP] | 5 *10−3 M | Pipette concentration |
| Ca2+ binding | KD | 2*10−4 M | Meinrenken et al., 2002 |
| koff | 100 000 s−1 | ibid. | |
| kon | 5*108 M−1s−1 | ibid. | |
| Mg2+ binding | KD | 100*10−6 M | Bollmann et al., 2000; MaxC |
| koff | 1000 s−1 | ibid. | |
| kon | 1*107 M−1s−1 | ibid. | |
| Endogenous buffer | [EB] | 480 *10−6 M | Delvendahl et al., 2015 |
| KD | 32*10−6 M | ibid | |
| koff | 16 000 s−1 | ibid. | |
| kon | 5*108 M−1s−1 | ibid. | |
| Total DM nitrophen | [DMn]T | 500*10−6 – 10*10−3 M (see Table 1) | Pipette concentration |
| Ca2+ binding | KD | 6.5*10−9 M | Faas et al., 2005 |
| koff | 0.19 s−1 | ibid. | |
| kon | 2.9*107 M−1s−1 | ibid. | |
| Mg2+ binding | KD | 1.5*10−6 M | ibid. |
| koff | 0.2 s−1 | ibid. | |
| Uncaging fraction | α | See Table 1 | |
| Fast uncaging fraction | af | 0.67 | Faas et al., 2005 |
| Photoproduct 1 | [PP1] | ||
| Ca2+ binding | KD | 2.38*10−3 M | Faas et al., 2005 |
| koff | 69 000 s−1 | ibid. | |
| kon | 2.9*107 M−1s−1 | ibid. | |
| Mg2+ binding | KD | 1.5*10−6 M | ibid. |
| koff | 300 s−1 | ibid. | |
| kon | 1.3*105 M−1s−1 | ibid. | |
| Photoproduct 2 | [PP2] | ||
| Ca2+ binding | KD | 124.1*10−6 M | Ibid. |
| koff | 3600 s−1 | ibid. | |
| kon | 2.9*107 M−1s−1 | ibid. | |
| Mg2+ binding | KD | 1.5*10−6 M | ibid. |
| koff | 300 s−1 | ibid. | |
| kon | 1.3*105 M−1s−1 | ibid. |
Key resources table
| Reagent type (species) or resource | Designation | Source or reference | Identifiers | Additional information |
|---|---|---|---|---|
| Chemical compound, drug | NaCl | Sigma-Aldrich | Cat. # S9888 | |
| Chemical compound, drug | NaHCO3 | Sigma-Aldrich | Cat. # S6297 | |
| Chemical compound, drug | Glucose | Sigma-Aldrich | Cat. # G8270 | |
| Chemical compound, drug | AP 5 | Sigma-Aldrich | Cat. # A78403 | |
| Chemical compound, drug | KCl | Sigma-Aldrich | Cat. # P9333 | |
| Chemical compound, drug | CaCl2 | Sigma-Aldrich | Cat. # C5080 | For extracellular solution |
| Chemical compound, drug | CaCl2 | Sigma-Aldrich | Cat. # 21115 | For intracellular solution |
| Chemical compound, drug | EGTA | Sigma-Aldrich | Cat. # E0396 | |
| Chemical compound, drug | NaH2PO4 | Merck | Cat. # 106342 | |
| Chemical compound, drug | Tetrodotoxin | Tocris | Cat. # 1078 | |
| Chemical compound, drug | MgCl2 | Sigma-Aldrich | Cat. # M2670 | |
| Chemical compound, drug | TEA-Cl | Sigma-Aldrich | Cat. # T2265 | |
| Chemical compound, drug | HEPES | Sigma-Aldrich | Cat. # H3375 | |
| Chemical compound, drug | NaGTP | Sigma-Aldrich | Cat. # G8877 | |
| Chemical compound, drug | Na2ATP | Sigma-Aldrich | Cat. # A2383 | |
| Chemical compound, drug | DMnitrophen | Synptic systems | Cat. # 510016 | |
| Chemical compound, drug | CsOH | Sigma-Aldrich | Cat. # C8518 | |
| Chemical compound, drug | Atto594 | ATTO-TEC | Cat. # AD 594 | |
| Chemical compound, drug | OGB1 | Thermo Fisher Scientific | Cat. # 06806 | |
| Chemical compound, drug | OGB-5N | Thermo Fisher Scientific | Cat. # 944034 | |
| Chemical compound, drug | Fluo-5F | Thermo Fisher Scientific | Cat. # F14221 | |
| Chemical compound, drug | KOH solution | Roth | Cat. # K017.1 | |
| Chemical compound, drug | Kynurenic acid | Sigma-Aldrich | Cat. # K3375 | |
| Chemical compound, drug | Cyclothiazide | Sigma-Aldrich | Cat. # C9847 | |
| Chemical compound, drug | Ca2+ Calibration Buffer Kit | Thermo Fisher Scientific | Cat. # C3008MP | |
| Chemical compound, drug | Caged fluorescein | Sigma-Aldrich | Cat. # F7103 | |
| Chemical compound, drug | Glycerol | Sigma-Aldrich | Cat. # G5516 | |
| Chemical compound, drug | Isoflourane | Baxter | Cat. # Hdg9623 | |
| Chemical compound, drug | Aqua B. Braun | Braun | Cat. # 00882479E | For extracellular solution |
| Chemical compound, drug | Sterile Water | Sigma-Aldrich | W Cat. # 3500 | For intracellular solution |
| Strain, strain background (mouse C57BL/6N) | Female, male C57BL/6N | Charles river | https://www.criver.com/ | |
| Other | Vibratome | LEICA VT 1200 | https://www.leica-microsystems.com/ | |
| Other | Femto2D laser-scanning microscope | Femtonics | https://femtonics.eu/ | |
| Other | UV laser source | Rapp OptoElectronic | https://rapp-opto.com/ | 375 nm, 200 mW |
| Other | DMZ Zeitz Puller | Zeitz | https://www.zeitz-puller.com/ | |
| Other | Borocilicate glass | Science Products | https://science-products.com/en/ | GB200F-10 With filament |
| Other | HEKA EPC10/2 amplifier | HEKA Elektronik | https://www.heka.com/ | |
| Other | Ti:Sapphire laser | MaiTai, SpectraPhysics | https://www.spectra-physics.com/ | |
| Other | Ca2+ sensitive electrode (ELIT 8041 PVC membrane) | NICO 2000 | http://www.nico2000.net/index.htm | |
| Other | Single junction silver chloride reference electrode (ELIT 001 n) | NICO 2000 | http://www.nico2000.net/index.htm | |
| Other | PH/Voltmeter | Metler toledo | https://www.mt.com/de/en/home.html | |
| Other | Osmomat 3000 | Gonotec | http://www.gonotec.com/de | |
| Other | TC-324B perfusion heat controller | Warner Instruments | https://www.warneronline.com/ | |
| Software, algorithm | MES | Femtonics | https://femtonics.eu/ | |
| Software, algorithm | Igor Pro | Wavemetrics | https://www.wavemetrics.com/ | |
| Software, algorithm | Patchmaster | HEKA Elektronik | https://www.heka.com/ | |
| Software, algorithm | Adobe illustrator | Adobe | https://www.adobe.com/products/illustrator.html | |
| Software, algorithm | Mathematica | Wolfram | https://www.wolfram.com/mathematica/ | |
| Software, algorithm | Maxchelator | Stanford University | https://somapp.ucdmc.ucdavis.edu/pharmacology/bers/maxchelator/ |
Table 3
Parameters for release scheme models.
| Model1 | Model2 | Model3 | |||
|---|---|---|---|---|---|
| kon | 2.95*109 Ca2+(t) M−1 s−1 | kon,init | 5.10*108 Ca2+(t) M−1 s−1 | kon1 | 0.5 kon2 |
| kon,plug | 0.1 kon,init | kon2 | 5.10*108 Ca2+(t) M−1 s−1 | ||
| koff | 4.42*105 s−1 | koff,init | 2.55*104 s−1 | koff1 | 10 koff2 |
| koff,plug | 0.4 koff,init | koff2 | 2.55*104 s−1 | ||
| b | 0.25 | b | 0.25 | b | 0.25 |
| γ | 1.77*104 s−1 | γ | 1.77*104 s−1 | γ | 1.77*104 s−1 |
| kprim | 0.6+30*(Ca2+(t)/(KD,prim +Ca2+(t))) s−1 | kprim1 | 2.5+60*(Ca2+(t)/(KD,prim1 +Ca2+(t))) s−1 | kprim1 | 30 s−1 |
| kunprim | 0.6+30*(Ca2+Rest/(KD,prim + Ca2+Rest)) s−1 | kunprim1 | 2.5+60*(Ca2+Rest/(KD,prim1 + Ca2+Rest)) s−1 | kunprim1 | 30 s−1 |
| KD,prim | 2 µM | KD,prim1 | 2 µM | ||
| kprim2 | 100+800*(Ca2+(t)/(KD,prim2 +Ca2+(t))) s−1 | kprim2 | 0.5+30*(Ca2+(t)/(KD,prim2 +Ca2+(t))) s−1 | ||
| kunprim2 | 100+800*(Ca2+Rest/(KD,prim2 + Ca2+Rest)) s−1 | kunprim2 | 0.5+30*(Ca2+Rest/(KD,prim2 + Ca2+Rest)) s−1 | ||
| KD,prim2 | 2 µM | KD,prim2 | 2 µM |
Additional files
Download links
A two-part list of links to download the article, or parts of the article, in various formats.
Downloads (link to download the article as PDF)
Open citations (links to open the citations from this article in various online reference manager services)
Cite this article (links to download the citations from this article in formats compatible with various reference manager tools)
Calcium dependence of neurotransmitter release at a high fidelity synapse
eLife 10:e70408.
https://doi.org/10.7554/eLife.70408


