Cryo-EM reveals new species-specific proteins and symmetry elements in the Legionella pneumophila Dot/Icm T4SS
- Department of Pharmacology, University of Minnesota, United States
- Department of Pathology, Microbiology, and Immunology, Vanderbilt University Medical Center, United States
- Life Sciences Institute, University of Michigan, United States
- Department of Biotechnology, The Catholic University of Korea, Republic of Korea
- Department of Microbiology and Immunology, University Of Michigan, United States
- The Veterans Affairs Tennessee Valley Healthcare System, United States
- Department of Cell and Developmental Biology, University of Michigan, United States
Figures
Figure 1 with 4 supplements
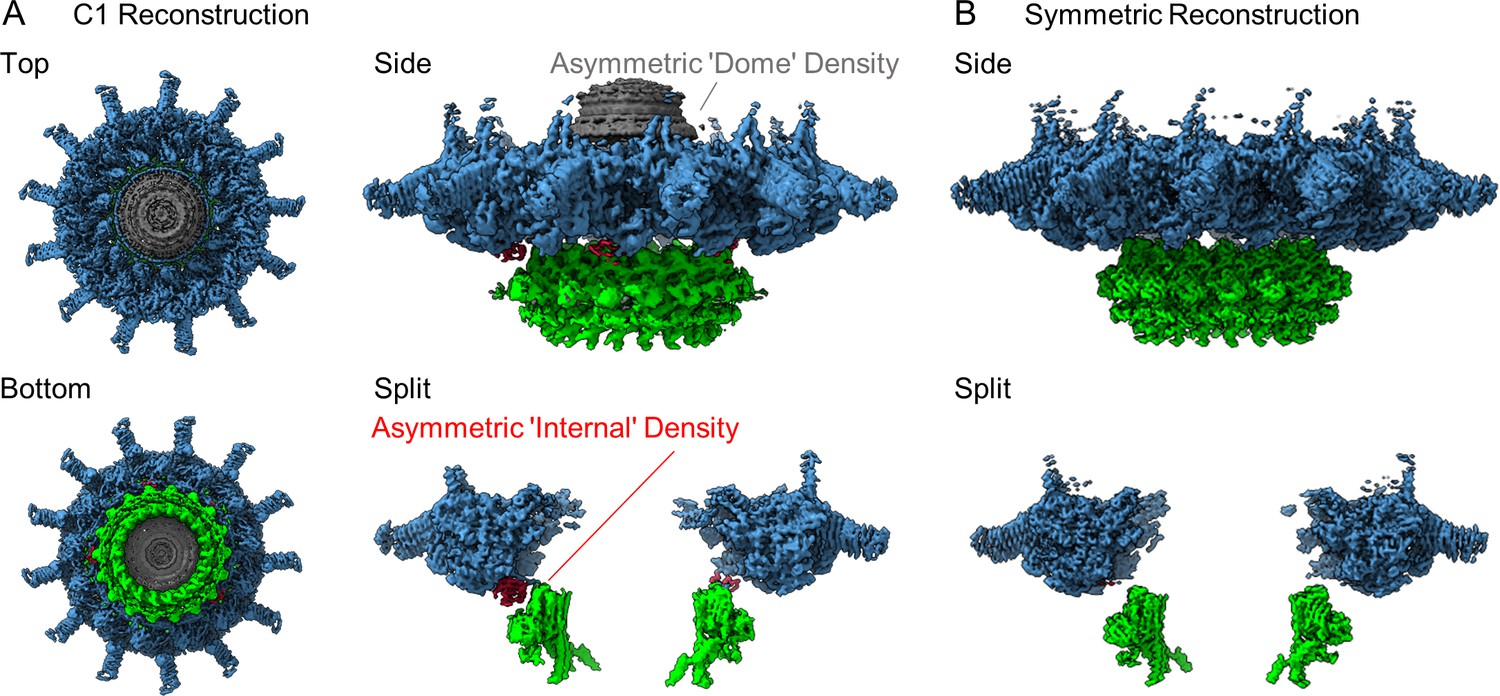
The structure of the Dot/Icm type IV secretion system (T4SS).
(A) The asymmetric reconstruction (C1) of the Dot/Icm T4SS includes the outer membrane cap (OMC) (shown in blue), the periplasmic ring (PR) (shown in green), the asymmetric dome (shown in gray), and additional densities with no apparent symmetry sandwiched between the OMC and PR (shown in red). (B) The imposition of symmetry was used to improve the resolution of the OMC (C13 symmetry) and PR (C18 symmetry).
Figure 1—figure supplement 1
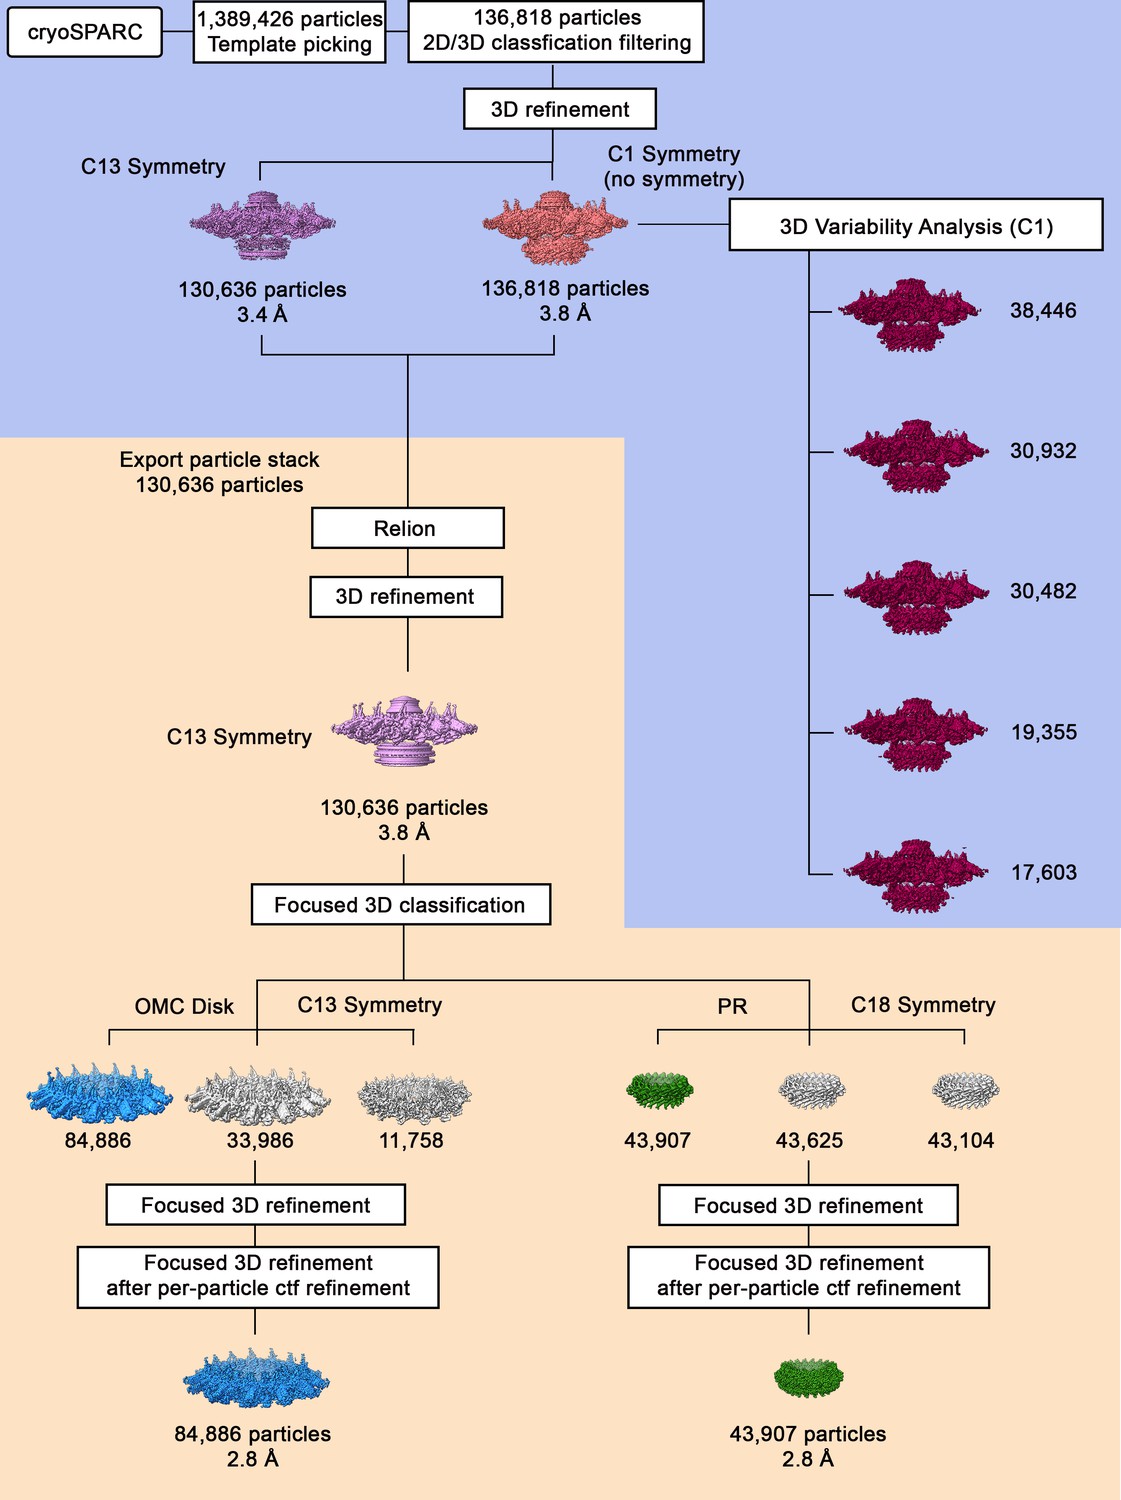
Cryo-EM data processing workflow.
Using template picking in cryoSPARC, ~1,400,000 Dot/Icm type IV secretion system (T4SS) particles were selected. The processing steps done in cryoSPARC are on a blue background, and the processing steps done using RELION are on a tan background. After 2D and 3D classification, the best class of ~136,000 particles was chosen for further refinement with and without C13 symmetry, resulting in reconstruction of 3D maps at 3.8 and 3.4 Å, respectively. The particle stack used in the refinement job in cryoSPARC was exported into Relion for further processing, such as contrast transfer function (CTF)-refinement and focused refinement. The 3.4 Å 3D model with C13 symmetry was used as an initial model for 3D structure determination in Relion using auto-3D refinement with C13 symmetry, resulting in reconstruction of 3D map of 3.8 Å resolution. Focused 3D classification (without alignment) including CTF per-particle refinement and then with either C13 (outer membrane cap [OMC]) or C18 symmetry (periplasmic ring [PR]) imposed was used to determine higher resolution maps of the OMC disk (with 13-fold symmetry) and the PR (with 18-fold symmetry). The maps of the OMC disk and PR were further refined using focused 3D refinement (with local refinement), resulting in 3D maps of the OMC disk (13-fold symmetry) and the PR (18-fold symmetry) at 2.8 Å for each region.
Figure 1—figure supplement 2
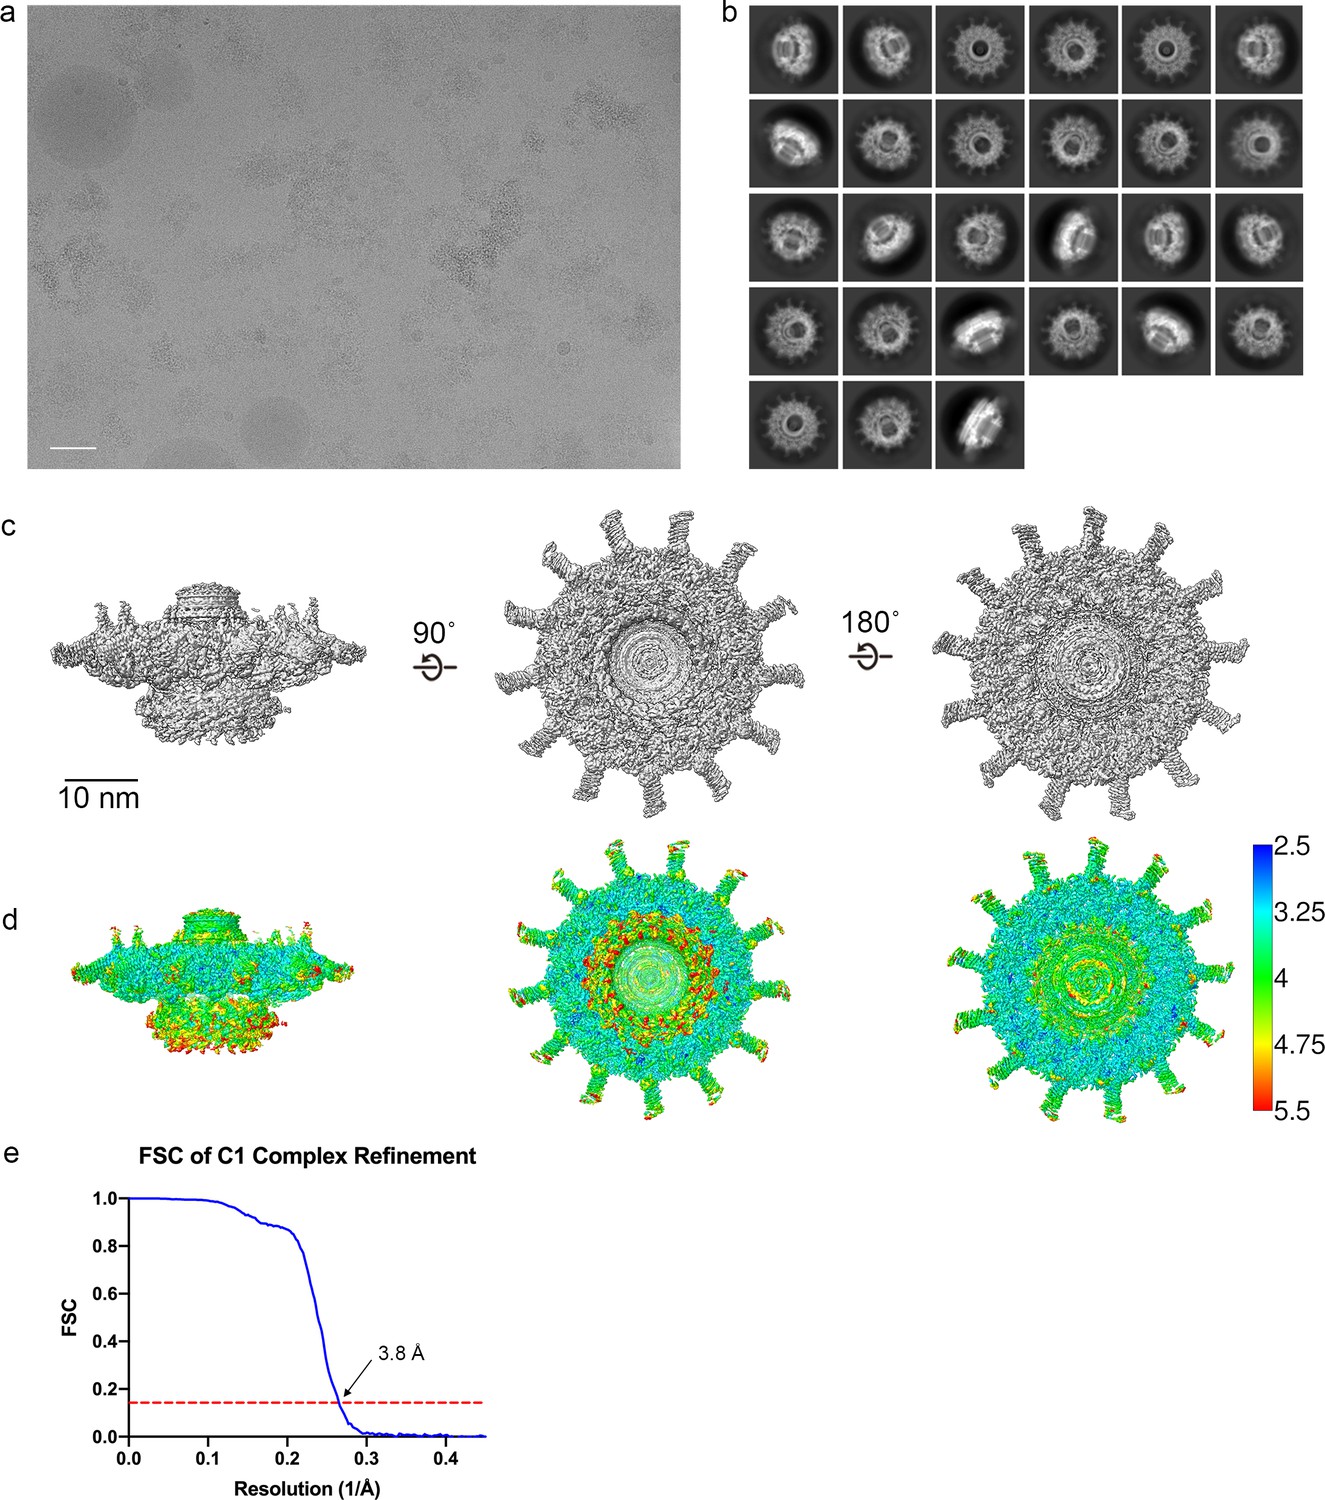
Cryo-EM data analysis C1 refinements.
(a) A representative image of the Dot/Icm type IV secretion system (T4SS) particles in cryo-EM (scale bar = 50 nm) and (b) subsequent 2D class averages (edge of box, 510 pixel, 562 Å). (c–e) The Dot/Icm T4SS map was reconstructed with no symmetry applied. The local resolution of the C1 map extends to ~3.0 Å in the best resolved portions of the map. Fourier shell correlation (FSC) indicates a global resolution of 3.8 Å.
Figure 1—figure supplement 3
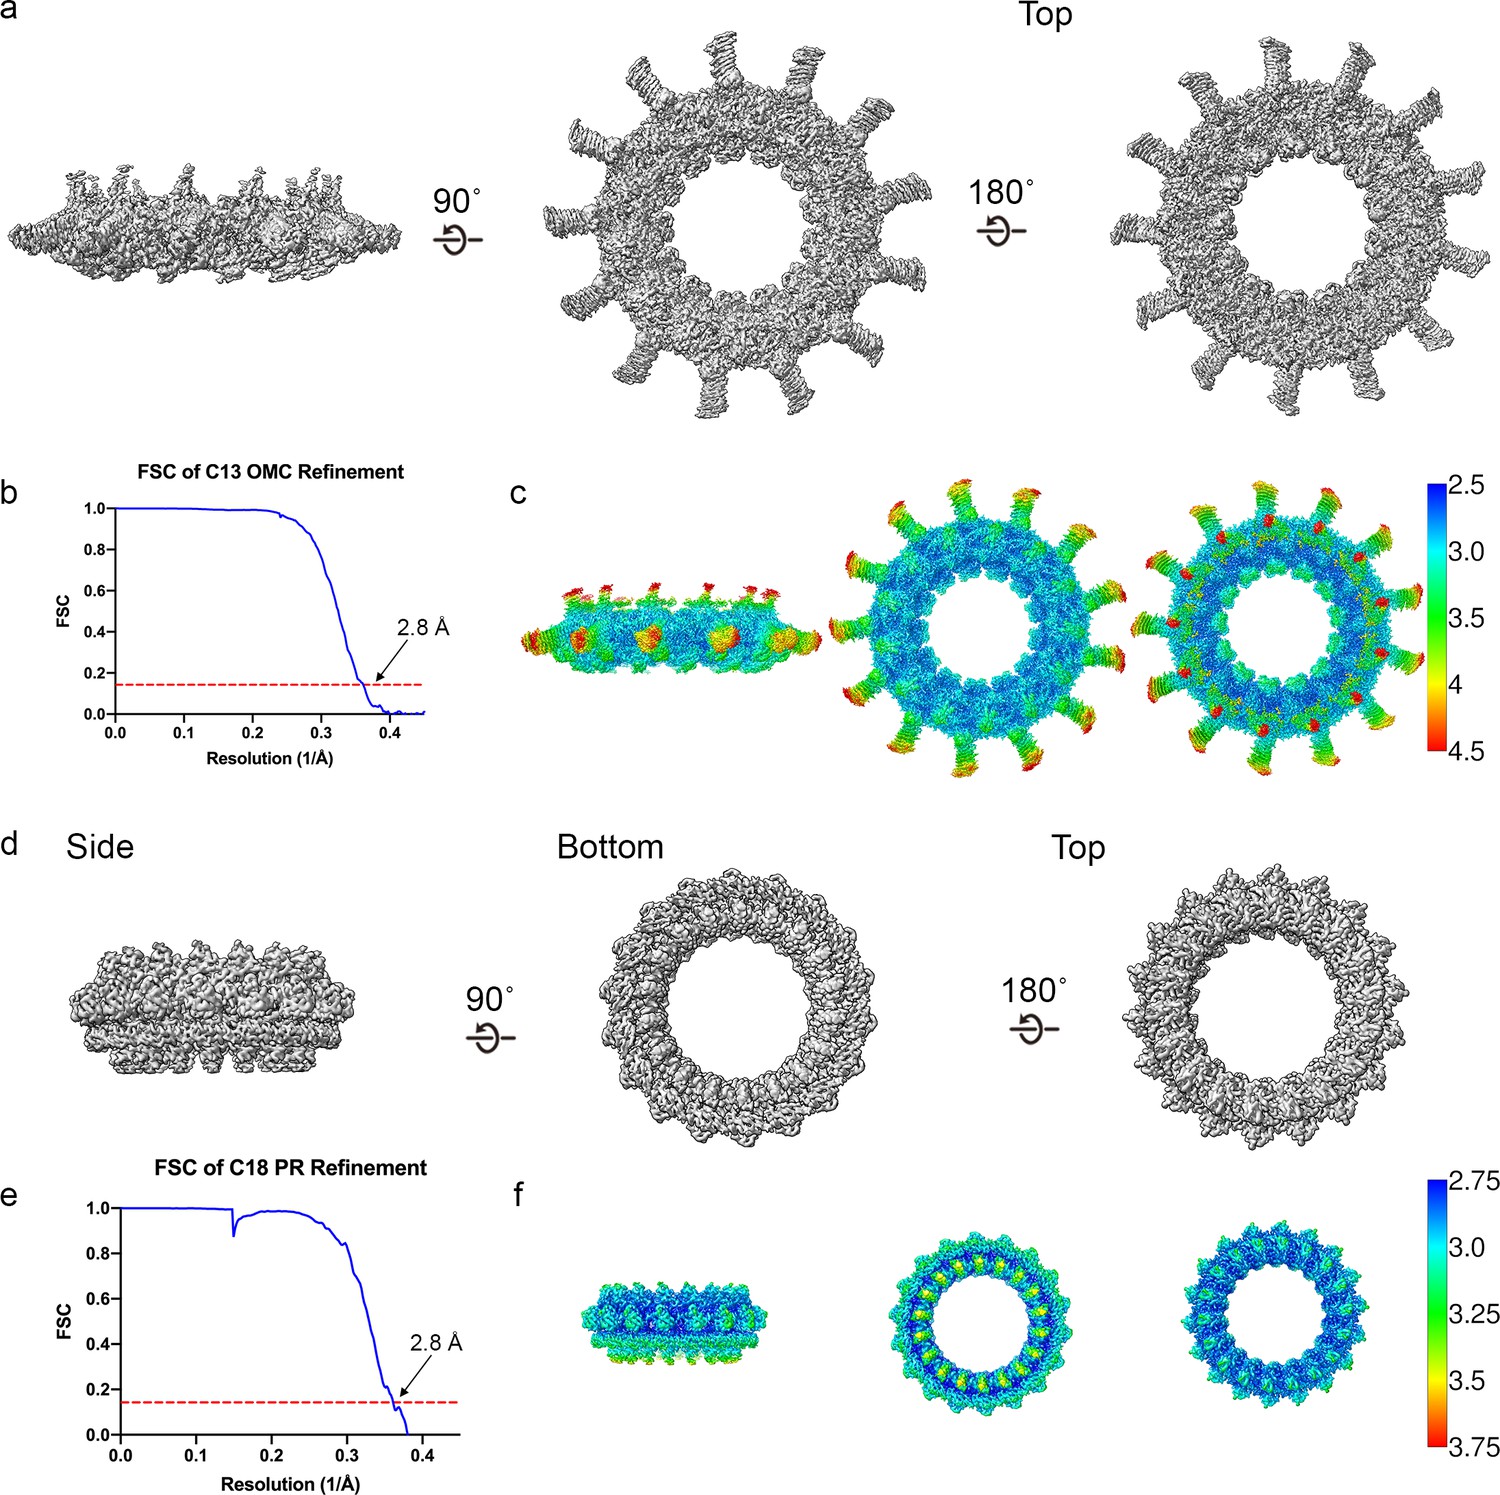
Cryo-EM data analysis focused refinements.
(a–b) The outer membrane cap (OMC) disk has been reconstructed to 2.8 Å resolution using C13 symmetry. (c) The local resolution of the OMC extends to ~2.5 Å in the best resolved portions of the map. (d–e) The periplasmic ring (PR) has been reconstructed to 2.8 Å using C18 symmetry. (f) The local resolution of the PR extends to ~2.8 Å in the best resolved regions of the map.
Figure 1—figure supplement 4

Three-dimensional variability analysis of the Dot/Icm dome.
(a–e) The complex has been reconstructed to 4.6 Å resolution using C1 refinements of five clusters of particles identified by 3D variability analysis (3DVA).
Figure 2 with 7 supplements
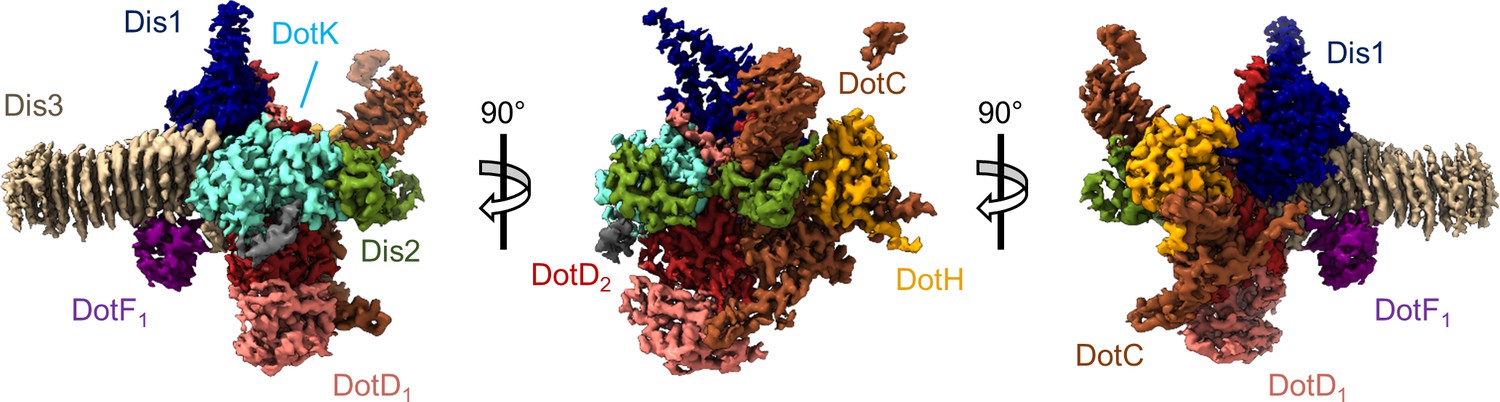
The asymmetric unit of the Dot/Icm type IV secretion system (T4SS) outer membrane cap (OMC).
The asymmetric unit of the OMC is comprised of one copy of DotC (brown), DotF1 (purple), DotK (cyan), DotH (orange), Dis1 (Lpg0657, blue), Dis2 (Lpg0823, green), Dis3 (Lpg2847, tan), and two copies of DotD (red and pink).
Figure 2—figure supplement 1
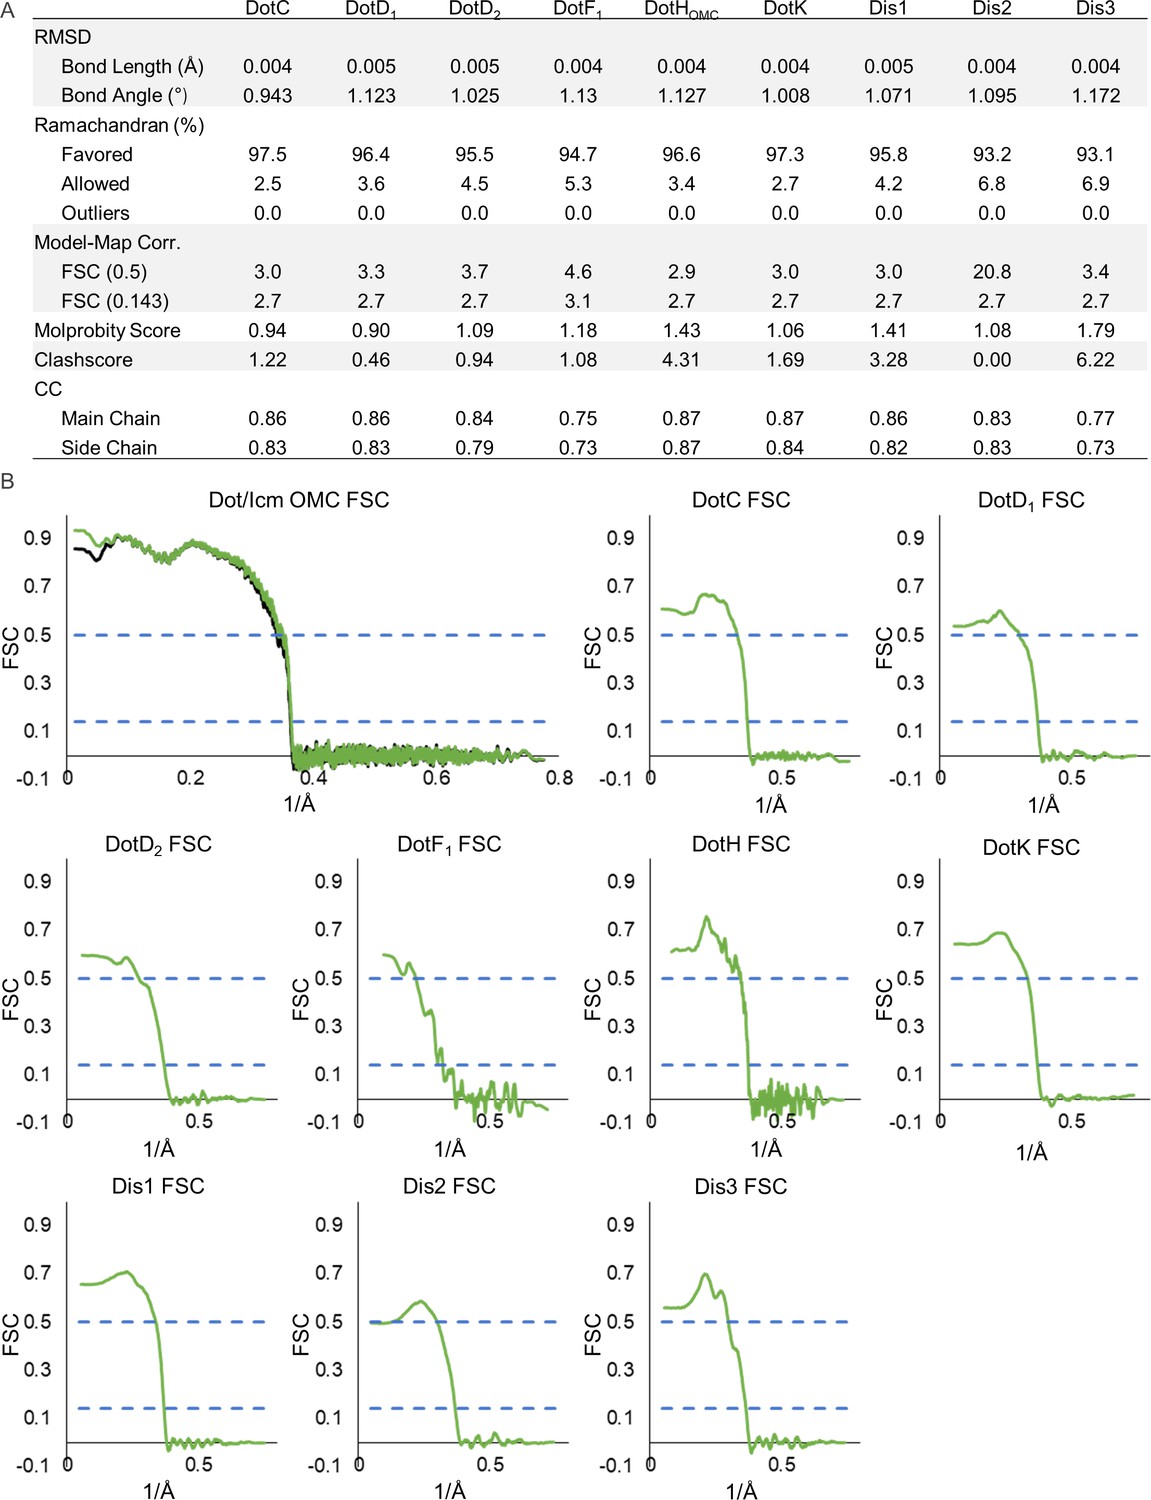
Model statistics for components of the Dot/Icm type IV secretion system (T4SS) outer membrane cap (OMC).
(A) The refinement statistics for each component of the Dot/Icm T4SS OMC are shown in the table. (B) The model map correlation for the entire OMC is shown with the masked data shown in green and the unmasked shown in black. The fit of each model was also determined.
Figure 2—figure supplement 2
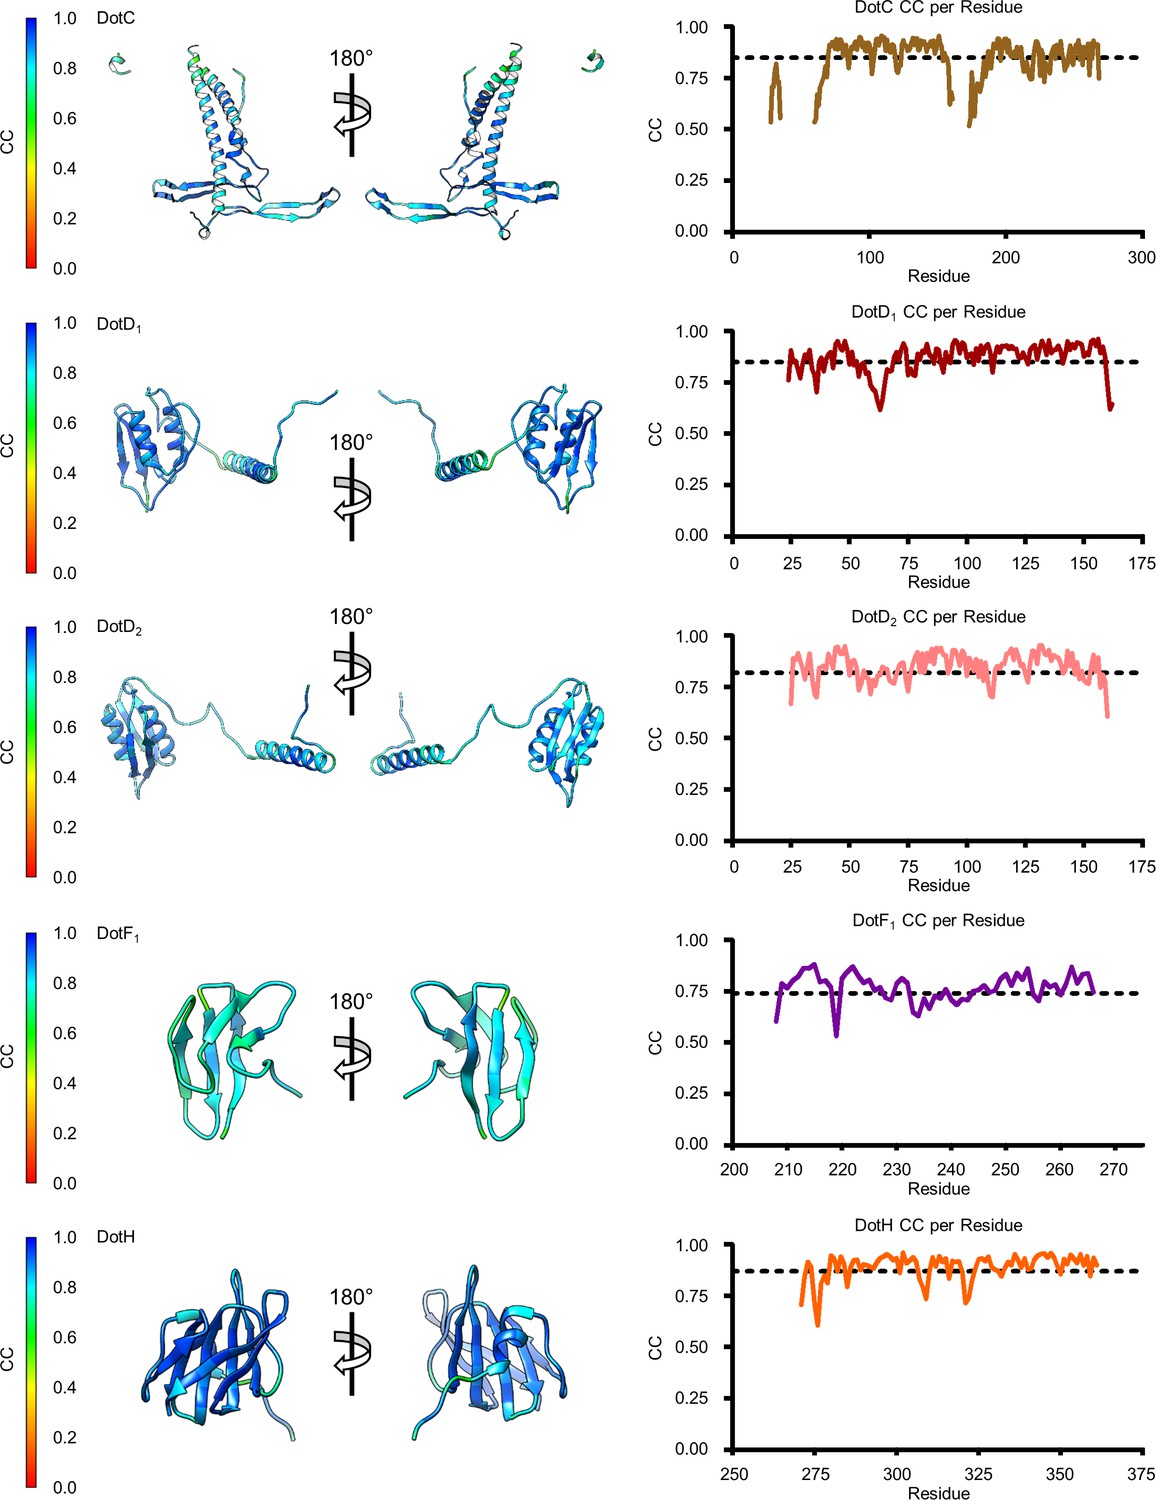
Model map correlation for some components of the outer membrane cap (OMC).
The quality of the model was interpreted using per residue correlation coefficients for regions of DotC, DotD1, DotD2, DotF1, and DotH. The correlation of each residue is plotted by spectrum on each component (left). The correlation coefficient was also plotted against residue number (right). The average correlation coefficient per residue is indicated by the dashed line.
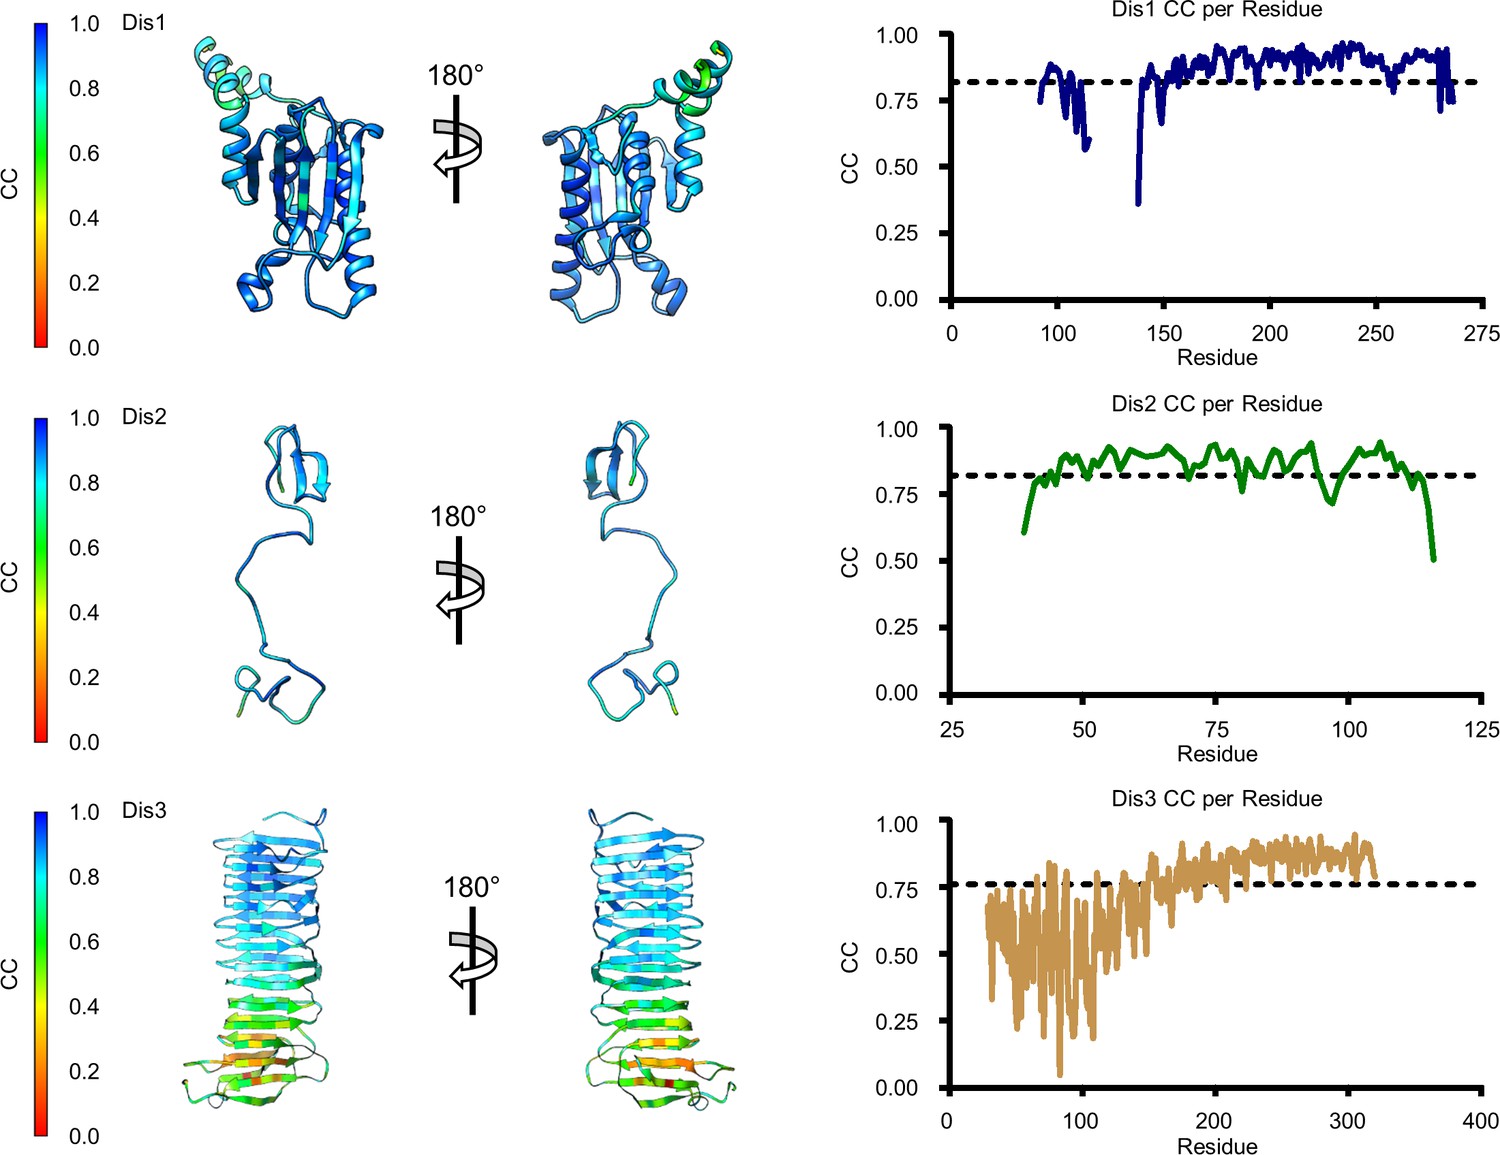
Figure 2—figure supplement 3
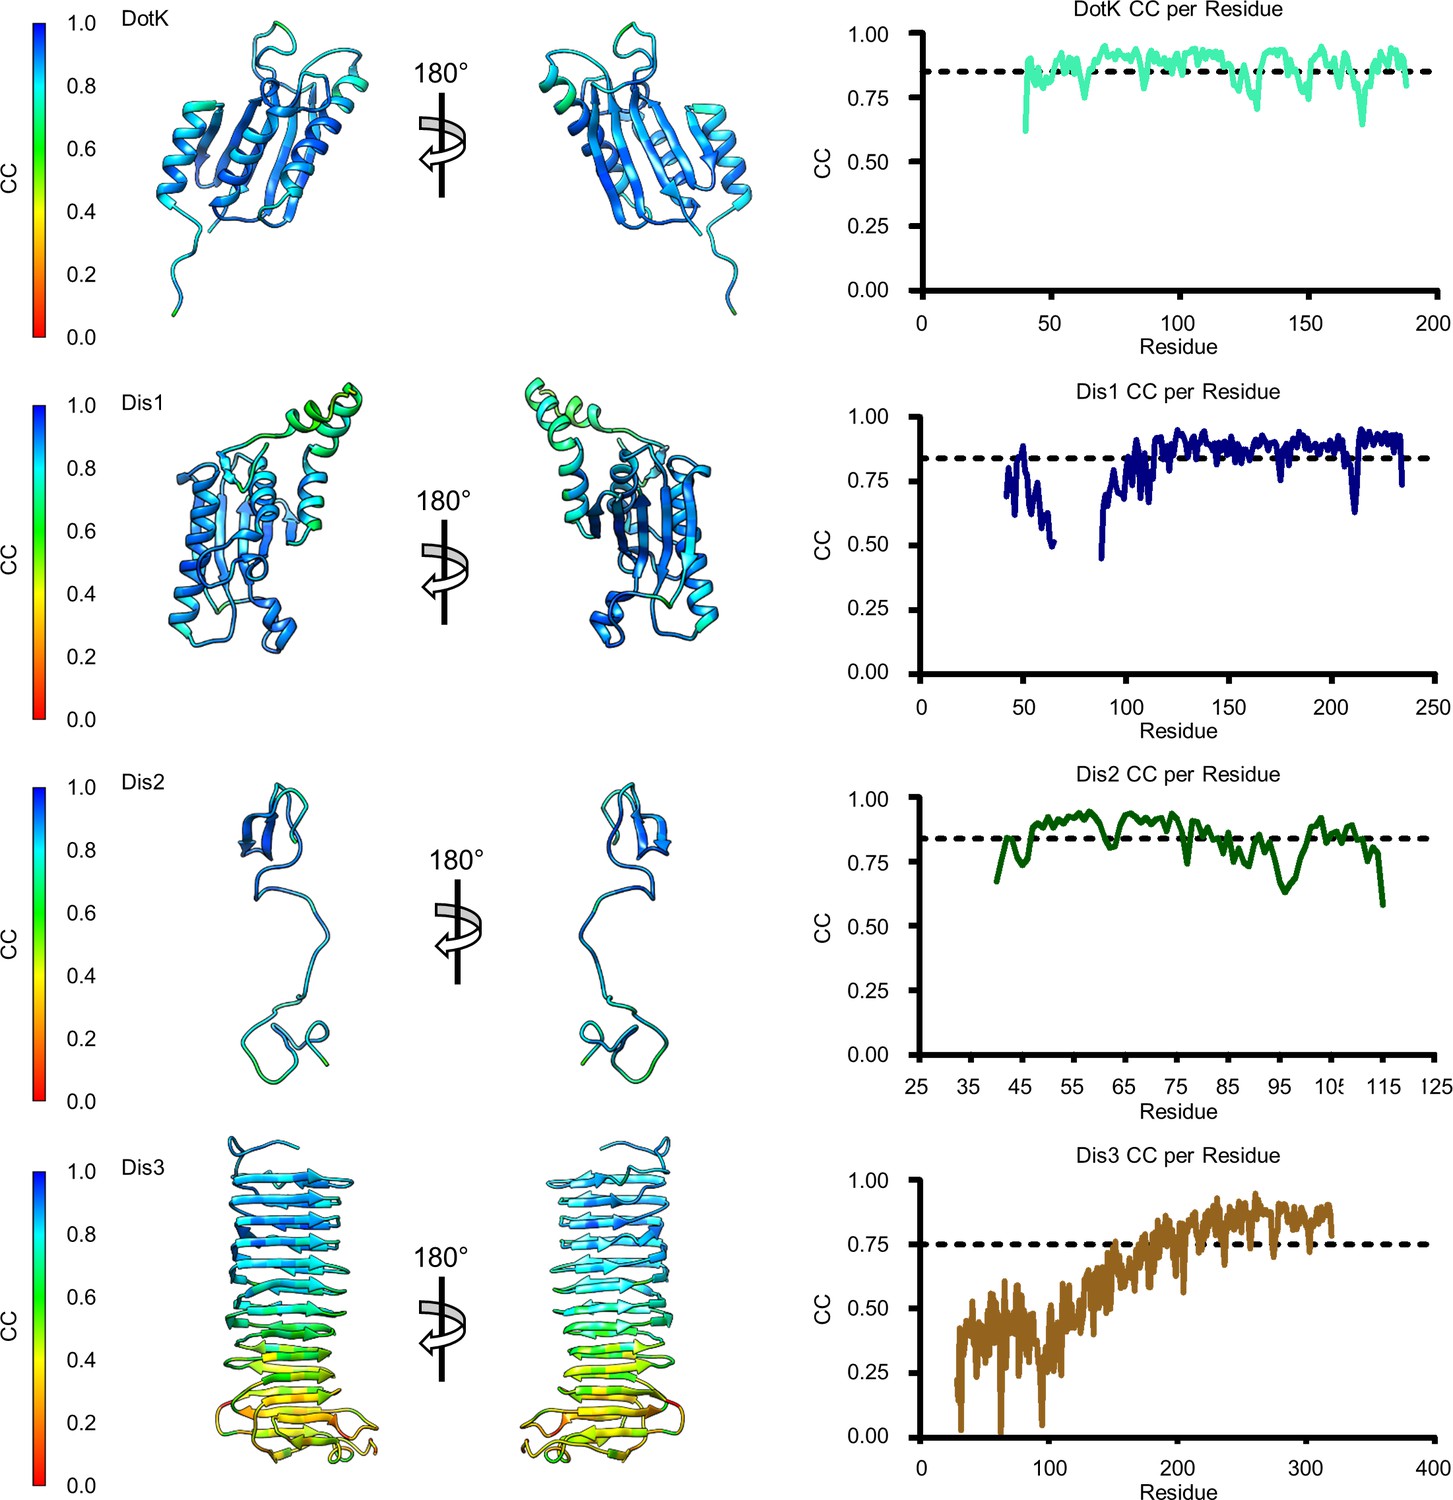
Model map correlation for remaining components of the outer membrane cap (OMC).
The quality of the model was interpreted using per residue correlation coefficients for DotK, Dis1, Dis2, and Dis3. The correlation of each residue is plotted by spectrum on each component (left). The correlation coefficient was also plotted against residue number (right). The average correlation coefficient per residue is indicated by the dashed line.
Figure 2—figure supplement 4

Predicted membrane interactions in the outer membrane cap (OMC).
(A) The predicted lipidation recognition elements of DotC, DotD, and DotK are shown with the predicted lipidated residue indicated in red (top). We note that a similar site exists within Dis1 with the putative lipidation recognition site indicated in red (bottom). (B) When the asymmetric unit of the OMC is fit into a tomogram of the Dot/Icm type IV secretion system (T4SS) (Chetrit et al., 2018) (left), we note that several features predicted to interact with the outer membrane would indeed be in close proximity to the lipid bilayer (right, dashed circles). (C) A model of the location of predicted membrane interaction sites in the OMC in relation to their position to the outer membrane. In aggregate, these seven sites could anchor the structure to the outer membrane.
Figure 2—figure supplement 5
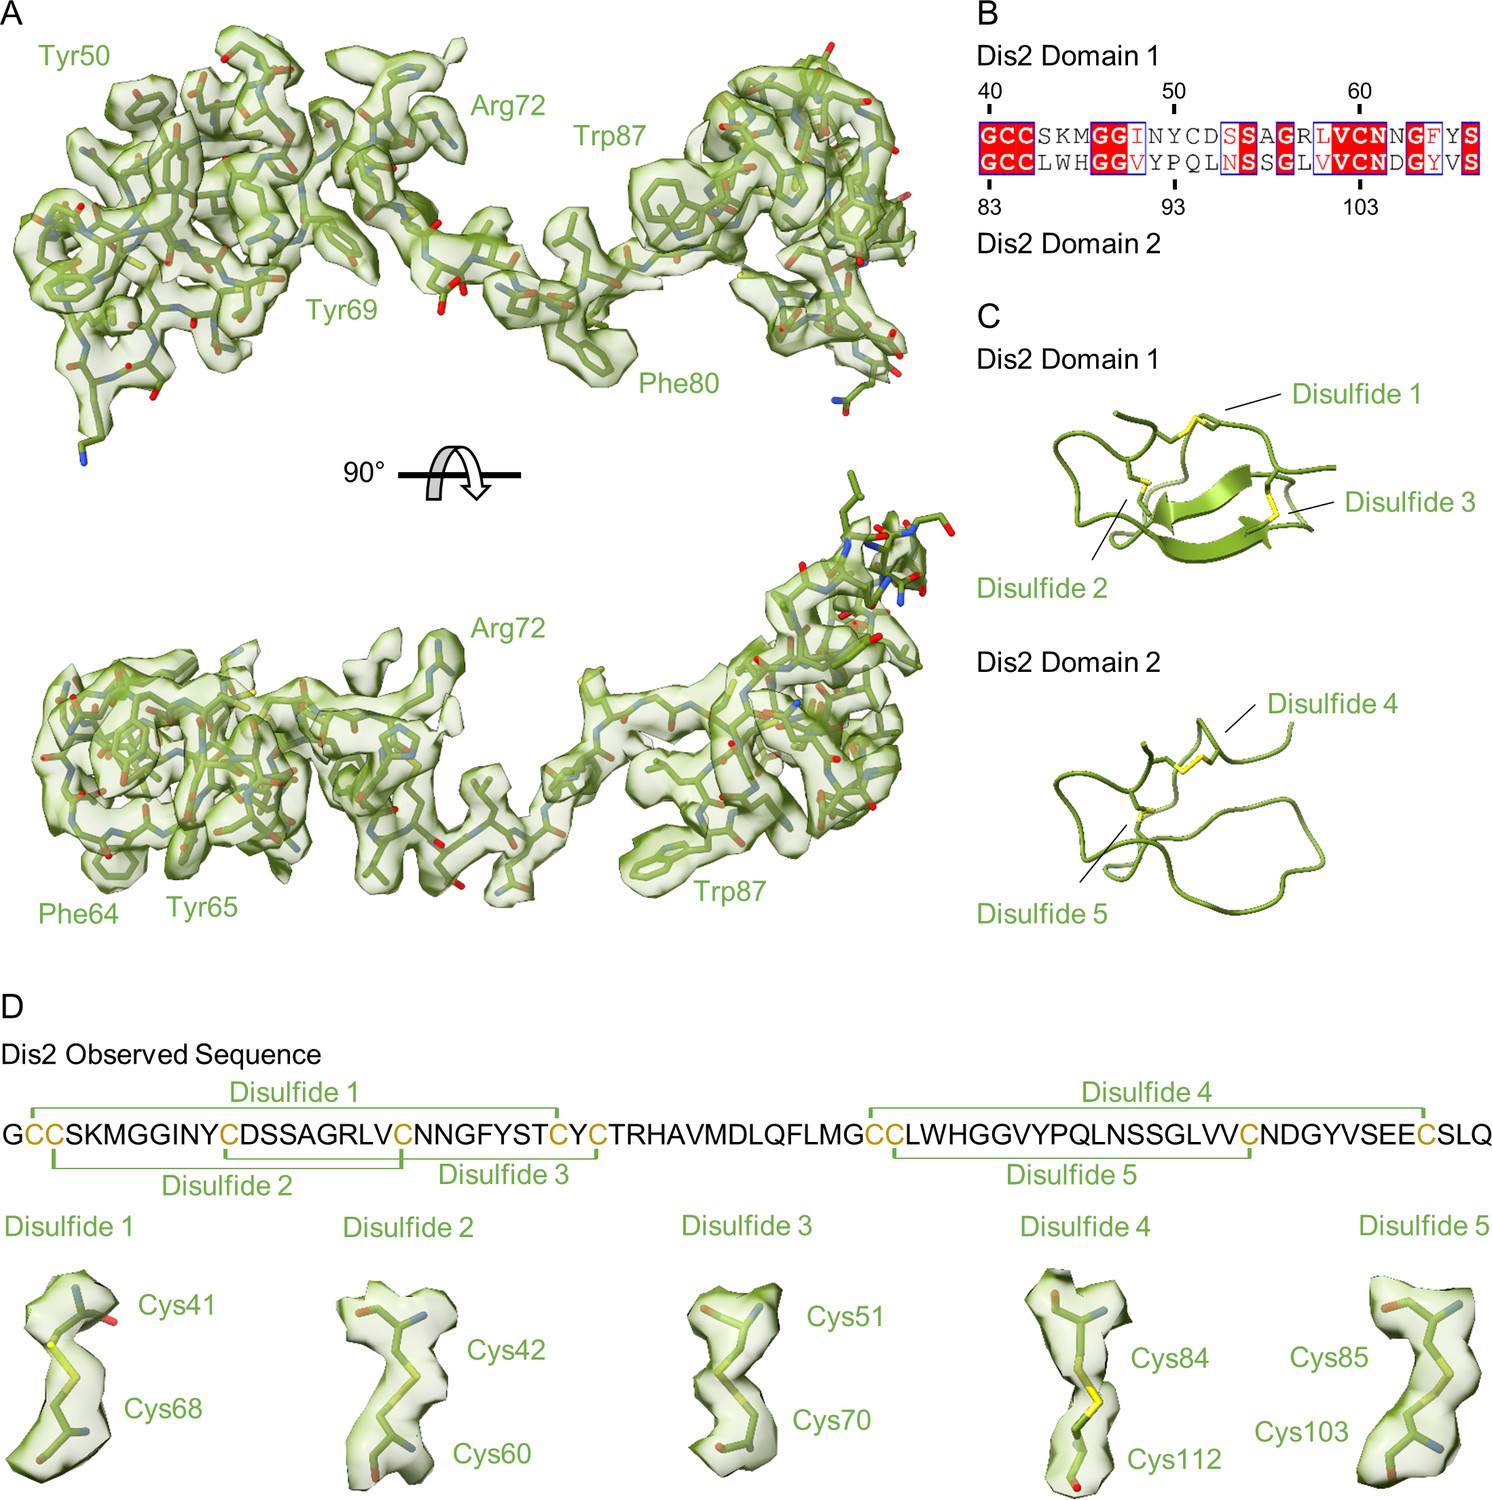
Structure of Dis2 (Lpg0823).
(A) The unknown fold near the ‘top’ of the outer membrane cap (OMC) is Dis2. (B–C) Representative density fits for large residues are indicated. Dis2 is comprised of two domains that are similar in sequence (B) and structure (C). (D) There are a total of five disulfide bonds observed within Dis2 as mapped onto the sequence. Each of the disulfide bonds that are described here include strong density within the reconstructed cryo-EM map.
Figure 2—figure supplement 6
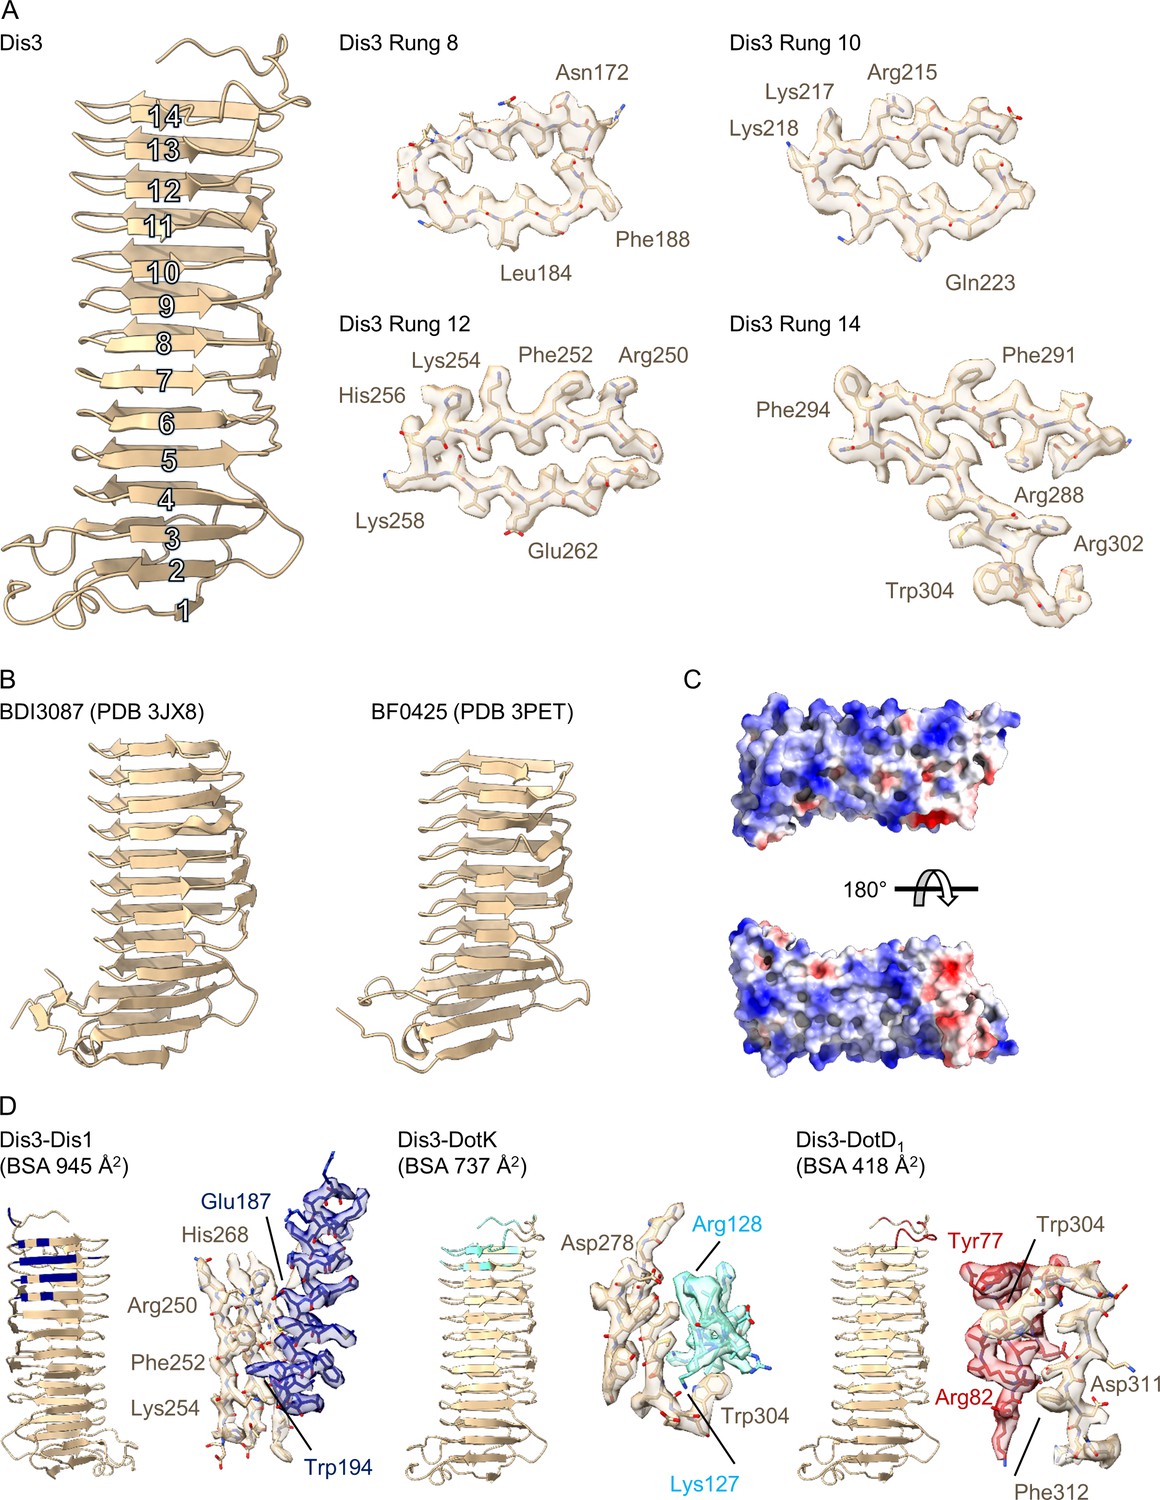
Structure of Dis3 (Lpg2847).
(A) Dis3 is a 14-rung β-helical protein that we have modeled into the peripheral ‘arm’ density of the outer membrane cap (OMC) (left). Example density for specific rungs indicate the loss of resolution toward the periphery of the map (right). (B) Dis3 is structurally similar to adhesion proteins found in the genus Bacteroides. (C) The surface of Dis3 is predominantly electropositive as indicated in this electrostatic depiction. (D) Lpg2847 makes contact with three other proteins within the OMC, Dis1, DotK, and DotD1. All interactions are mediated through rungs within the C-terminus of the protein.
Figure 2—figure supplement 7

Structure of DotF1 in the outer membrane cap (OMC).
(A) Within the periphery of the OMC, we modeled a two β-sheet protein that we identified as DotF (left). Although the resolution is lower in this portion of the map, several features of DotF fit well within the density (right). (B) DotF1 interacts only with Dis3 within the OMC. (C) The interactions that mediate the DotF1-Dis3 interaction contain several H-bonds and two salt bridges as indicated in the table. (D) DotF is structurally similar to proteins found in the periplasm of other large macromolecular complexes, such as GspC (type II secretion system) and PilP (type IV pilus).
Figure 3 with 4 supplements
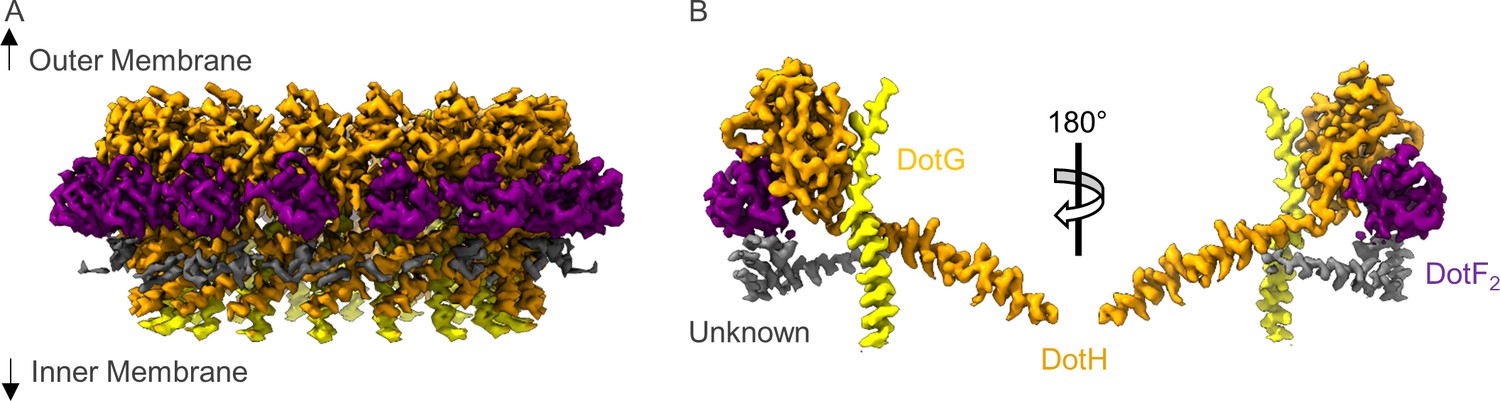
The asymmetric unit of the periplasmic ring (PR).
(A) The PR of the Dot/Icm type IV secretion system (T4SS) is comprised of at least four peptide chains. Three have been identified as DotG (yellow), DotH (orange), and DotF2 (purple). A fourth chain could not be identified and is shown in gray. (B) Within the asymmetric unit, we observe interactions between DotF2-DotH and DotH-DotG.
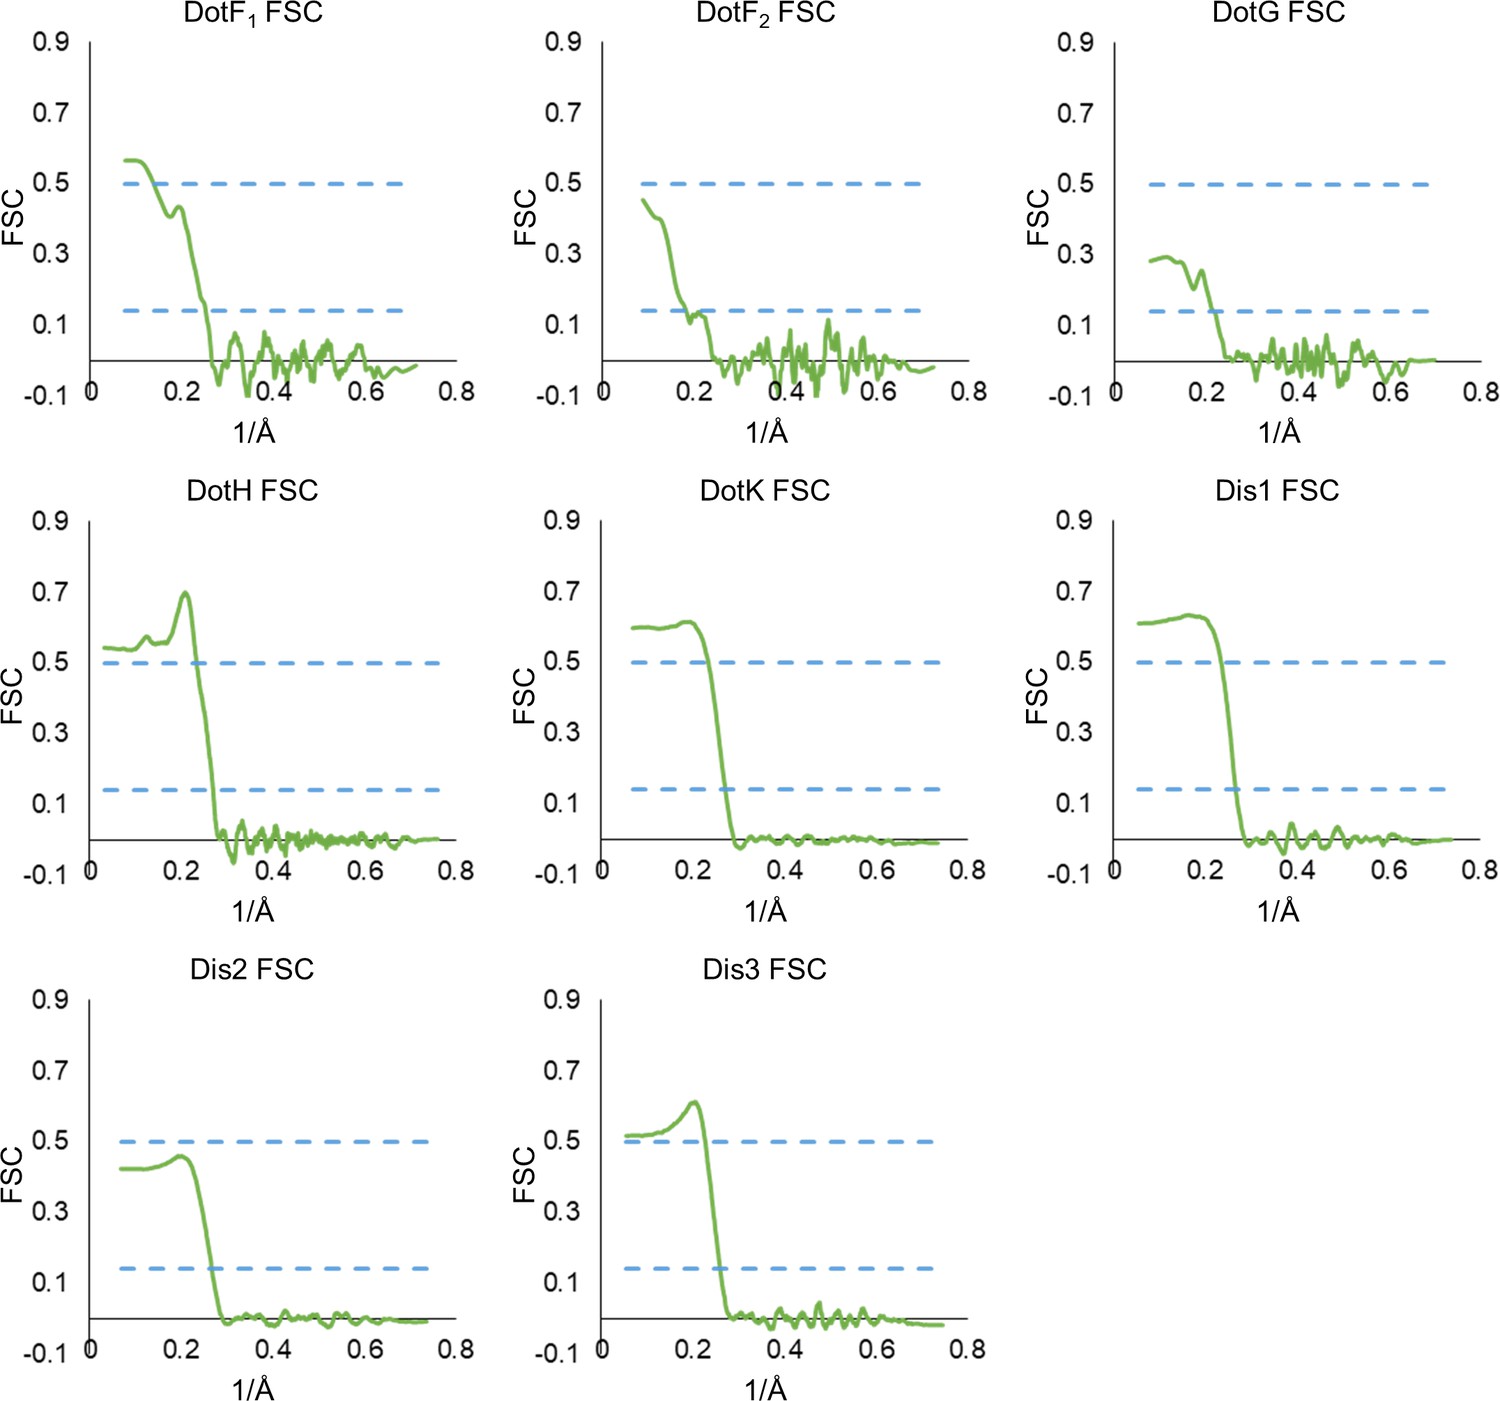
Figure 3—figure supplement 1
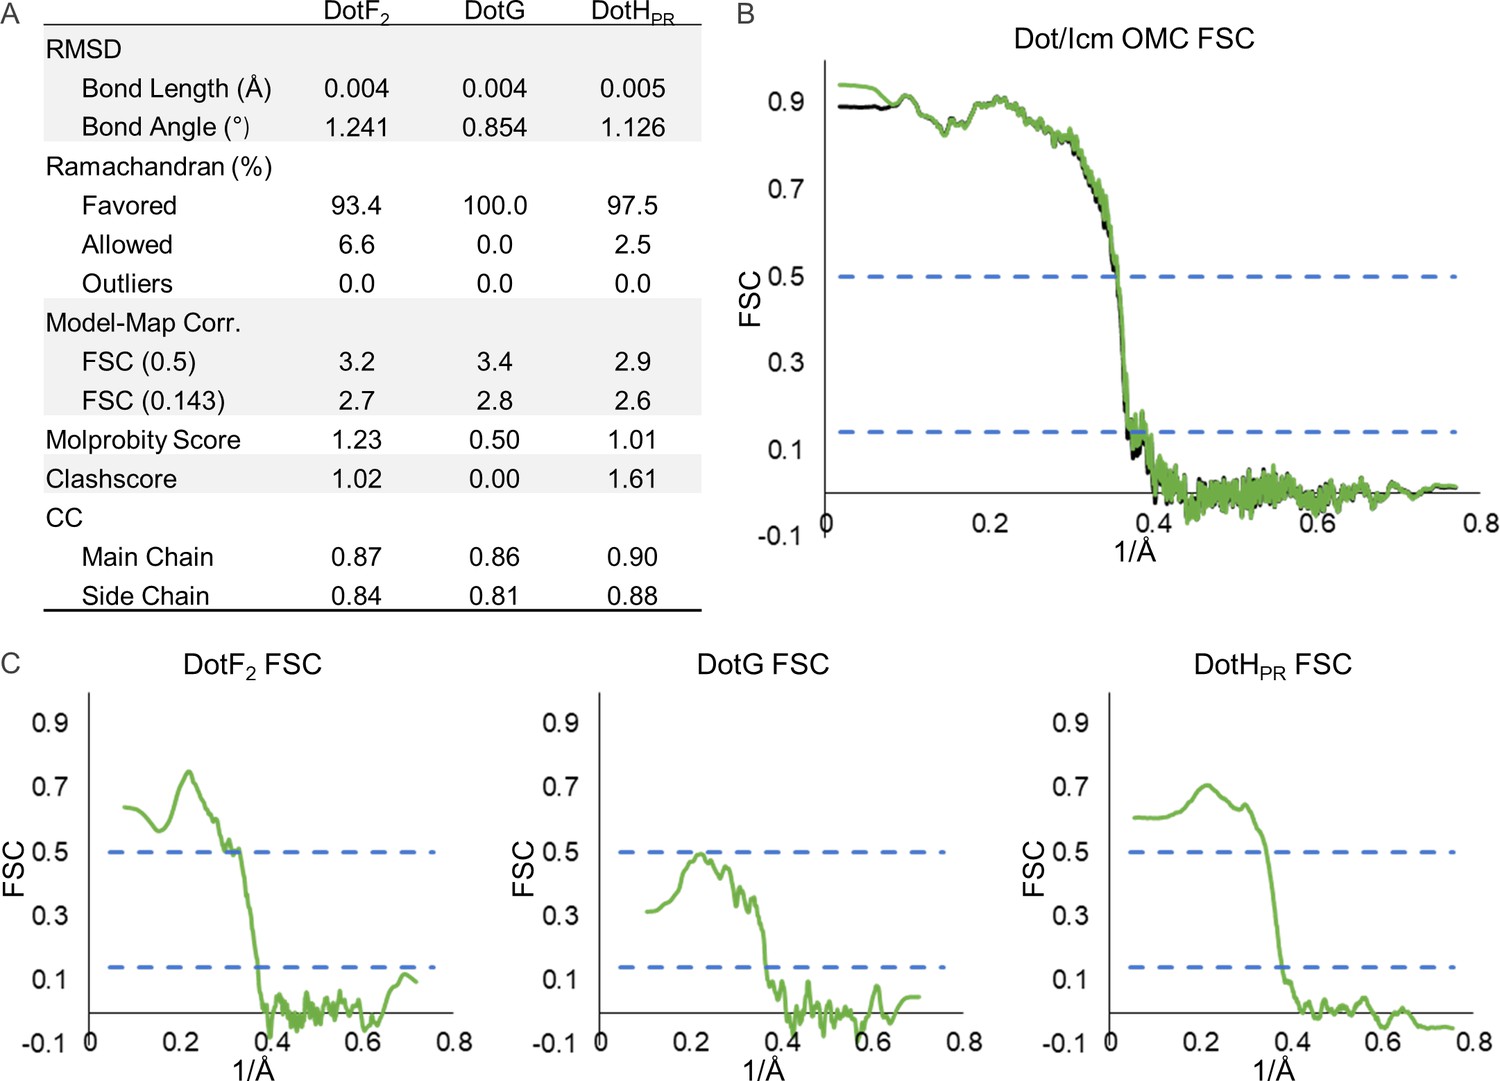
Model statistics for components of the periplasmic ring (PR).
(A) The refinement statistics for each identified component of the Dot/Icm type IV secretion system (T4SS) PR are shown in the table. (B) The model map correlation for the entire PR is shown with the masked data shown in green and the unmasked shown in black. (C) The fit of each model was also determined.
Figure 3—figure supplement 2
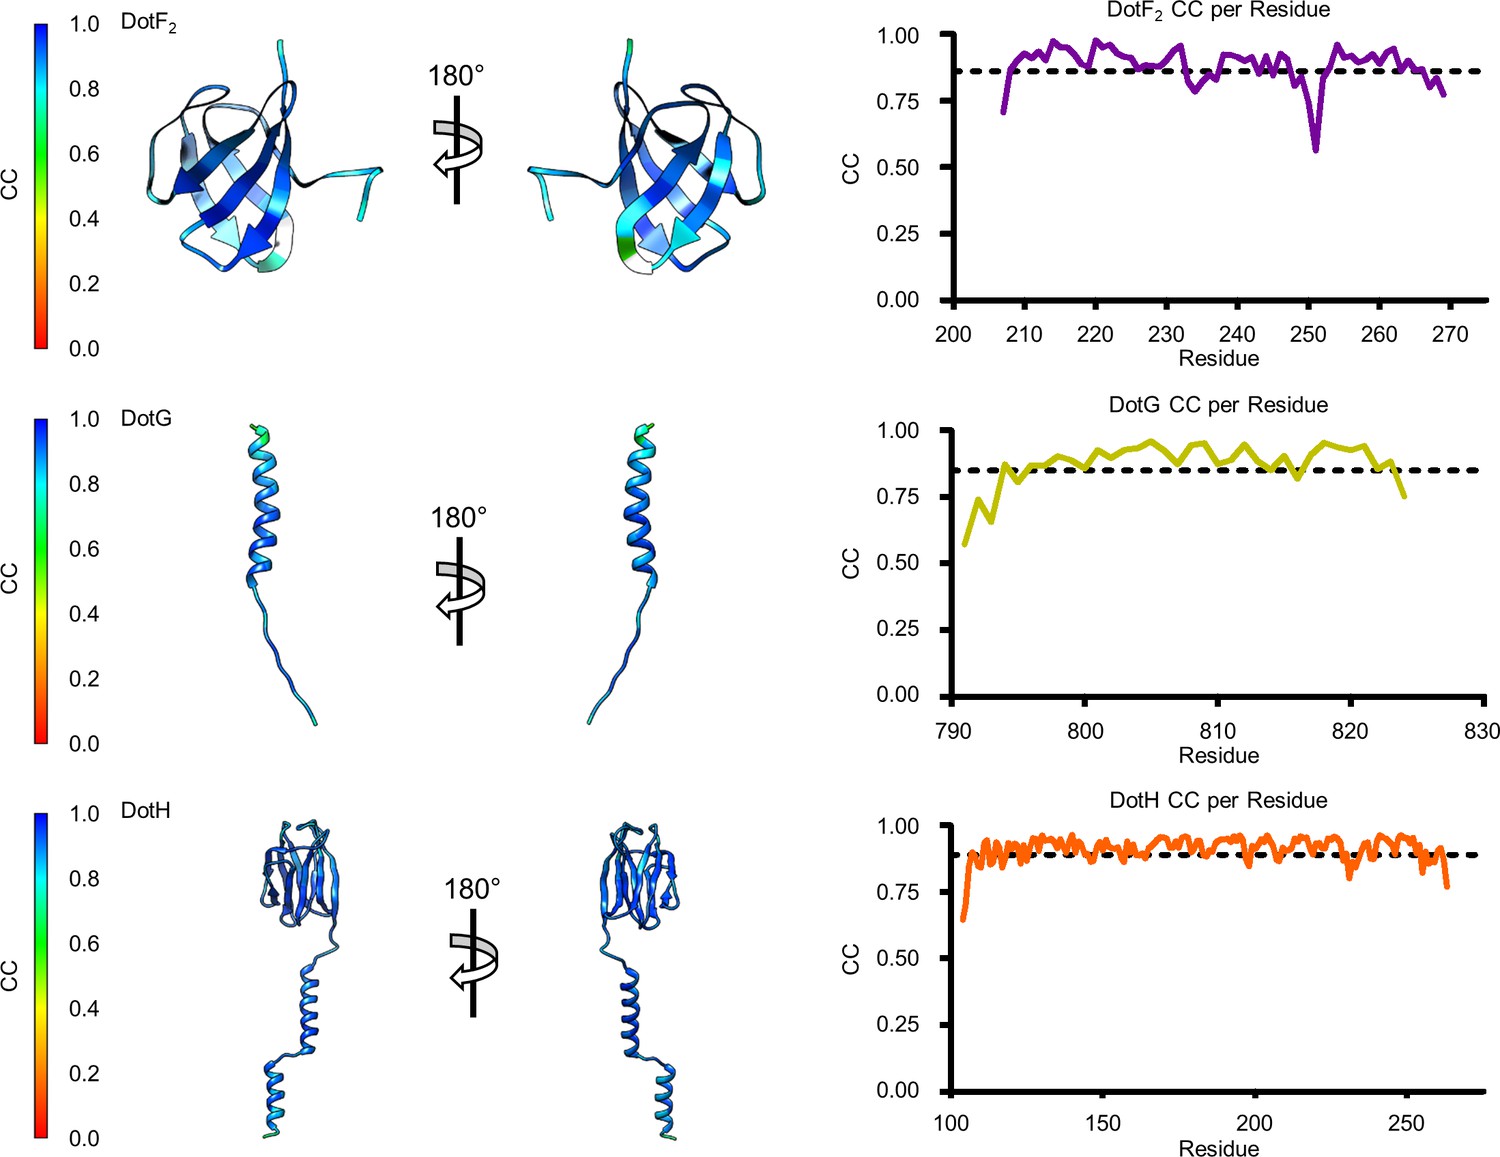
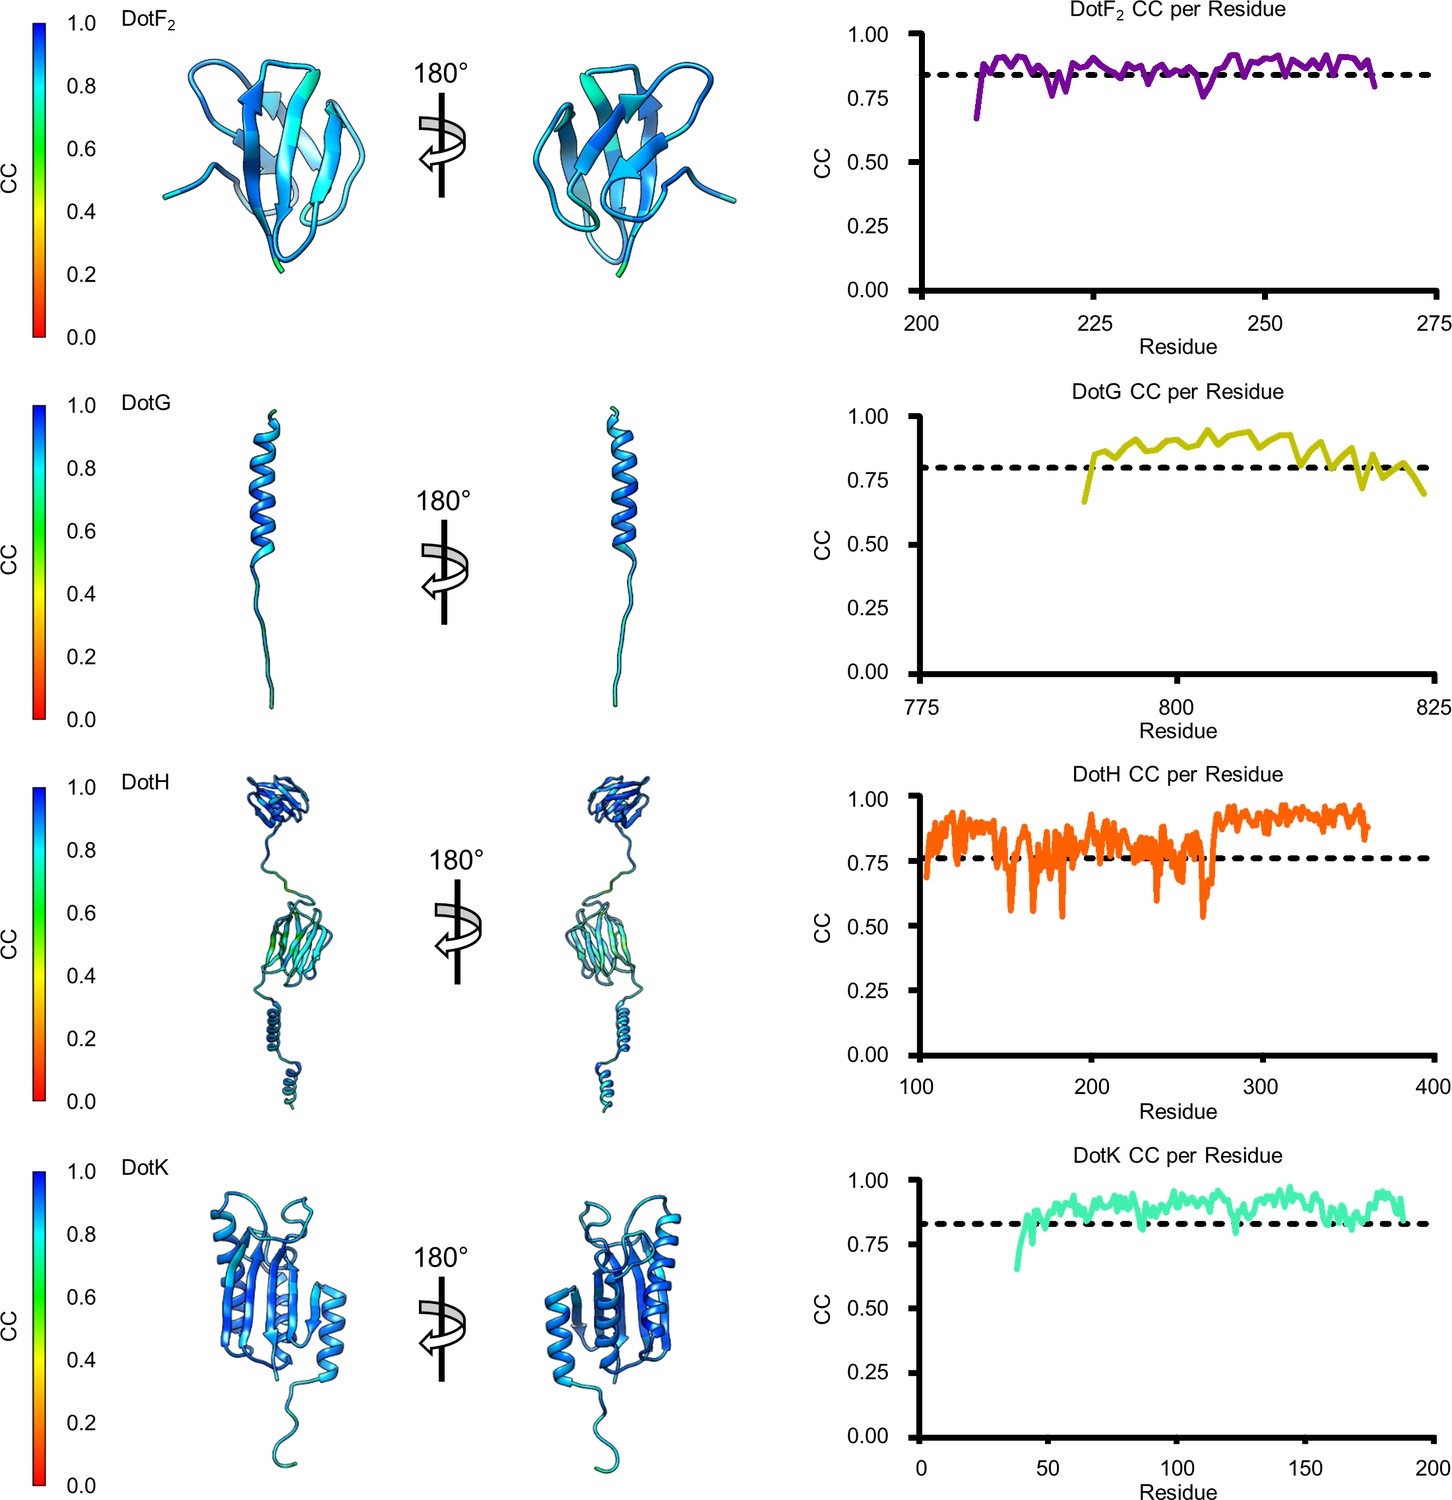
Model map correlation for identified components in the periplasmic ring (PR).
The quality of the model was interpreted using per residue correlation coefficients. The correlation of each residue is plotted by spectrum on each component (left). The correlation coefficient was also plotted against residue number (right). The average correlation coefficient per residue is indicated by the dashed line.
Figure 3—figure supplement 3

Organization of components within the periplasmic ring (PR).
(A) In the PR we have modeled portions of DotG and DotH, noting that the N-terminus of each protein is positioned on the inner membrane side of the PR and that the C-terminus of each protein is positioned on the outer membrane side of the PR. (B) The interaction between DotG and DotH spans two asymmetric units. The interactions between DotG and the first asymmetric unit (shown in orange) are shown in the left inset, and the interactions between DotG and the second asymmetric unit (shown in red) are shown in the right inset. (C) The structure of DotH consists of two distinct domains, one in the outer membrane cap (OMC) (DotHOMC) and one in the PR (DotHPR). Both domains show structural similarity to CagX (Helicobacter pylori) and VirB9 (Xanthomonas citri). (D) Though all three proteins are structurally homologous, the distance between the OMC and PR domains varies due to the length of the linker between them (shown in orange stripes). (E) Interactions between DotH and DotG within the PR are similar to those of VirB9/VirB10 and CagX/CagY.
Figure 3—figure supplement 4
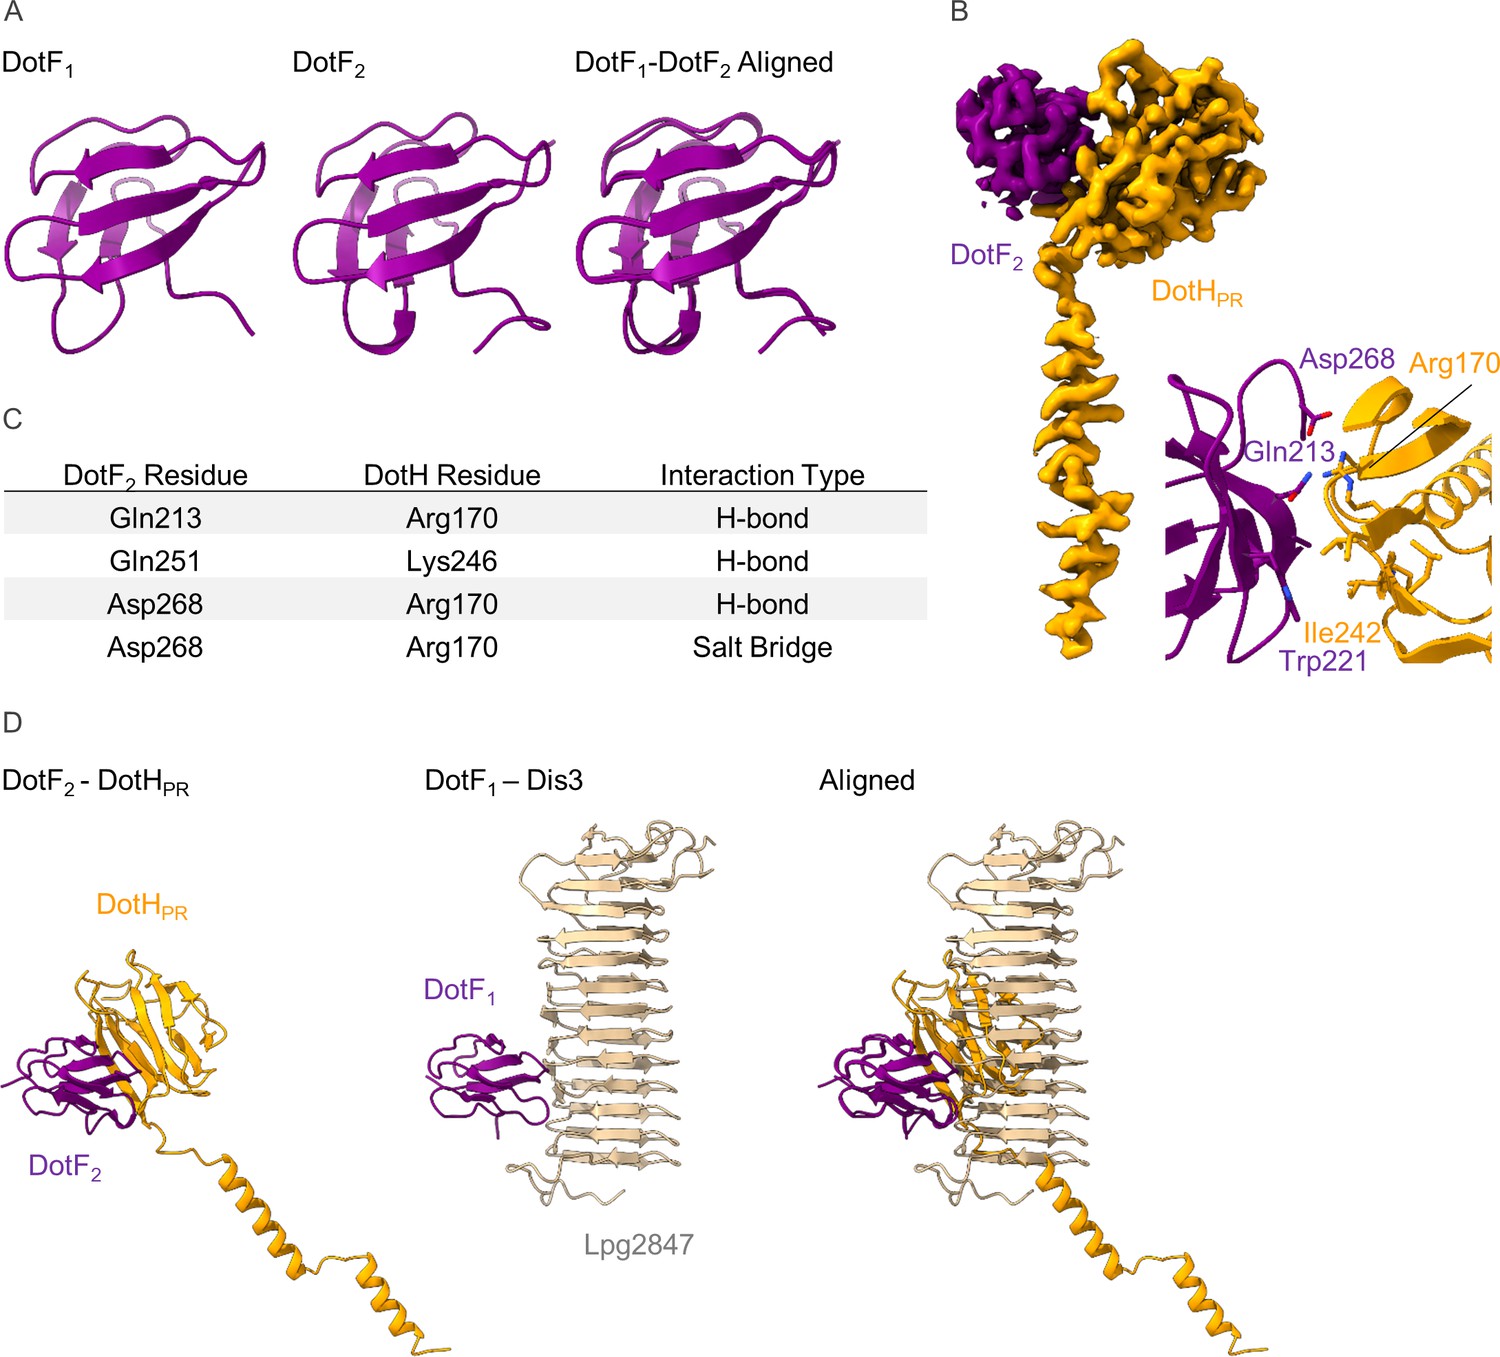
The structure of DotF2 in the periplasmic ring (PR).
(A) We have modeled a second DotF (DotF2) in the PR of the Dot/Icm type IV secretion system (T4SS) which is nearly identical to DotF1 modeled in the outer membrane cap (OMC). (B–C) DotF2 contacts one copy of DotH in the PR (B) with interactions that include hydrogen bonds and a salt bridge (C). The interactions observed between DotF2 and DotH use a similar surface to that of DotF1 and Dis3.
Figure 4 with 6 supplements

Organization of the DotH C-terminal domain located between the outer membrane cap (OMC) and periplasmic ring (PR).
(A) Within the asymmetric reconstruction of the Dot/Icm type IV secretion system (T4SS), we observe DotH (orange) in three separate places, the OMC (plane 1), the PR (plane 3), and the space in between the two (plane 2). (B) The number of copies of DotH in each plane differs. There are 13 symmetrical copies in the OMC (plane 1), 5 asymmetrical copies in the space between the OMC and PR (plane 2), and 18 symmetrical copies in the PR (plane 3).
Figure 4—figure supplement 1

Model map Fourier shell correlation (FSC) of each chain in the asymmetric reconstruction.
(A) The refinement statistics for each identified component of the Dot/Icm type IV secretion system (T4SS) in the asymmetric reconstruction are shown in the table. (B) The model map correlation for the outer membrane cap (OMC) and periplasmic ring (PR) within the C1 reconstruction is shown with the masked data shown in green and the unmasked shown in black. (C) The fit of each model was also determined.
Figure 4—figure supplement 2
Model map Fourier shell correlation (FSC) of each chain in the asymmetric reconstruction continued.
The model map correlation of each model within the outer membrane cap (OMC) and periplasmic ring (PR) that was reconstructed using the asymmetric map.
Figure 4—figure supplement 3

Model map correlation for some of the identified components in the C1 reconstruction.
The quality of the model was interpreted using per residue correlation coefficients. The correlation of each residue is plotted by spectrum on each component (left). The correlation coefficient was also plotted against residue number (right). The average correlation coefficient per residue is indicated by the dashed line.
Figure 4—figure supplement 4
Model map correlation for some of the identified components in the C1 reconstruction.
The quality of the model was interpreted using per residue correlation coefficients. The correlation of each residue is plotted by spectrum on each component (left). The correlation coefficient was also plotted against residue number (right). The average correlation coefficient per residue is indicated by the dashed line.
Figure 4—figure supplement 5
Model map correlation for some of the identified components in the C1 reconstruction.
The quality of the model was interpreted using per residue correlation coefficients. The correlation of each residue is plotted by spectrum on each component (left). The correlation coefficient was also plotted against residue number (right). The average correlation coefficient per residue is indicated by the dashed line.
Figure 4—figure supplement 6
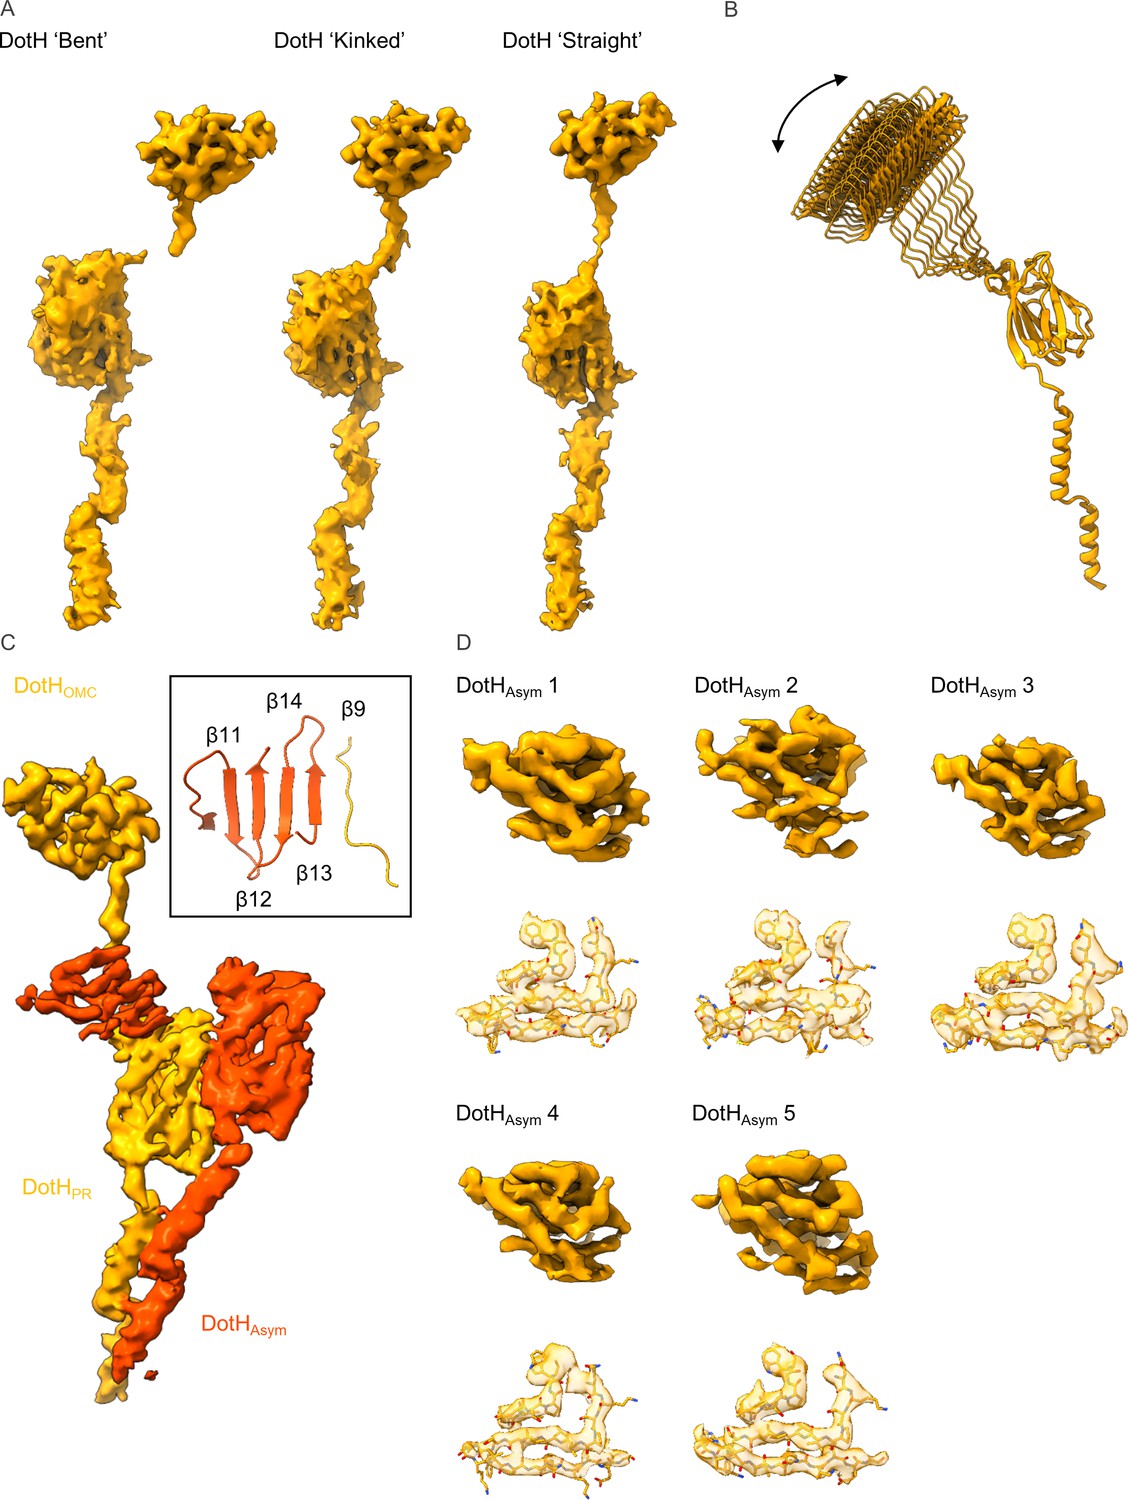
Variation among copies of DotH.
(A) The density that is observed for the DotH linker varies depending on the position of DotH within the outer membrane cap (OMC). At the extreme ends of the range of flexibility are the ‘bent’ (left) and ‘straight’ forms with varying degrees of the ‘kinked’ form (center) observed between the two extremes. (B) The flexibility within the linker allows for differential placement of DotH within the OMC as compared to the periplasmic ring (PR). (C) The five copies of DotHAsym (dark orange) utilize the linker from an adjacent DotH molecule (orange) as a β-strand in one of two β-sheets. (D) The resolution of the five copies of DotHAsym varies depending on where it is positioned within the map. However, landmark residues are observed fitting well into the density in all five copies.
Figure 5 with 1 supplement
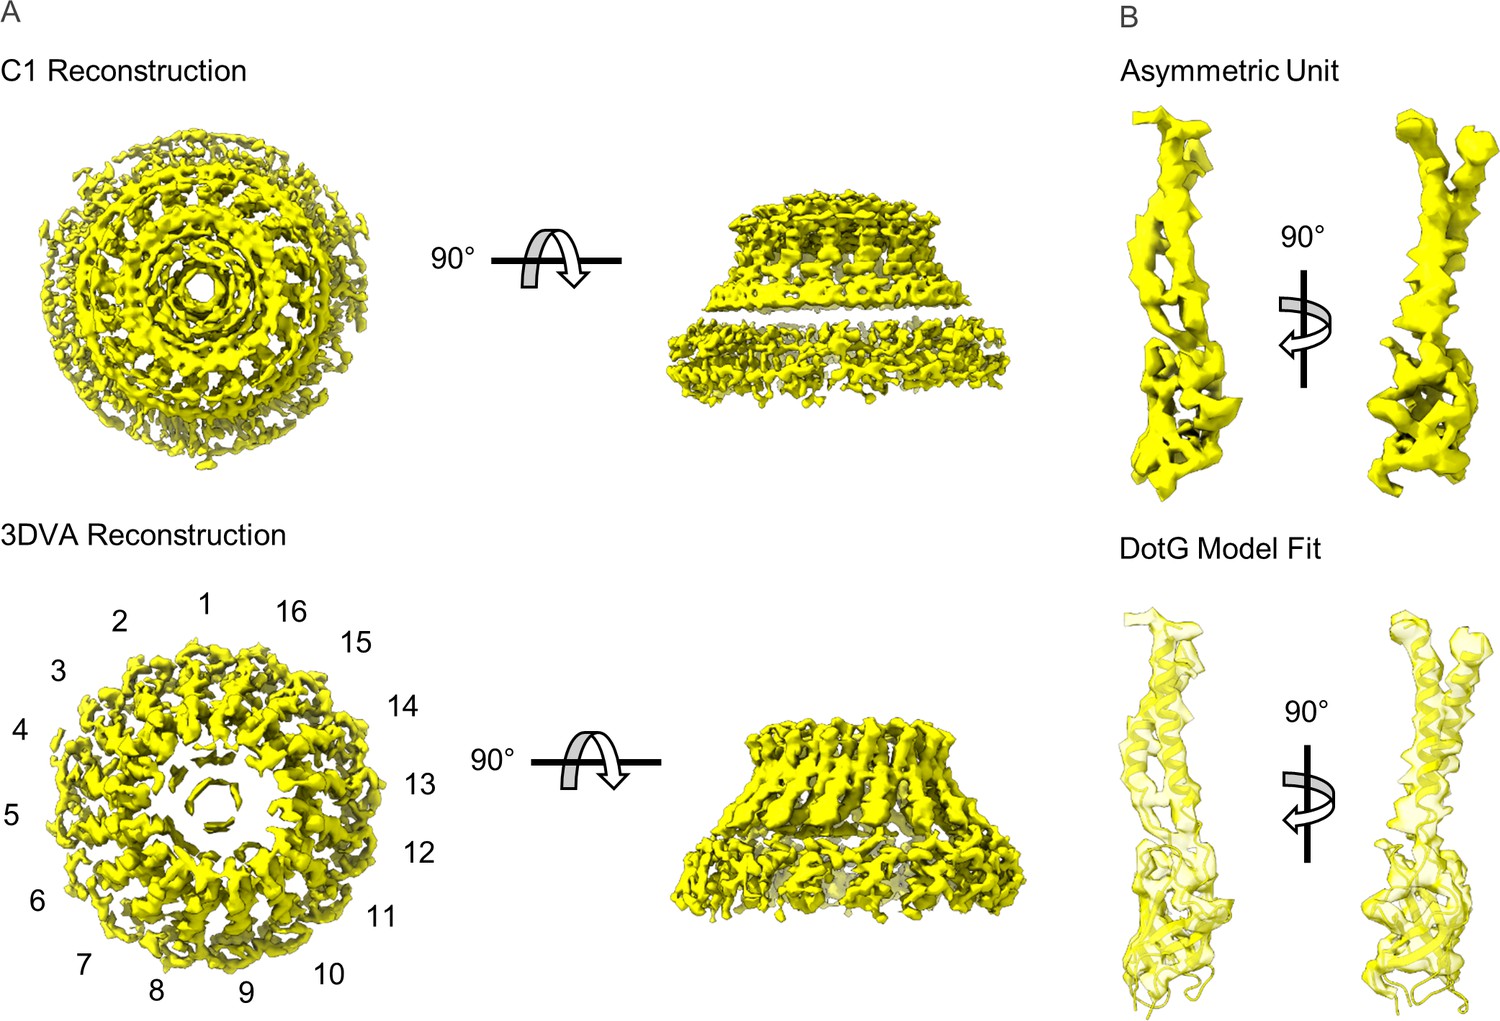
Modeling DotG within the ‘dome’ density.
(A) The ‘dome’ density located in the center of the outer membrane cap (OMC) was uninterpretable in the C1 reconstruction (top), likely due to structural heterogeneity. The density is considerably improved after 3D variability analysis with an apparent 16-fold symmetry observed about the middle of the structure (bottom). (B) The density within the asymmetric unit of the dome contains similar structural features seen in VirB10 homologs (top). A model of the DotG C-terminus was constructed in Swiss Model which fits into this density after refinement (bottom).
Figure 5—figure supplement 1
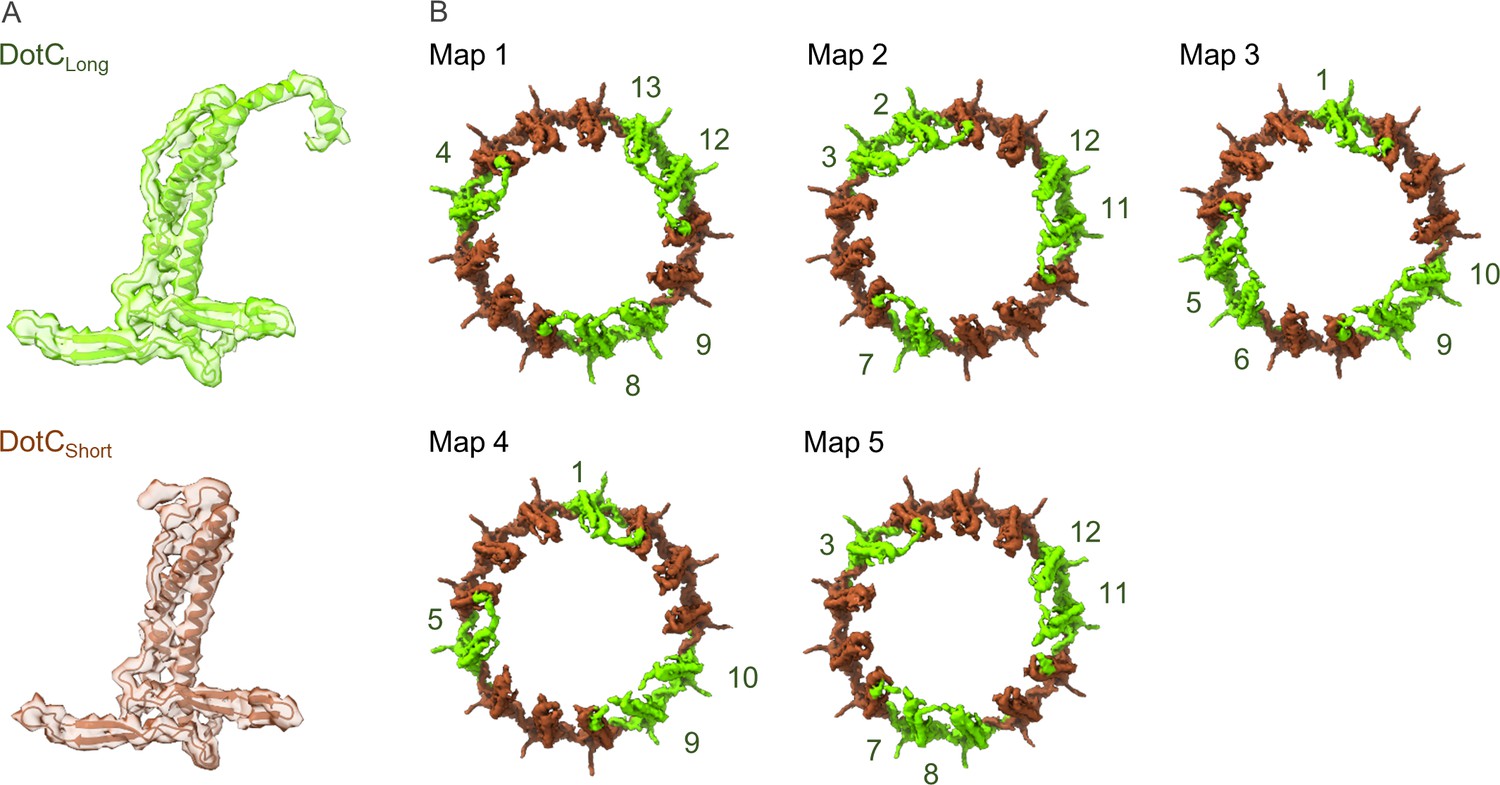
Arrangement of the DotC N-terminus in the maps reconstructed using 3D variability analysis.
(A) Two DotC were observed in the maps that were reconstructed during 3D variability analysis, one which contains an N-terminal extension (DotCLong) and one which does not (DotCshort). (B) The placement of these C-terminal domains is periodic within the maps, occurring every two to three asymmetric units.
Videos
Video 1
Positions of the DotH N-terminal and C-terminal domains within the asymmetric reconstruction of the Dot/Icm type IV secretion system (T4SS).
Within the asymmetric reconstruction of the Dot/Icm T4SS we observe DotH (colored in orange) in three distinct portions: the outer membrane cap (OMC), the periplasmic ring (PR), and the asymmetric region between the OMC and PR. The region of DotH observed in each portion varies with the N-terminal domain observed only in the PR and the C-terminal domain observed in the OMC and the asymmetric region. The number of copies of DotH also varies by position with 18 copies of the N-terminal domain observed in the PR, 5 copies of the C-terminal domain observed in the asymmetric region, and 13 copies of the C-terminal domain observed in the OMC.
Video 2
The extent to which the DotC N-terminal extension varies among maps reconstructed using 3D variability analysis.
Within the five maps that were used to resolve the dome region in the outer membrane cap (OMC) we note that the extent to which the DotC N-terminus varies considerably. The extension of DotC is only strongly observed in four or five copies of DotC in each map.
Video 3
Positions of portions of DotG found within the map 1 of the 3D variability reconstruction of the Dot/Icm type IV secretion system (T4SS).
Within the dome density we observe 16 helical protrusions that contain a fold similar to that of VirB10. These 16 folds are positioned directly above the 18 helices that we have identified as DotG in the periplasmic ring (PR). It is suspected that the heterogeneity of DotG within the disk arises from the sparse contacts observed between DotG and DotC along with a flexible linker that appears to connect the two segments of DotG shown here.
Video 4
Maps reconstructed using 3D variability analysis of the Dot/Icm type IV secretion system (T4SS).
Using 3D variability analysis, we reconstructed a total of five maps that displayed differences in the way the outer membrane cap (OMC) and periplasmic ring (PR) were positioned. These maps led to the identification of an approximate 16-fold symmetry about the center of the dome positioned within the OMC.
Tables
Table 1
Map reconstruction and model refinement.
| OMC | PR | OMC/PR | |
|---|---|---|---|
| EMDB accession codes | 24005 | 24006 | 24004 |
| Data collection and processing | |||
| Magnification | 81,000× | 81,000× | 81,000× |
| Voltage (kV) | 300 | 300 | 300 |
| Total electron dose (e-/Å2) | 50 | 50 | 50 |
| Defocus range (µm) | –1.5 to –2.1 | –1.5 to –2.1 | –1.5 to –2.1 |
| Pixel size (Å) | 1.1 | 1.1 | 1.1 |
| Processing software | CryoSPARC,Relion | CryoSPARC, Relion | CryoSPARC,Relion |
| Initial particles (number) | 1,389,426 | 1,389,426 | 1,389,426 |
| Final particles (number) | 84,886 | 43,907 | 136,818 |
| Map sharpening B-factor | –99.2 | –82.8 | –115 |
| Map resolution (Å) | 2.8 | 2.8 | 2.8 |
| FSC threshold | 0.143 | 0.143 | 0.143 |
| Model refinement and validation | |||
| Starting models | 6 × 62 | 6 × 64 | 6 × 65 |
| FSC | |||
| 0.5 | 2.8 | 2.8 | 4.0 |
| 0.143 | 2.7 | 2.7 | 3.8 |
| Model residues | |||
| Total | 17,264 | 5490 | 23.286 |
| DotC | 28–35, 60–161, 173–268 | – | 28–35, 57–161, 173–272 |
| DotD1 | 24–162 | – | 23–162 |
| DotD2 | 25–160 | – | 24–160 |
| DotF1 | 208–266 | 208–266 | |
| DotF2 | – | 207–269 | 207–269 |
| DotG | – | 791–824 | 791–824 |
| DotH | 271–361 | 104–263 | 104–361 |
| DotK | 40–188 | – | 38–188 |
| Dis1 | 42–65, 88–234 | – | 42–65, 88–236 |
| Dis2 | 40–115 | – | 39–116 |
| Dis3 | 29–320 | – | 29–320 |
| Unknown OMC | 122–130 | – | 1–54, 122–130 |
| Unknown PR | – | 1–38, 70–79 | 1–38, 70–79 |
| Clashscore | 3.04 | 0.67 | 5.80 |
| Molprobity | 1.42 | 0.85 | 2.22 |
| Bonds | |||
| Lengths (Å) | 0.003 | 0.004 | 0.012 |
| Angles (°) | 0.748 | 0.785 | 1.822 |
| Ramachandran (%) | |||
| Favored | 95.3 | 97.3 | 94.5 |
| Allowed | 4.7 | 2.7 | 5.5 |
| Outliers | 0.0 | 0.0 | 0.0 |
| B-factors | 55.3 | 69.7 | 165.0 |
| PDB | 7MUD | 7MUE | 7MUC |
Table 2
Dot/Icm proteins in isolated complex sample.
| Spectral counts† | |||||
|---|---|---|---|---|---|
| Identified proteins | Gene number* | Prep 1 | Prep 2 | Prep 3 | Prep 4 |
| DotG ‡ | Q5ZYC1 | 112 | 114 | 195 | 150 |
| DotF | Q5ZYC0 | 94 | 69 | 101 | 107 |
| DotA | Q5ZS33 | 38 | 65 | 60 | 69 |
| Dis3 | Q5ZRN3 | 22 | 24 | 41 | 87 |
| DotO | Q5ZYB6 | 37 | 38 | 47 | 27 |
| DotH | Q5ZYC2 | 28 | 19 | 28 | 47 |
| IcmF | Q5ZYB4 | 15 | 18 | 36 | 38 |
| IcmX | Q5ZS30 | 19 | 13 | 28 | 33 |
| DotL | Q5ZYC6 | 10 | 26 | 20 | 32 |
| DotD | Q5ZS45 | 11 | 9 | 14 | 33 |
| DotC | Q5ZS44 | 9 | 11 | 16 | 22 |
| DotB | Q5ZS43 | 16 | 11 | 7 | 12 |
| Dis1 | Q5ZXS4 | 6 | 4 | 16 | 19 |
| DotY | Q5ZYR7 | 4 | 9 | 4 | 10 |
| DotM | Q5ZYC7 | 2 | 14 | 3 | 9 |
| DotK | Q5ZYC5 | 2 | 6 | 10 | 9 |
| IcmW | Q5ZS31 | 5 | 7 | 5 | 8 |
| DotZ | Q5ZV91 | 1 | 8 | 3 | 9 |
| DotN | Q5ZYB7 | 2 | 6 | 4 | 7 |
| Dis2 | Q5ZXA9 | 2 | 4 | 3 | 5 |
| DotI | Q5ZYC3 | 1 | 3 | 5 | 3 |
| IcmV | Q5ZS32 | 1 | 1 | 2 | 7 |
| IcmT | Q5ZYD1 | 1 | 1 | 3 | 1 |
| IcmS | Q5ZYD0 | 4 | 1 | 2 | |
-
*
UniProtKB Accession Number.
-
†
Proteins were identified by searching theMS/MS data against L. pneumophila(UniProt; 2930 entries) using Proteome Discoverer (v2.1, Thermo Scientific). Search parametersincluded MS1 masstolerance of 10 ppm and fragment tolerance of 0.1 Da. False discovery rate (FDR) was determined using Percolator and proteins/peptides with a FDR of ≤1% were retained for further analysis. Complete results are in Supplementary file 1 in supplementary material.
-
‡
Componentsidentified in thisstructure are in bold.
Table 3
Three-dimensional variability analysis (3DVA) map reconstruction and model refinement.
| Map 1 | Map 2 | Map 3 | Map 4 | Map 5 | |
|---|---|---|---|---|---|
| EMDB accession codes | 24018 | 24020 | 24023 | 24024 | 24026 |
| Data collection and processing | |||||
| Magnification | 81,000× | 81,000× | 81,000× | 81,000× | 81,000× |
| Voltage (kV) | 300 | 300 | 300 | 300 | 300 |
| Total electron dose (e-/Å2) | 50 | 50 | 50 | 50 | 50 |
| Defocus range (µm) | –1.5 to –2.1 | –1.5 to –2.1 | –1.5 to –2.1 | –1.5 to –2.1 | –1.5 to –2.1 |
| Pixel size (Å) | 1.1 | 1.1 | 1.1 | 1.1 | 1.1 |
| Processing software | CryoSPARC | CryoSPARC | CryoSPARC | CryoSPARC | CryoSPARC |
| Initial particles (number) | 303,447 | 303,447 | 303,447 | 303,447 | 303,447 |
| Final particles (number) | 79,720 | 75,959 | 64,698 | 42,013 | 41,057 |
| Map sharpening B-factor | –88.5 | –85.4 | –85,8 | –84.4 | –80.1 |
| Map resolution (Å) | 4.6 | 4.6 | 4.6 | 4.6 | 4.6 |
| FSC threshold | 0.143 | 0.143 | 0.143 | 0.143 | 0.143 |
| Model refinement and validation | |||||
| Starting models | 7MUC | 7MUC | 7MUC | 7MUC | 7MUC |
| FSC | |||||
| 0.5 | 4.6 | 4.6 | 4.6 | 4.8 | 4.8 |
| 0.143 | 4.5 | 4.5 | 4.5 | 4.5 | 4.5 |
| Model residues | |||||
| Total | 25,121 | ||||
| DotC | 59–267 | ||||
| DotD1 | 23–162 | ||||
| DotD2 | 24–160 | ||||
| DotF1 | 208–266 | ||||
| DotF2 | 207–269 | ||||
| DotG | 791–824, 862–978, 999–1046 | ||||
| DotH | 104–361 | ||||
| DotK | 38–188 | ||||
| Lpg0657 | 42–65, 88–236 | ||||
| Lpg0823 | 39–116 | ||||
| Lpg2847 | 113–320 | ||||
| Unknown OMC | 122–130 | ||||
| Unknown PR | 1–38, 70–79 | ||||
| Clashscore | 9.55 | 9.64 | 15.53 | 9.47 | 9.85 |
| Molprobity | 2.80 | 2.77 | 2.76 | 2.68 | 2.73 |
| Bonds | |||||
| Lengths (Å) | 0.006 | 0.005 | 0.003 | 0.004 | 0.004 |
| Angles (°) | 0.798 | 0.765 | 0.540 | 0.702 | 0.711 |
| Ramachandran (%) | |||||
| Favored | 94.0 | 94.2 | 94.7 | 95.2 | 94.7 |
| Allowed | 6.0 | 5.8 | 5.3 | 4.8 | 5.3 |
| Outliers | 0.0 | 0.0 | 0.0 | 0.0 | 0.0 |
| B-factors | 147.96 | 154.48 | 146.18 | 145.88 | 145.07 |
| PDB | 7MUQ | 7MUS | 7MUV | 7MUW | 7MUY |
Key resources table
| Reagent type (species) or resource | Designation | Source or reference | Identifiers | Additional information |
|---|---|---|---|---|
| Strain, strain background (Legionella pneumophila) | Lp02; WT | PMID:23717549 | ||
| Software, algorithm | MotionCor2 | PMID:28250466 | ||
| Software, algorithm | CTFFind4 | PMID:26278980 | ||
| Software, algorithm | cryoSPARC | PMID:28165473PMID:33582281 | ||
| Software, algorithm | RELION | PMID:27685097PMID:30412051 | ||
| Software, algorithm | Coot | PMID:20383002 | ||
| Software, algorithm | UCSF Chimera | PMID:15264254 PMID:29340616 | ||
| Software, algorithm | PHENIX | PMID:29872004 | ||
| Software, algorithm | DALI server | PMID:31263867PMID:31606894 |
Additional files
Download links
A two-part list of links to download the article, or parts of the article, in various formats.
Downloads (link to download the article as PDF)
Open citations (links to open the citations from this article in various online reference manager services)
Cite this article (links to download the citations from this article in formats compatible with various reference manager tools)
Cryo-EM reveals new species-specific proteins and symmetry elements in the Legionella pneumophila Dot/Icm T4SS
eLife 10:e70427.
https://doi.org/10.7554/eLife.70427


