A subset of CB002 xanthine analogs bypass p53-signaling to restore a p53 transcriptome and target an S-phase cell cycle checkpoint in tumors with mutated-p53
- Laboratory of Translational Oncology and Experimental Cancer Therapeutics, The Warren Alpert Medical School, Brown University, United States
- The Joint Program in Cancer Biology, Brown University and the Lifespan Health System, United States
- Department of Pathology and Laboratory Medicine, The Warren Alpert Medical School, Brown University, United States
- Molecular Therapeutics Program, Fox Chase Cancer Center, United States
- Cancer Center at Brown University, The Warren Alpert Medical School, Brown University, United States
- Department of Pediatrics, The Warren Alpert Medical School, Brown University, United States
- COBRE Center for Cancer Research Development, Proteomics Core Facility, Rhode Island Hospital, United States
- Hematology-Oncology Division, Department of Medicine, Rhode Island Hospital and Brown University, United States
Figures
Figure 1 with 2 supplements
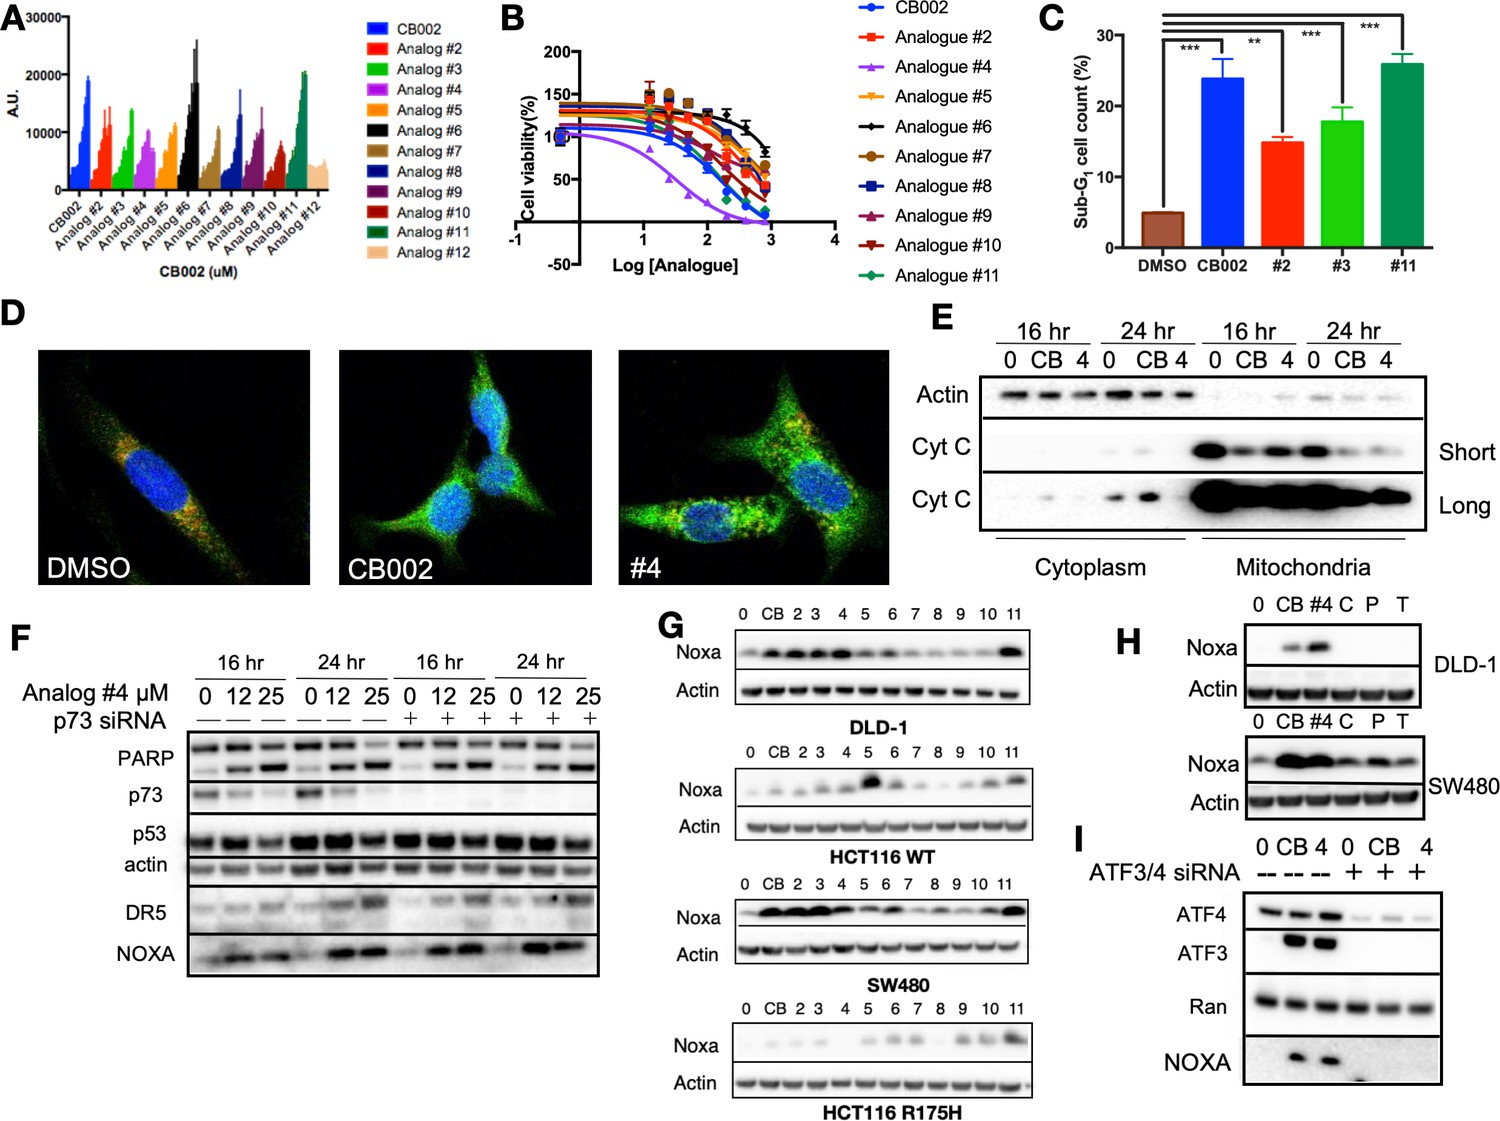
CB002 and structural analogs restore the p53 pathway, whereas other xanthines caffeine, pentoxifylline, and theophylline do not.
CB002 structural analogs activate p53 reporter gene activity in SW480 cells in a dose-dependent manner (6 hr) (A). Therapeutic indices for CB002-structural analogs were determined in SW480 cells (48 hr) (B). Propidium iodide cell cycle analysis was performed to determine sub-G1 population at 48 hr of treatment with CB002-analogs at 100 μM in SW480 cells. Two-way ANOVA, p<0.05 (C). CB002-analog #4 restores the p53 pathway in SW480 cells, resulting in PARP cleavage independently of p73 (D). Immunofluorescence staining of Cyt-C (green), Tom20 (red) DAPI (blue) in SW480 treated as indicated for 48 hr (E). Noxa protein expression induced by CB002-analogs in DLD-1, SW480, HCT116, and HCT116 p53(R175H) colorectal cancer cells (24 hr) (F). p53-pathway restoring compounds have unique properties compared to other xanthine derivatives in their ability to induce Noxa expression, 24 hr treatment in DLD-1 cells (G). Xanthine derivatives CB002 and its analog induce Noxa expression but not caffeine, pentoxifylline, and theophylline at 24 hr in DLD-1 and SW480 cells (H). ATF3/4 mediate Noxa induction (I). Caffeine (C), Pentoxifylline (P), and Theophylline (T). Figures (A)–(C) were performed as three biological replicates. Experiments from figures (D)–(I) were performed at least twice and a representation of one is shown.
Figure 1—figure supplement 1
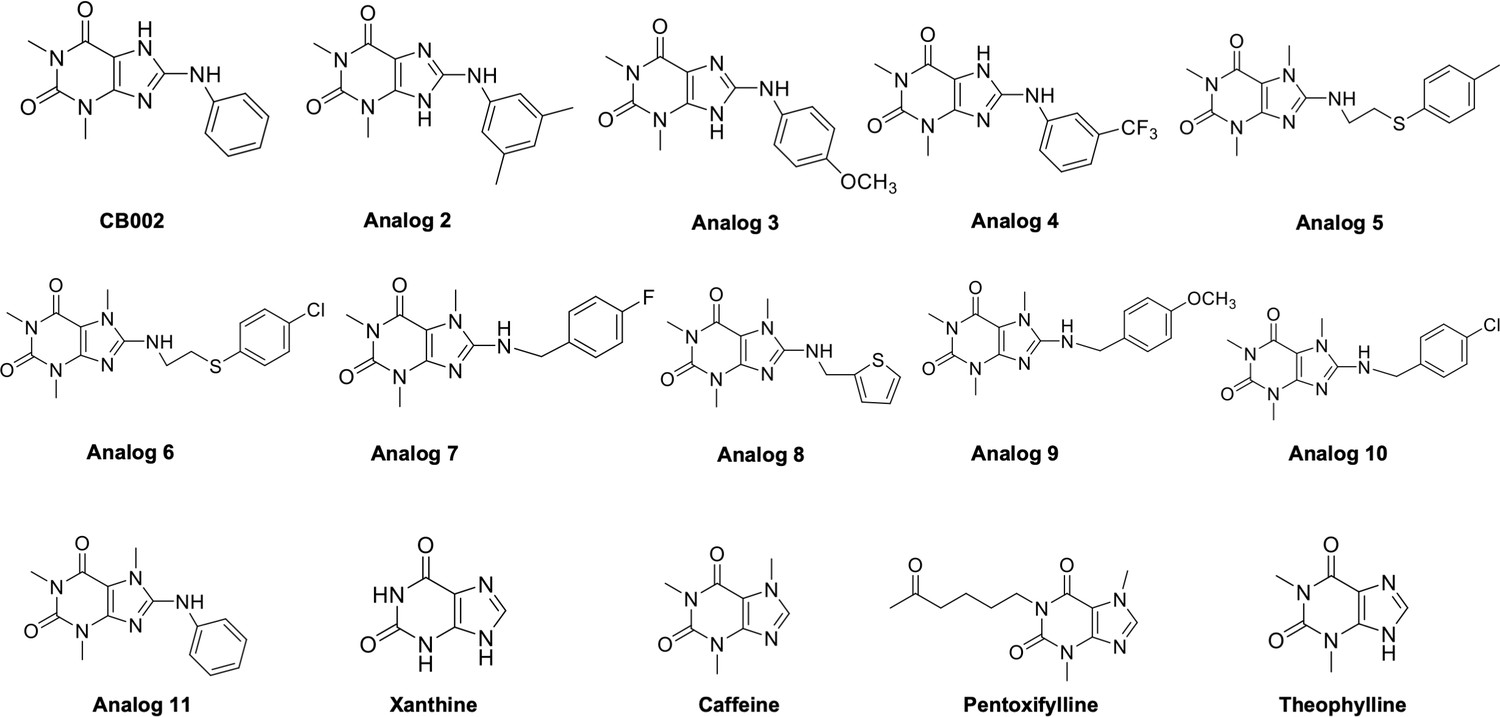
CB002 and its analog #2–#11 chemical structures.
Identified family of CB002 and its analog are xanthine derivates.
Figure 1—figure supplement 2
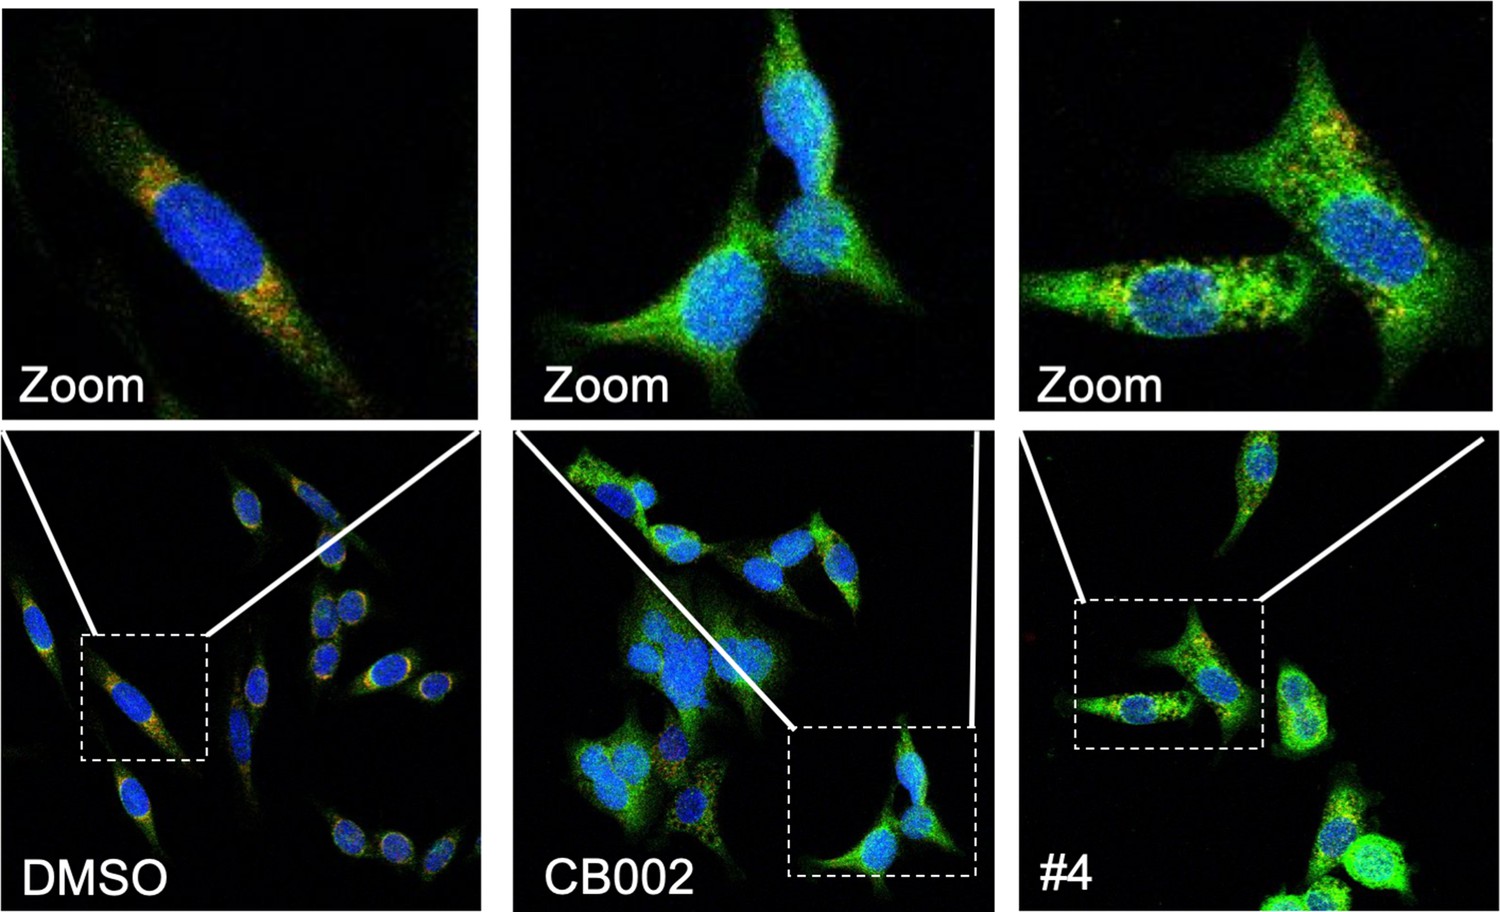
CB002 and structural analog #4 induce apoptosis.
Immunofluorescence staining of Cyt-C (green), Tom20 (red) DAPI (blue) in SW480 treated as indicated for 48 hr. Zoom images shown are indicated by the white box from each frame.
Figure 2 with 11 supplements
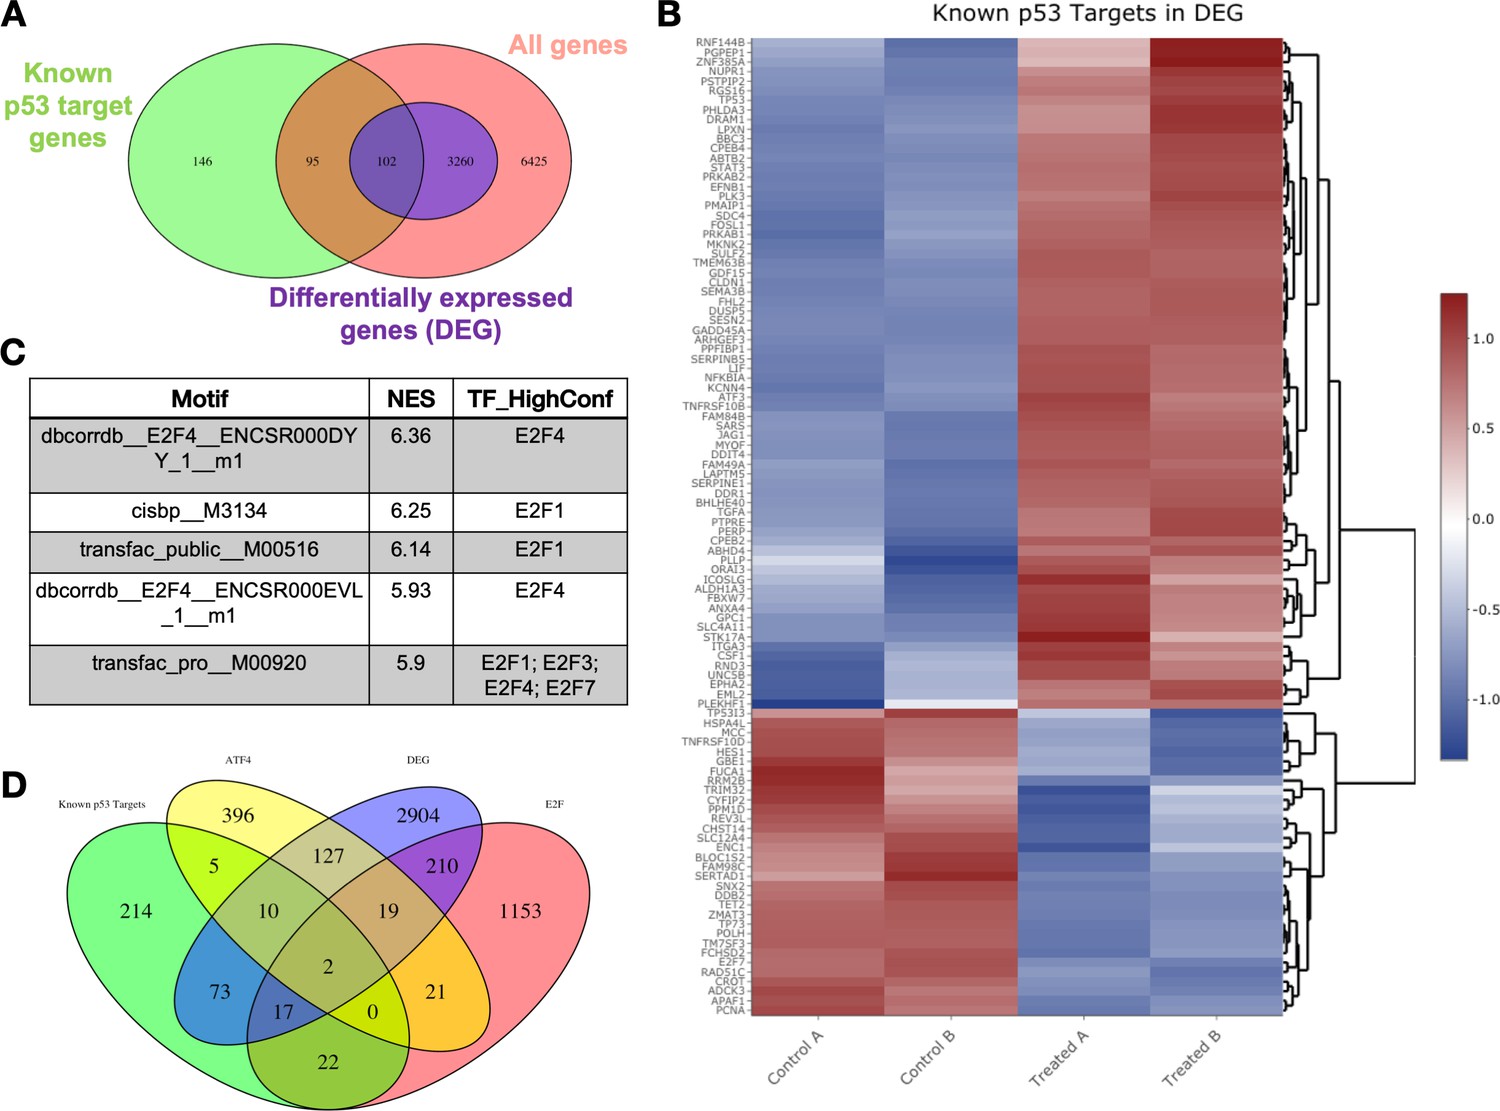
Transcriptomic pathway analysis of analog #4 reveals differentially expressed genes (DEGs) in tumor cells with mutant p53.
SW480 cells were treated with analog #4 for 12 hr. Three-way Venn diagram of all genes tested that met the low expression cutoff (pink), DEGs with an FDR<0.05 (purple), and the known p53 target gene set (A). Heatmap of DEGs that overlapped with the known p53 target gene set (B). Predictive transcription factor analysis according to direct binding motif was performed for all the DEGs (total genes 3362) (C). Four-way Venn diagram of DEGs with an FDR<0.05 (purple), and the known p53 target gene set from Table S3 of Fischer, 2017 (green), ATF4 gene set (yellow), and E2F gene set (pink) (D).
-
Figure 2—source data 1
Gene expression values of DMSO vehicle control and analog #4 SW480 treated cells at 12 hr samples analysed by microarray Affymetrix Human Gene 2.0-ST array probe set.
- https://cdn.elifesciences.org/articles/70429/elife-70429-fig2-data1-v1.xlsx
-
Figure 2—source data 2
Gene names from Figure 2A–B Venn diagram data sets containing all genes without the FDR of <0.05 filter, differentially expressed genes (DEG) with FDR of <0.05 filter and reference p53 data set from Fischer, 2017, Table S3.
- https://cdn.elifesciences.org/articles/70429/elife-70429-fig2-data2-v1.xlsx
Figure 2—figure supplement 1

Transcriptomic analysis quality control principal component (PC) plots and false discovery rate (FDR) bar graph.
PC1 accounts for the highest variability factor being the differences between control and analog #4 treatment. Statistically significant changes in gene expression were determined as FDR<0.05.
Figure 2—figure supplement 2
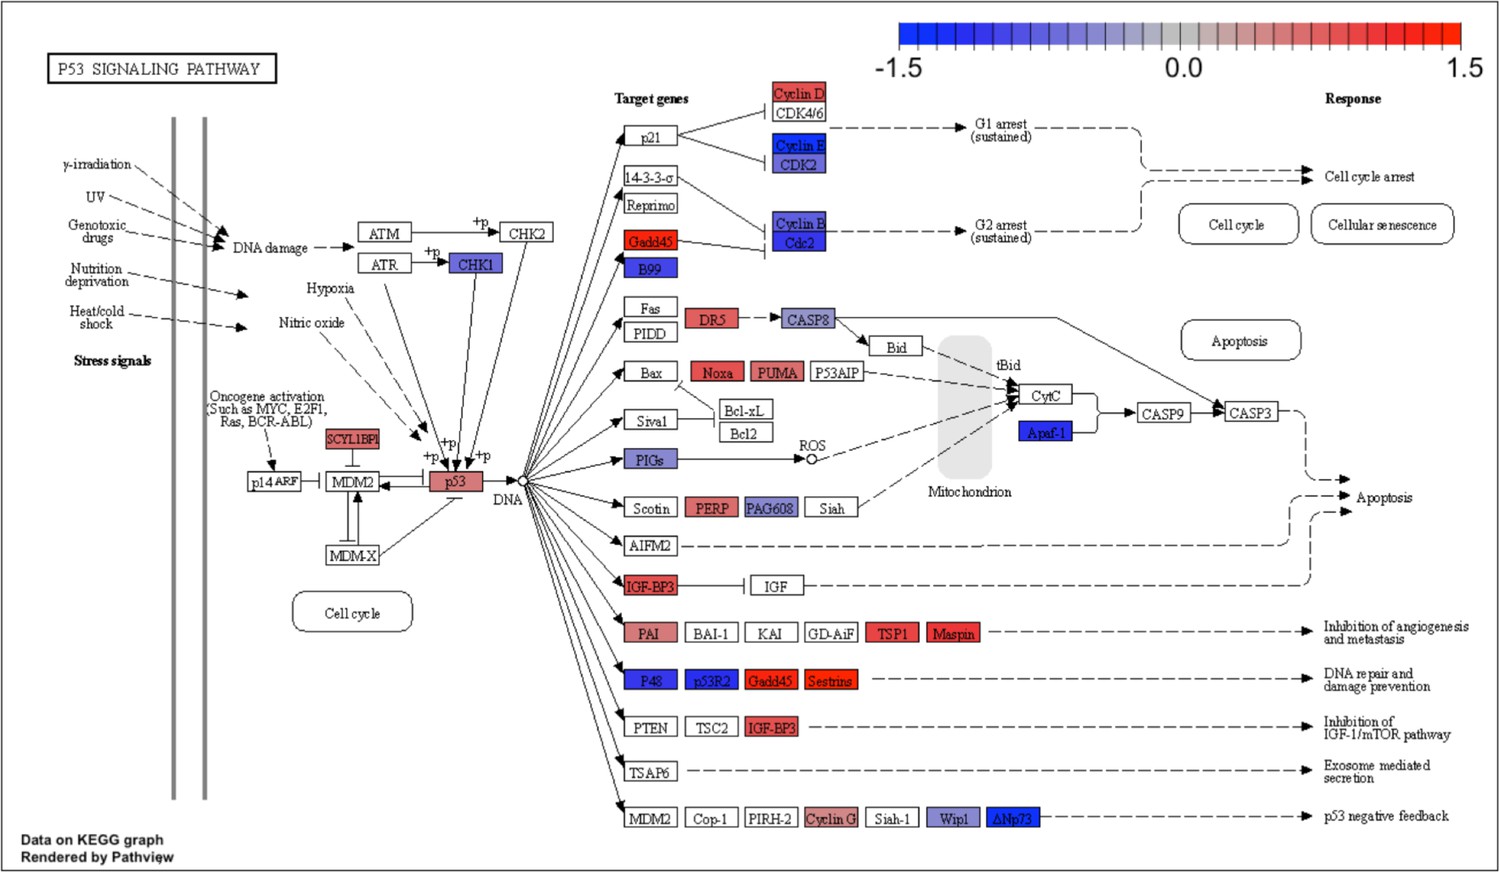
Kyoto Encyclopedia of Genes and Genomes (KEGG) for the p53-pathway signaling.
Analog #4 differentially regulated genes that overlapped with the known p53 target gene set were used to perform a KEGG analysis for the p53 pathway.
Figure 2—figure supplement 3
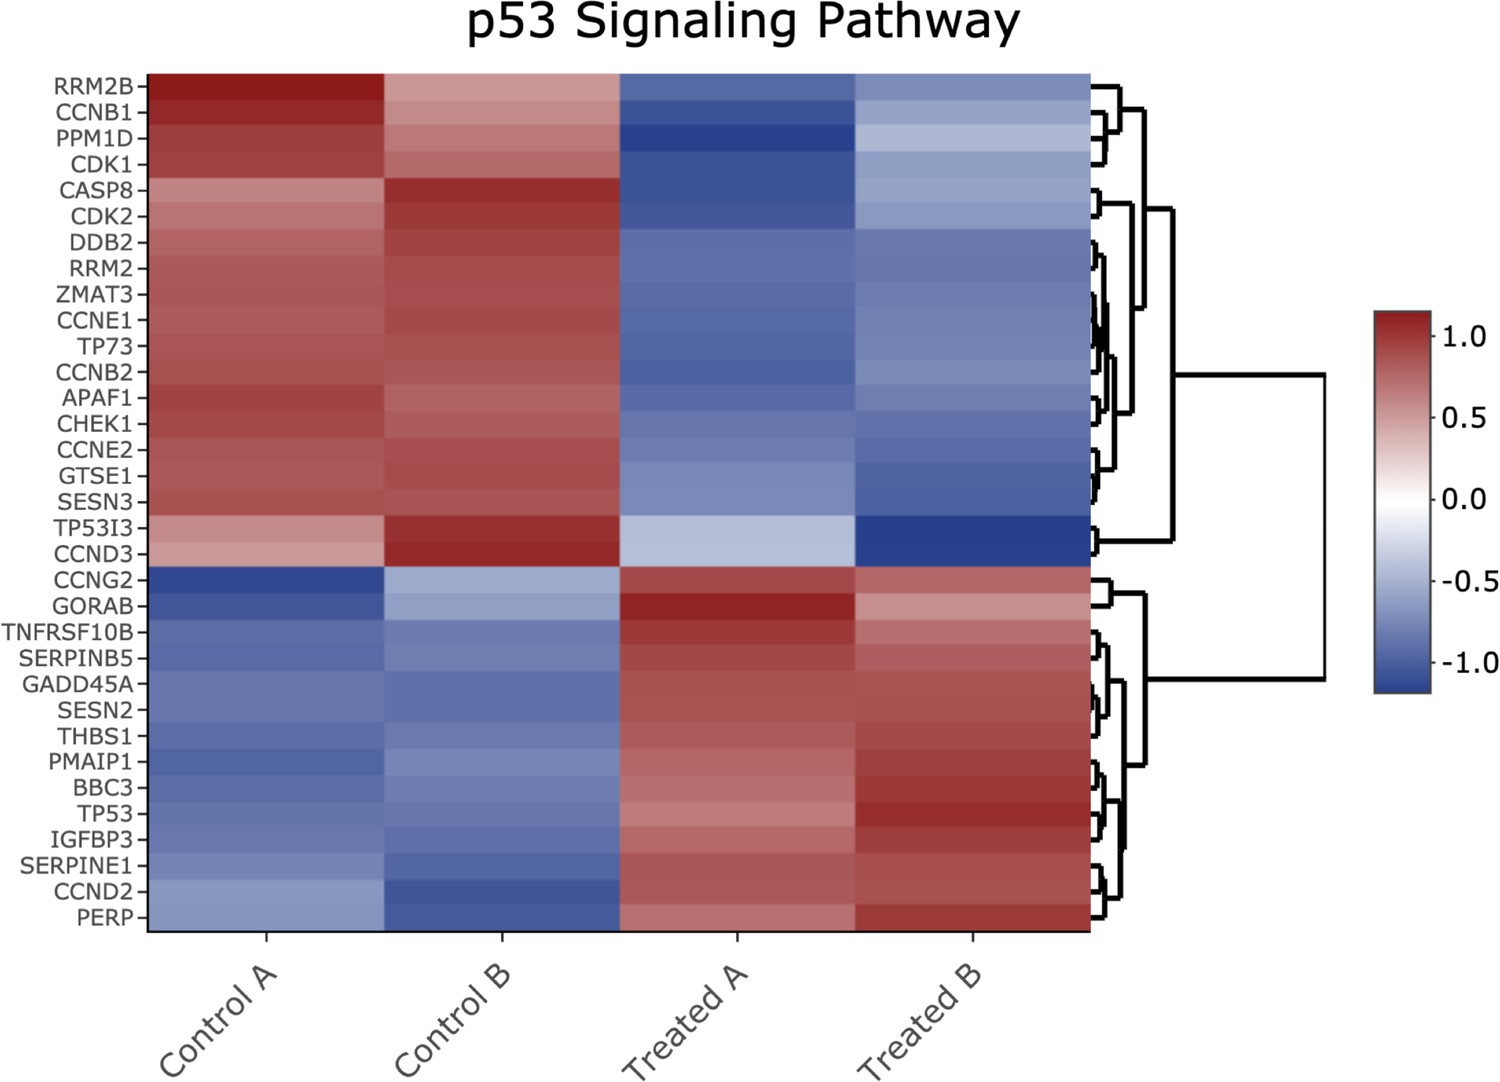
Heatmap of genes shown in Figure 2—figure supplement 2 Kyoto Encyclopedia of Genes and Genomes (KEGG) p53-pathway signaling analysis.
Figure 2—figure supplement 4
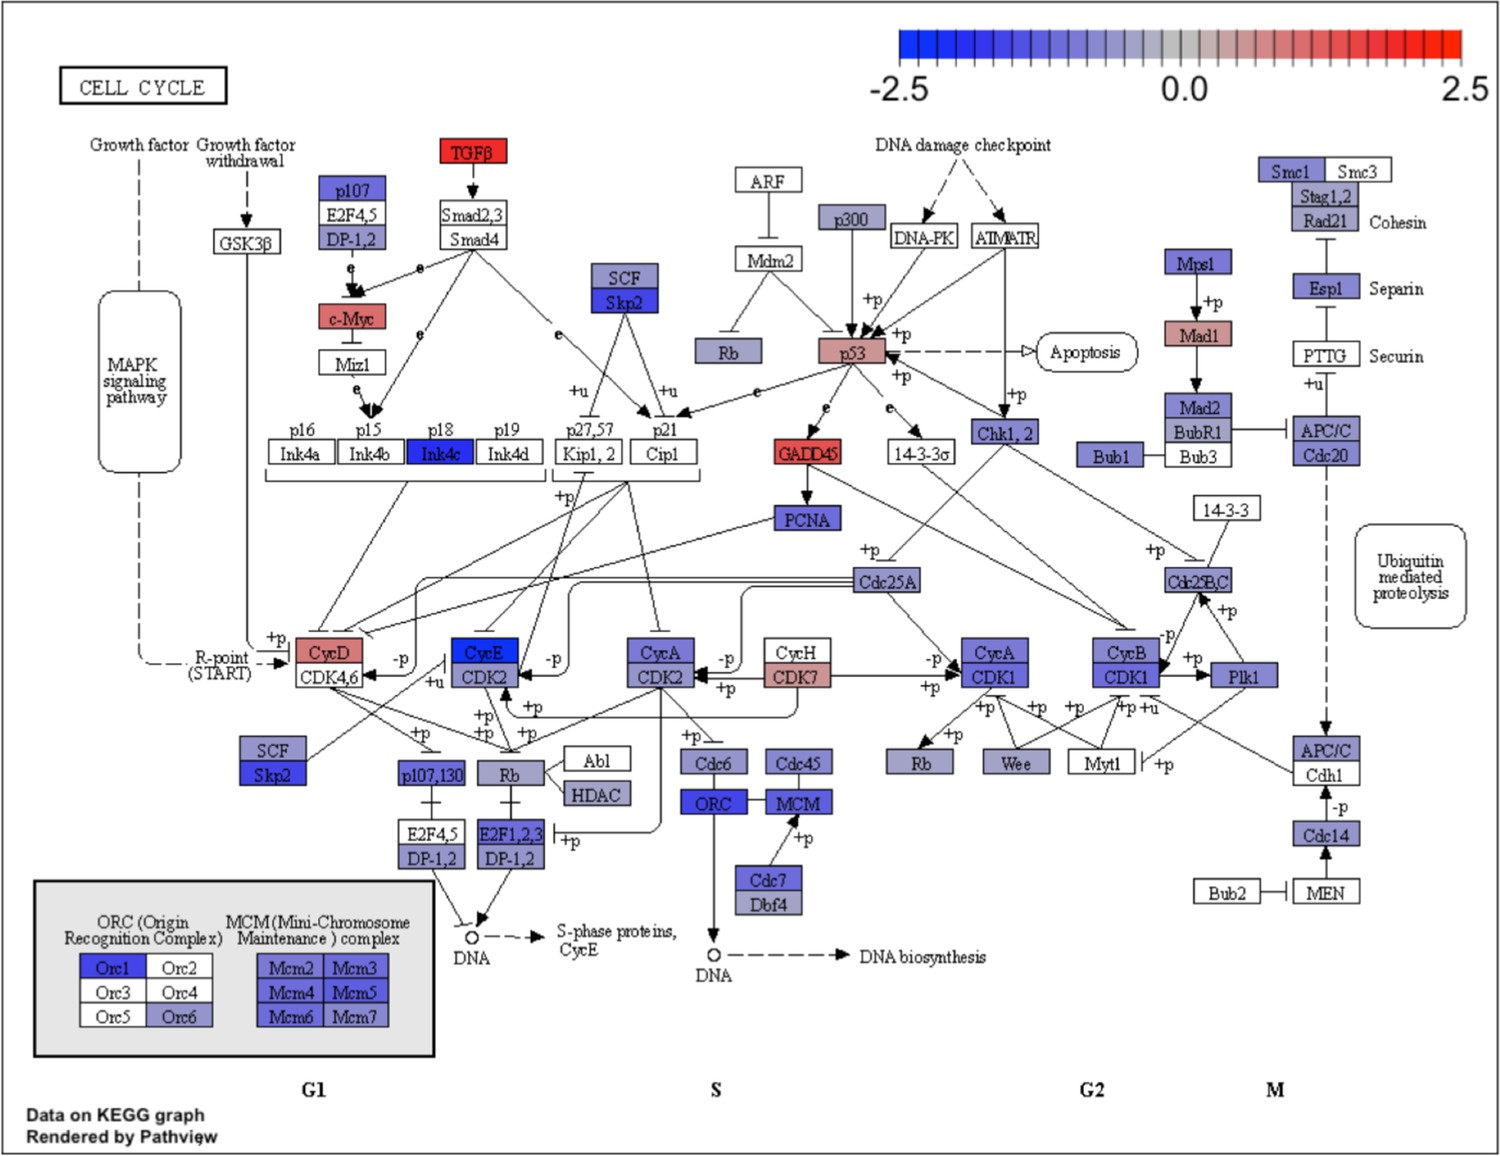
Kyoto Encyclopedia of Genes and Genomes (KEGG) for the cell cycle pathway.
KEGG analysis of analog #4 differentially regulated genes was found to be enriched for the cell cycle pathway, adjp equal to 2.27×10⁻⁶.
Figure 2—figure supplement 5
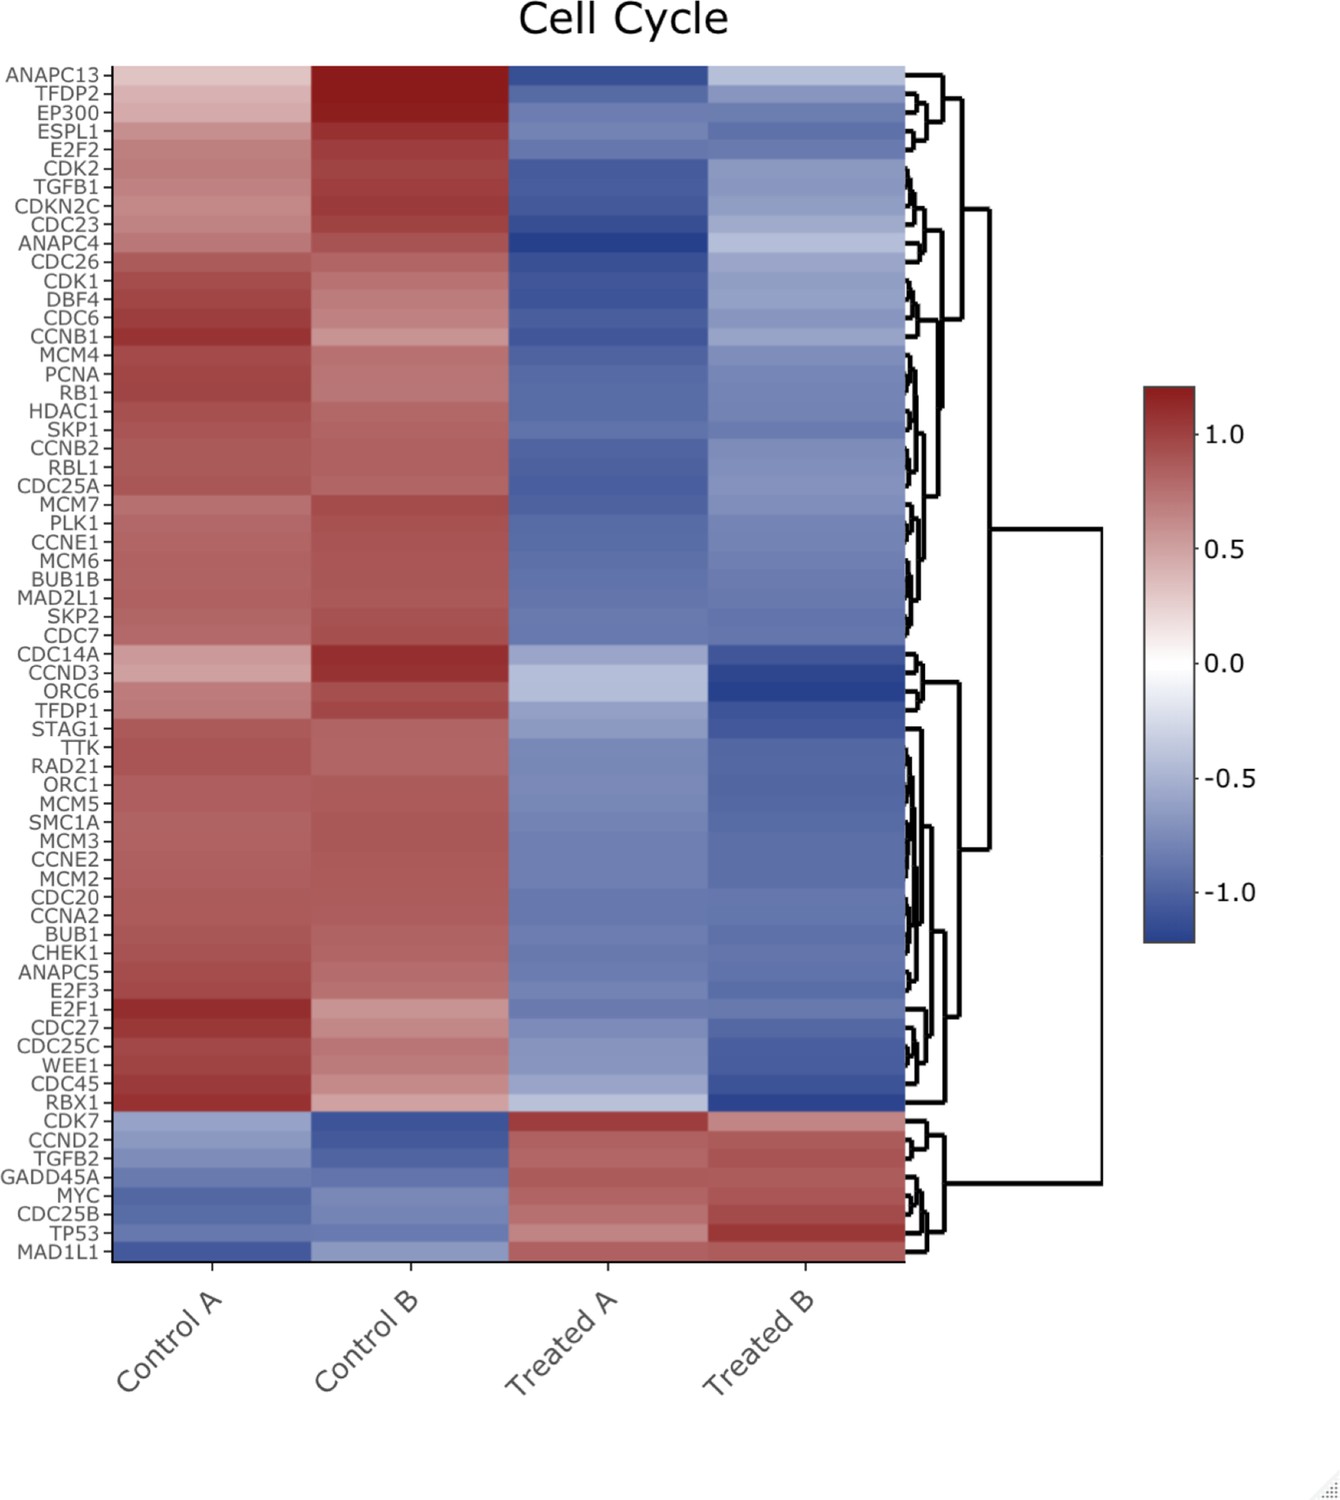
Heatmap of genes shown in Figure 2—figure supplement 4 Kyoto Encyclopedia of Genes and Genomes analysis from the cell cycle pathway.
Figure 2—figure supplement 6
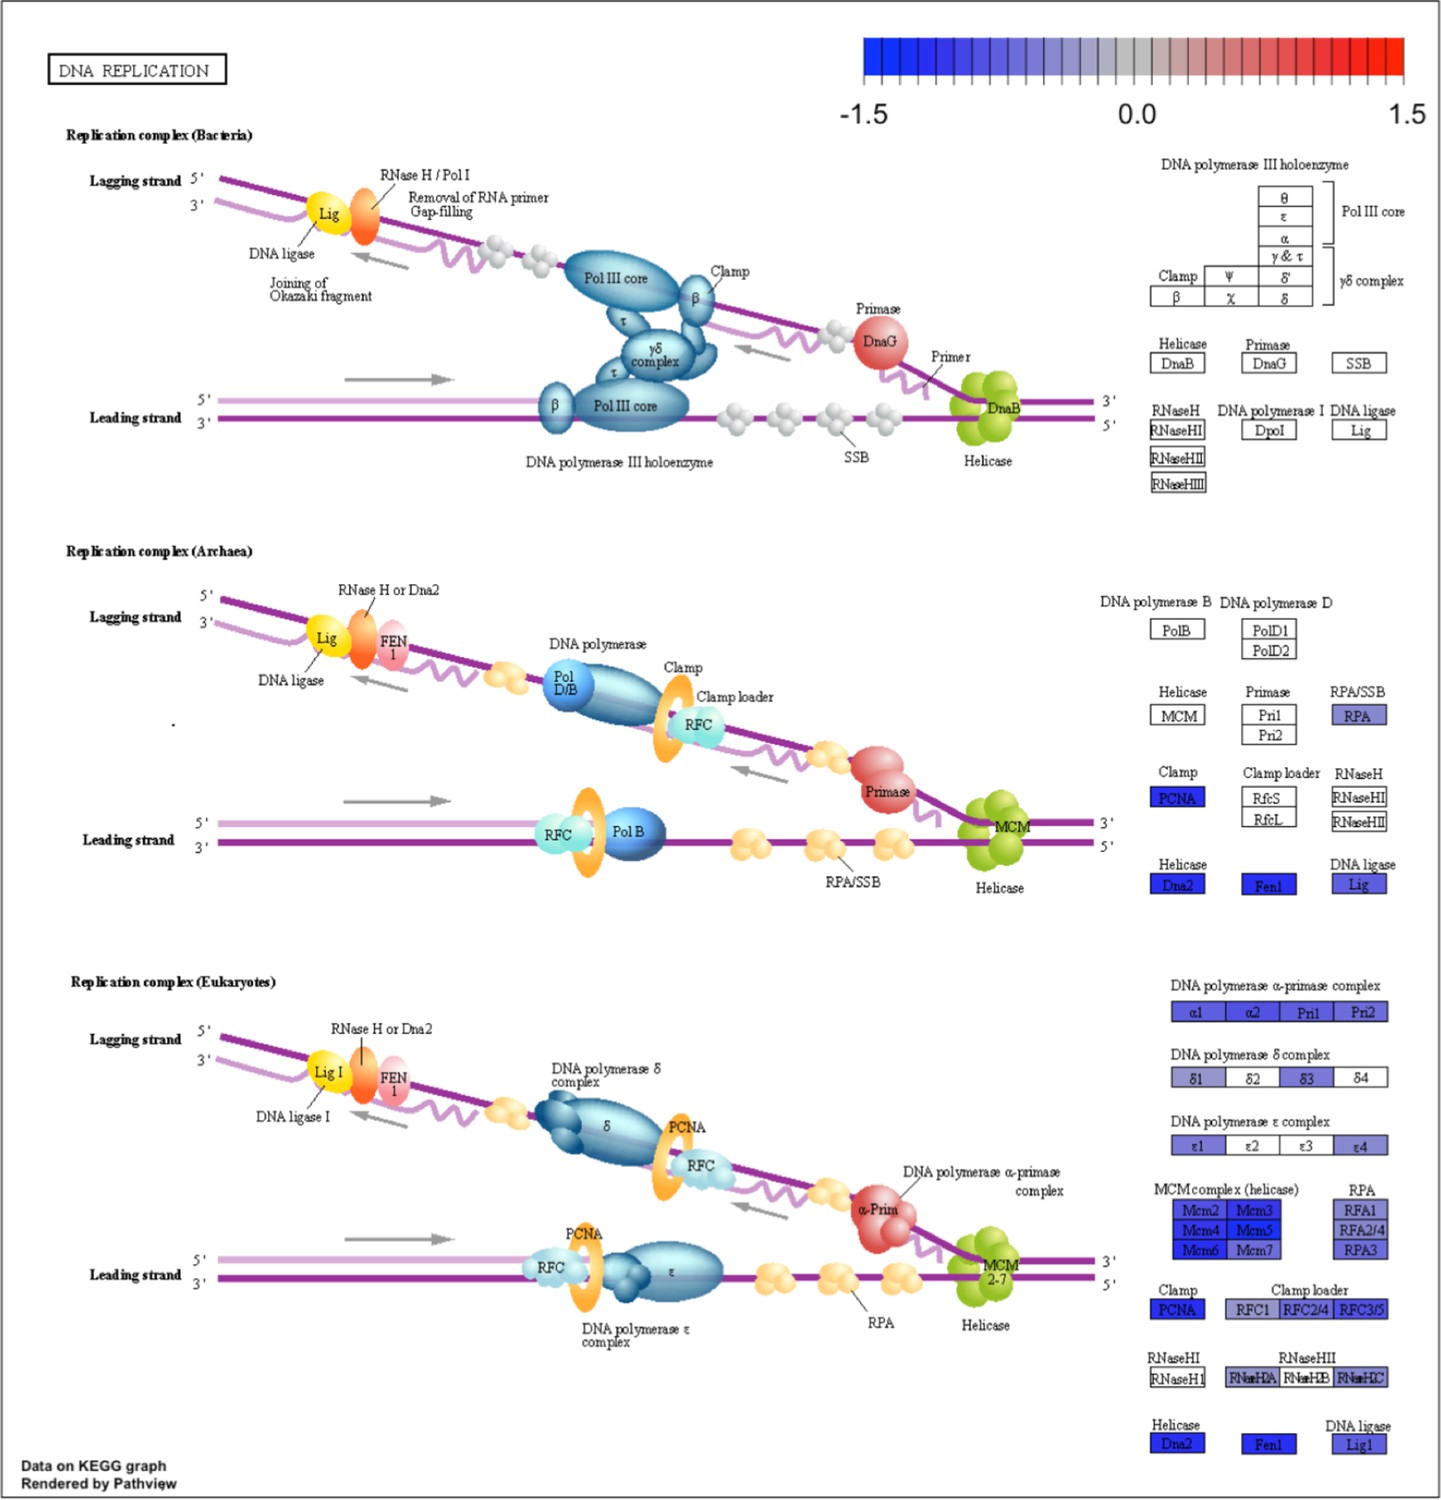
Kyoto Encyclopedia of Genes and Genomes (KEGG) for the DNA replication pathway.
KEGG analysis of analog #4 differentially regulated genes was found to be enriched for the DNA replication pathway, adjp equal to 2.27×10⁻⁶.
Figure 2—figure supplement 7

Heatmap of genes shown in Figure 2—figure supplement 6 Kyoto Encyclopedia of Genes and Genomes analysis from the DNA replication pathway.
Figure 2—figure supplement 8
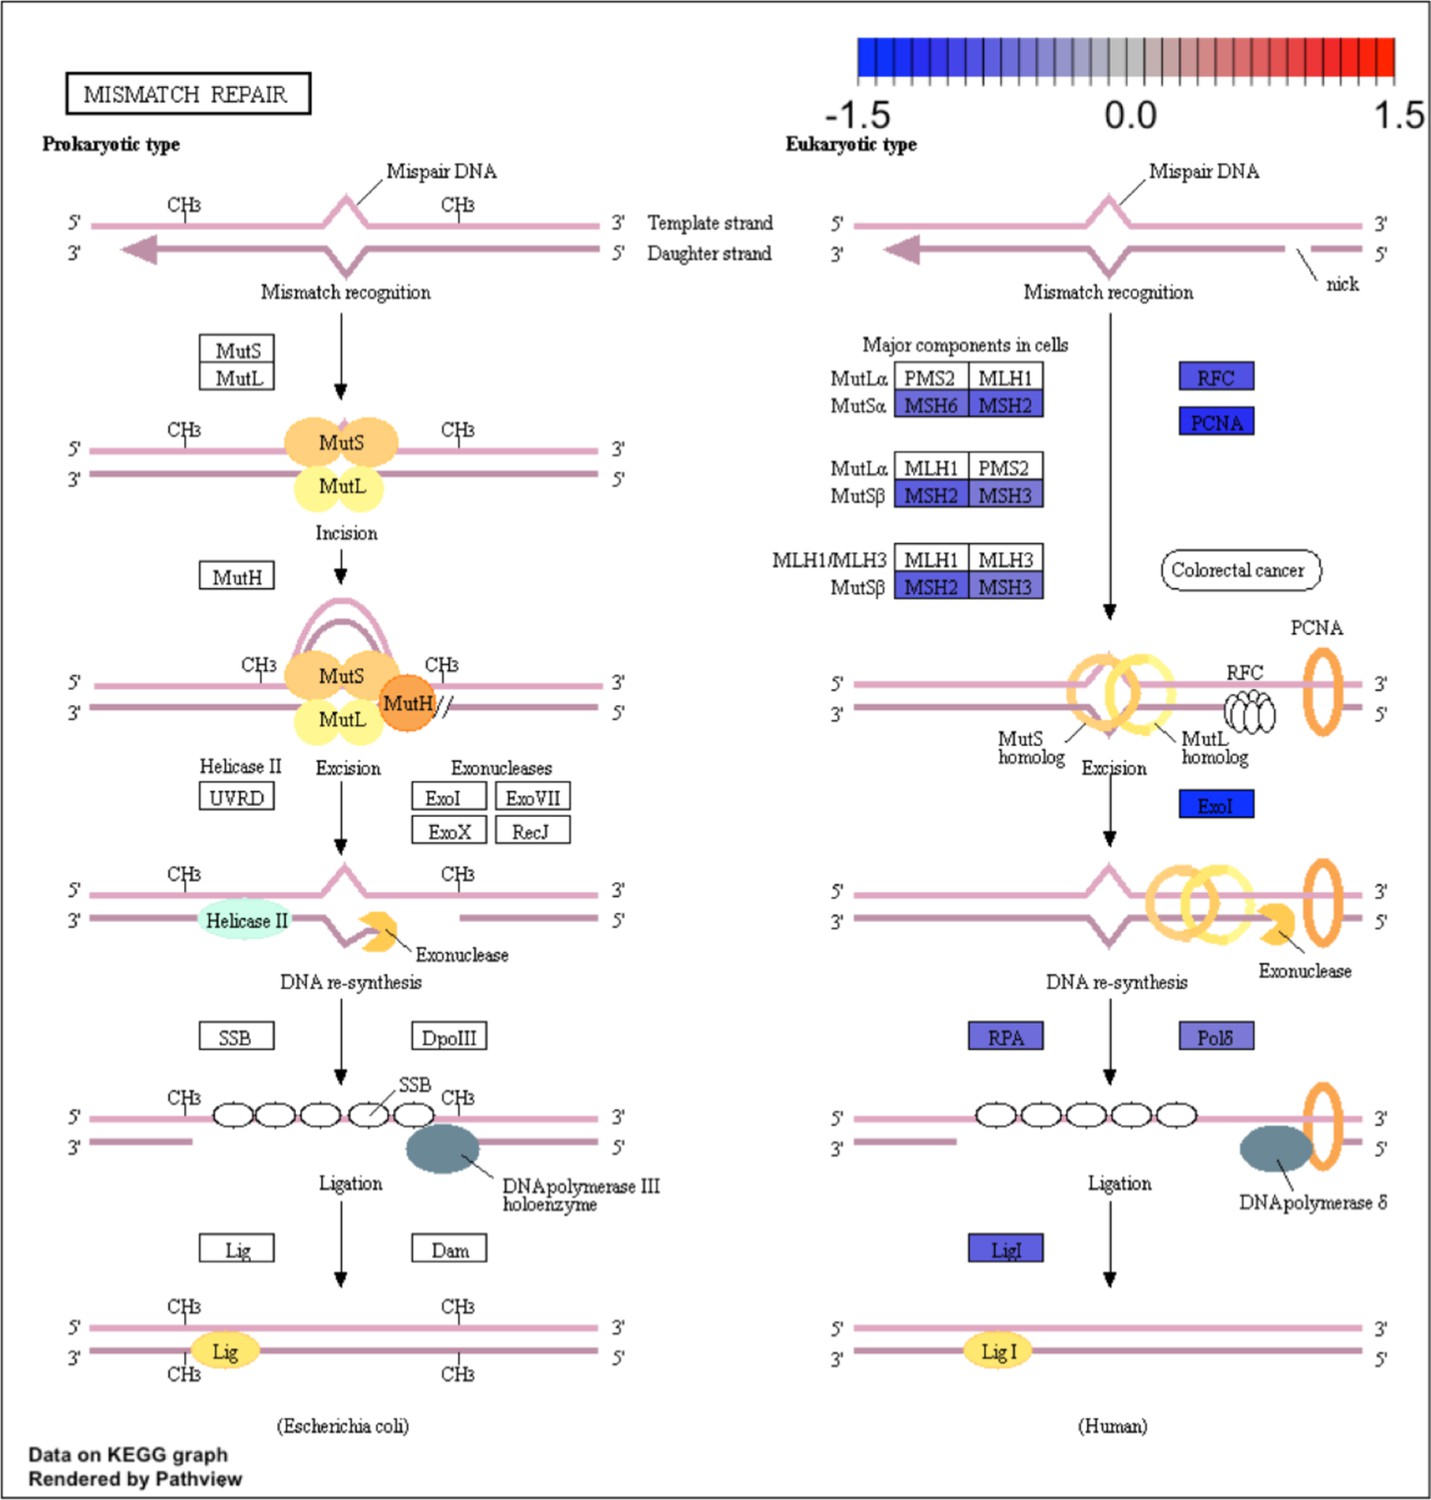
Kyoto Encyclopedia of Genes and Genomes (KEGG) for the mismatch repair pathway.
KEGG analysis of analog #4 differentially regulated genes was found to be enriched for the DNA replication pathway, adjp equal 5.05×10⁻³.
Figure 2—figure supplement 9
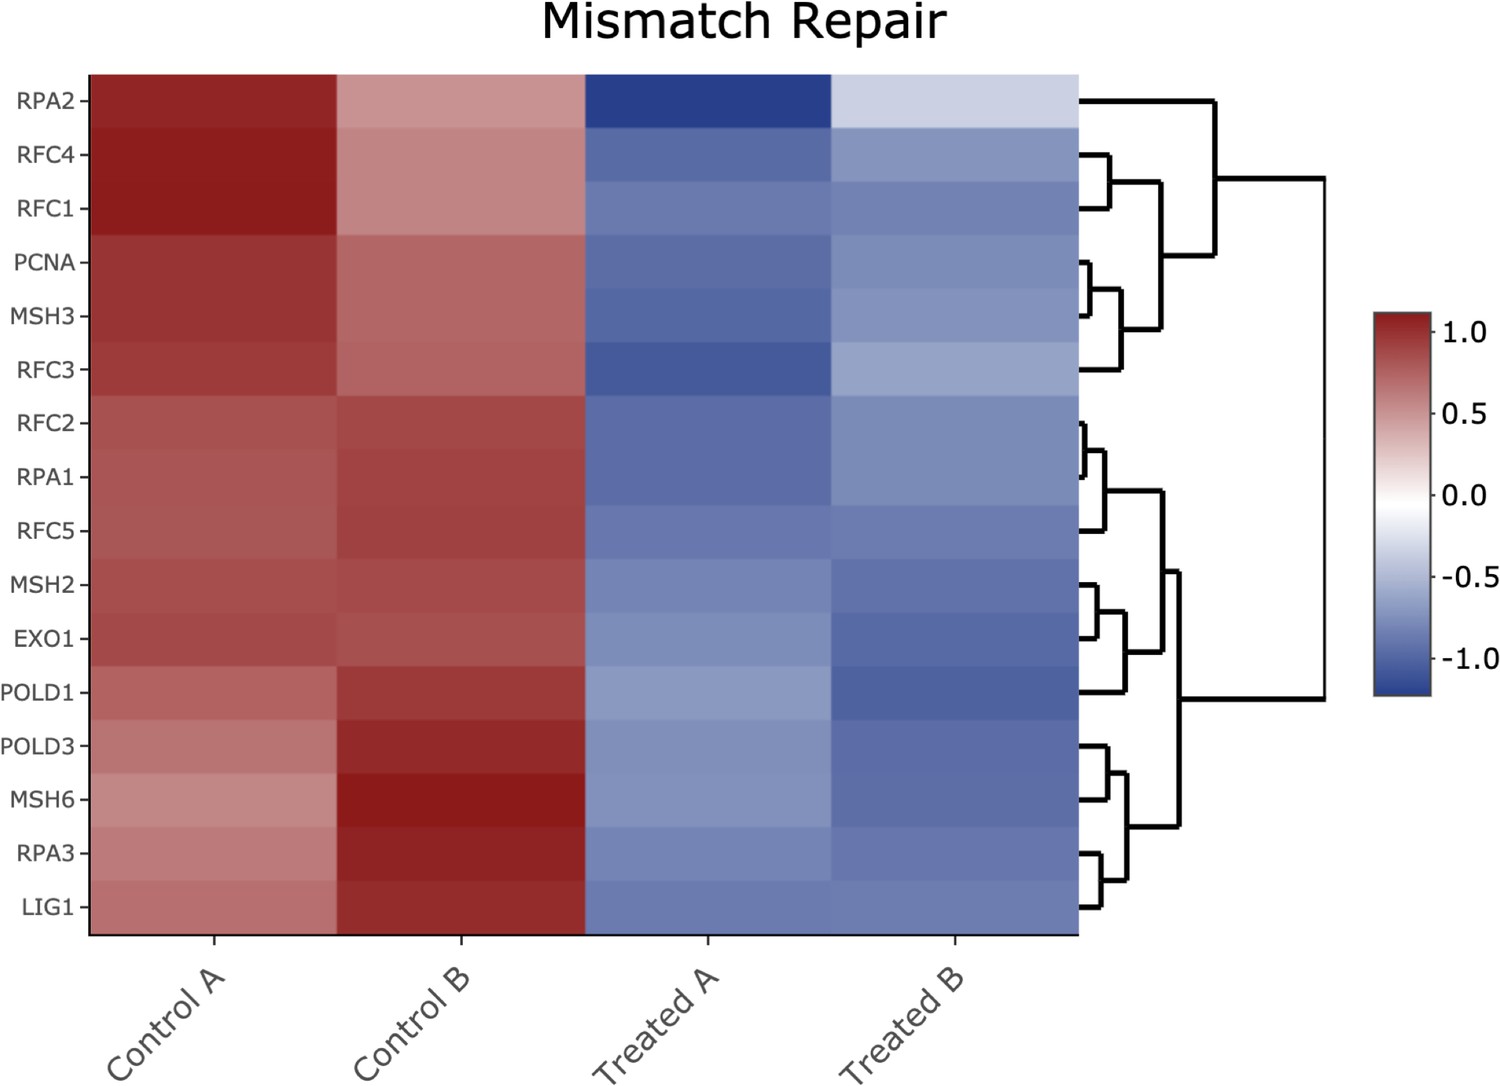
Heatmap of genes shown in Figure 2—figure supplement 8 Kyoto Encyclopedia of Genes and Genomes analysis from the mismatch repair pathway.
Figure 2—figure supplement 10
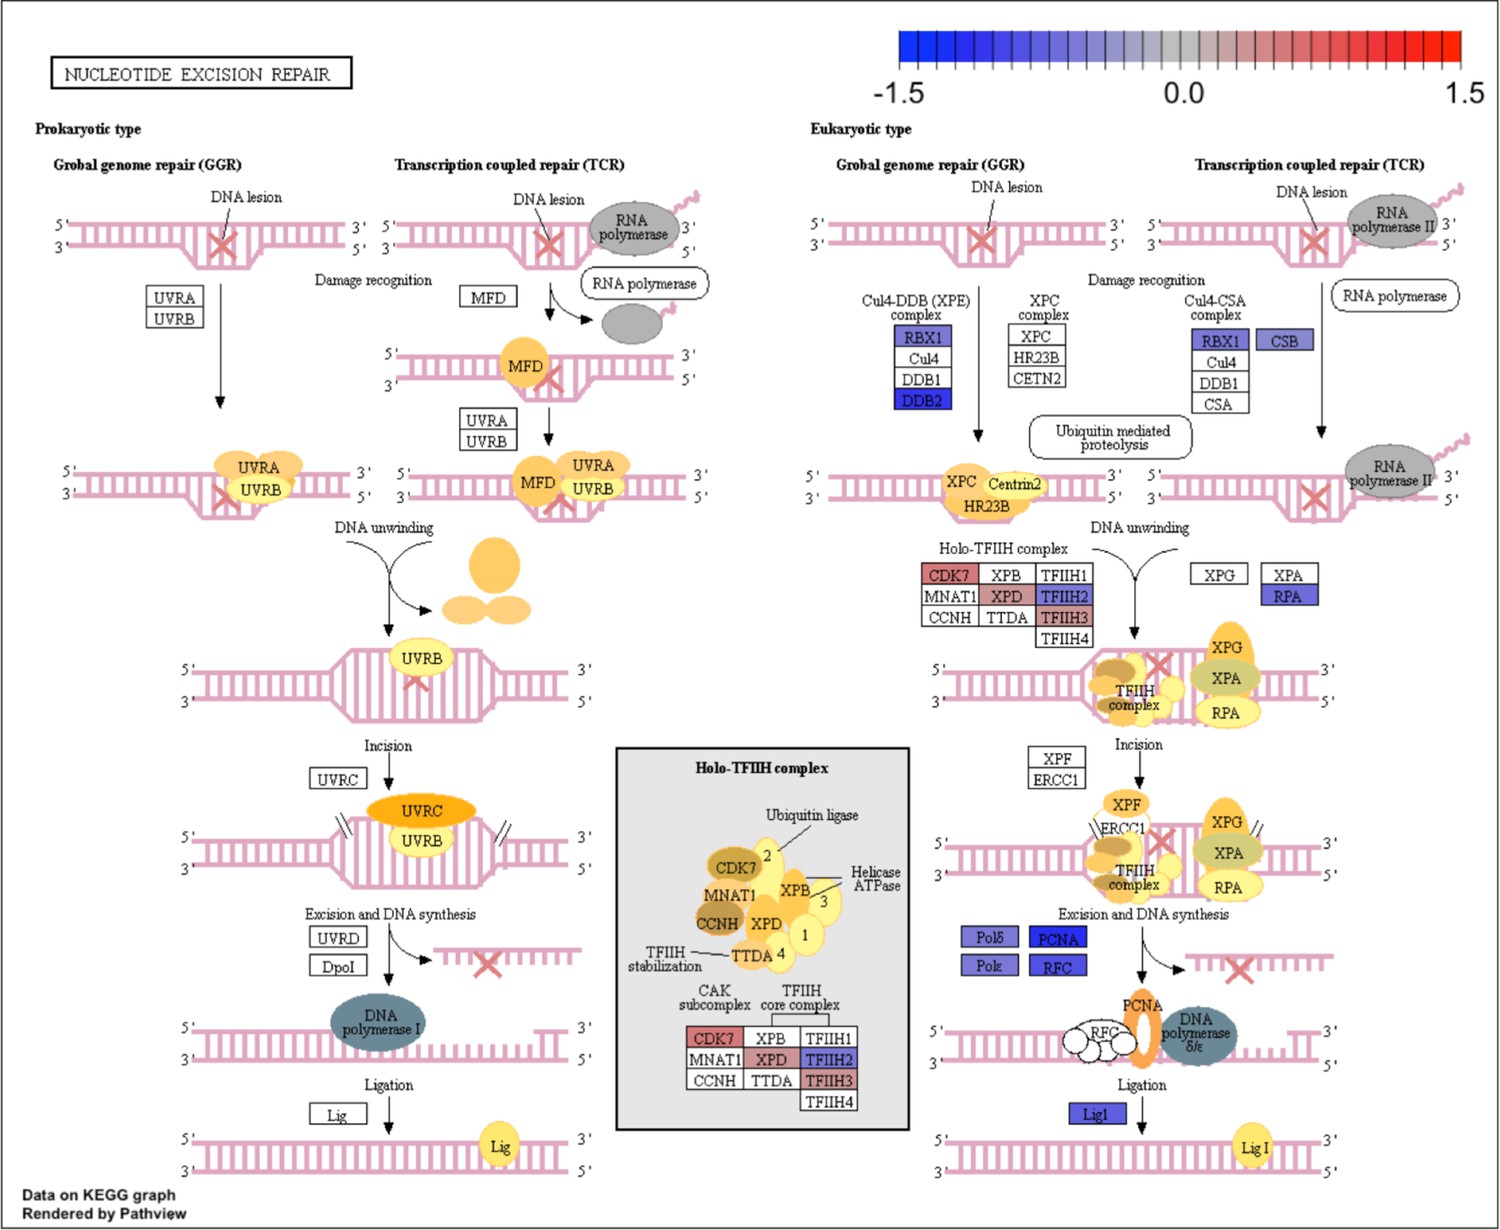
Kyoto Encyclopedia of Genes and Genomes (KEGG) for the nucleotide excision repair pathway.
KEGG analysis of analog #4 differentially regulated genes was found to be enriched for the DNA replication pathway, adjp equal 2.18×10⁻².
Figure 2—figure supplement 11
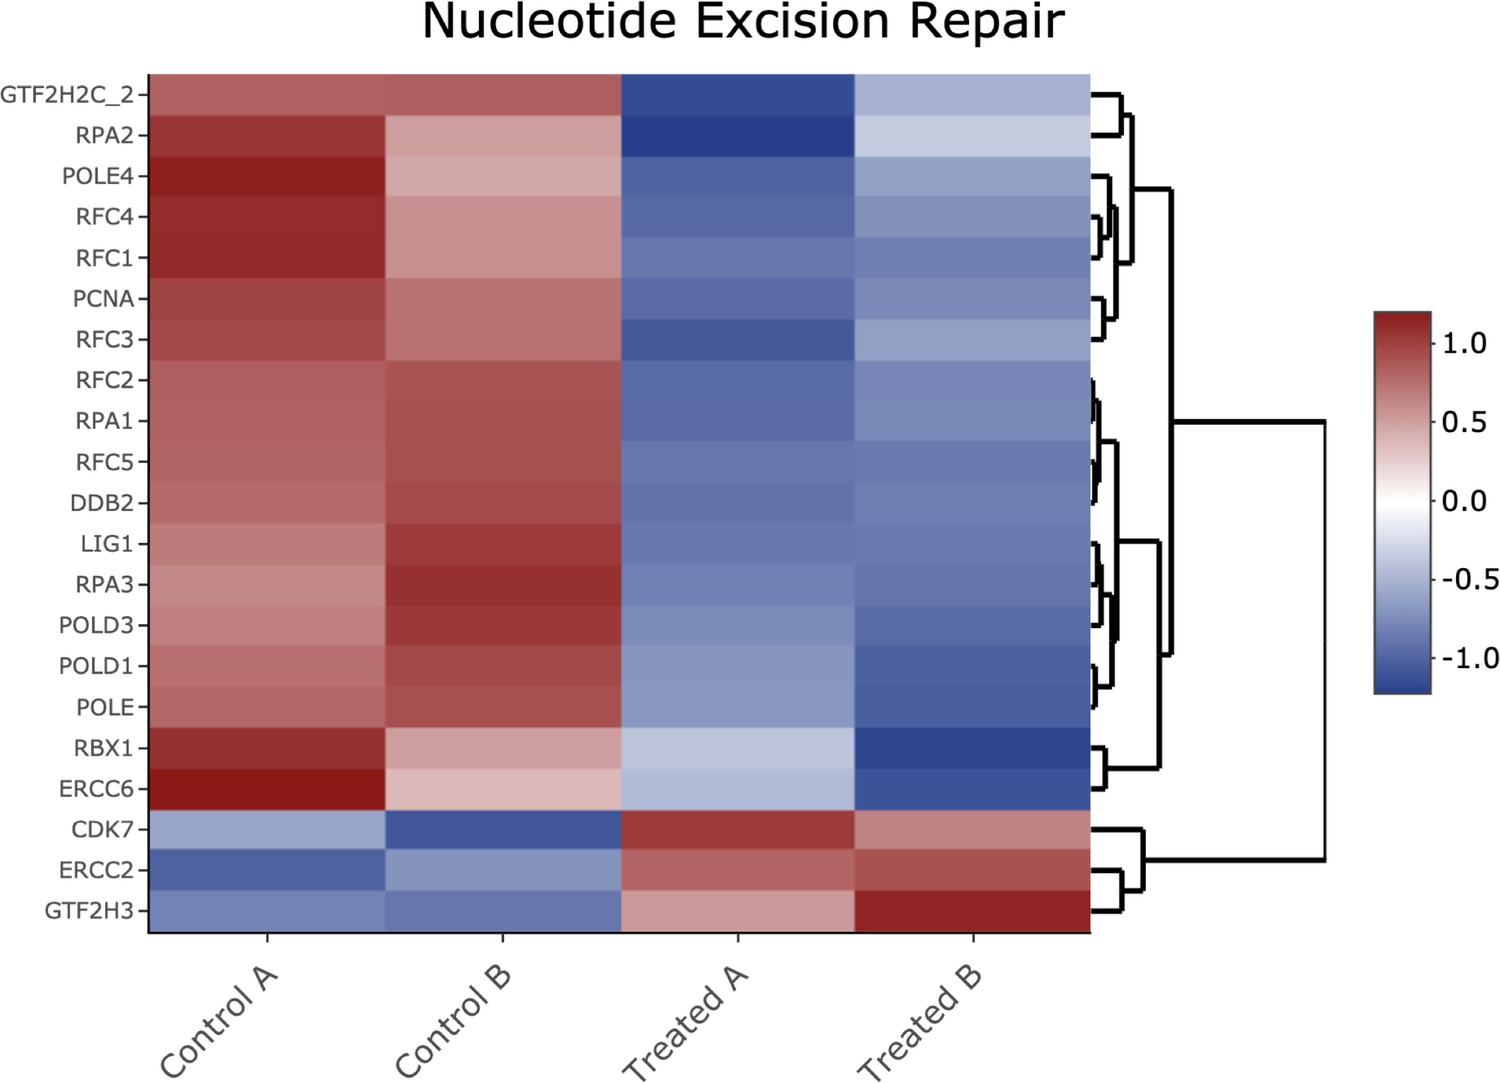
Heatmap of genes shown in Figure 2—figure supplement 10 Kyoto Encyclopedia of Genes and Genomes analysis from the nucleotide excision repair pathway.
Figure 3 with 1 supplement
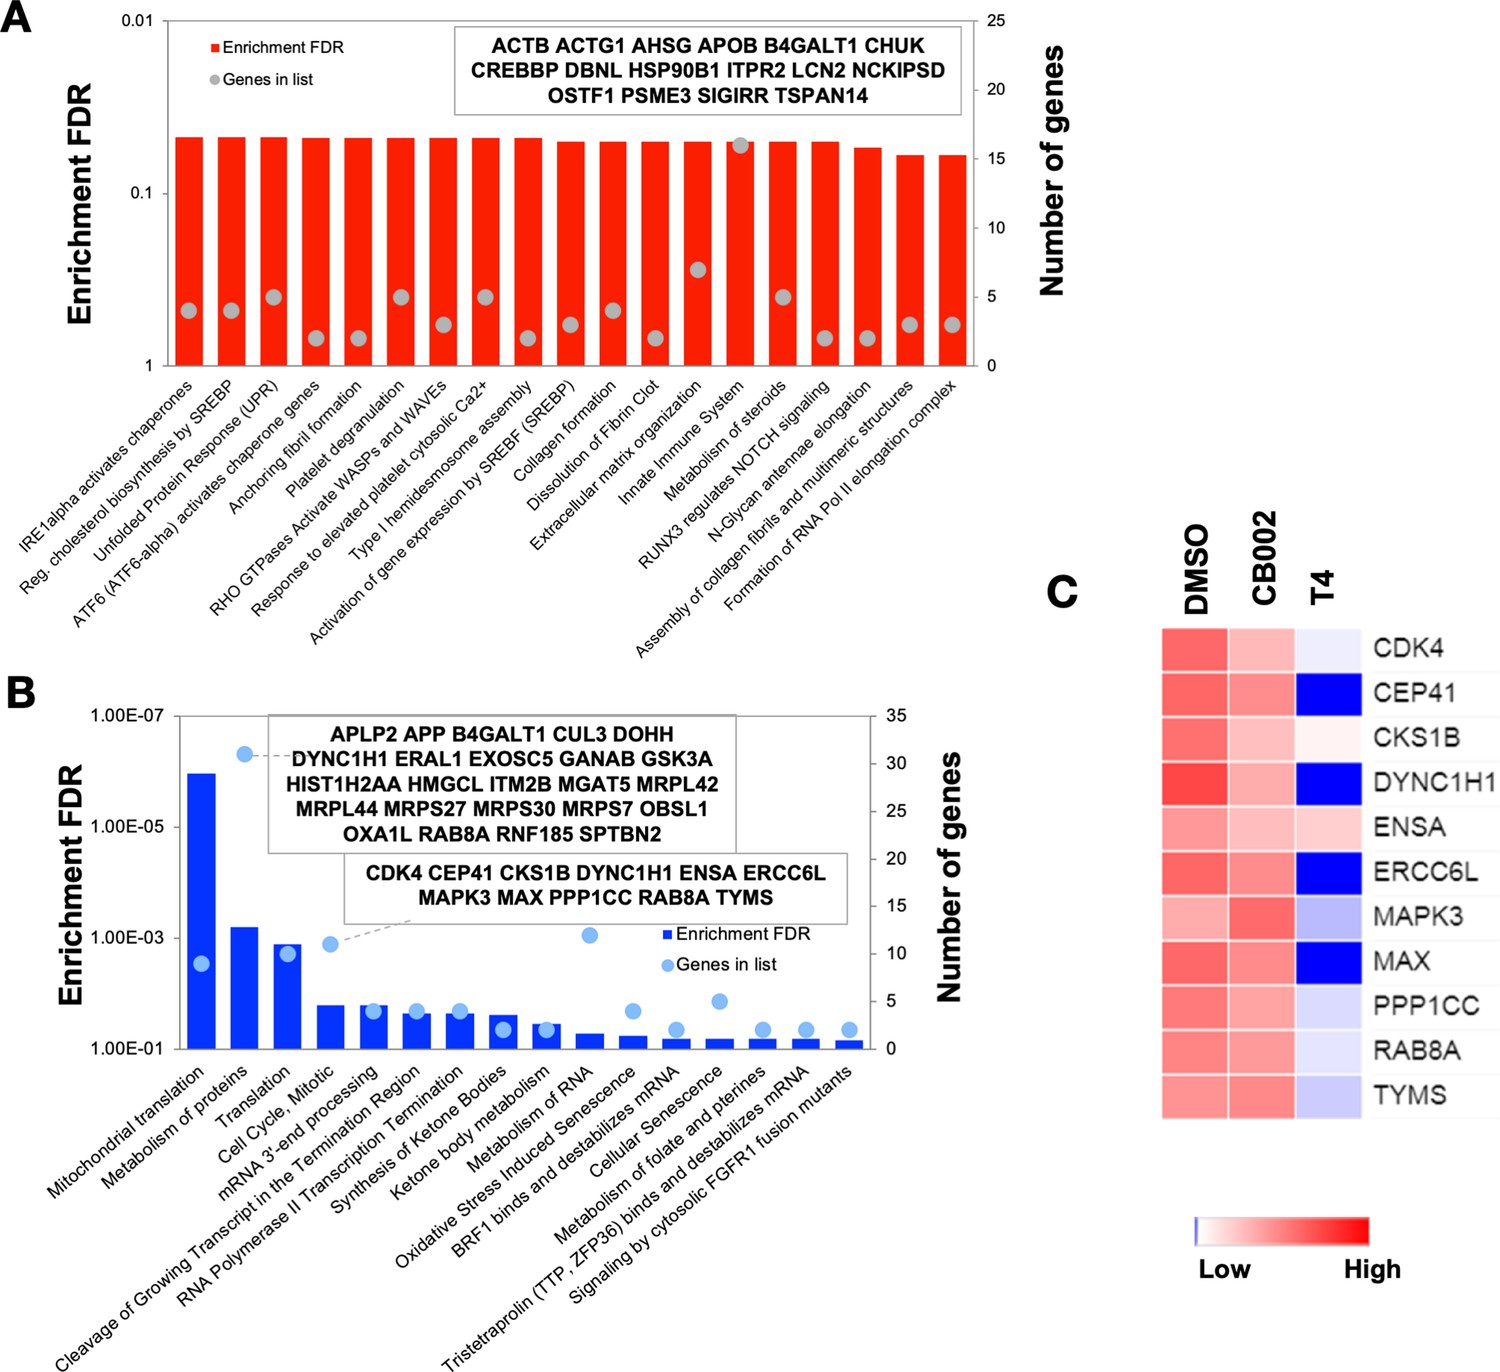
Proteomic pathway analysis of CB002-analog #4 responsive differentially expressed proteins in SW480 cells.
Significantly enriched pathways corresponding to the CB002-analog #4 responsive upregulated (A) and downregulated (B) proteins (in comparison with the DMSO). The heatmap (C) shows the grouped proteins’ expression value of some target pathway proteins highlighted in the box area. Data collected from the proteomic analysis of DMSO versus CB002 and analog #4 treated SW480 cell samples for 24 hr.
-
Figure 3—source data 1
Protein information of all proteins detected in DMSO vehicle control and analog #4 SW480 treated cells at 24 hr samples analysed by LC-MS/MS.
- https://cdn.elifesciences.org/articles/70429/elife-70429-fig3-data1-v1.xlsx
Figure 3—figure supplement 1

Comparative label-free quantitative proteomic analysis of SW480 cell lines in response to DMSO, CB002 (CB), and analog 4 (T4) treated for 24 hr.
(A) Principal component analysis of total protein abundance data collected from DMSO, CB002 (CB), and analog 4 (T4) samples. Data represents the close clustering of protein abundance of each replicates under the same group, however, showed variability among the treatments. (B–D) Volcano plot of fold change versus q-value of the total of 3743 proteins quantified from SW480 cell lines in response to DMSO, CB, and T4 treatments. Red and green circles represent the significant (q<0.05) upregulated and down-regulated proteins. Gray circles (q=0.05) are non-significant and below the threshold of fold expression. (E) Heat map and clustering analysis of the total proteins (3743) identified from DMSO, CB, and T4 samples.
Figure 4 with 1 supplement
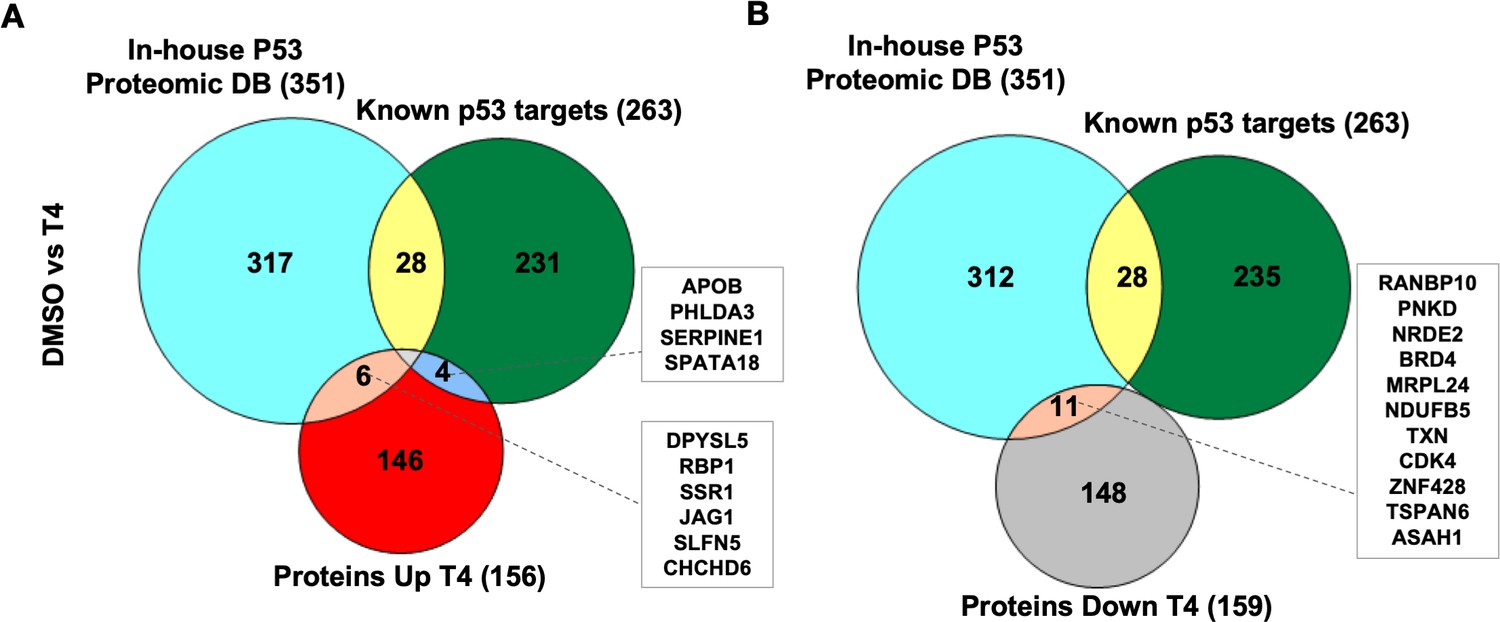
CB002-analog #4 (T4) responsive proteins in comparison with in-house p53-proteomic database and known p53 targets.
Three-way Venn diagram of upregulated (A) and downregulated (B) analog #4 responsive proteins. Data collected from the proteomic analysis of DMSO versus analog #4 treated SW480 cell samples for 24 hr.
Figure 4—figure supplement 1

Proteomic data comparison of proteins increased and/or decreased in abundance with analog #4 (T4) treatment compared to DMSO and CB002.
Two-way Venn diagrams show the upregulated (A) and downregulated (B) analog #4 responsive proteins compared to CB002. Data collected from the proteomic analysis of DMSO versus CB002 and analog #4 treated SW480 cell samples for 24 hr.
Figure 5 with 1 supplement
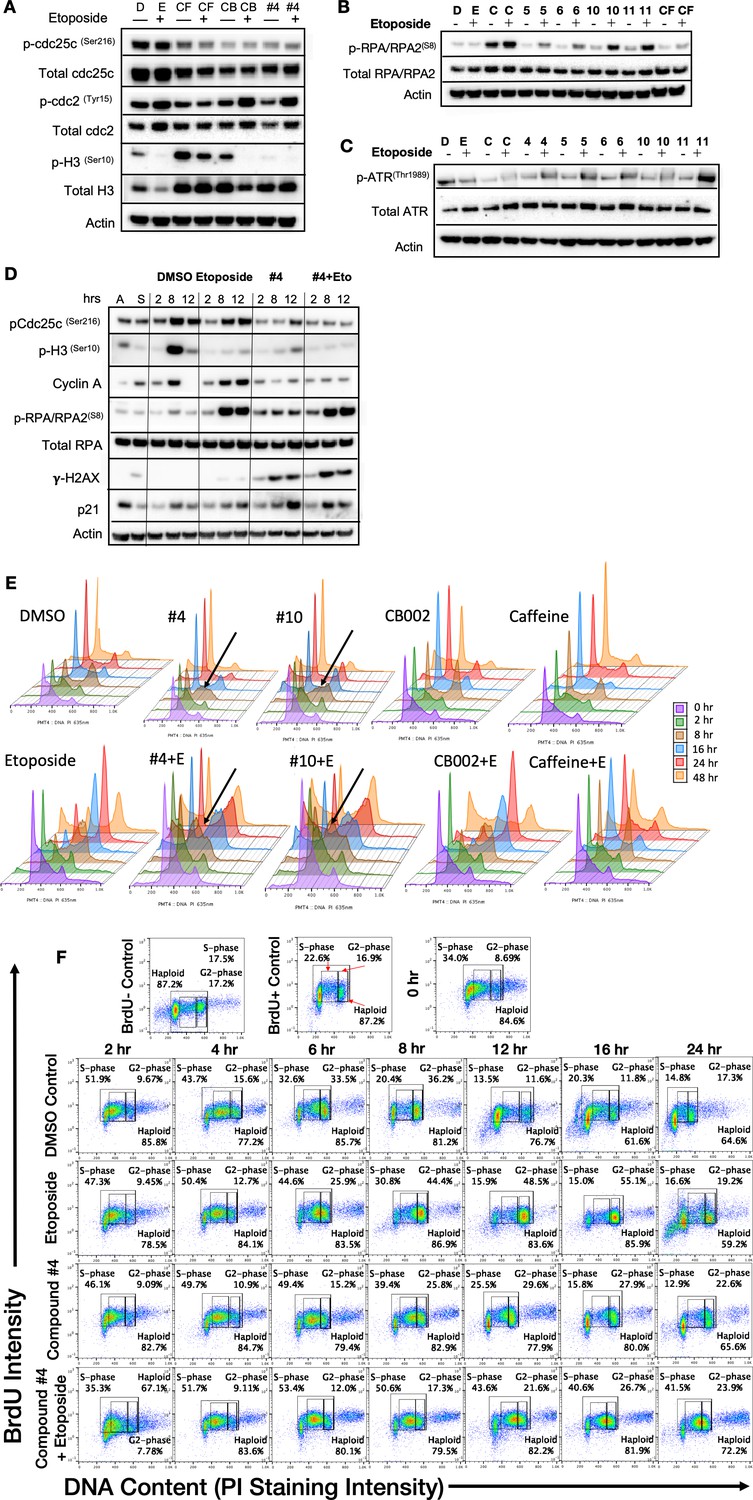
CB002 and its analogs perturbed an S-phase rather than a G2-phase checkpoint like other known xanthines cell cycle effects in SW480 cells.
Western blot analysis of synchronized SW480 treated cells as indicated and harvested at 24 hr (A, B, C). Synchronized SW480 cells were treated as indicated and analyzed by Western blot (D), PI staining (E) or PI/BrdU analysis (F). CB002 (C), Caffeine (CF). Experiments from figures (A)–(D) were performed at least twice and a representation of one is shown.
Figure 5—figure supplement 1
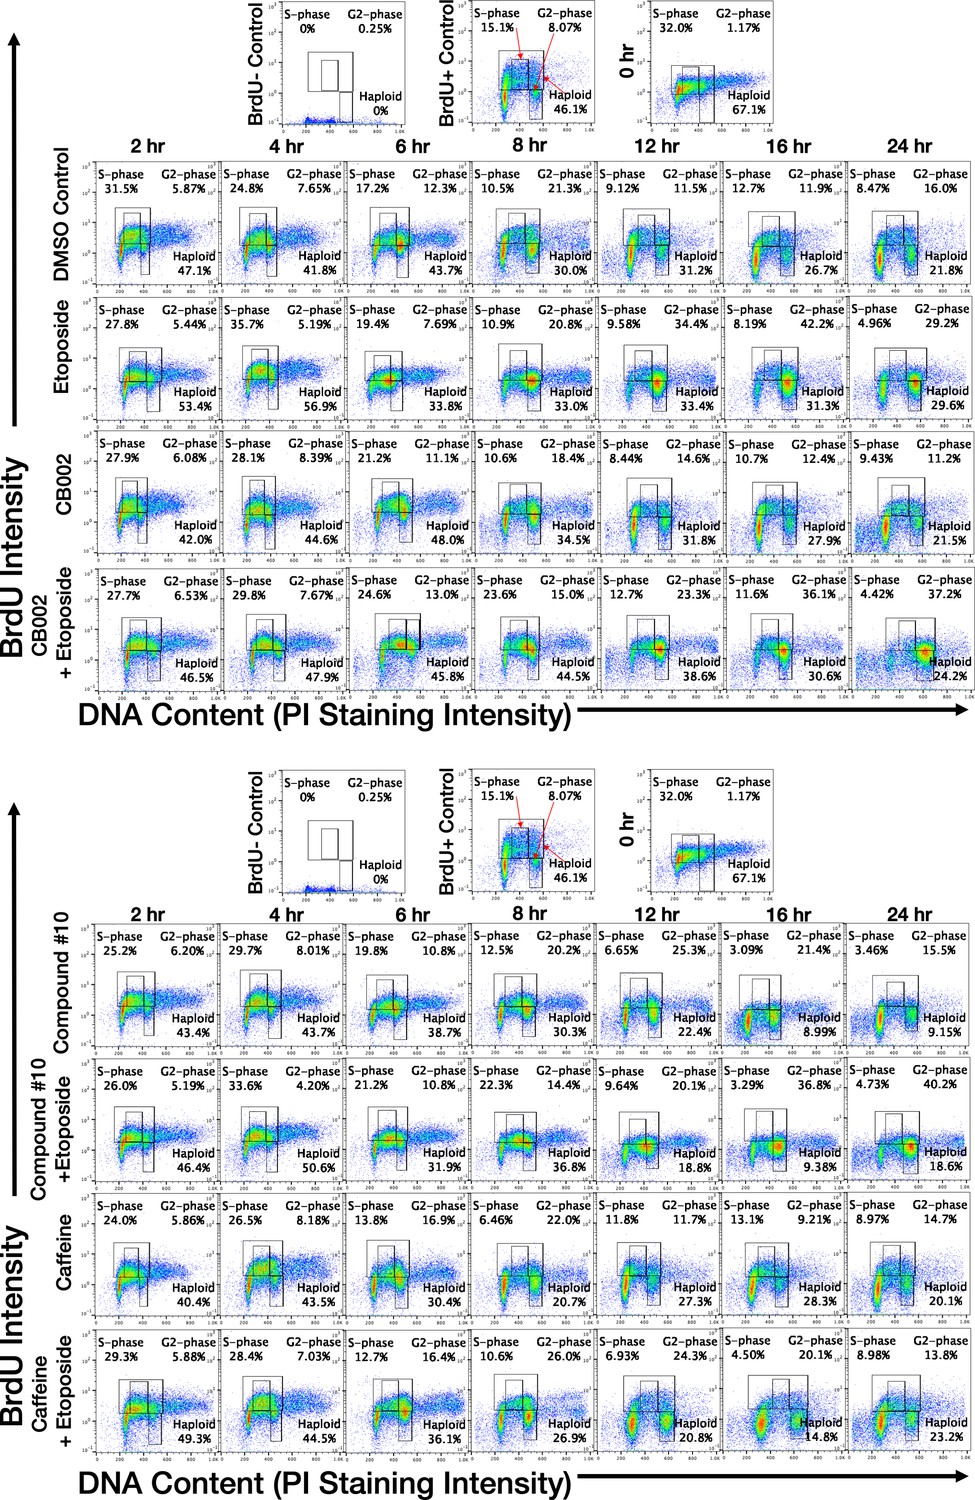
Flow cytometry PI/BrdU-CB002-analog #4 perturbs the S-phase rather than the G2 checkpoint, unlike other xanthines.
Synchronized SW480 cells were treated as indicated, chased with BrdU for 30 min, and harvested over a time course of 0–48 hr. Cells were double-stained for Propidium Iodide and BrdU (A, B). Haploid cell gatings indicate the haploid BrdU-positive cells.
Figure 6
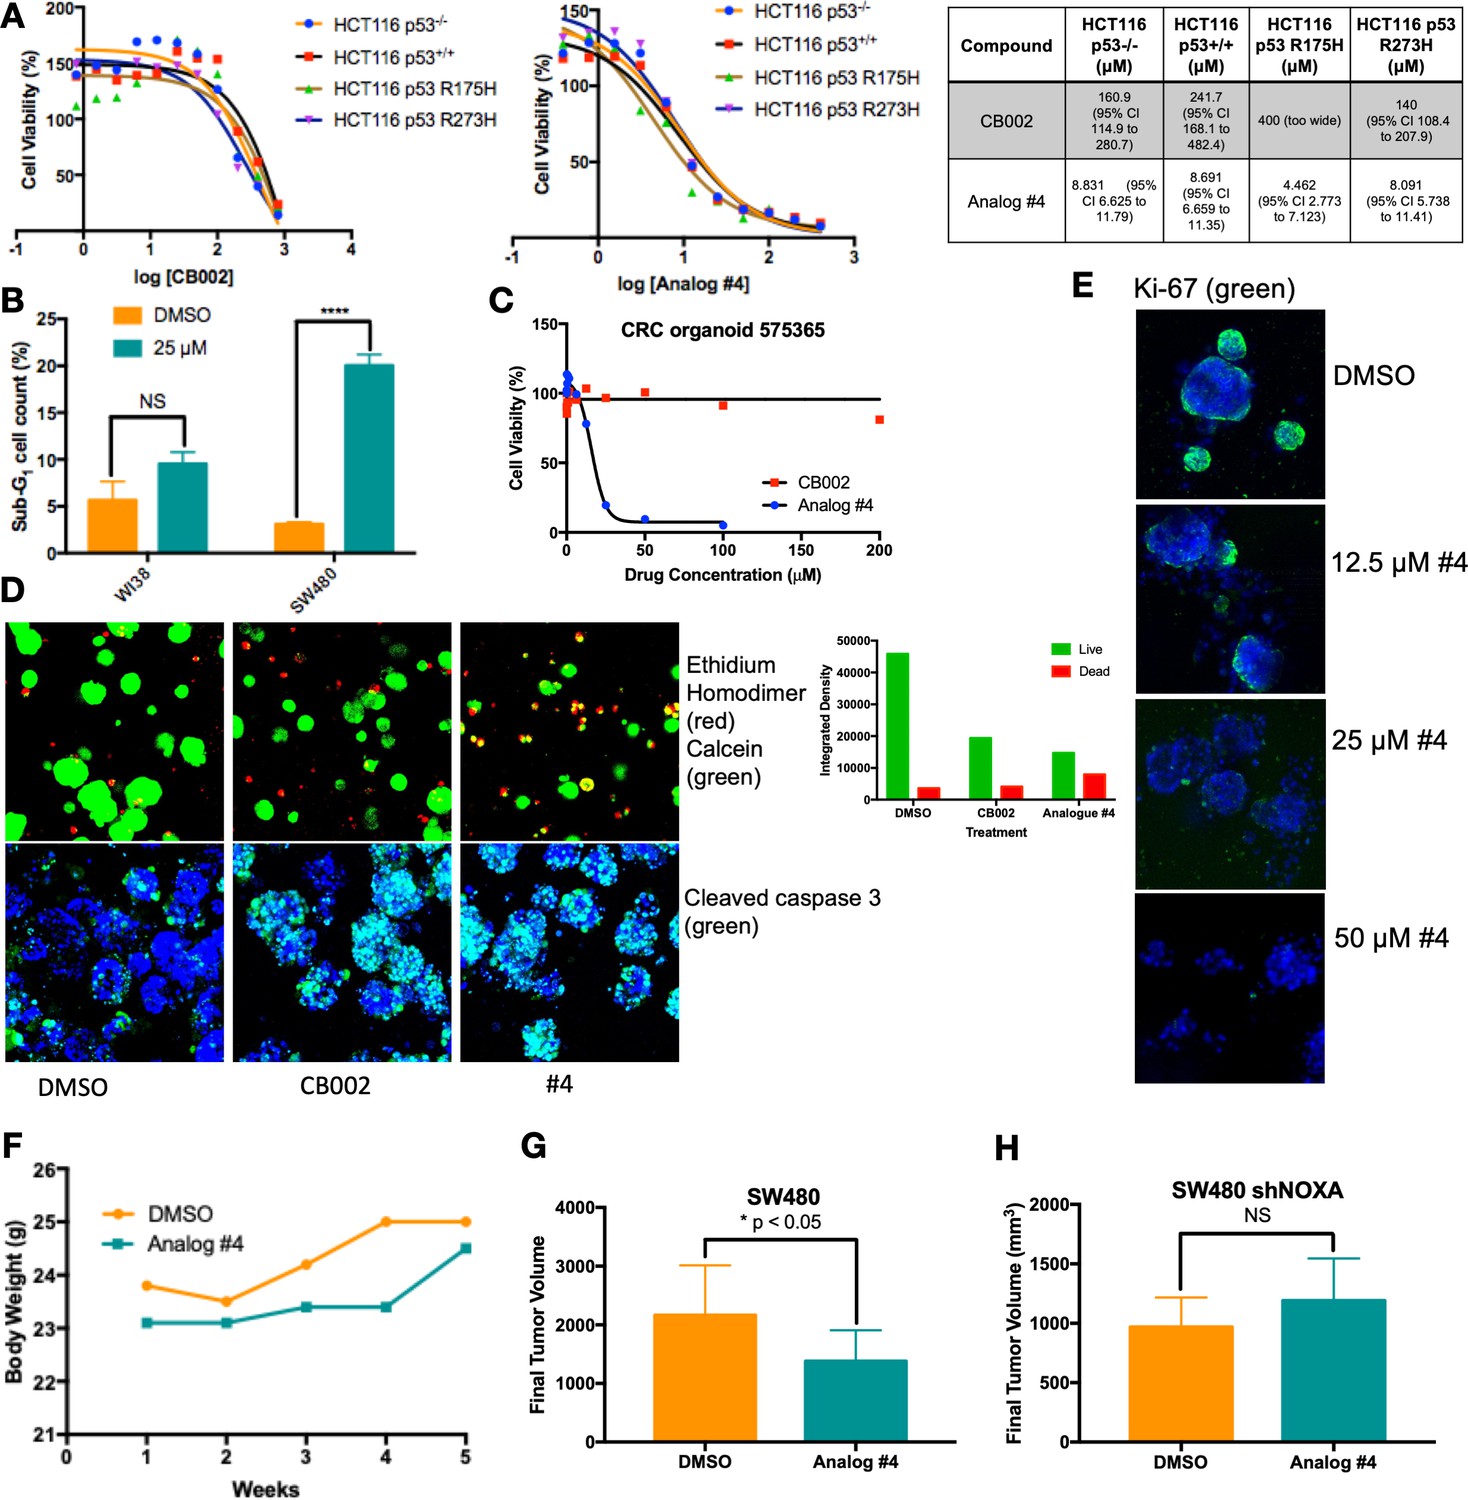
CB002-analog #4 has potent anti-tumor effects in vitro and in vivo.
HCT116 isogenic panel treated with CB002 or analog #4 for 48 hr and their respective IC50 values shown in the table (A). CB002-analog #4 increases apoptotic cells as indicated by the sub-G1 content in cancer cells but not in normal WI38 cells (48 hr). Two-way ANOVA, p<0.0001 (B). 72 hr treatment with CB002-analog #4 is most potent (C) and increases dead cells as indicated by the ethidium homodimer staining (red) compared to calcein stained live cells (green) (A), and cleaved caspase-3 (green) immunofluorescence (D) in colorectal cancer patient-derived organoid cells. CB002-analog #4 decreases ki67 staining (green) in a dose-dependent manner (72 hr) in colorectal cancer patient-derived organoid cells (E). CB002-analog #4 is non-toxic in vivo (F) and significantly reduces tumor volume in NSG mouse xenografts with SW480 wild-type cells (G) but not in SW480 cells with shNoxa (H). 50 mg/kg by oral gavage three times per week, final tumor volume at 5 weeks. Unpaired t-test, p<0.05.
Tables
Table 1
Enriched Biological Process Gene ontology (GO) terms in the 102 differentially expressed genes (DEGs) in CB002-analog #4 treated cells.
GO analysis for the 102 DEGs that are also known p53 target genes. GO term analysis was done using the R package ‘goseq’ and those genes enriched in particular biological process are described along with their adjp value. Top 25 enriched GO terms are listed.
| GO term ID | Name | Adjp |
|---|---|---|
| GO:0008219 | Cell death | 4.447579E−08 |
| GO:0010941 | Regulation of cell death | 4.447579E−08 |
| GO:0012501 | Programmed cell death | 5.409503E−08 |
| GO:0006915 | Apoptotic process | 5.466988E−08 |
| GO:0043067 | Regulation of programmed cell death | 2.902278E−07 |
| GO:0097193 | Intrinsic apoptotic signaling pathway | 4.205507E−07 |
| GO:0097190 | Apoptotic signaling pathway | 4.949351E−07 |
| GO:0042981 | Regulation of apoptotic process | 6.67383E−07 |
| GO:0072331 | Signal transduction by p53 class mediator | 7.248333E−07 |
| GO:0050896 | Response to stimulus | 7.321667E−07 |
| GO:0007154 | Cell communication | 1.104964E−06 |
| GO:0051716 | Cellular response to stimulus | 1.532609E−06 |
| GO:0023052 | Signaling | 2.587082E−06 |
| GO:0007165 | Signal transduction | 2.587082E−06 |
| GO:0009966 | Regulation of signal transduction | 5.993752E−06 |
| GO:0072332 | Intrinsic apoptotic signaling pathway by p53 class | 1.671799E−05 |
| GO:0048583 | Regulation of response to stimulus | 3.853858E−05 |
| GO:2001233 | Regulation of apoptotic signaling pathway | 3.893307E−05 |
| GO:0010646 | Regulation of cell communication | 4.168569E−05 |
| GO:0007166 | Cell surface receptor signaling pathway | 4.430113E−05 |
| GO:0023051 | Regulation of signaling | 5.136280E−05 |
| GO:0010942 | Positive regulation of cell death | 8.303541E−05 |
| GO:0043065 | Positive regulation of apoptotic process | 1.220935E−04 |
| GO:0048584 | Positive regulation of response to stimulus | 1.220935E−04 |
| GO:0009968 | Negative regulation of signal transduction | 1.220935E−04 |
Table 2
Contribution of transcription factors P53, ATF4, and E2F to differentially expressed genes (DEGs) in CB002-analog #4 treated cells.
The total number of DEGs that overlapped with known genes of each transcription factor was calculated. This total is reflected in the ‘number of genes in DEG’ column. Using this number, we then calculated the ratio of DEGs divided by the total of genes in the transcription factor data set.
| Transcription factor | Number of genes in DEG | Number in data set | Ratio |
|---|---|---|---|
| P53 | 73+10+2+17=102 | 343 | 0.3 |
| ATF4 | 127+10+19+2=158 | 559 | 0.28 |
| E2F | 17+2+19+210=248 | 1444 | 0.17 |
Table 3
Enriched biological process Gene ontology (GO) terms in the 3362 differentially expressed genes (DEGs).
GO analysis for all DEGs by analog #4 treatment. GO term analysis was done using the R package ‘goseq’ and those genes enriched in particular biological process are described along with their adjp value. Top 20 enriched GO terms are listed.
| GO term ID | Name | Adjp |
|---|---|---|
| GO:0022402 | Cell cycle process | 7.751840E−16 |
| GO:0000278 | Mitotic cell cycle | 7.751840E−16 |
| GO:0007049 | Cell cycle | 2.753525E−15 |
| GO:1903047 | Mitotic cell cycle process | 2.753525E−15 |
| GO:0044770 | Cell cycle phase transition | 3.654863E−13 |
| GO:0006260 | DNA replication | 5.207792E−13 |
| GO:0044772 | Mitotic cell cycle phase transition | 1.192425E−11 |
| GO:0006261 | DNA-dependent DNA replication | 2.919748E−11 |
| GO:0007059 | Chromosome segregation | 3.095763E−11 |
| GO:0044786 | Cell cycle DNA replication | 3.986797E−11 |
| GO:0051301 | Cell division | 1.520253E−10 |
| GO:0000280 | Nuclear division | 1.693587E−09 |
| GO:0098813 | Nuclear chromosome segregation | 1.985723E−09 |
| GO:0033260 | Nuclear DNA replication | 2.161431E−09 |
| GO:0000819 | Sister chromatid segregation | 1.299694E−08 |
| GO:0044843 | Cell cycle G1/S-phase transition | 5.548849E−08 |
| GO:0071103 | DNA conformation change | 6.704071E−08 |
| GO:0048285 | Organelle fission | 7.309501E−08 |
| GO:0051726 | Regulation of cell cycle | 9.496568E−08 |
| GO:0000070 | Mitotic sister chromatid segregation | 1.696716E−07 |
Additional files
-
Source data 1
Gel blots.
- https://cdn.elifesciences.org/articles/70429/elife-70429-data1-v1.zip
-
Supplementary file 1
Table includes gene expression values of DMSO vehicle control and analog #4 SW480 treated cells at 12 hr samples analyzed by microarray Affymetrix Human Gene 2.0 ST array probe set.
Experiment included duplicates of each condition. Gene expression low expression cutoff of probe signal intensity was set at 50 (unless at least one sample did not meet this criteria for that particular probe). Normalization was performed using the RMA method and Limma eBayes for the statistical method. The present table includes values without the FDR of <0.05 filter and therefore referred as all genes. Data set applies to Figure 2 and Figure 2—figure supplements 1–11.
- https://cdn.elifesciences.org/articles/70429/elife-70429-supp1-v1.xlsx
-
Supplementary file 2
Table includes gene names of DMSO vehicle control and analog #4 SW480 treated cells at 12 hr samples analyzed by microarray Affymetrix Human Gene 2.0 ST array probe set.
The present table includes gene names without the FDR of <0.05 filter and therefore referred as all genes. Genes that met the FDR of <0.05 filter are referred as the differentially expressed genes (DEGs). Gene names from the data sets were compared to the Fisher Table S3 data set referred as the known p53 target gene set (Fischer, 2017).
- https://cdn.elifesciences.org/articles/70429/elife-70429-supp2-v1.xlsx
-
Supplementary file 3
Table includes protein information of all proteins detected in DMSO vehicle control, CB002 and analog #4 SW480 treated cells at 24 hr samples (performed in triplicates) analyzed by LC-MS/MS.
The present table includes protein names and their expression values without the FDR of 1% as a filter and therefore referred as raw proteomic data.
- https://cdn.elifesciences.org/articles/70429/elife-70429-supp3-v1.xlsx
-
Transparent reporting form
- https://cdn.elifesciences.org/articles/70429/elife-70429-transrepform-v1.pdf
Download links
A two-part list of links to download the article, or parts of the article, in various formats.
Downloads (link to download the article as PDF)
Open citations (links to open the citations from this article in various online reference manager services)
Cite this article (links to download the citations from this article in formats compatible with various reference manager tools)
A subset of CB002 xanthine analogs bypass p53-signaling to restore a p53 transcriptome and target an S-phase cell cycle checkpoint in tumors with mutated-p53
eLife 10:e70429.
https://doi.org/10.7554/eLife.70429


