Competitive binding of MatP and topoisomerase IV to the MukB hinge domain
- Department of Biochemistry, University of Oxford, United Kingdom
- Physical and Theoretical Chemistry Laboratory, University of Oxford, United Kingdom
- The Kavli Institute for Nanoscience Discovery, United Kingdom
Figures
Figure 1 with 1 supplement
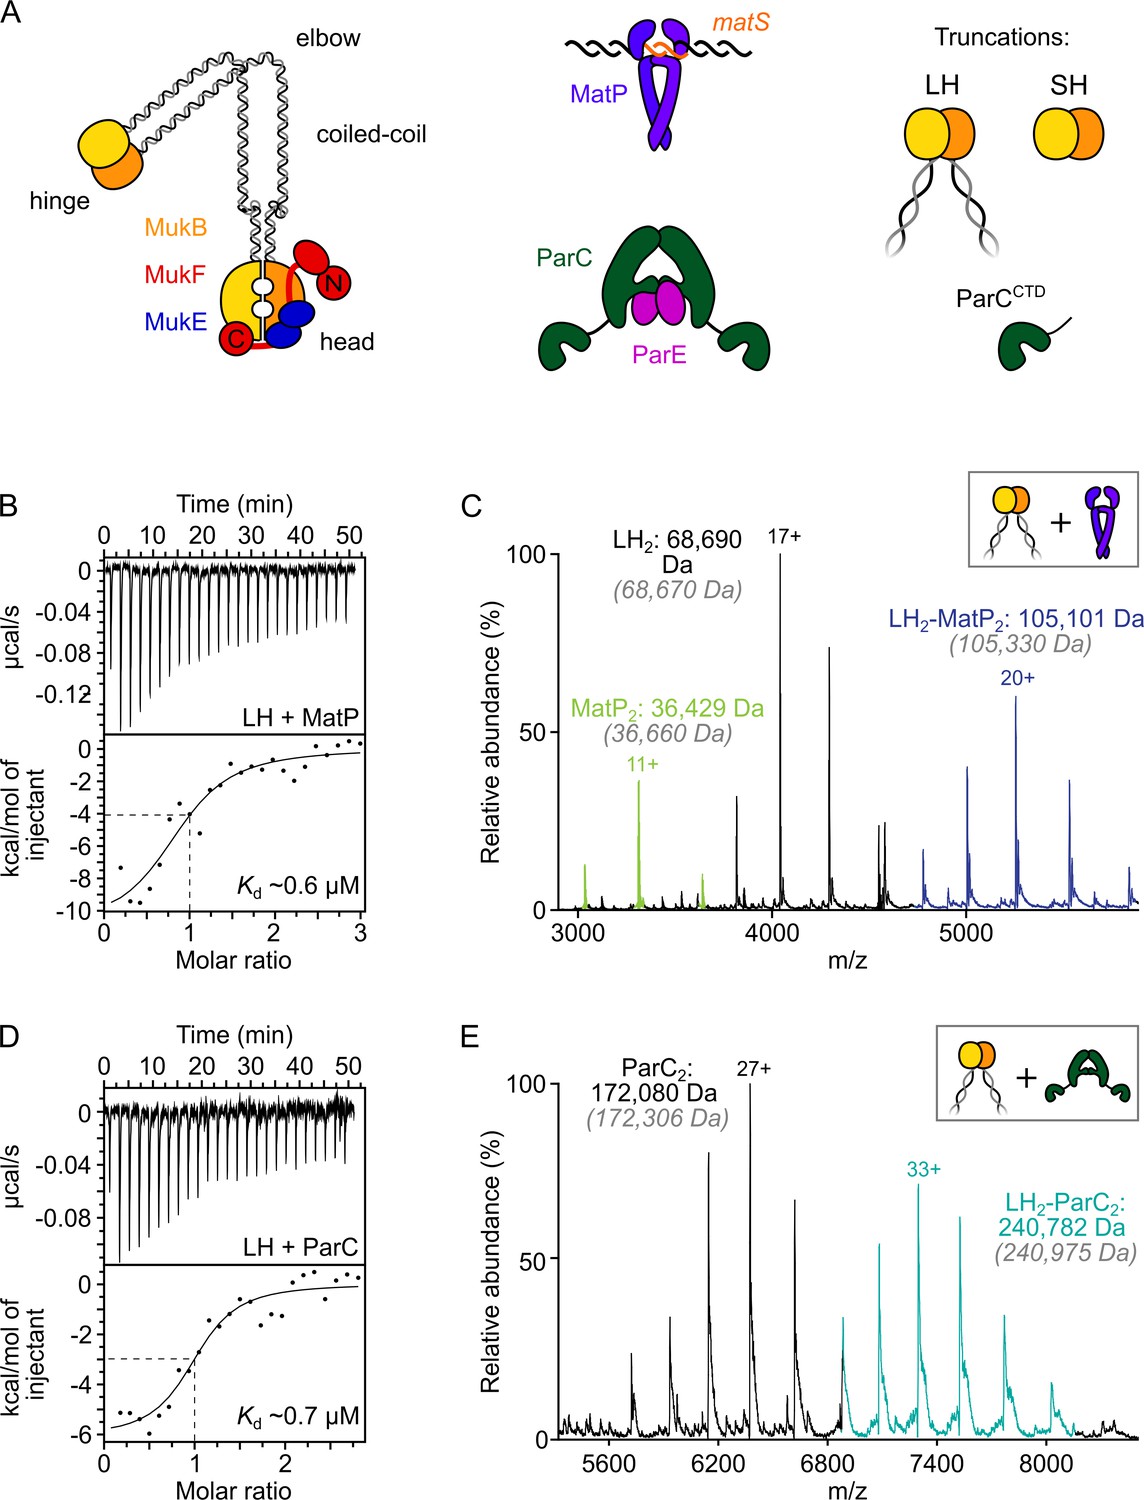
ParC dimers and MatP dimers each bind the dimeric MukB hinge with a 1:1 stoichiometry.
(A) Schematics of the basic units of MukBEF complexes, topoIV and a MatP2-matS complex. (B) Example isothermal titration calorimetry (ITC) raw thermogram and binding isotherm following titration of 100 µM MatP into 10 µM long hinge (LH) at 25 °C. The raw data from each experiment were fitted to a one-site model. n = 0.96 ± 0.08 (± SD), Kd = 0.59 ± 0.04 µM (± SD), ΔH = –16.8 ± 2.2 (± SD) kcal/mol and ΔS = –27.8 ± 4.1 (± SD) cal/mol/deg. Three experimental repeats. (C) Native mass spectrometry (nMS). MatP was incubated at a twofold molar excess with LH before injection. An example spectrum is shown with the only detected LH-MatP complex highlighted in purple. Gray italics denote the theoretical mass of complexes. (D) ITC raw thermogram and binding isotherm following titration of 100 µM LH into 10 µM ParC at 25 °C. The raw data from each experiment were fitted to a one-site model. n = 0.84 ± 0.11 (± SD), Kd = 0.69 ± 0.11(± SD) µM, ΔH = –7.48 ± 1.3 (± SD) kcal/mol and ΔS = –3.12 ± 1.4 (± SD) cal/mol/deg. Three experimental repeats. (E) nMS. ParC was incubated at a 2-molar excess with LH before injection. An example spectrum is shown with only the LH2-ParC2 complex (1:1) detected and highlighted in cyan.
Figure 1—figure supplement 1
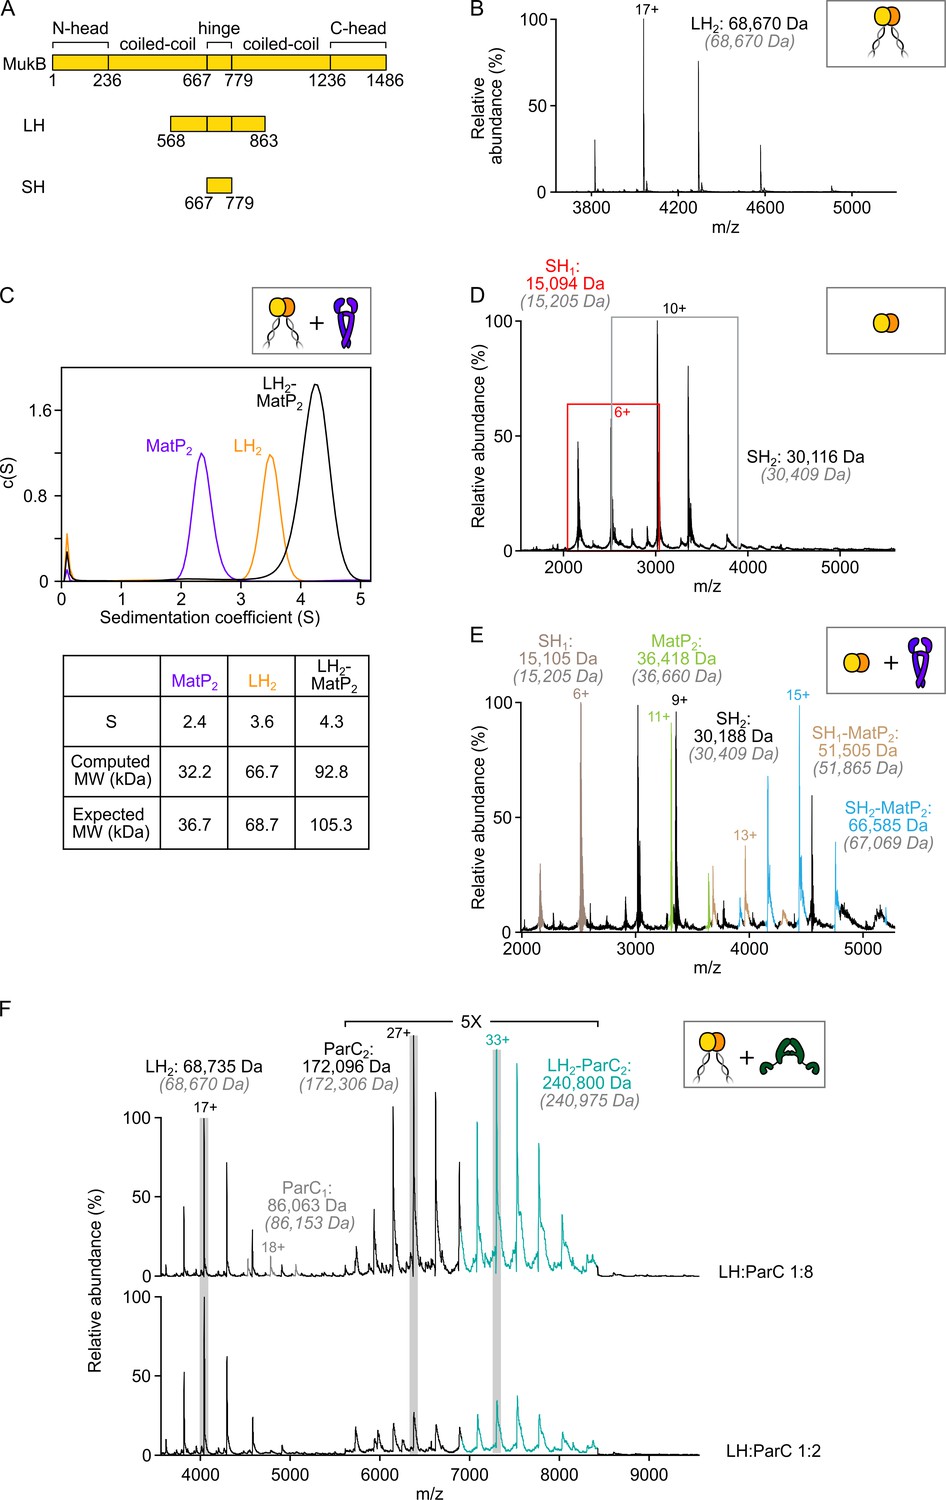
MatP dimers interact with the MukB hinge domain.
(A) Schematic of the functional domains of MukB and hinge-based truncations (long hinge [LH] and short hinge [SH]). (B) Native mass spectrometry (nMS) confirming that LH is a stable dimer. (C) Sedimentation velocity (SV-AUC) experiments showing complex formation between MatP2 and LH2. (D) Mass spectrum showing SH MukB is a monomer/dimer mix at tens of µM concentrations. Peaks corresponding to monomeric species are boxed in red. Gray italics denote the theoretical mass of complexes. (E) Representative spectrum showing binding of MatP to SH MukB. (F) nMS titration experiment with ParC at a two-fold and eight-fold molar excess relative to LH. In both cases, a 1:1 LH2:ParC2 complex is detected only. ‘ParC1’ refers to monomeric ParC, whilst ‘ParC2’ refers to the native dimeric form.
Figure 2 with 1 supplement

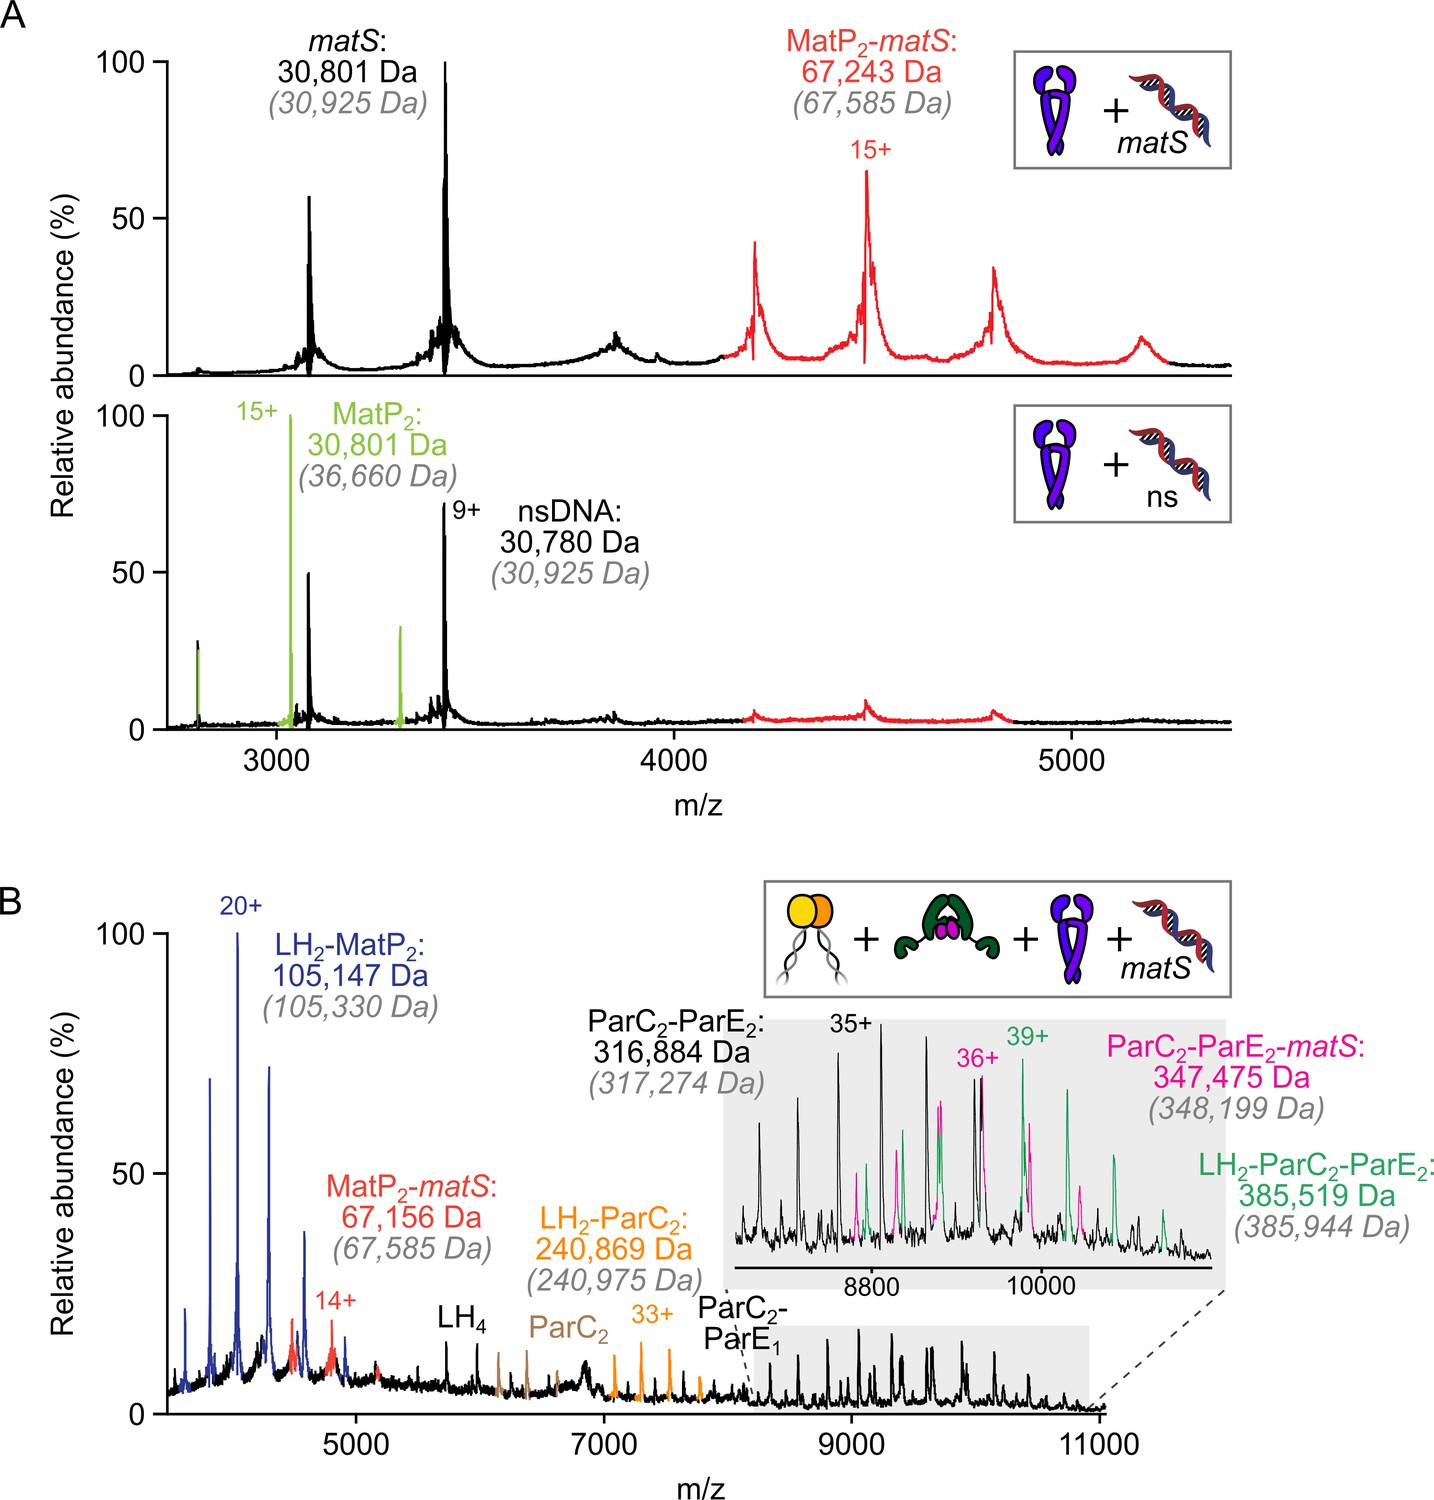
The MukB hinge does not form ternary complexes with MatP dimers and topoIV.
(A) Analytical size-exclusion chromatography (SEC). Long hinge (LH), MatP, and ParCCTD were co-incubated at a 1:2:2 ratio at µM concentrations for 1 h prior to injection and separated on a Superose 6 Increase column (left). 300 µL elution fractions were analyzed by SDS-PAGE and Coomassie staining (bottom and right). Note that ParCCTD retains its MBP-N-terminal fusion (~46 kDa) for reasons of stability (see Materials and methods). (B–D) Representative mass spectra of complexes detected when co-incubating LH and MatP at a 1:2 ratio with two equivalents of either ParCCTD (B), ParC alone (C), or topoIV heterotetramers (D). Regions of the spectra are magnified, where indicated, to highlight detection of less abundant species. Gray italics denote the theoretical mass of complexes.
-
Figure 2—source data 1
Raw data and uncropped gels for Figure 2A.
- https://cdn.elifesciences.org/articles/70444/elife-70444-fig2-data1-v2.zip
-
Figure 2—source data 2
Raw data for analytical size-exclusion chromatography of Figure 2A.
- https://cdn.elifesciences.org/articles/70444/elife-70444-fig2-data2-v2.xlsx
Figure 2—figure supplement 1
The MukB hinge does not form ternary complexes with MatP-matS complexes and topoIV.
(A) Representative mass spectra indicating that 50 bp matS-containing DNA specifically binds MatP dimers under the conditions used. MatP and DNA was mixed at 1:1. Gray italics denote the theoretical mass of complexes. (B) Representative mass spectrum demonstrating that MatP2-matS does not stably interact with either the hinge domain (long hinge [LH]) of MukB or LH2-topoIV complexes.
Figure 3 with 1 supplement
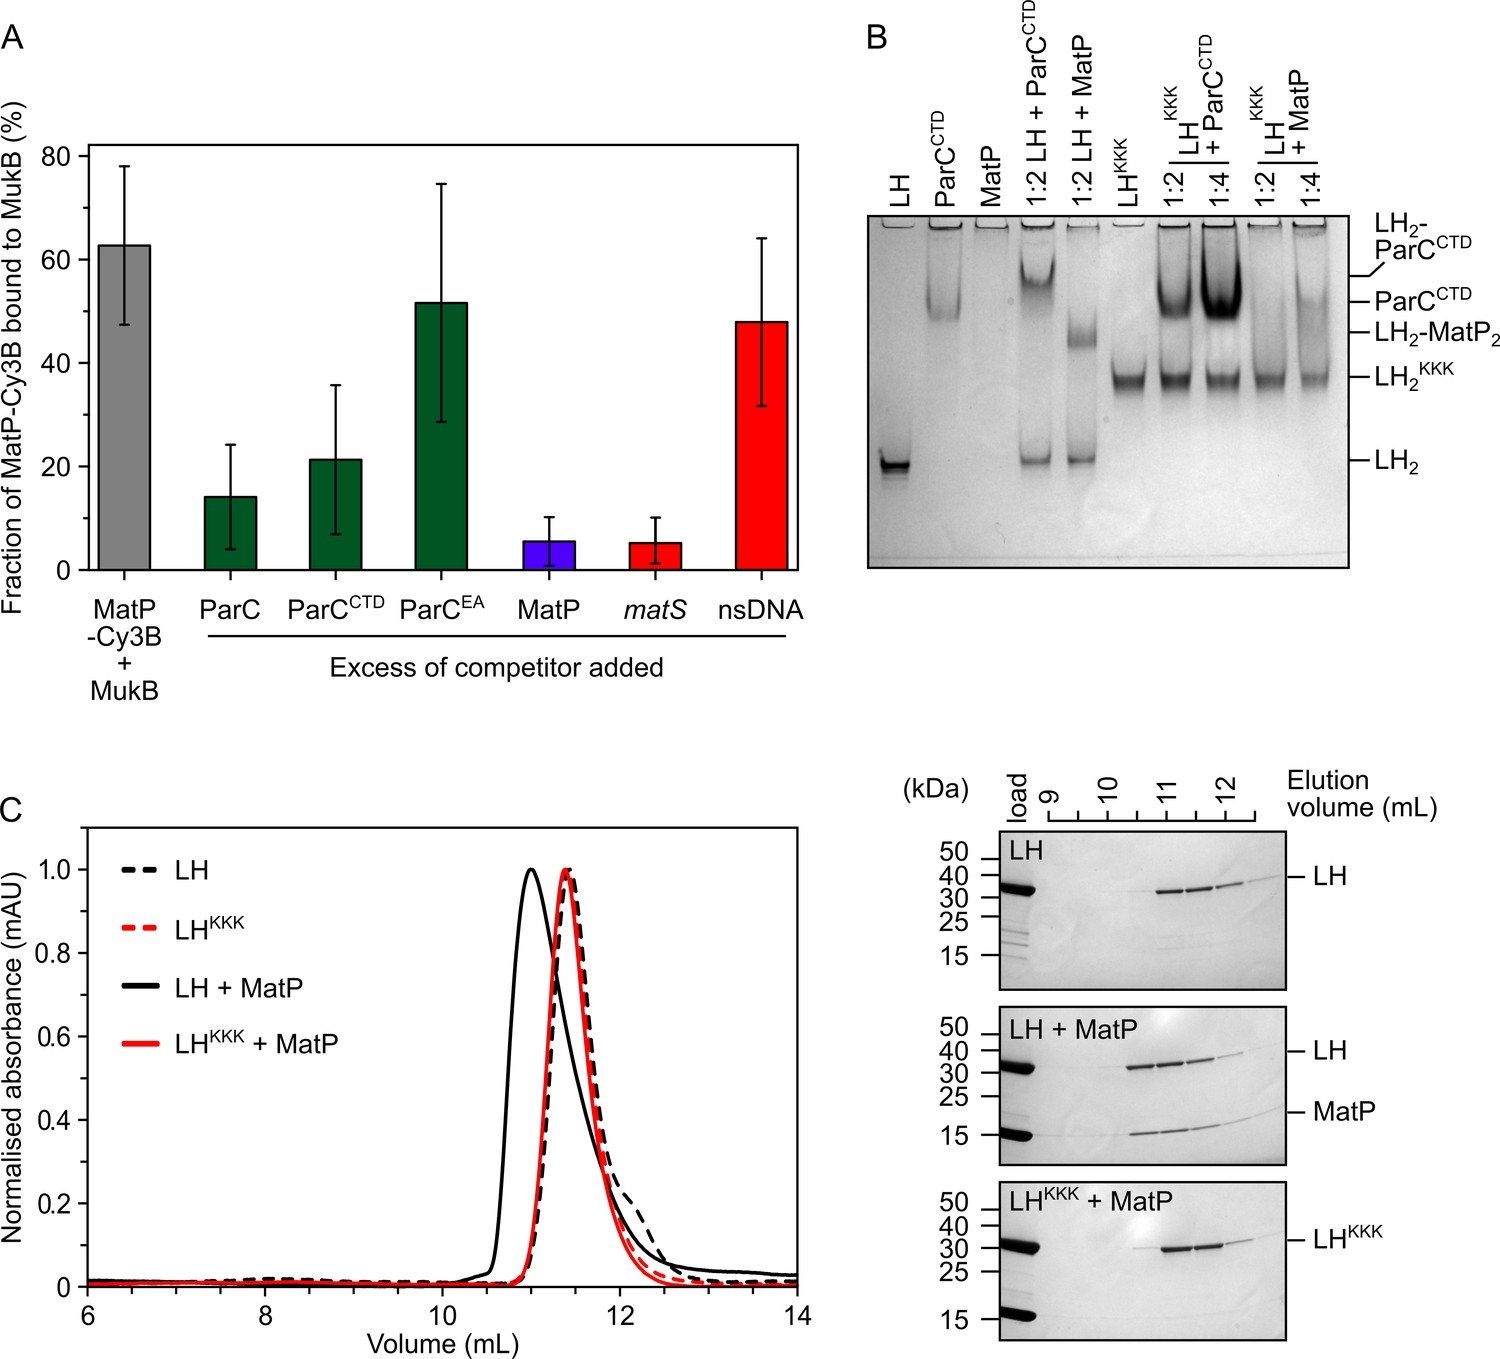
MatP and ParC compete for binding to overlapping sites on the MukB hinge.
(A) Fluorescence correlation spectroscopy (FCS) measurements of competition for binding between ParC and MatP for MukB and also between MatP and 15 bp DNA hairpins, containing a 13 bp matS2 site or non-specific sequence, for MukB. Cy3B-labeled (MatP) was fixed at 1 nM and wild-type (MukB) at 400 nM; this achieved ~60% binding of all MatP-Cy3B to MukB. Autocorrelation curves were fit to a two-component equation (Equation 2) with the diffusion time of Cy3B-MatP fixed to 4.5 ms (), whilst the diffusion time () of bound complex was allowed to float to obtain the best fitting for the data. All ParC variants, unlabeled MatP, and DNA were added at a 10-, 50-, and 2.5-fold molar excess, respectively. Error bars represent mean ± SD. p-values were determined from two-tailed two-sample t-tests to assess the significance of the effect of competitors upon binding of MatP to MukB: 3.12 × 10–05, 3.53 × 10–03, and 6.02 × 10⁻², for ParC, ParCCTD, and ParCEA, respectively. (B) Native PAGE. Varying ratios of MatP or ParCCTD were incubated with long hinge (LH) (at 3 µM) for 30 min on ice prior to electrophoresis under non-denaturing conditions. All proteins were run alone as a reference for their mobility in an 8% tris-glycine gel. Note, MatP alone poorly enters the gel. Stoichiometries of the complexes formed are inferred from corresponding native mass spectrometry (nMS) data (Figure 1C and E, Figure 2B). (C) Analytical size-exclusion chromatography (SEC). Either wild-type LH or the LHKKK variant, which is defective in ParC binding (Hayama et al., 2013), was co-incubated with MatP at a 1:2 ratio with LH (at 20 µM) for 1 h on ice prior to injection and separated on a Superose 6 Increase column (left). 500 µL elution fractions were analyzed by SDS-PAGE and Coomassie staining (right). Free MatP dimers elute as a peak at ~15 mL.
-
Figure 3—source data 1
Raw data and uncropped gel for Figure 3B.
- https://cdn.elifesciences.org/articles/70444/elife-70444-fig3-data1-v2.zip
-
Figure 3—source data 2
Raw data and uncropped gels for Figure 3C.
- https://cdn.elifesciences.org/articles/70444/elife-70444-fig3-data2-v2.zip
-
Figure 3—source data 3
Raw data for analytical size-exclusion chromatography of Figure 3C.
- https://cdn.elifesciences.org/articles/70444/elife-70444-fig3-data3-v2.xlsx
Figure 3—figure supplement 1
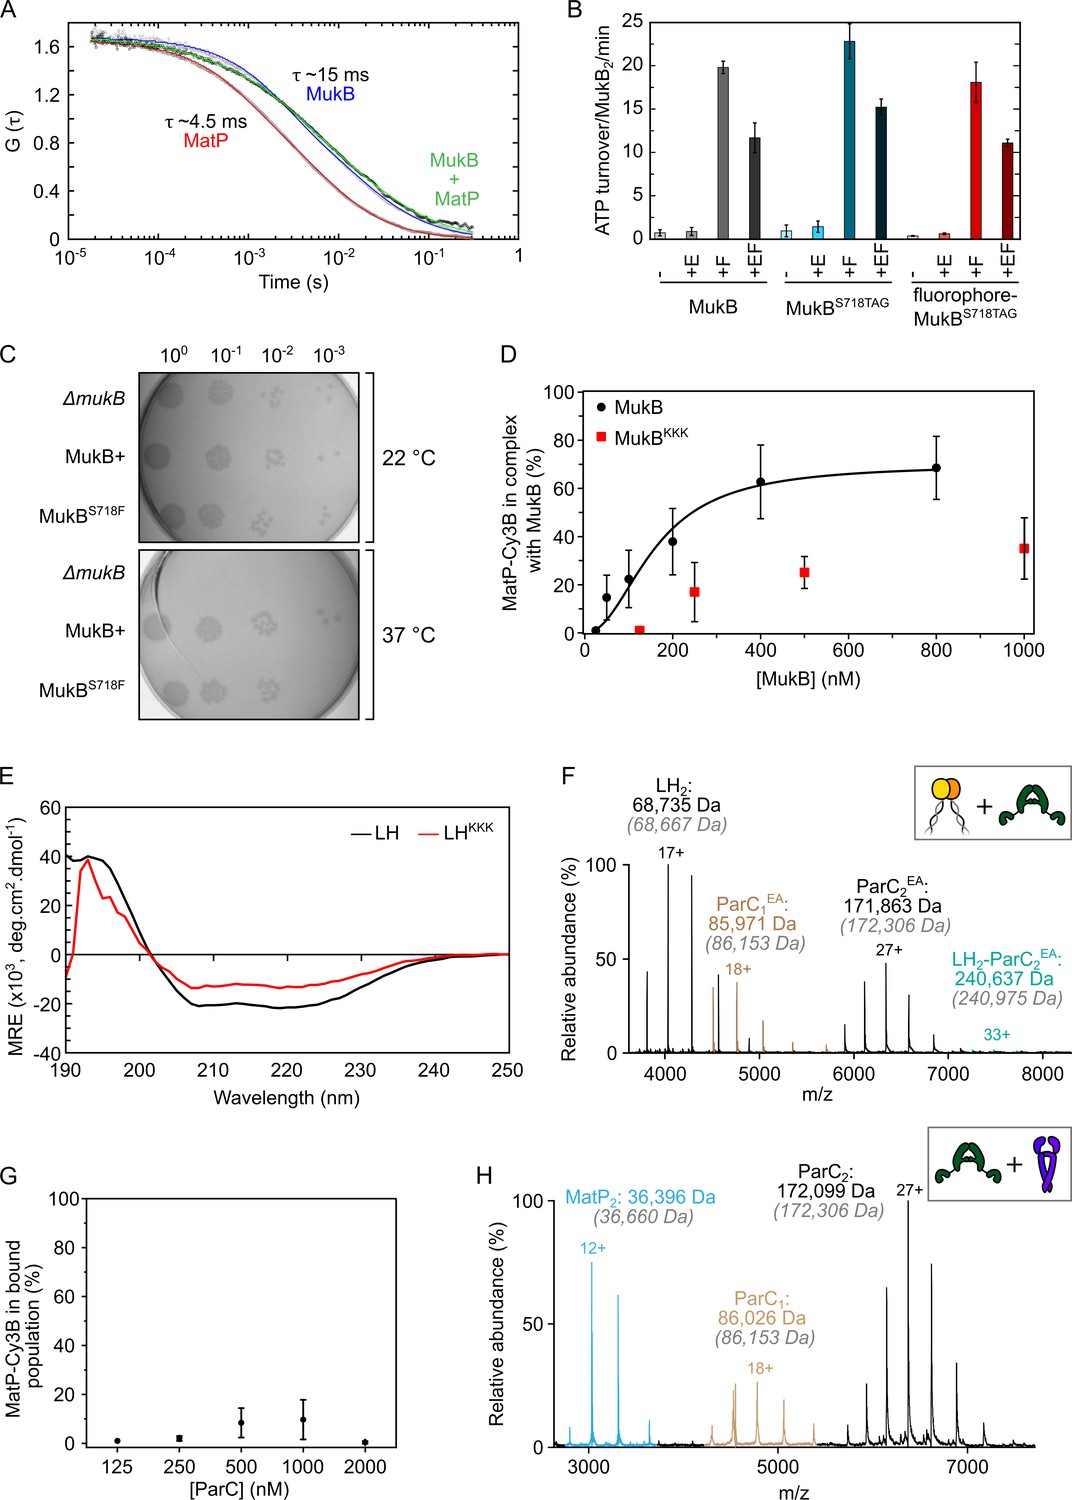
MatP and ParC compete for binding to overlapping sites on the MukB hinge.
(A) Autocorrelation curves of Cy3B-MatP (1 nM, red), TAMRA-MukBS718TAG (1 nM, blue), and a mixture of Cy3B-MatP (1 nM) and unlabeled MukB (400 nM, green). Measured diffusion times of Cy3B-MatP, TAMRA-MukB, and MukB bound Cy3B-MatP were ~4.5 ms, ~15 ms, and 20–50 ms, respectively. Curves are normalized to allow for comparison of the data. (B) ATPase assay verifying that MukB with an amber stop codon substituted in place of S718, and with subsequent fluorophore conjugation at this position, is functional in terms of absolute ATP turnover rate and also ATPase stimulation and inhibition by MukF and MukE, respectively (Zawadzka et al., 2018). Error bars represent mean ± SD. (C) In vivo analysis of the suitability of residue S718 of MukB for substitution to a Phe-like unnatural amino acid (p-azidophenylalanine). MukBS718F-expressing cells displayed no impaired phenotype, as judged by temperature-sensitive growth in rich medium at 22°C and 37°C. Basal levels of plasmid-borne MukB and MukBS718F were expressed from cells carrying a chromosomal MukB deletion (Zawadzki et al., 2015). ΔmukB control cells carried the empty plasmid. (D) Determination of binding affinity of full-length MukB and MukBKKK using Cy3B-labeled MatP in fluorescence correlation spectroscopy (FCS). Titrations were performed at a constant concentration of MatP-Cy3B (1 nM). Complex percentage was set as 99% at 25 nM MukB for optimal fitting. The data were fitted to the Hill equation. Error bars represent mean ± SD. (E) Circular dichroism (CD) spectra of wild-type long hinge (LH) and the LHKKK variant. (F) Representative mass spectrum confirming that the previously characterized ParCR705E,R729A (ParCEA) variant (Hayama and Marians, 2010) is defective in binding to the MukB hinge domain. Gray italics denote the theoretical mass of complexes. (G) FCS titration assay. ParC does not interact with MatP directly. Error bars represent mean ± SD. (H) Representative mass spectrum demonstrating that ParC and MatP do not physically interact.
-
Figure 3—figure supplement 1—source data 1
Raw and fitted data for autocorrelation curves in Figure 3—figure supplement 1A.
- https://cdn.elifesciences.org/articles/70444/elife-70444-fig3-figsupp1-data1-v2.xlsx
-
Figure 3—figure supplement 1—source data 2
Raw data for triplicate ATPase assay in Figure 3—figure supplement 1B.
- https://cdn.elifesciences.org/articles/70444/elife-70444-fig3-figsupp1-data2-v2.xlsx
-
Figure 3—figure supplement 1—source data 3
Tabulated data including fitted data for Figure 3—figure supplement 1D.
- https://cdn.elifesciences.org/articles/70444/elife-70444-fig3-figsupp1-data3-v2.xlsx
-
Figure 3—figure supplement 1—source data 4
Raw data of that presented in Figure 3—figure supplement 1E.
- https://cdn.elifesciences.org/articles/70444/elife-70444-fig3-figsupp1-data4-v2.xlsx
Figure 4 with 1 supplement
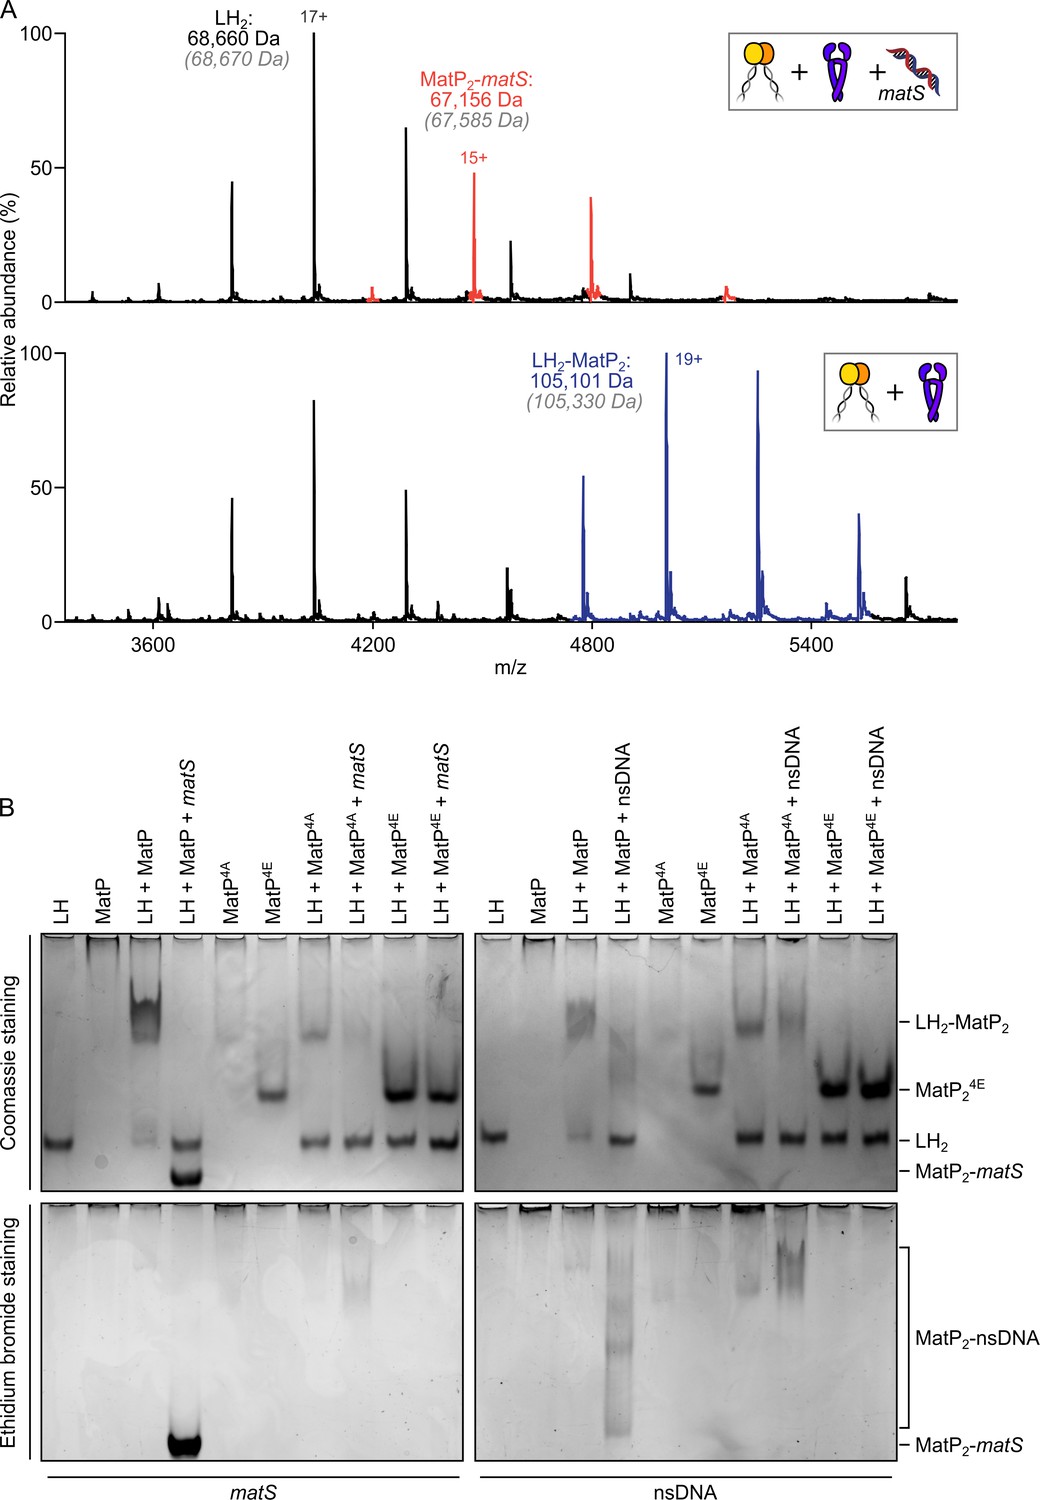
matS sites compete with the hinge for MatP binding.
(A) Representative mass spectra of species detected between long hinge (LH) and MatP in the presence of matS DNA. LH, MatP, and in the case of the upper panel matS, were mixed at 1:2:1. Gray italics denote the theoretical mass of complexes. (B) Native PAGE. Formation of LH2-MatP2-matS ternary complexes were not detected. MatP4A (K71A, Q72A, R75A, and R77A) and MatP4E (K71E, Q72E, R75E, and R77E) are impaired in binding to the MukB hinge domain and to DNA. Samples were loaded onto two equivalent native gels – one for Coomassie staining and one for ethidium bromide staining. Stoichiometries of the complexes formed are inferred from corresponding native mass spectrometry (nMS) data (A, Figure 4—figure supplement 1, and Figure 2—figure supplement 1A).
-
Figure 4—source data 1
Raw data and uncropped gels for Figure 4B.
- https://cdn.elifesciences.org/articles/70444/elife-70444-fig4-data1-v2.zip
Figure 4—figure supplement 1
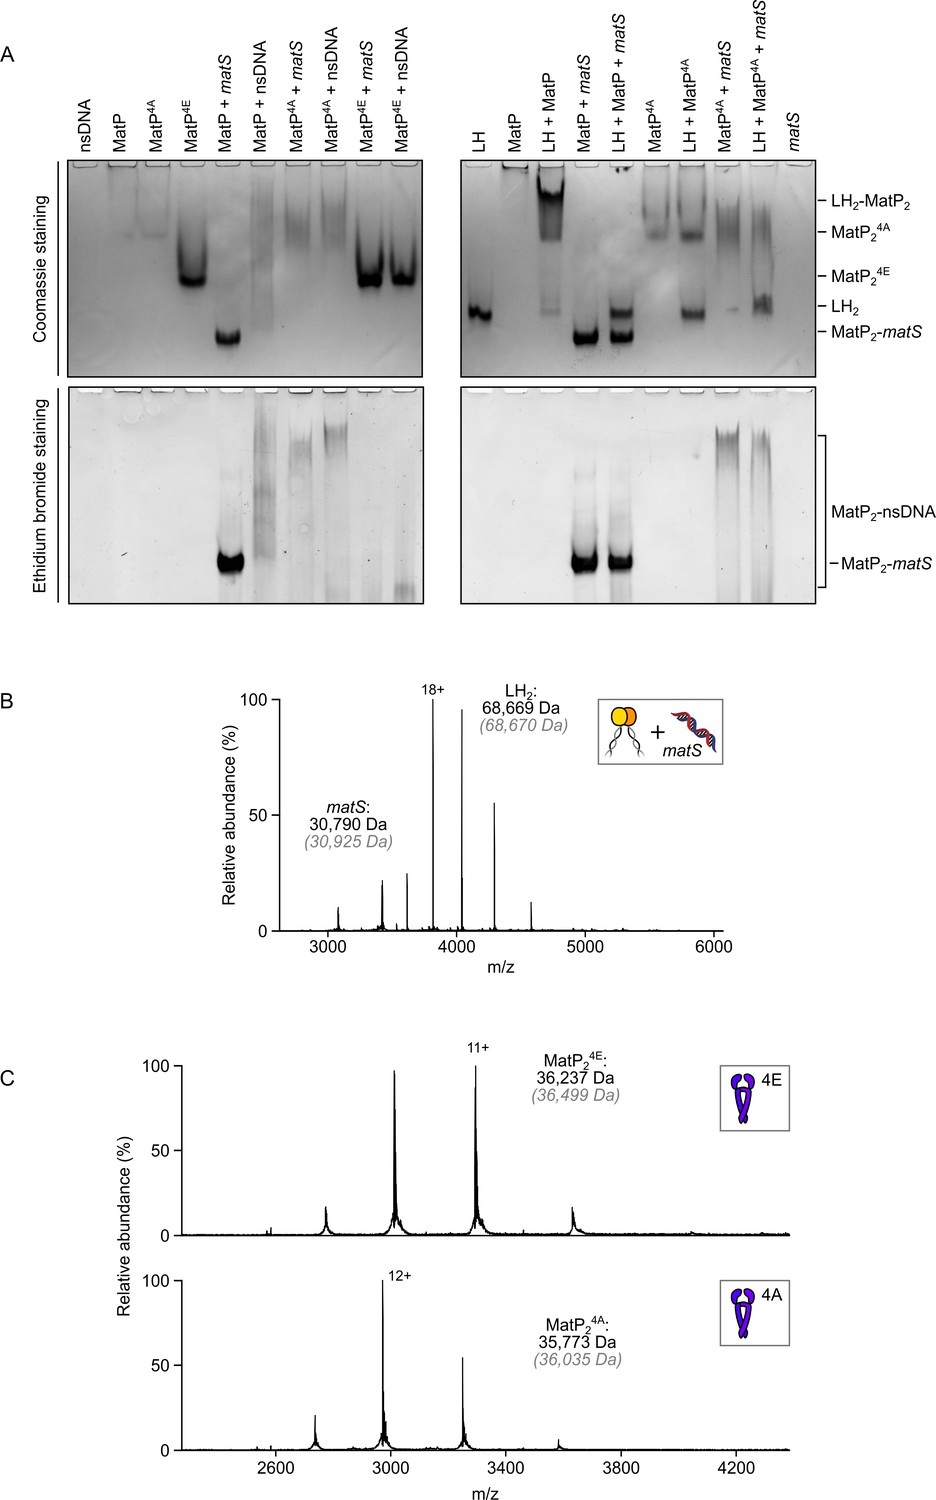
matS sites compete with the MukB hinge for MatP binding.
(A) Native PAGE analysis of impaired long hinge (LH) and matS/non-specific DNA binding by MatP4A (K71A, Q72A, R75A, and R77A) and MatP4E (K71E, Q72E, R75E, and R77E). Gels were stained with Coomassie blue and ethidium bromide to identify nucleoprotein complexes. Stoichiometries of the complexes formed are inferred from corresponding native mass spectrometry (nMS) data (Figure 1C, Figure 2—figure supplement 1A and Figure 4—figure supplement 1C ). (B) nMS experiments ascertained that the hinge domain of MukB cannot stably bind 50 bp DNA. (C) nMS confirms that MatP4A and MatP4E variants are stable dimers. Their Gaussian distribution of charge states is indicative of the folded nature of these variants.
-
Figure 4—figure supplement 1—source data 1
Raw data and uncropped gels for Figure 4—figure supplement 1A.
- https://cdn.elifesciences.org/articles/70444/elife-70444-fig4-figsupp1-data1-v2.zip
Figure 5 with 1 supplement
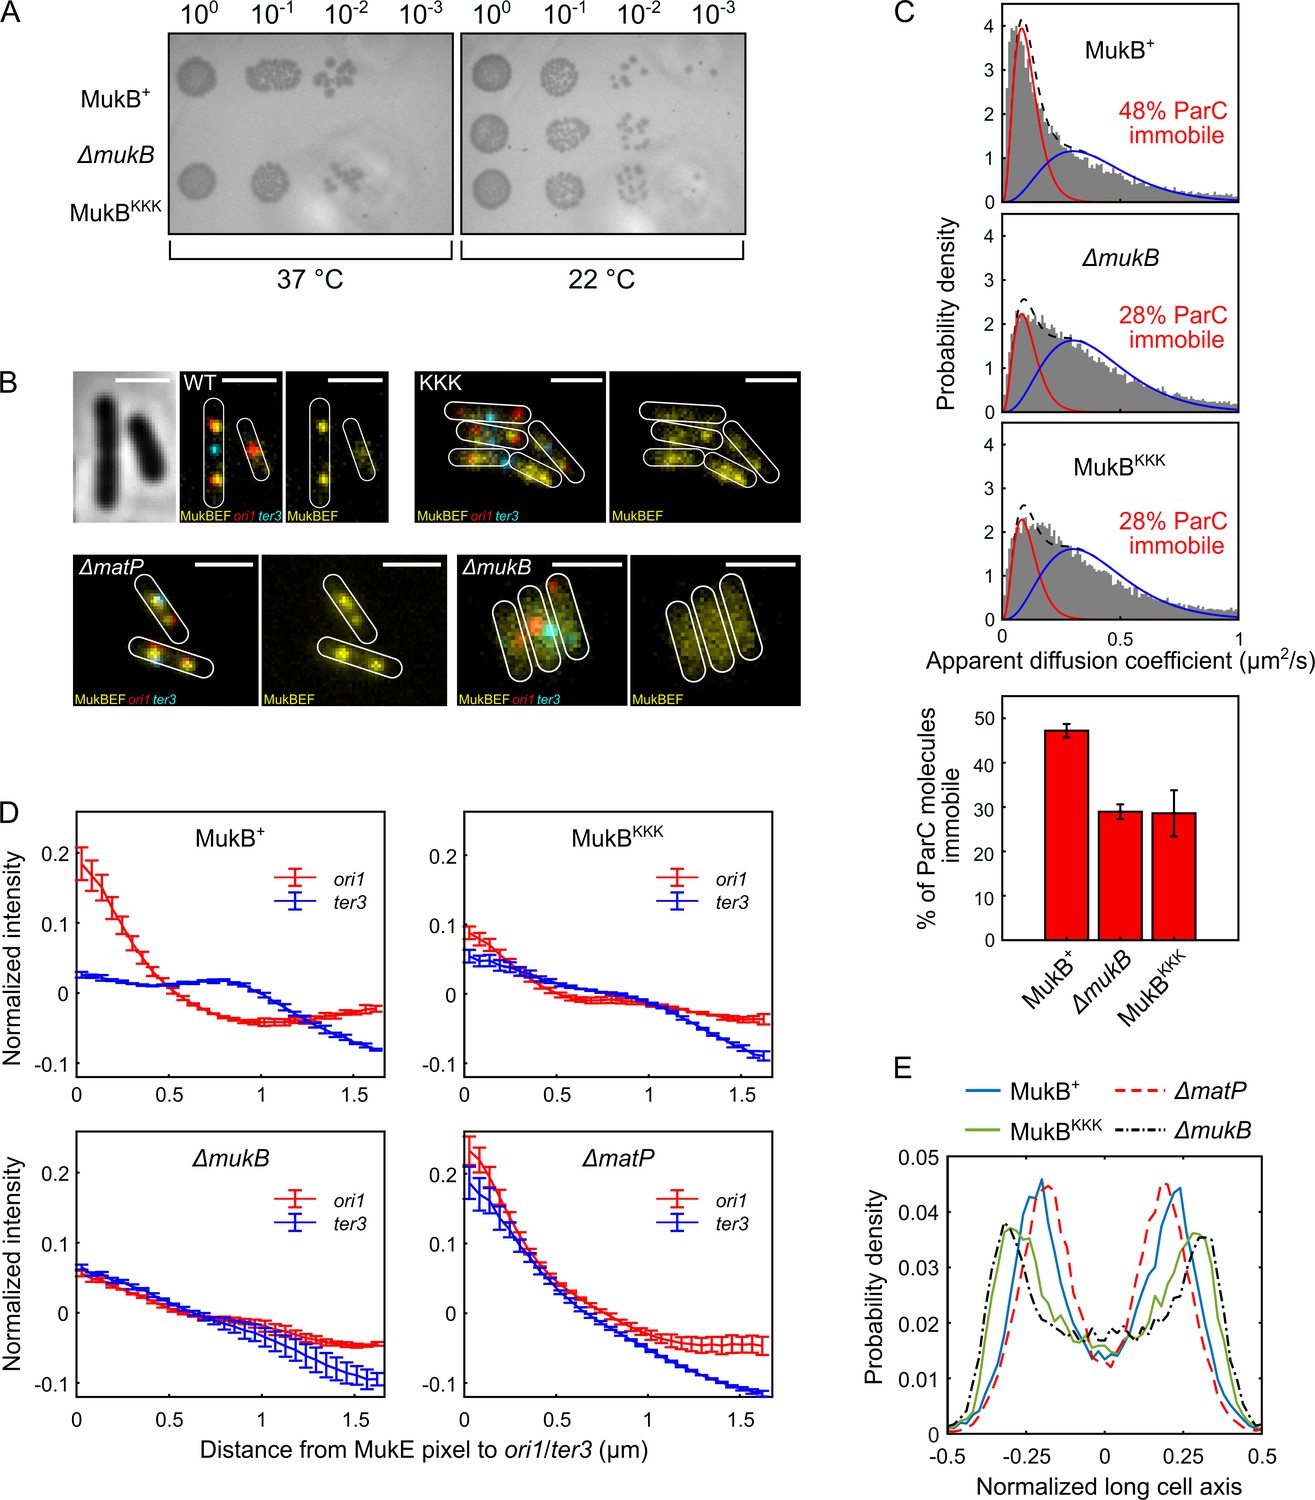
Cells expressing MukBKKK are impaired in ParC binding and exhibit defects in MukBEF function.
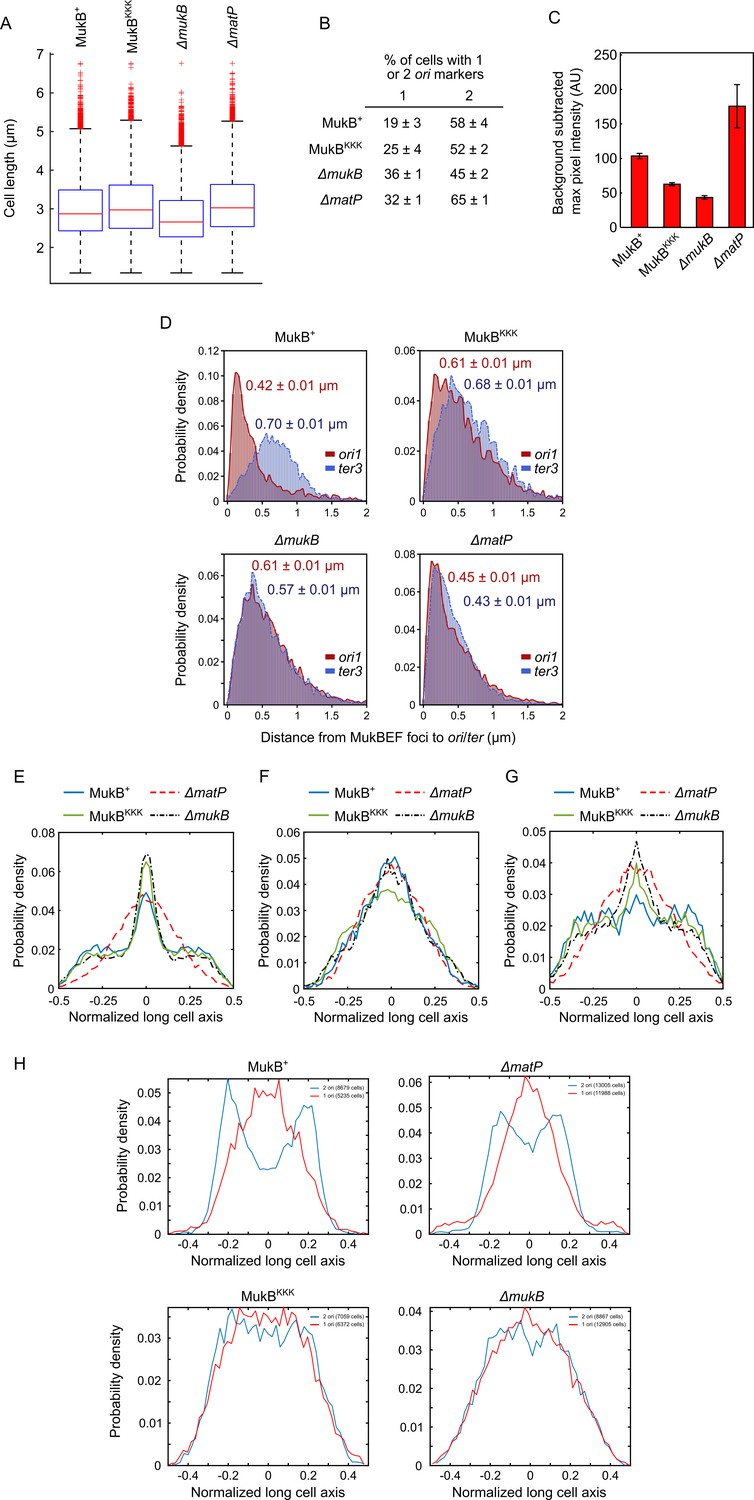
(A) MukBEF phenotype of MukB+, MukBKKK, and ΔmukB cells as judged by temperature-sensitive growth in rich medium (LB) at 22°C and 37°C. Basal levels of plasmid-borne MukB and MukBKKK were expressed from cells carrying a chromosomal MukB deletion Zawadzka et al., 2018. ΔmukB control cells carried the empty plasmid. Two biological repeats gave the same result. (B) Representative fluorescence images with cell borders of ΔmukB cells with fluorescently labeled MukE (mYPet), ori1(mCherry), and ter3 (mCerulean) (AU2118; lacO240 @ori1 (3908) (hyg), tetO240@ter3 (1644) (gen), ΔleuB::Plac-lacI-mCherry-frt, ΔgalK::Plac-tetR-mCerulean-frt, mukE-mYPet ΔaraBAD::FRT (AraC+) FRT-T1-T2-Para-ΔmukB::kan) (Mäkelä and Sherratt, 2020; Nolivos et al., 2016), expressing basal levels of pBAD24 plasmid-borne WT MukB, MukBKKK, and empty pBAD24 plasmid control (ΔmukB). ΔmatP cells expressing MukBEF under the native smtA-mukBEF promoter, with fluorescently labeled MukE, ori1, and ter3 labeled MukB, ori1, and ter3 (SN302) (Mäkelä and Sherratt, 2020) Scale bars: 2 μm. Wild-type (WT) MukB, 4837 cells; MukBKKK, 5846 cells; ΔmukB, 10,670 cells; ΔmatP, 17,933 cells. For median cell lengths, see Figure 5—figure supplement 1A. (C) Single-molecule tracking (photoactivated localization microscopy [PALM]) of ParC-PAmCherry molecules in ΔmukB cells (PZ129) Prince et al., 2021; Zawadzki et al., 2015 complemented with basal levels of plasmid-expressed WT MukB or MukBKKK; control ΔmukB cells contained an empty plasmid. For each condition, the distribution of ParC apparent diffusion coefficients was fitted to a two-species model as in Prince et al., 2021; Zawadzki et al., 2015. Bar chart shows same data, with SD from three experimental repeats. (D) Normalized MukE pixel intensity as a function of distance to ori1/ter3 in asynchronous populations in the strains in (B). WT MukB, 15,391 cells; MukBKKK, 14,777 cells; ΔmukB, 22,807 cells; ΔmatP, 22,623 cells. Error bars denote SD from three repeats. (E) Localization of ori1 along normalized long cell axis in two ori1 cells in the strains in (B). WT MukB, 7750 cells; MukBKKK, 6417 cells; ΔmukB, 19,899 cells; ΔmatP, 11,920 cells. Data from three biological repeats.
Figure 5—figure supplement 1
MukBEF distances to ori1/ter3 and marker localizations.
(A) Box plots of median cell length of data acquired for Figure 5B. Wild-type (WT) MukB, 4837 cells, median cell length 2.87 μm; MukBKKK, 5846 cells, median cell length 2.98 μm; ΔmukB, 10,670 cells, median cell length 2.76 μm; ΔmatP, 17,933 cells, median cell length 3.10 μm. (B) Percentage of cells with either one or two ori1 markers (± SEM). The cell cycle generation times of WT and ΔmukB are comparable (Mäkelä et al., 2021). (C) Background-subtracted maximum pixel intensity in the strains in Figure 5B. Two-sample t-test p-values between MukBKKK and WT MukB, ΔmukB, and ΔmatP are <10–5, 7 × 10⁻⁴, and 0.0034, respectively. There was no significant difference in the average MukE intensity in MukBKKK and WT MukB, ΔmukB, and ΔmatP cells (two-sample t-test p-values 0.55, 0.014, and 0.045, respectively). WT MukB, 15,391 cells; MukBKKK, 14,777 cells; ΔmukB, 22,807 cells; ΔmatP, 22,623 cells. Error bars denote SD from three experimental repeats. (D) Distances between MukBEF foci [measured by the brightest pixel (Mäkelä and Sherratt, 2020; Nolivos et al., 2016)] and ori1/ter3 markers (± SEM); same dataset as in Figure 5D. (E) Localization of ter3 along normalized long cell axis in two ori1 cells in the strains in Figure 5B. WT MukB, 7750 cells; MukBKKK, 6417 cells; ΔmukB, 19,899 cells; ΔmatP, 11,920 cells. Data from three experimental repeats. Localization of (F) ori1 and (G) ter3 along normalized long cell axis in one ori1 cells in the strains in Figure 5B. WT MukB, 7532 cells; MukBKKK, 5655 cells; ΔmukB, 11,470 cells; ΔmatP, 10,019 cells. Data from three experimental repeats. (H) Localization of MukBKKKEF brightest pixels along the normalized long cell axis in 1 and 2 ori1 cells in the strains in Figure 5B. The number of cells analyzed for each condition is indicated in each legend. Data from three experimental repeats.
Tables
Table 1
Theoretical masses of proteins and DNA used in native mass spectrometry (nMS).
Predicted and measured masses of MukBEF, topoIV, and MatP components or variants and also DNA substrates. Errors are the standard deviation in mass determination.
| Protein | Theoretical mass of monomer (Da) * | Measured oligomeric state(s) | Theoretical mass(es) of native state(s) (Da) | Measured mass(es) (Da) |
|---|---|---|---|---|
| LH (MBP cleaved) | 34334.87 | Dimer | 68669.74 | 68668 ± 1 |
| SH-His | 15204.73 | Monomer/dimer mix † | 15204.73/30409.46 | 15105 ± 530188 ± 12 |
| MatP(i.e., MatPΔ18C-His) | 18329.85 | Dimer | 36659.7 | 36418 ± 1 |
| MatP K71E, Q72E, R75E, R77E | 18277.63 | Dimer | 36555.26 | 36429 ± 15 |
| His-ParC | 86152.75 | Dimer | 172305.5 | 172076 ± 2 |
| His-ParC R705E R729A | 86040.57 | Dimer | 172081.14 | 171863 ± 3 |
| MBP-ParCCTD | 73422.74 | Monomer | 73422.74 | 70761 ± 6‡71447 ± 8‡ |
| ParE-His | 72484.36 | Dimer | 144968.72 | 144717 ± 2 |
| 50 bp matS DNA | 30925.10 | N/A | 30766.82 | 30801 ± 14 |
| 50 bp nonspecific DNA | 30925.10 | N/A | 30766.82 | 30780 ± 15 |
-
*
Masses include first methionine.
-
†
From this work.
-
‡
Degradation products.
Additional files
-
Transparent reporting form
- https://cdn.elifesciences.org/articles/70444/elife-70444-transrepform1-v2.docx
-
Source code 1
All custom MATLAB scripts used for analysis of epifluorescence microscopy data in Figure 5 and Figure 5—figure supplement 1.
- https://cdn.elifesciences.org/articles/70444/elife-70444-supp1-v2.zip
Download links
A two-part list of links to download the article, or parts of the article, in various formats.
Downloads (link to download the article as PDF)
Open citations (links to open the citations from this article in various online reference manager services)
Cite this article (links to download the citations from this article in formats compatible with various reference manager tools)
Competitive binding of MatP and topoisomerase IV to the MukB hinge domain
eLife 10:e70444.
https://doi.org/10.7554/eLife.70444


