Robust effects of corticothalamic feedback and behavioral state on movie responses in mouse dLGN
- Division of Neurobiology, Faculty of Biology, LMU Munich, Germany
- Graduate School of Systemic Neurosciences, LMU Munich, Germany
- Bernstein Centre for Computational Neuroscience, Germany
Figures
Figure 1 with 8 supplements

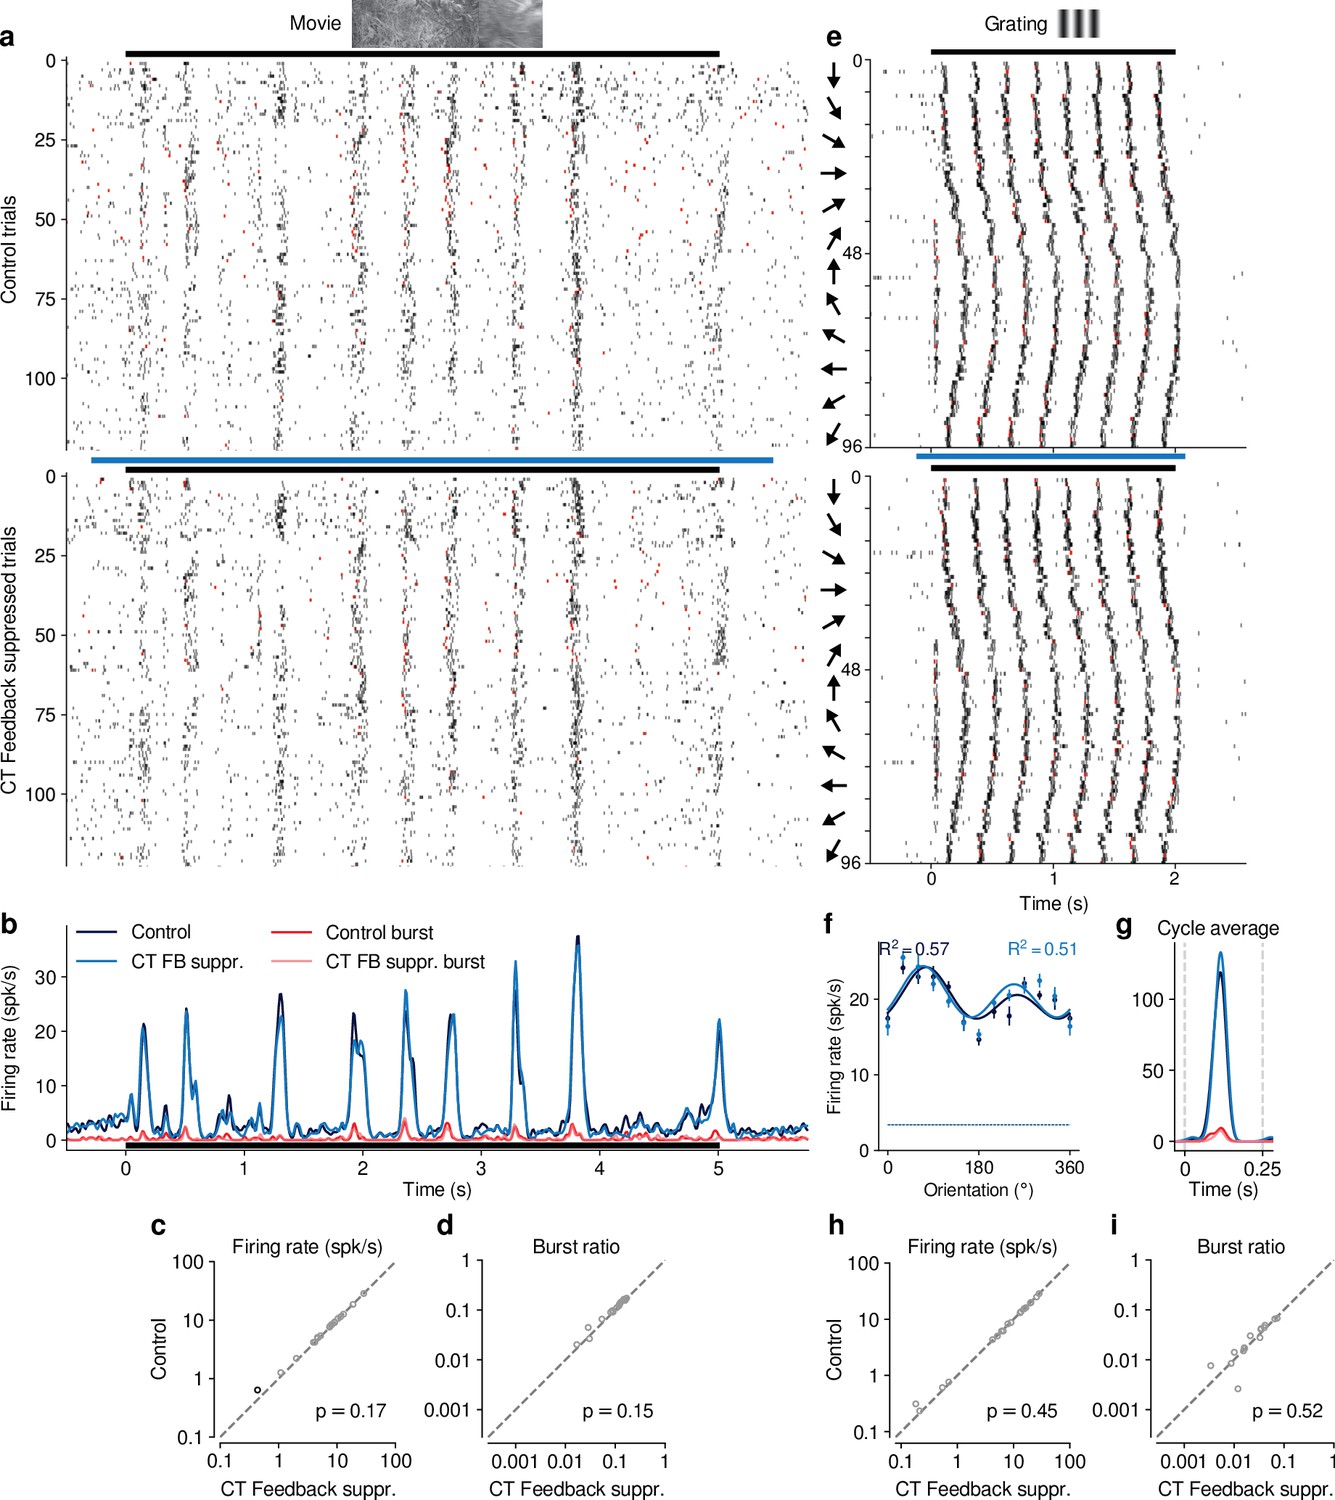
CT feedback modulates dLGN responses to full-screen naturalistic movie clips.
(a) Left: Schematic of experimental setup. Head-fixed mice were placed on a floating Styrofoam ball and visual stimuli were presented on a screen located ∼25 cm away from the animal. Right: ChR2 was conditionally expressed in PV+ inhibitory interneurons (green) in all layers of V1 using a viral approach. Extracellular silicon electrode recordings were performed in dLGN with and without optogenetic suppression of V1. (b) Coronal section close to the V1 injection site for an example PV-Cre mouse (blue: DAPI; green: eYFP; Bregma: -3.4 mm). (c) Coronal section at the dLGN (white outline) recording site, same animal as in (b). For post-mortem confirmation of the electrode position, the back of the probe was stained with DiI (magenta) for one of the recording sessions (blue: DAPI; Bregma: -1.82 mm). (d) Raster plots of an example neuron for 200 presentations of a 5 s naturalistic movie clip, with CT feedback intact (control condition, top) and during V1 suppression (bottom). Red: burst spikes; black bar: movie clip presentation; light blue bar: V1 suppression. (e) Left: PSTHs for both the control (dark blue) and V1 suppression (light blue) conditions. Superimposed are PSTHs of burst spikes only, separately for control (red) and V1 suppression (pink) conditions. Right: Corresponding instantaneous firing rate distributions. (f–i) Comparison of control vs. V1 suppression conditions for mean firing rate (f), burst ratio (g), temporal sparseness (h), and response reliability (i), all calculated for the duration of the movie clip. Sparseness captures the activity fraction of a neuron, re-scaled between 0 and 1 (Vinje and Gallant, 2000). Response reliability is defined as the mean Pearson correlation of all single trial PSTH pairs (Goard and Dan, 2009). For sample sizes, see Table 1. Purple: example neuron. Black markers in (f,g,i) indicate neurons with individually significant effects (Welch’s t-test). See also Figure 1—figure supplement 1 to Figure 1—figure supplement 6.
Figure 1—figure supplement 1
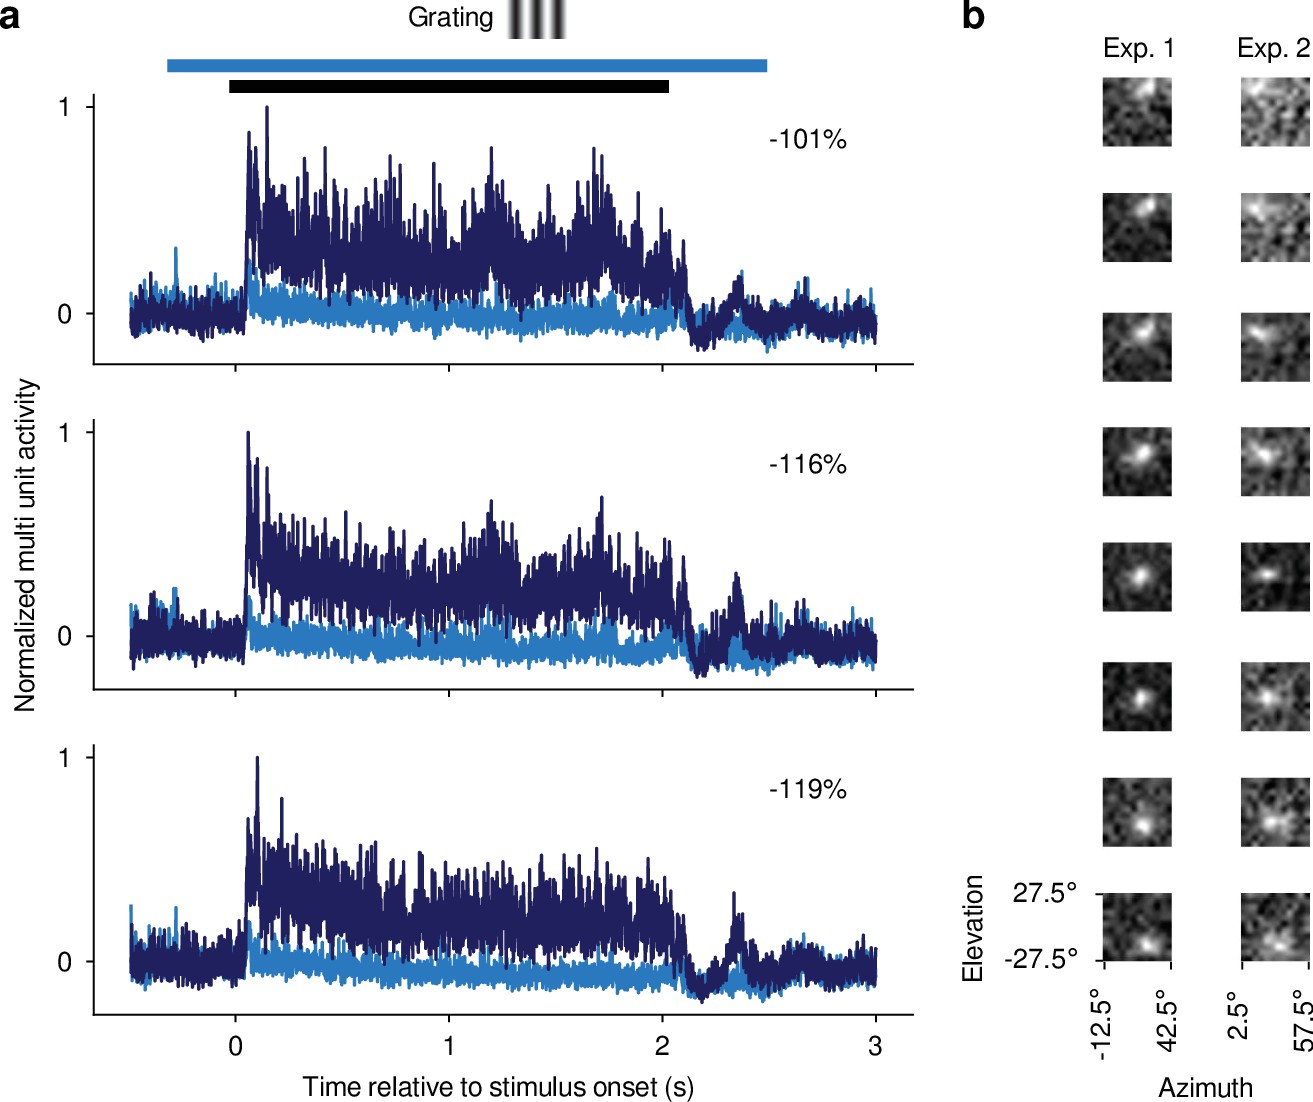
Confirmation of optogenetic suppression of V1 responses and targeting dLGN for recordings.
(a) Multi-unit responses (MUAe, van der Togt et al., 2005) to 2 s drifting gratings recorded in one experiment for three example channels. All three channels were located, as determined by current source density analysis (Mitzdorf, 1985), in the infragranular layers of V1. Dark blue: Mean MUAe responses across control trials; light blue: MUAe responses in trials with optogenetic activation of PV +inhibitory interneurons. Normalized MUAe was computed by subtracting the mean activity across both conditions in a 200ms time window prior to light onset before normalizing to the maximum response across the two conditions. Percentages indicate mean reduction in MUAe over the stimulus presentation period. Black bar: stimulus period; light blue bar: photoactivation period. (b) MUAe-based RFs for channels located in dLGN during two example RF mapping experiments. Each panel represents one channel, with the top channel being located most dorsally and the bottom channel most ventrally in the dLGN. RFs were computed as the mean response to a change in contrast at a given monitor position in a time window ranging from 50 ms after stimulus onset to 100ms after stimulus offset. Brighter pixels indicate higher activity. The emerging characteristic pattern with more ventrally located channels representing locations lower in the visual field was used to confirm successful targeting of dLGN.
Figure 1—figure supplement 2
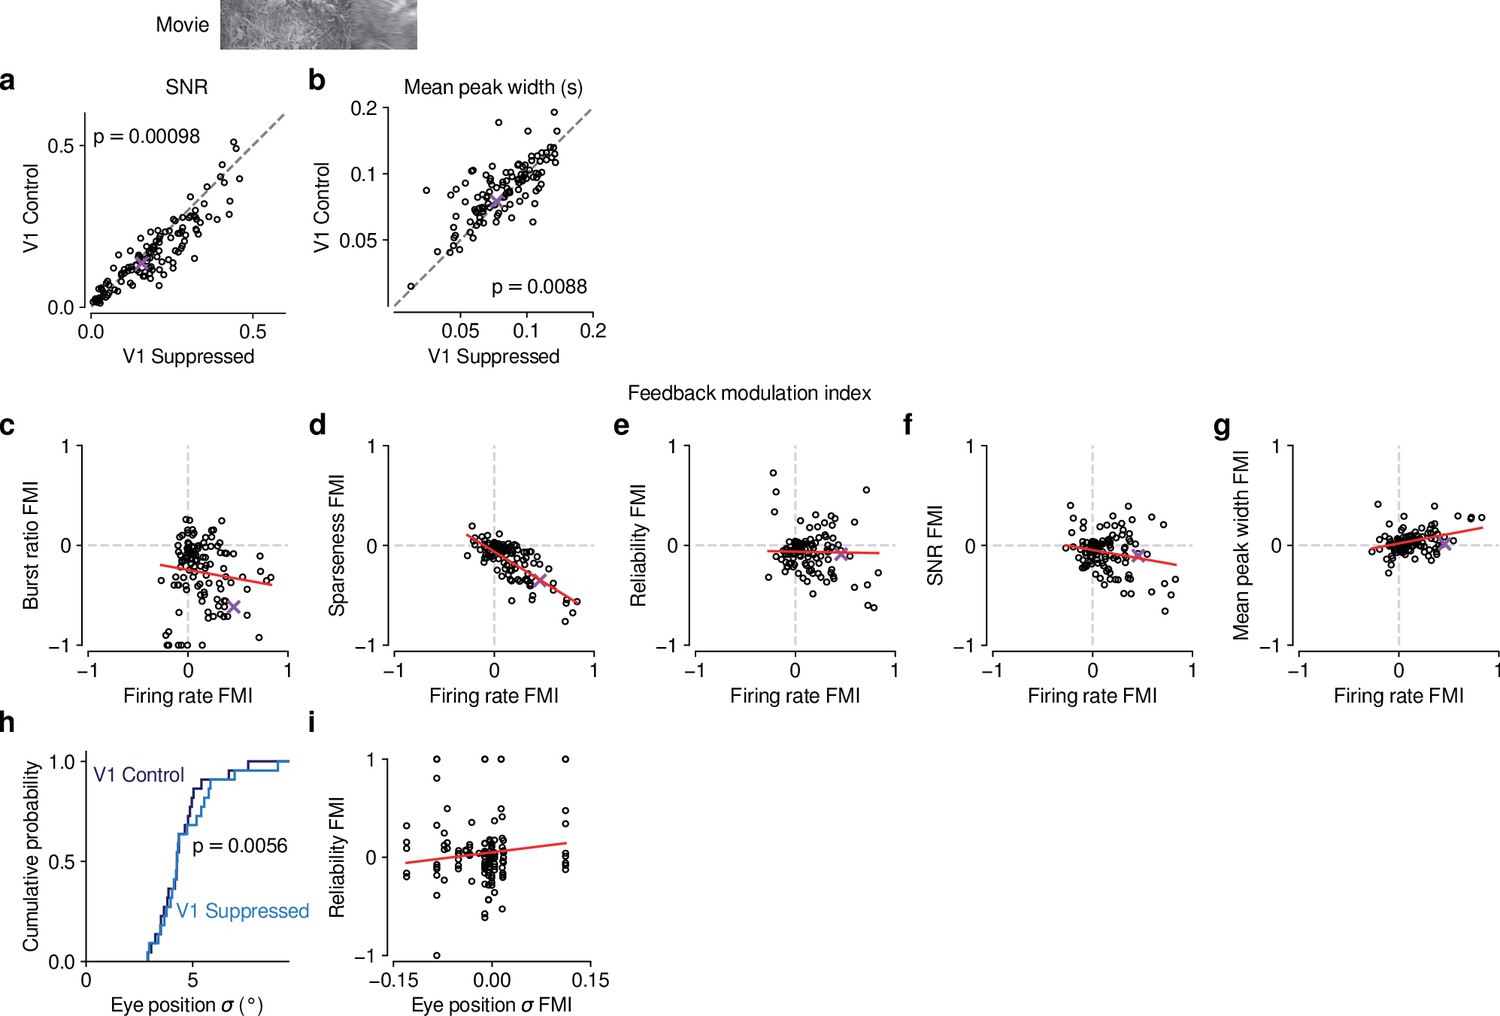
Effects of CT feedback on additional parameters of responses to naturalistic movies and their relationship with firing rate.
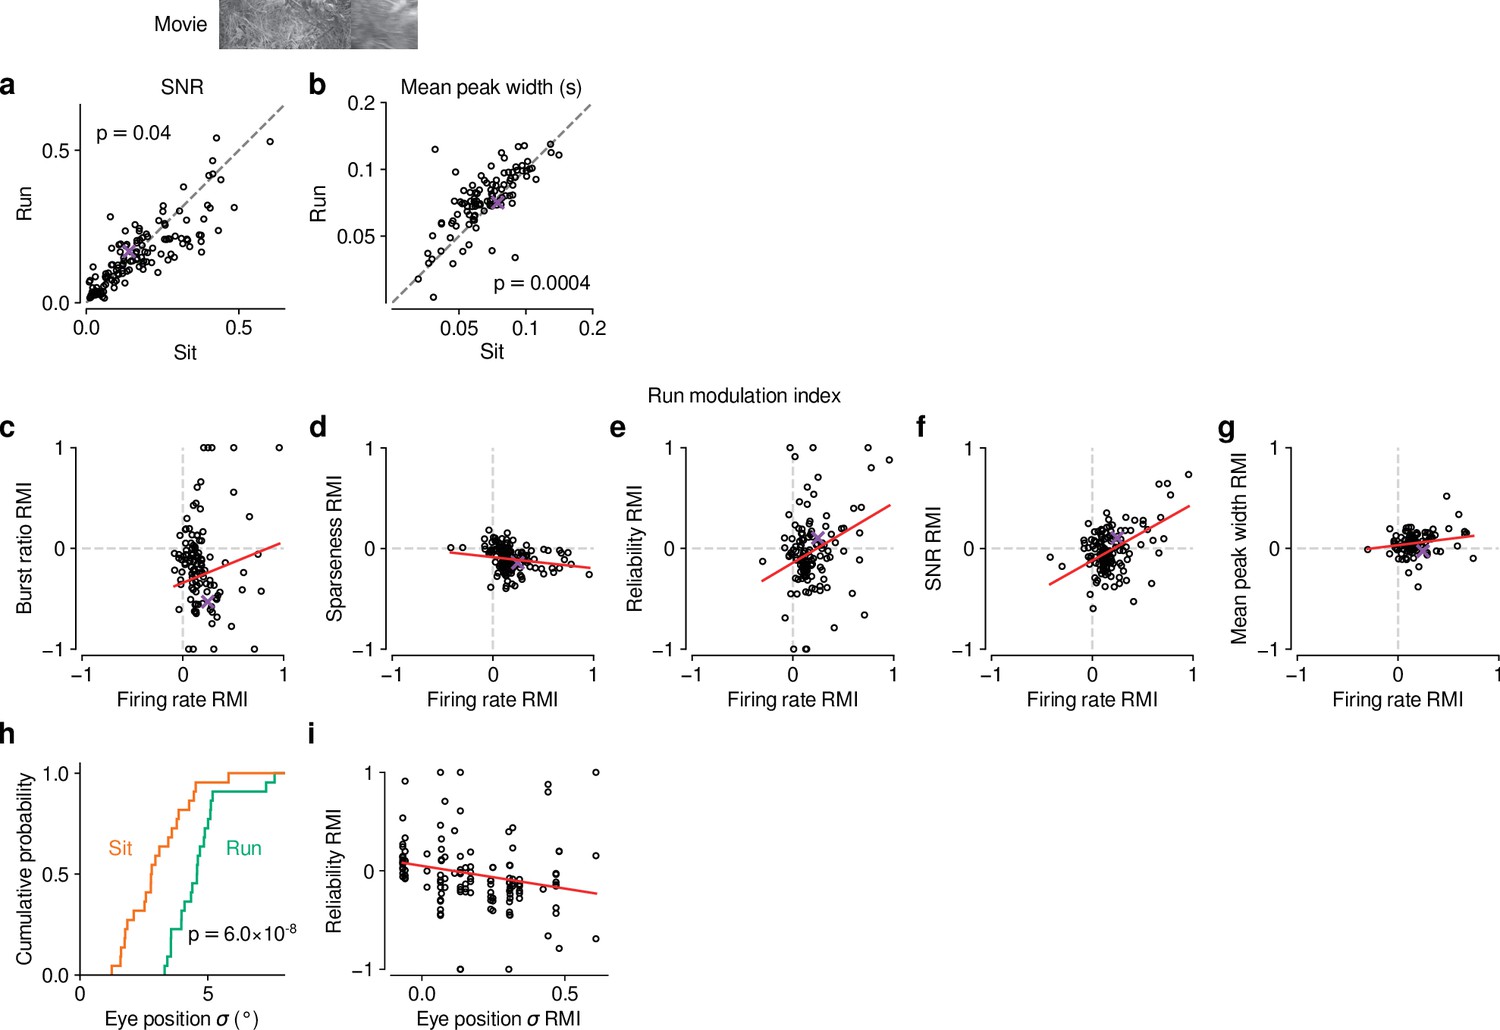
(a,b) Comparison of control vs. V1 suppression conditions for PSTH signal-to-noise ratio (SNR) (a) and mean peak width (b). SNR was computed as in Baden et al., 2016, and compares the variance of the trial-averaged PSTH across time relative to the single-trial variance across time, averaged across stimulus repeats. If all trials are identical such that the PSTH is a perfect representation of each trial’s response, SNR equals 1. The width of PSTH peaks that exceeded a threshold amplitude was measured as the temporal separation of the middle 68% of spikes clustered as part of each peak (see Methods). Narrow peaks are a proxy for high temporal precision of responses. During control, mean SNR was lower (0.15 vs 0.18, LMM: , ) and mean peak width was higher (0.087 vs 0.081, LMM: , ) than during V1 suppression. (c–g) Relationship between CT feedback effects on firing rate and burst ratio (c), sparseness (d), reliability (e), SNR (f), and mean peak width (g). Feedback effects were quantified with a feedback modulation index (FMI), where FMI = . CT feedback-related changes in firing rate can to a large degree account for the changes in sparseness (LMM: slope of ) (d). Importantly, for all other measures, there was no systematic relation to the feedback manipulation of firing rates because slopes were either non-significant or close to 0 (burst ratio, LMM: slope of ; reliability, LMM: ; SNR, LMM: slope of ; mean peak width, LMM: slope of ; estimated slope the estimated standard error). (h) Cumulative distribution of standard deviation of eye position during control (dark blue) and V1 suppression (light blue). Eye position standard deviation was, on average, slightly larger during V1 suppression than during control (4.5° vs. 4.2°, LMM: , , = 31 experiments from 6 mice). (i) The strength of CT feedback effects on reliability is unrelated to the strength of feedback effects on eye position (LMM: slope ). The results from (h) and (i) are inconsistent with the hypothesis that CT feedback effects on trial-to-trial reliability can be explained by changes in eye position variance.
Figure 1—figure supplement 3
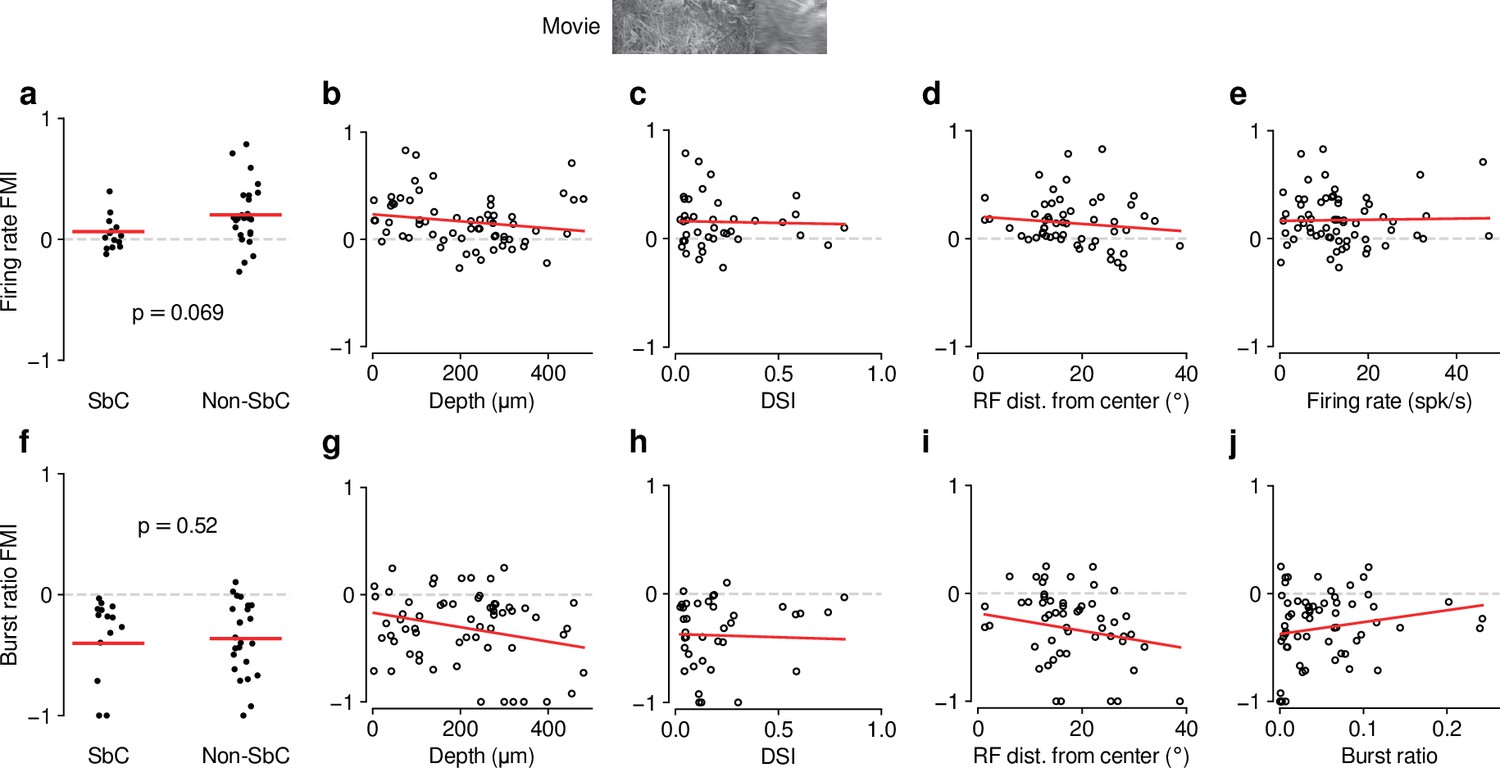
Feedback effects during movie presentation are largely independent of functional cell type classification.
The dLGN is a non-homogeneous nucleus, consisting of different functional cell types (Piscopo et al., 2013; Román Rosón et al., 2019). To test if the effect of CT feedback depended on functional cell type, we performed functional cell typing of neurons in various ways. None of the classifications yielded significant results. (a) Firing rate FMI distributions during movie presentation, with units classified according to whether or not they were suppressed by contrast (SbC) (Piscopo et al., 2013; Román Rosón et al., 2019). Units were defined as SbC if their mean firing rates to uniform equiluminant gray screen were that of a full-contrast stimulus. CT feedback effects on firing rates tended to be lower for SbC neurons compared to the rest of the population, but not significantly (SbC: 0.062 vs. non-SbC: 0.20; LMM: , ). (b) Firing rate FMI during movie presentation, plotted against estimated depth of each unit in dLGN (slope ). Estimated depth could serve as a proxy to separate units into belonging to dLGN shell or core. (c) Same as (b), but with firing rate FMIs plotted against the direction selectivity index (DSI) (Niell and Stryker, 2008) of each unit (slope of ). (d) Same as (c), but with firing rate FMIs plotted against the distance of their RFs from the center of the screen (slope of ). We considered distance from center of screen as a proxy for RF coverage by the visual stimuli, which we hypothesized might modulate CT feedback effects through its known effects on spatial integration (Born et al., 2021). (e) Same as (d), but with firing rate FMIs plotted against their mean firing rate during the V1 control condition (slope of ). This indicates that the CT feedback modulation of firing rates does not depend on overall firing rate, i.e. that neurons do not share the same gain factor (see also Figure 2e and i). (f–j) Same as (a–e), but for burst ratio (–0.40 (SbC) vs. –0.36 (non-SbC); LMM: , ; depth: slope of ; DSI: slope of ; RF distance: slope of ; burst ratio: slope of ). In summary, except for modest trends of differential CT feedback modulations of SbC neurons, we did not find any difference in how feedback affected the various subpopulations. The general similarity of CT feedback effects across classifications might be related to a lack of power (cell-typing in high-dimensional space requires high neuron counts) and/or to the global suppression approach.
Figure 1—figure supplement 4
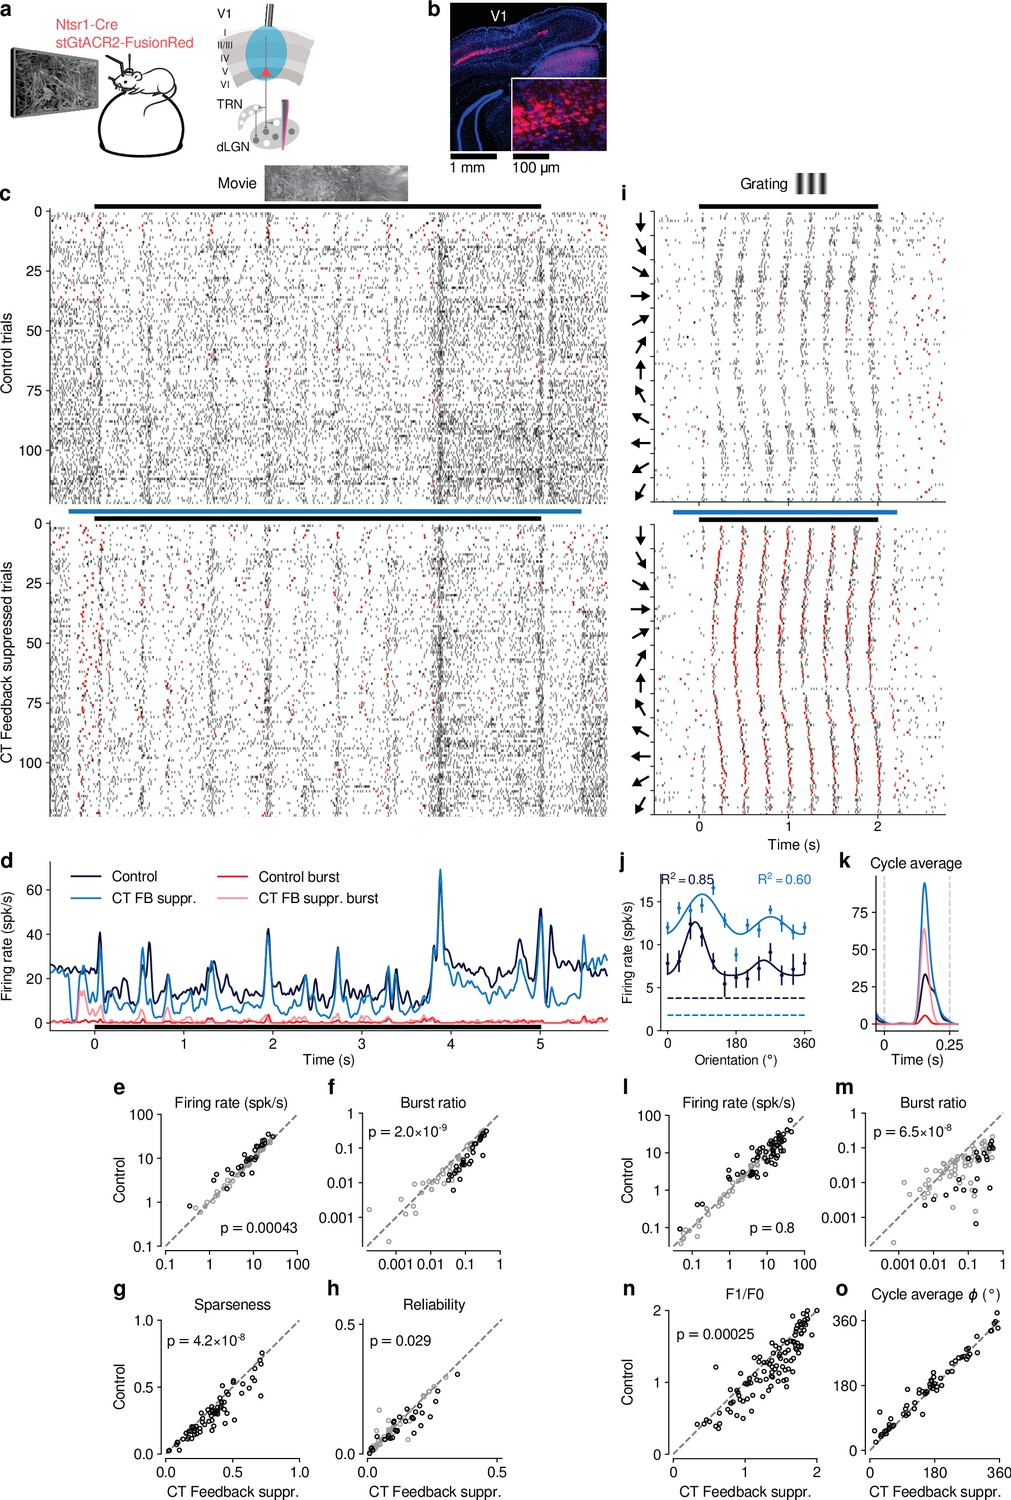
Selective optogenetic suppression of L6 CT feedback in Ntsr1-Cre yielded similar results as global V1 suppression via PV+ activation.
(a) Schematic of experimental approach. The chloride-conducting, inhibitory opsin stGtACR2 (Mahn et al., 2018) was conditionally expressed in V1 Ntsr1+ neurons (red) using a viral approach. Extracellular silicon electrode recordings were performed in dLGN with and without optogenetic suppression of layer 6 CT feedback. (b) Coronal section of V1 for an example Ntsr1-Cre mouse, showing transduced Ntsr1+ neurons (magenta) located in the deep layers of V1. Blue: cell nuclei stained with DAPI. Inset: magnified view with expression of stGtACR2 largely restricted to somata. (c) Movie raster plots during control and L6 CT feedback suppression for an example neuron. (d) Corresponding PSTHs. FB suppr.: Feedback suppressed. (e–h) Comparison of control vs. CT feedback suppression conditions for mean firing rate (e), burst ratio (f), temporal sparseness (g), and response reliability (h), all calculated for the duration of the movie clip. Similar to our results for global V1 suppression, CT feedback enhanced firing rates (10.0 (feedback) vs. 8.7 spikes/s (suppression); LMM: , ), reduced bursting (0.086 vs 0.13; LMM: , ), reduced sparseness (0.31 vs 0.36; LMM: , ), and reduced trial-to-trial reliability (0.10 vs 0.11; LMM: , ). (i) Grating raster plots sorted by orientation, during control and CT feedback suppression conditions for a different example neuron. (j,k) Corresponding orientation tuning curves and cycle average responses to preferred orientation. (l–o) Comparison of control vs. CT feedback suppression conditions for mean firing rate (l), burst ratio (m), F1/F0 (n), and cycle average phase (o). Similar to our results for global V1 suppression, CT feedback had no consistent effect on firing rate (11.44 (feedback) vs. 11.26 spikes/s (suppression); LMM: , ), but reduced bursting (0.03 vs 0.11; LMM: , ), and reduced F1/F0 (1.2 vs 1.3; LMM: , ). Black symbols in (e,f,h,l,m) indicate individually significant neurons (Welch’s t-test).
Figure 1—figure supplement 5
Photostimulation in an Ntsr1- control mouse injected with cre-dependent stGtACR2 had no effect on neural responses.
Same layout as Figure 1—figure supplement 4c-f,i-m. (a–d) Responses to movies. Photostimulation per se had no consistent effect on firing rate (8.5 (control) vs. 8.3 spikes/s (suppression); LMM: , ), or burst ratio (0.096 vs 0.089; LMM: , ). FB suppr.: Feedback suppressed. (e–i) Responses to gratings. Photostimulation per se had no consistent effect on firing rate (10.9 (feedback) vs. 10.9 spikes/s (suppression); LMM: , ), or burst ratio (0.024 vs 0.022; LMM: , ). Black symbols in (c,d,h,i) indicate individually significant neurons (Welch’s t-test).
Figure 1—figure supplement 6
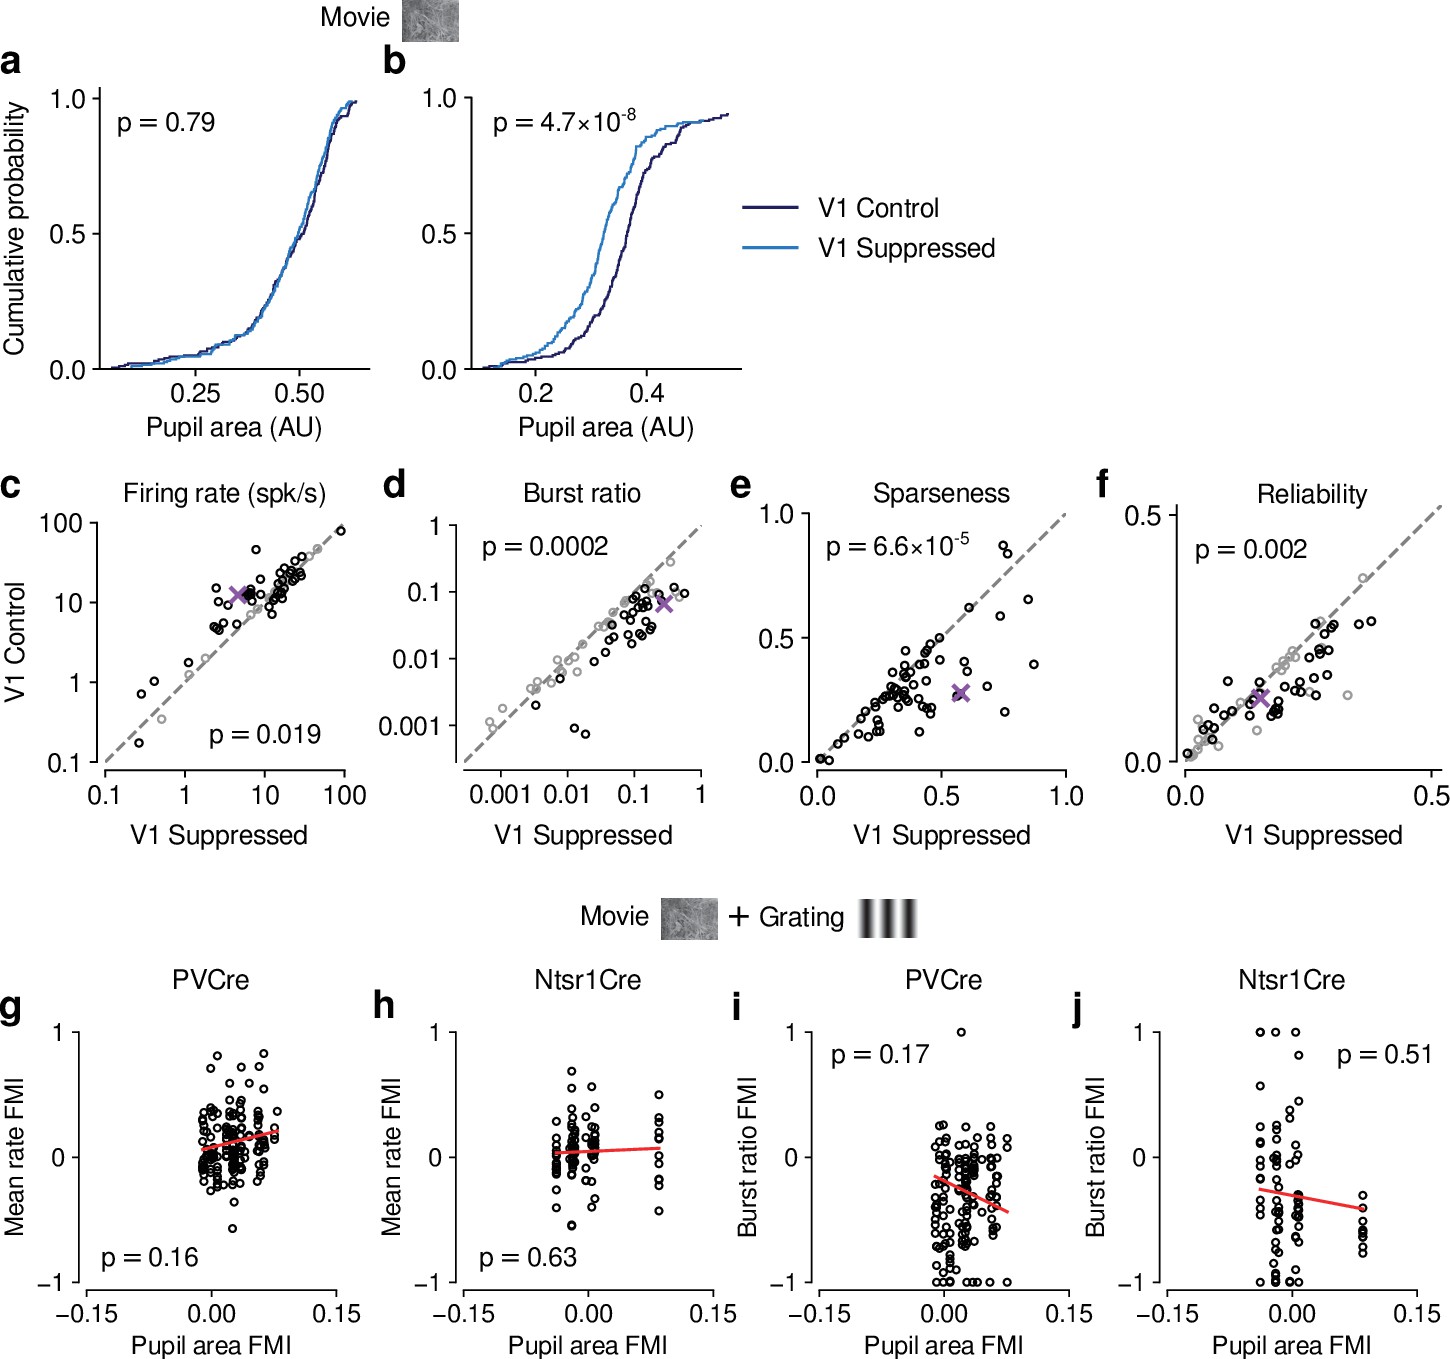
Effects of photostimulation on pupil size were unrelated to CT feedback effects on dLGN neuronal activity.
(a–b) Comparing pupil size during control and photostimulation conditions, we found that for PV+ activation experiments, in 17/31 (54.8%) of experiments, distributions of pupil size were indistinguishable between the photostimulation conditions (KS test, example experiment in (a)). In the remaining experiments (14/31, 45.2%), pupil size was significantly smaller during photostimulation, indicating light leakage (example experiment in (b)). Note that none of the distributions of pupil size differed between photostimulation conditions for the experiments with direct suppression of L6CT neurons in Ntsr1-Cre mice (0/10). (c–f) Repeating our analyses for only those sessions in PV-Cre mice without differences in pupil size distributions, our findings were qualitatively recapitulated for firing rate (c), burst ratio (d), sparseness (e), and reliability (f). Black symbols indicate individually significant neurons (Welch’s t-test). (g–h) Comparing light modulation indices on pupil size with feedback modulation indices on mean firing rate for PV-Cre (g) and Ntsr1-Cre mice (h) reveals no significant relationship. (i–j) Comparing light modulation indices on pupil size with feedback modulation indices on burst ratio for PV-Cre (i) and Ntsr1-Cre mice (j) reveals no significant relationship. Together, these analyses demonstrate that any effects of photostimulation on pupil size were unrelated to CT feedback effects on dLGN neuronal activity.
Figure 1—video 1
First example 5 s movie clip used for visual stimulation.
Figure 1—video 2
Second example 5 s movie clip used for visual stimulation.
Figure 2
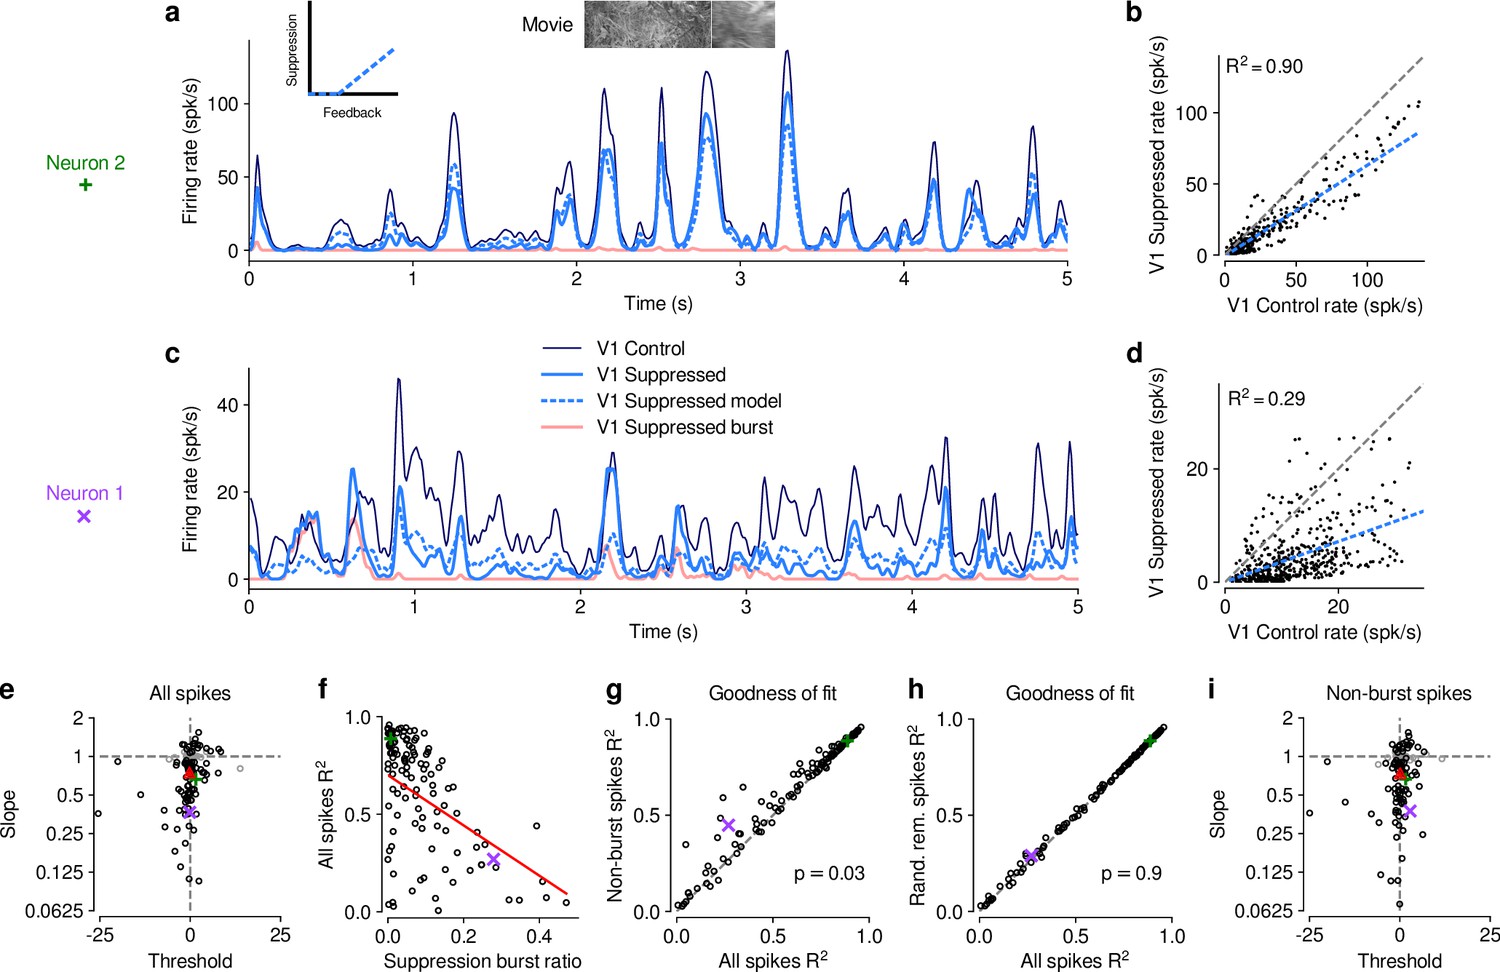
The effect of V1 suppression on dLGN responses to naturalistic movie clips is predominantly divisive.
(a) PSTHs of an example neuron during control (dark blue) and V1 suppression (light blue) conditions, for a random subset of 50% of trials per condition not used for model fitting. Responses during the V1 suppression condition are approximated by the threshold linear model (dashed light blue) based on responses during the control condition. Pink: PSTH during V1 suppression for burst spikes only. Inset: cartoon of threshold linear model. (b) Timepoint-by-timepoint comparison of instantaneous firing rates of the PSTHs (derived from the 50% of trials not used for fitting) during the suppression vs. feedback conditions. PSTH data points are plotted at 0.01ms resolution. Dashed light blue line: threshold linear model fit. (c,d) Same as (a,b) for a second example neuron (same as in Figure 1d and e). (a,b) and (c,d) each contain data from 1 representative subsample. (e) Slope and threshold parameters for all neurons. Each point represents the median for each neuron across 1000 random subsamples of trials. Black points indicate neurons with slopes significantly different from 1 (95% CI). (f) Cross-validated model prediction quality (median ) vs. burst ratio during V1 suppression. Red line: LMM fit. (g) Model prediction quality with and without removal of burst spikes. (h) Model prediction quality with and without removal of an equivalent number of tonic spikes. (i) Same as (e) but with burst spikes removed. (e–h) Purple, green: example neurons; red triangle: LMM estimate of the mean.
Figure 3 with 1 supplement
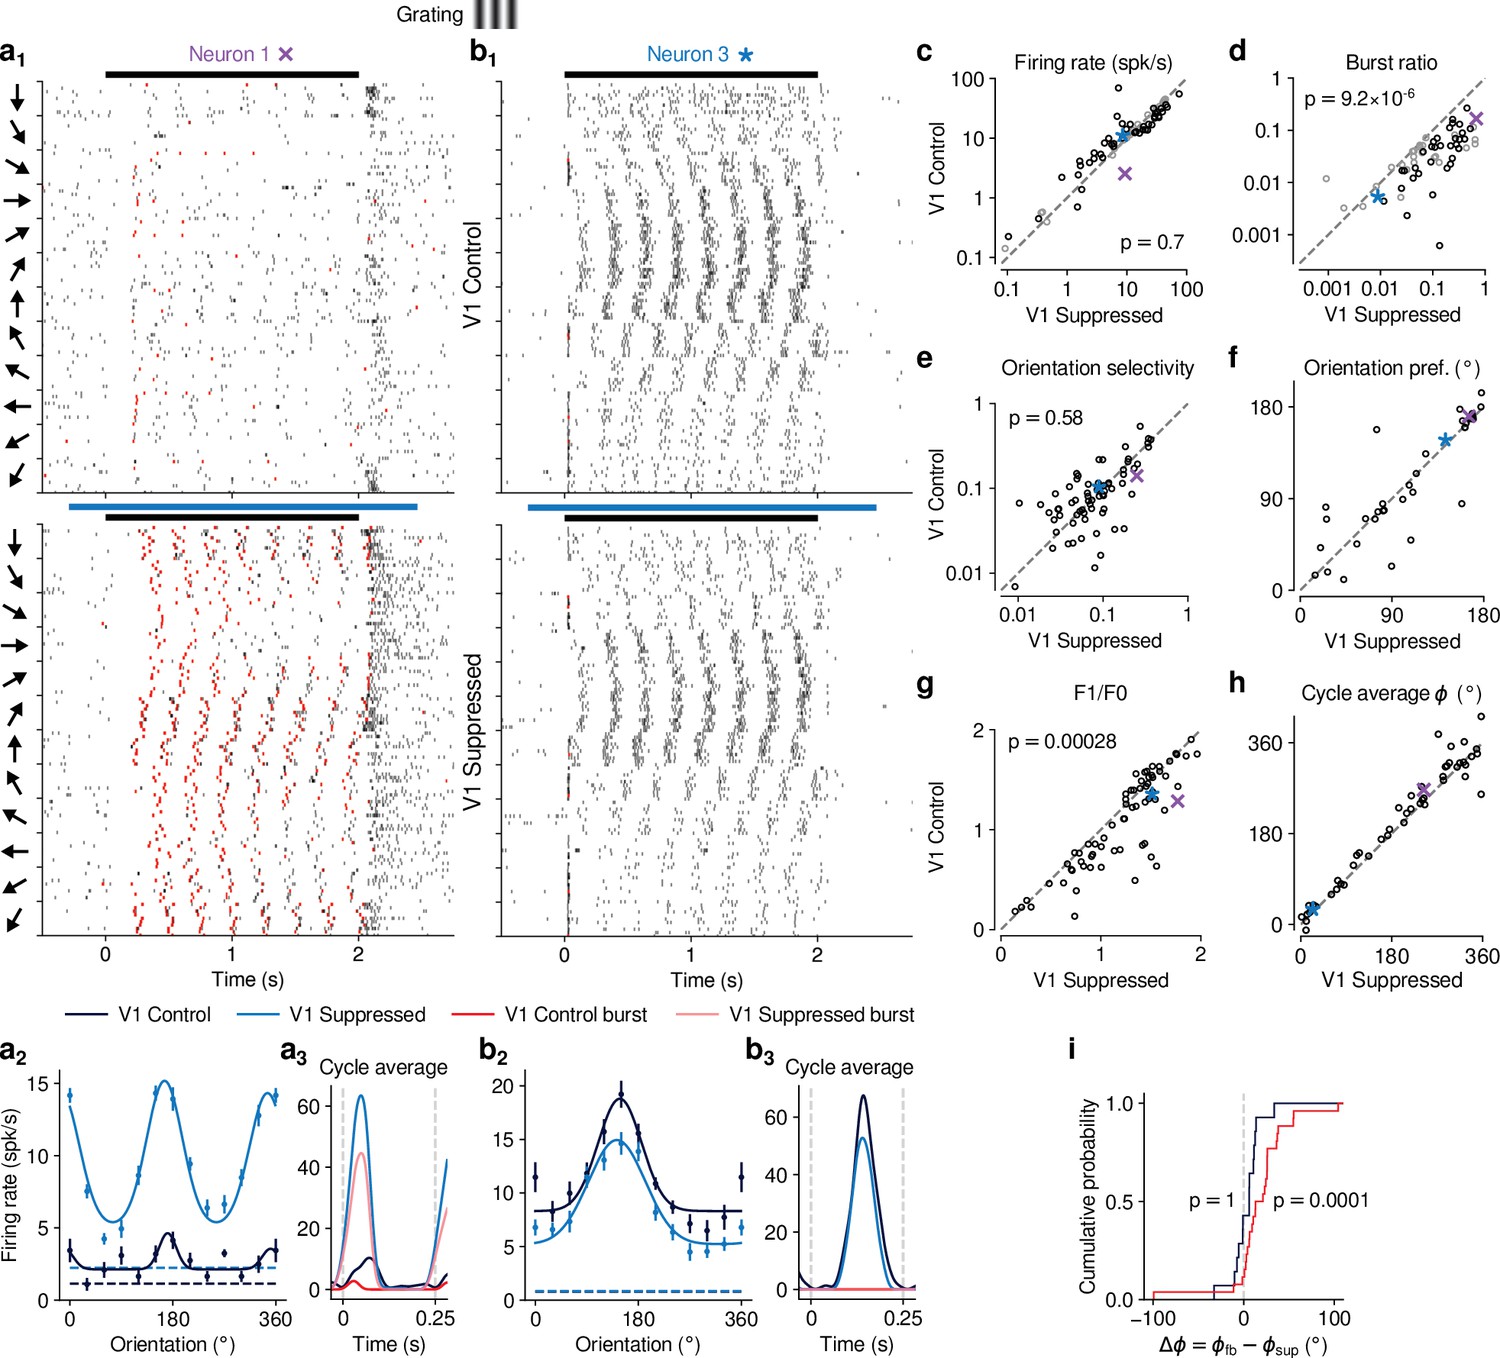
CT feedback modulates dLGN responses to drifting gratings.
(a) Responses of example neuron 1 (same as in Figures 1d, e ,, 2c and d) to full-screen, drifting gratings. (a1) Raster plot in response to drifting gratings, with trials sorted by grating orientation (10 trials per orientation, 30° steps). Red: burst spikes; black bar: grating stimulation; light blue bar: V1 suppression. (a2) Corresponding orientation tuning curve. Dashed lines represent spontaneous firing rates in response to medium gray screen. Error bars: standard error of the mean. (a3) Cycle average response to preferred orientation. Dark blue, light blue: cycle average constructed from all spikes. Red, pink: cycle average constructed from burst spikes only. Dark blue, red: Control condition with CT feedback intact; light blue, pink: V1 suppression. (b) Same as (a), for another example neuron (example neuron 3). (c–h) Comparison of the control conditio with CT feedback intact vs. V1 suppression, for mean firing rate (c), burst ratio (d), orientation selectivity index (OSI) (e), preferred orientation (f), F1/F0 (g), and cycle average phase (h). Purple, blue: example neurons. Black markers in (c,d) indicate neurons with individually significant effects (Welch’s t-test). (i) Cumulative distribution of cycle average phase differences between control and V1 suppression conditions. Dark blue: neurons with little burst spiking (ratio of cycle average peak for burst spikes to cycle average peak for all spikes ); red: neurons with substantial burst spiking (ratio of cycle average peak for burst spikes to cycle average peak for all spikes ).
Figure 3—figure supplement 1
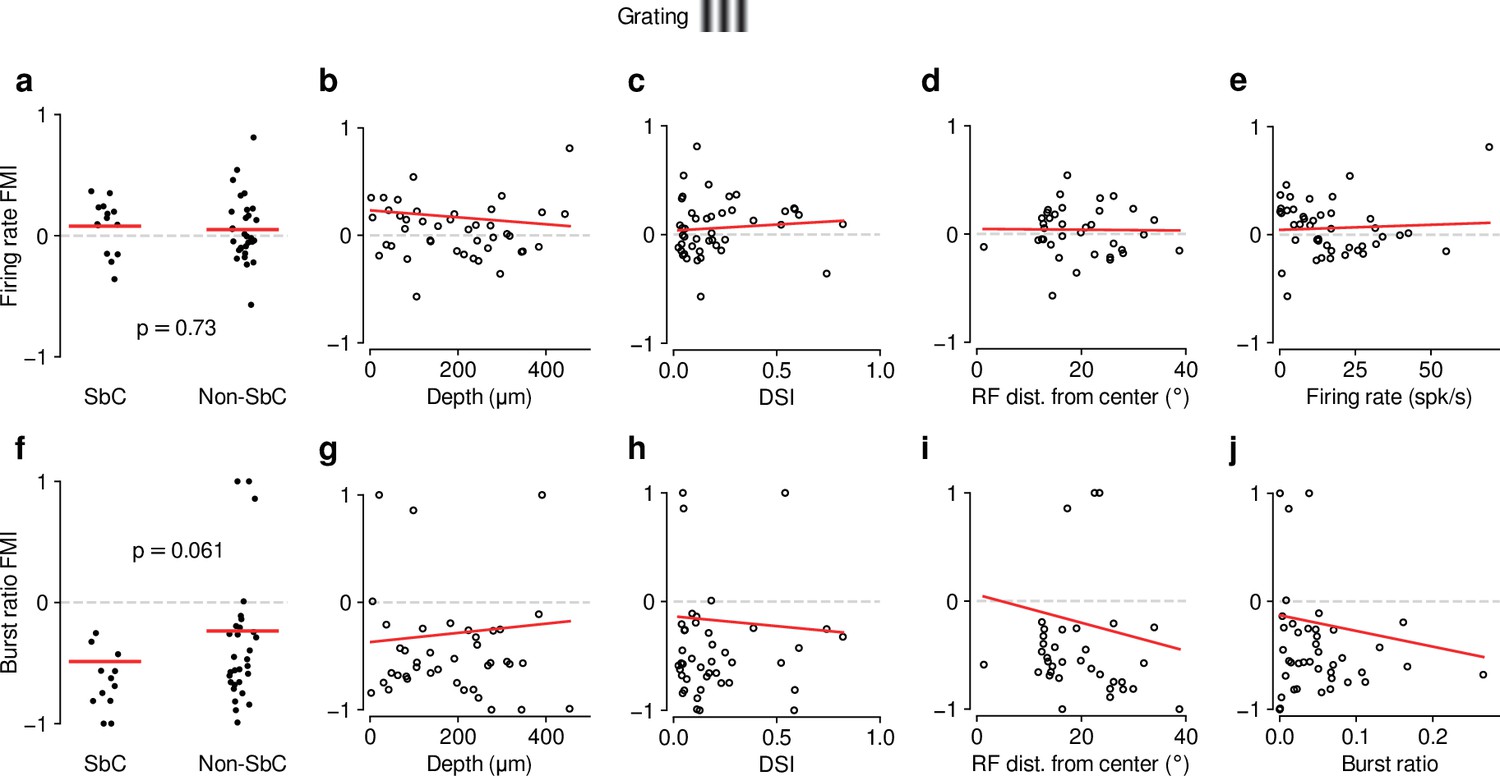
As for movies (Figure 1—figure supplement 3), feedback effects during grating presentation are largely independent of functional cell type classification.
(a–e) Same as Figure 1—figure supplement 3a-e but for drifting gratings (0.08 (SbC) vs. 0.05 (non-SbC); LMM: , ; depth: slope ; DSI: slope ; RF distance: slope ; firing rate: slope ). (f–j) Same as Figure 1—figure supplement 3f-j but for drifting gratings (–0.49 (SbC) vs. –0.24 (non-SbC); LMM: , ; depth: slope ; DSI: slope ; RF distance: slope ; burst ratio: slope ).
Figure 4 with 1 supplement
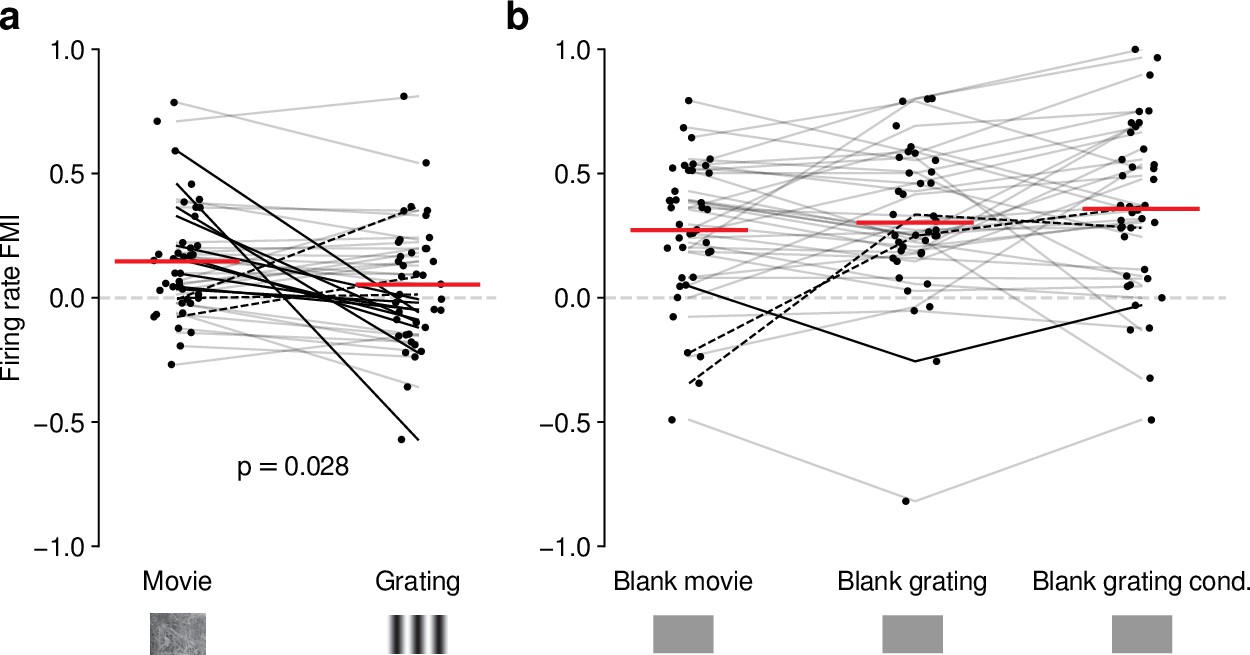
Effects of CT feedback on dLGN firing rate depend on stimulus type.
(a) Comparison of the strength of CT feedback effects on firing rate (feedback modulation index, FMI) during presentation of full-screen movie clips and gratings. (b) Comparison of the strength of CT feedback effect on firing rate for blank stimuli interleaved with movies or gratings. Red: mean (LMM), dark lines: changes in sign of feedback modulation effect with stimulus type from positive for movies to negative for gratings (solid) and vice versa (dashed). For (a) and (b), we randomly jittered the horizontal position of the points to avoid overlap; lines connecting the paired samples still end at the central position to represent change. See also Figure 4—figure supplement 1.
Figure 4—figure supplement 1
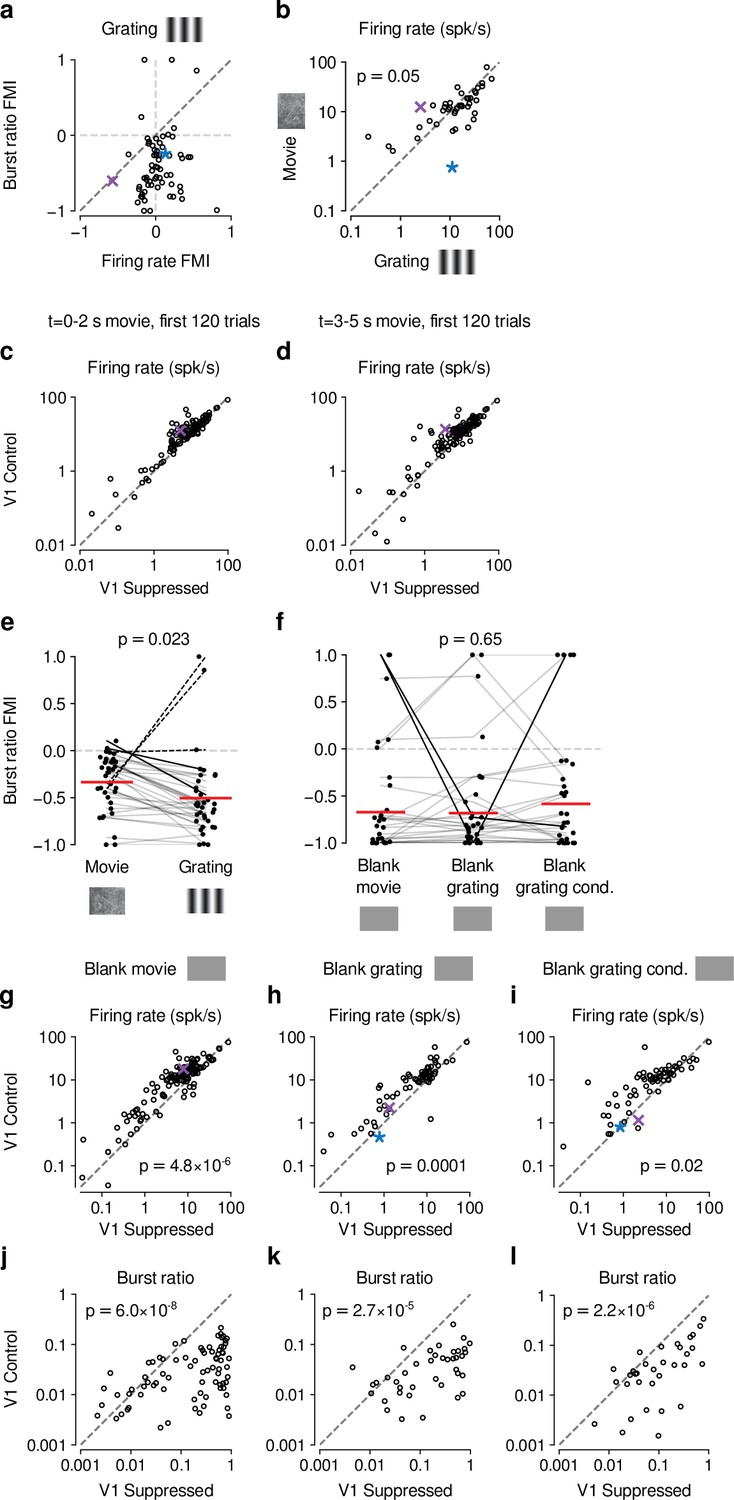
Control analyses assessing the difference in CT feedback effects for gratings and movies.
(a) Similar to our results for movies (Fig. 1-Supplement 2c), CT feedback modulation of grating burst ratio was unrelated to CT feedback modulation of firing rate (LMM: slope of 0.029 ± 0.41). (b) With CT feedback intact, movies and gratings evoked firing rates of similar magnitude (13.3 spikes/s vs. 16.3 spikes/s, LMM: F1,42 = 4.1, p = 0.05). This rules out the possibility that larger CT feedback effects for movies are related to stronger firing rates already present in the baseline condition with CT feedback intact. (c,d) Comparison of CT feedback effects in response to movies for the first 2 s (c) or the last 2 s (d) of movie stimulation, for more direct comparison with grating stimulation. dLGN firing rates were overall higher for movies during the CT feedback intact vs. V1 suppression condition (main effect of feedback, LMM: F1,63.2 = 11.8, p = 0.001), and the CT feedback effect was even stronger when restricting the analysis to only the first 2 s and 120 trials of movie stimulation (interaction, LMM: F1,64.3 = 9.4, p = 0.003). Together, this rules out that the difference in CT feedback effects on firing rates to movies vs. gratings is related to the longer duration or greater number of movie trials (5 s, 200 trials) than grating trials (2 s, 120 trials). (e) V1 suppression increases bursting more strongly during presentation of gratings than movies (burst ratio FMI of -0.34 (movies) vs. -0.5 (gratings); LMM: F1,35 = 5.7, p = 0.023). (f) V1 suppression increases bursting to a similar degree during short blank screen periods preceding movie and grating stimulus trials, and during blank grating conditions (burst ratio FMI of -0.67 (pre-movies) vs. -0.68 (pre-gratings) vs. - 0.58 (blank grating condition); LMM: F2,56 = 0.43, p = 0.65). Burst ratio FMI depended only weakly on stimulus type (movie vs. grating, average of all blank conditions, LMM: F2,126,2 = 2.8, p = 0.07). (g,h,i) Comparison of firing rates during CT feedback vs. V1 suppression for short blank periods preceding movies and gratings, and during blank grating conditions. In all cases, CT feedback is associated with enhanced firing rates (blank pre-movies: firing rates 13.2 spikes/s (feedback) vs. 8.7 spikes/s (V1 suppression); LMM: F1,62.6 = 25.1, p = 4.8 × 10⁻⁶ ; blank pre-gratings: firing rates 10.8 spikes/s (feedback) vs. 7.5 spikes/s (V1 suppression); LMM: F1,43.3 = 17.5, p = 0.0001; blank grating condition: firing rates 11.5 spikes/s (feedback) vs. 8.7 spikes/s (V1 suppression); LMM: F1,43.1 = 6.2, p = 0.02). (j,k,l) Same as (g,h,i), but for burst ratio. In all cases, CT feedback is associated with less bursting (blank pre-movies: burst ratios 0.031 (feedback) vs. 0.23 (V1 suppression); LMM: F1,64.4 = 37.5, p = 6.0×10⁻⁸ ; blank pre-gratings: burst ratios 0.034 (feedback) vs. 0.21 (V1 suppression); LMM: F1,42.3 = 22.1, p = 2.7 × 10⁻⁵ ; blank grating condition: burst ratios 0.049 (feedback) vs. 0.14 (V1 suppression); LMM: F1,1273 = 102.1, p = 2.2 × 10⁻⁶). (e,f) Red horizontal lines: means estimated by LMM.
Figure 5 with 2 supplements
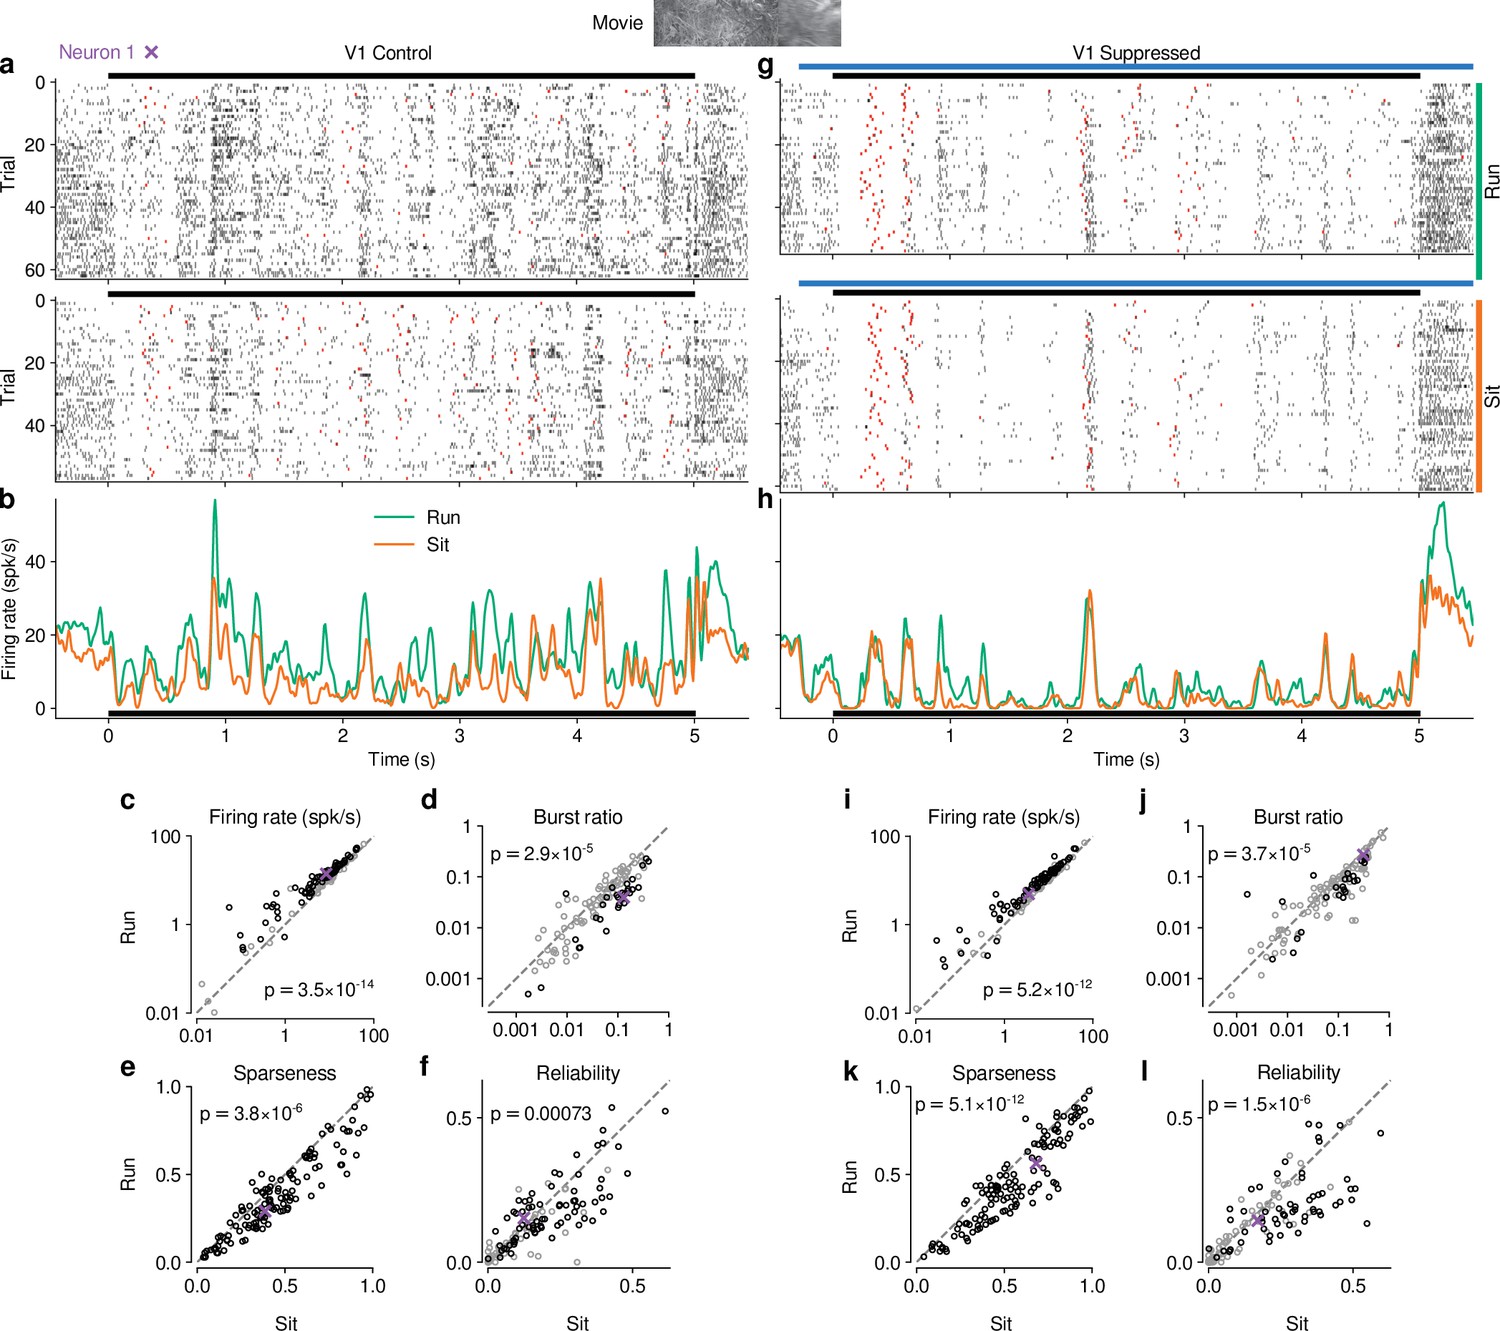
Effects of locomotion on dLGN responses resemble those of CT feedback, but persist even during V1 suppression.
(a) Spike raster of example neuron 1 (same as Figure 1d) in response to a naturalistic movie clip during locomotion and stationary trials with CT feedback intact. Top: trials with run speed > 1 cm/s; bottom: trials with run speed <0.25 cm/s, both for at least of each trial. Red: burst spikes. (b) Corresponding PSTHs. Green: locomotion, orange: stationary; black bar: duration of movie clip. (c–f) Comparison of firing rates (c), burst ratio (d), sparseness (e), and trial-to-trial reliability (f) during locomotion and stationary trials. Black markers in (c,d,f) correspond to individually significant observations (Welch’s t-test). (g–l) Same as (a–f), for locomotion and stationary trials during V1 suppression. Light blue bar: V1 suppression. See also Figure 5—figure supplement 1.
Figure 5—figure supplement 1
Effects of locomotion on additional parameters of responses to naturalistic movie clips and relationship with firing rate.
(a,b) Comparison between trials with locomotion and stationary periods for (a) SNR (Baden et al., 2016) and (b) width of response peaks. During locomotion, SNR was lower (0.15 vs 0.16, LMM: , ) and mean peak width was broader (0.08 vs 0.07, LMM: , ). (c–g) Relation between locomotion effect (RMI) for firing rate and RMI for burst ratio (c), sparseness (d), reliability (e), SNR (f), and mean peak width (g). Locomotion-related changes in firing rate can to some degree account for the changes in reliability (LMM: slope of ) and SNR (LMM: slope of ). Slopes were non-significant for burst ratio (LMM: slope of ), sparseness (LMM: slope of ) and mean peak width (LMM: slope of ). (h) Cumulative distribution of trial-averaged eye position standard deviation for stationary (orange) and locomotion (green) trials. Eye position standard deviation was first calculated for each time point across trials, and then averaged across time points. In line with previous reports (Erisken et al., 2014; Bennett et al., 2013), standard deviation of eye position was, on average, larger during locomotion than during stationary periods (4.4° vs. 2.9°, LMM: , , experiments from 6 mice). (i) Locomotion-related trial-to-trial reliability co-varied with locomotion-related changes in eye position standard deviation (LMM: slope of ); however, the expected difference in reliability RMI corresponding to a 1 standard deviation difference in eye position RMI is , which is much smaller than the residual standard deviation of 0.28 unexplained by the regression. Therefore, changes in eye position during locomotion cannot account for most of the reduced reliability of responses during locomotion (Figure 5f).
Figure 5—figure supplement 2
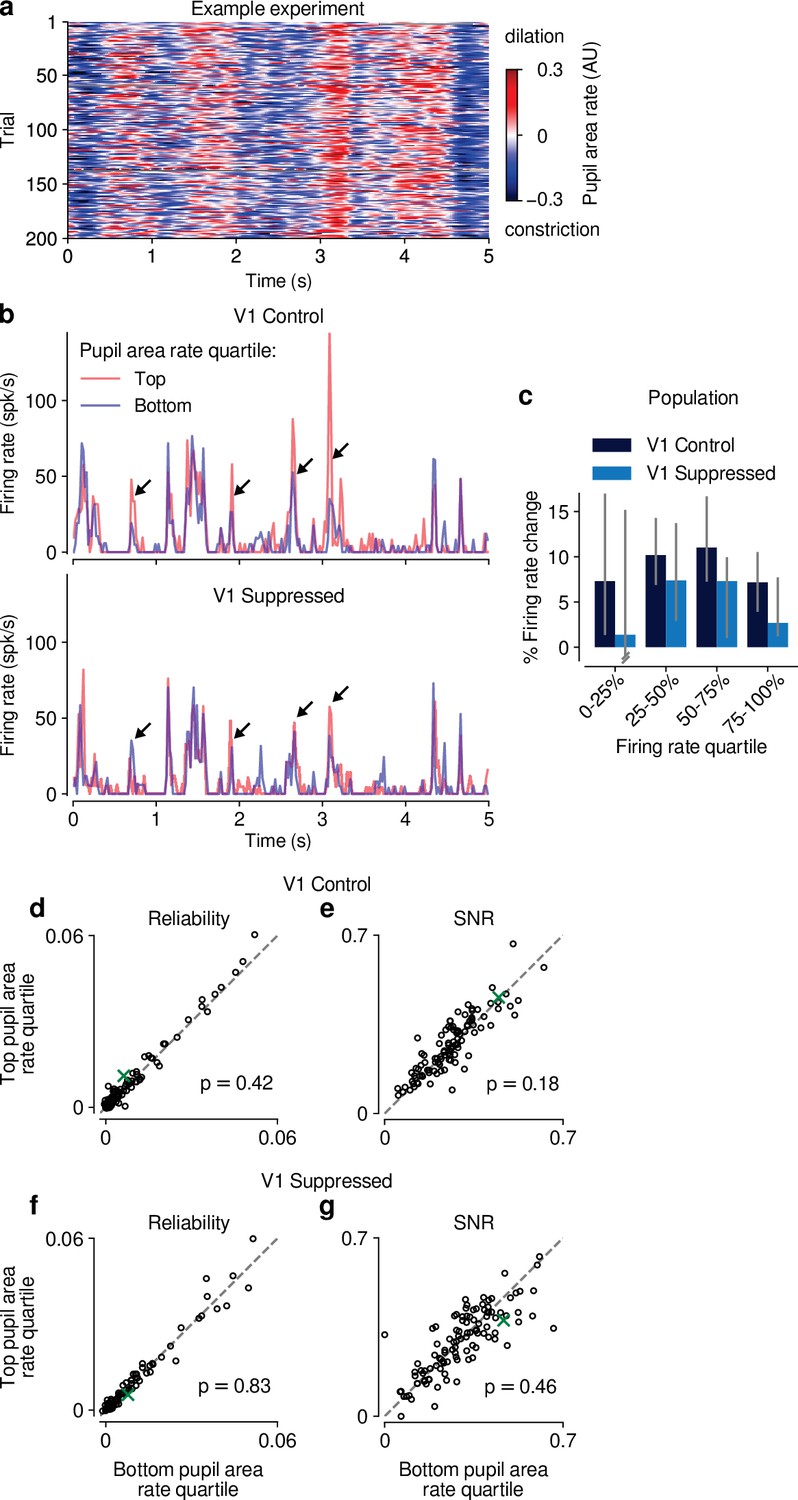
Effects of pupil-indexed arousal on dLGN responses to movies.
(a) Pupil area dynamics during repeated presentation of a naturalistic movie clip. Only trials in the V1 control condition are shown. (b) PSTHs of an example neuron during V1 control (top) and suppression (bottom) conditions. PSTHs were calculated separately using the top and bottom quartile bins of pupil area dynamics (see Materials and methods). Peaks in the example PSTH were generally higher in the top quartile of pupil area dynamics, especially in the control condition (arrows). (c) Across the population of units, the median percent change in firing rate during top vs. bottom quartiles of pupil area dynamics was >0 (y-axis), and consistently so when calculated separately for quartiles of the overall mean firing rate, irrespective of pupil size (x-axis). This held for both V1 control and suppressed conditions. Error bars show 95% confidence intervals, calculated by randomly sampling from the population of units 5000 times with replacement. (d–g) Scatter plots of response reliability and SNR during top vs. bottom quartiles of pupil area dynamics, in both the V1 control and suppressed conditions. Pupil area dynamics had no significant effect on response reliability or SNR in either photostimulation condition (reliability control: 0.0059 vs 0.0055; LMM: ; SNR control: 0.26 vs 0.25; LMM: reliability suppressed: 0.0057 vs 0.0056; LMM: SNR suppressed: 0.29 vs 0.29; LMM: ). Green: example neuron from (b).
Figure 6 with 1 supplement
The effects of CT feedback and locomotion on movie responses are largely independent.
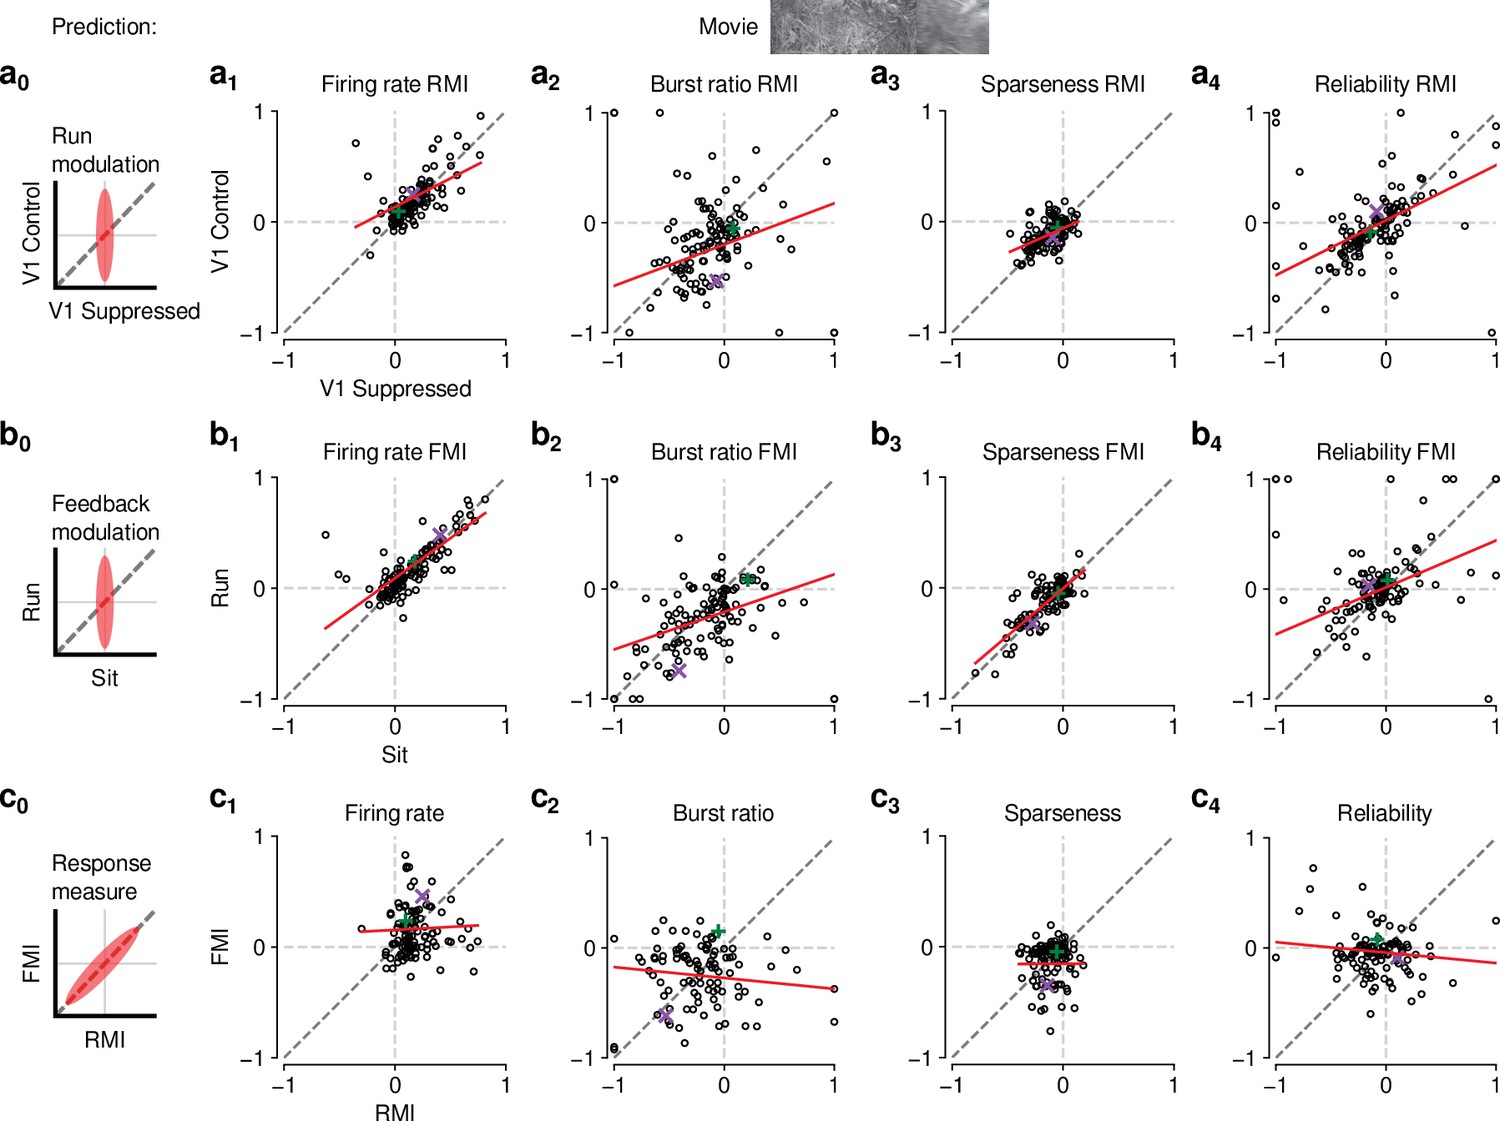
(a0–c0) Predicted relationships between modulation indices and response measures in different conditions, assuming dependence in the effects of CT feedback and locomotion. (a) Comparison of modulation by running (RMI) during CT feedback intact and V1 suppression for firing rates (a1), burst ratio (a2), sparseness (a3), and reliability (a4). Running effects were quantified with a run modulation index (RMI), where RMI = . (b) Comparison of modulation by CT feedback (FMI) during locomotion and stationary periods for firing rates (b1), burst ratio (b2), sparseness (b3), and reliability (b4). (c) Comparison of modulation by feedback (FMI) and modulation by running (RMI) for firing rates (c1), burst ratio (c2), sparseness (c3), and reliability (c4). Red: LMM fit. Green, purple: example neurons from Figure 2a and b.
Figure 6—figure supplement 1
The effects of CT feedback and locomotion on responses to gratings are also largely independent.
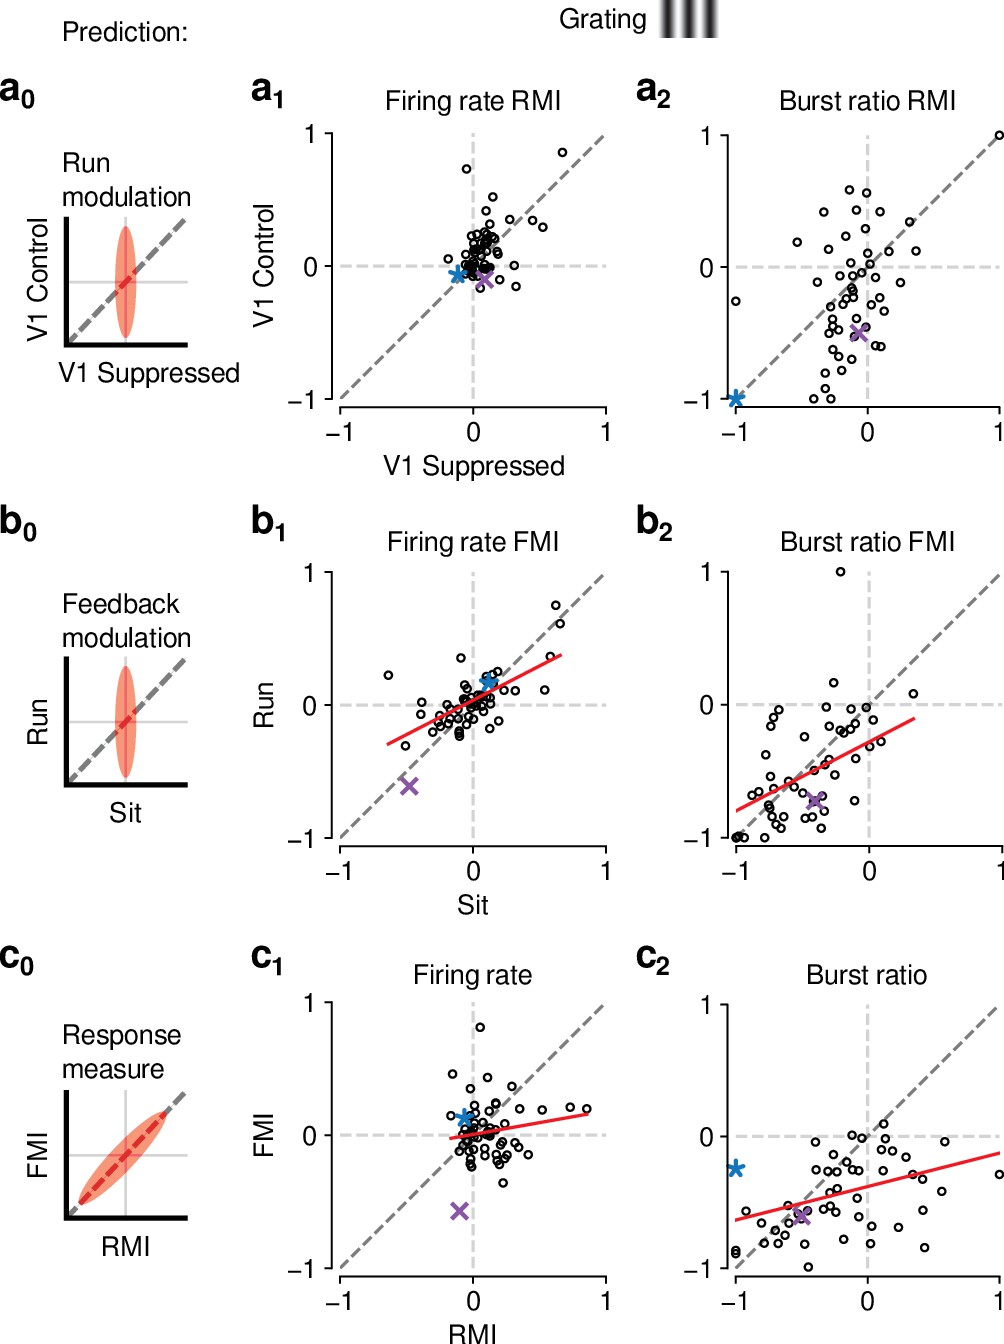
(a0–c0) Predicted relationships between modulation indices and response measures in different conditions, assuming dependence in the effects of CT feedback and locomotion. (a) Comparison of modulation by running (RMI) during CT feedback intact and V1 suppression for firing rates (a1) and burst ratio (a2). Similar to our results for movies, we found that running-related modulations were significantly but modestly different from 0, even during V1 suppression (firing rate run modulation index (RMI) ; burst ratio ; both mean ± confidence interval). (b) Comparison of modulation by CT feedback (FMI) during locomotion and stationary periods for firing rates (b1) and burst ratio (b2). Similar to our results for movies, CT feedback effects were correlated across behavioral states (firing rate: slope of ; burst ratio: slope of ). (c) Comparison of modulation by feedback (FMI) and modulation by running (RMI) for firing rates (c1) and burst ratio (c2). Similar to our results for movies, effects of CT feedback (FMI) and behavioral state (RMI) were uncorrelated for firing rate (slope of ). There was, however, a significant correlation between FMI and RMI for burst ratio (slope of ). Red: LMM fit. Purple, blue: example neurons from Figure 3a and b.
Tables
Table 1
Breakdown of sample sizes (N) for the analyses of neural data.
See text for details.
Key resources table
| Reagent type (species) or resource | Designation | Source or reference | Identifiers | Additional information |
|---|---|---|---|---|
| Recombinant DNA reagent | pAAV EF1a.DIO.hChR2(H134R)- eYFP.WPRE.hGH | Addgene | #20298-AAV9 | |
| Recombinant DNA reagent | pAAV hSyn1-SIO-stGtACR2- FusionRed | Addgene | #105,677 | |
| Strain, strain background (Mus musculus) | B6;129P2-Pvalbtm1(cre)Arbr/J | Jackson Laboratory | #008069 | PV-Cre, Pvalb-Cre |
| Strain, strain background (Mus musculus) | B6.FVB(Cg)-Tg(Ntsr1-cre) GN220Gsat/Mmcd | MMRRC | #030648-UCD | Ntsr1-Cre |
| Chemical compound, drug | Metamizole | MSD Animal Health | Vetalgin | 200 mg/kg |
| Chemical compound, drug | Buprenorphine | Bayer | Buprenovet | 0.1 mg/kg |
| Chemical compound, drug | Lidocaine hydrochloride | bela-pharm | 2 % | |
| Chemical compound, drug | Meloxicam | Böhringer Ingelheim | Metacam | 2 mg/kg |
| Chemical compound, drug | Isoflurane | CP Pharma | in oxygen | |
| Chemical compound, drug | Bepanthen | Bayer | eye ointment | |
| Chemical compound, drug | DAPI-containing mounting medium | Vector Laboratories Ltd | ||
| Chemical compound, drug | Vectashield DAPI H-1000 | Vector Laboratories Ltd | ||
| Chemical compound, drug | DiI | Invitrogen | electrode stain | |
| Software, algorithm | Python 3.6 | http://python.org | RRID:SCR_008394 | |
| Software, algorithm | R | R Core Team, 2017 | RRID:SCR_001905 | |
| Software, algorithm | MATLAB R2019b | Mathworks | RRID:SCR_001622 | |
| Software, algorithm | EXPO | https://sites.google.com/a/nyu.edu/expo/home | visual stimulus display | |
| Software, algorithm | Kilosort | Pachitariu et al., 2016 | RRID:SCR_016422 | |
| Software, algorithm | Spyke | Spacek et al., 2009 | ||
| Software, algorithm | Fiji/ImageJ | NIH | RRID:SCR_003070 | |
| Software, algorithm | DataJoint | Yatsenko et al., 2018 | RRID:SCR_014543 |
Additional files
Download links
A two-part list of links to download the article, or parts of the article, in various formats.
Downloads (link to download the article as PDF)
Open citations (links to open the citations from this article in various online reference manager services)
Cite this article (links to download the citations from this article in formats compatible with various reference manager tools)
Robust effects of corticothalamic feedback and behavioral state on movie responses in mouse dLGN
eLife 11:e70469.
https://doi.org/10.7554/eLife.70469


