A pre-screening strategy to assess resected tumor margins by imaging cytoplasmic viscosity and hypoxia
- Shanghai Fifth People's Hospital and Institutes of Biomedical Sciences, Fudan University, China
- The State Key Laboratory of Molecular Engineering of Polymers and The Shanghai Key Laboratory of Medical Imaging Computing and Computer Assisted Intervention, Fudan University, China
- Department of Liver Surgery and Transplantation, Liver Cancer Institute, Zhongshan Hospital, Fudan University, China
- Department of Cardiac Surgery and Shanghai Institute of Cardiovascular Diseases, Zhongshan Hospital, Fudan University, China
- Department of Oromaxillofacial Head and Neck Oncology, Shanghai Ninth People’s Hospital, Shanghai Jiao Tong University School of Medicine, China
- Department of Urology, Zhongshan Hospital, Fudan University, China
Figures
Figure 1 with 3 supplements

Fluorescence emission and absorption profiles of IBS440.
(A) Fluorescence spectra of IBS440 (10 μM) in different ratios of Ethanol/Glycerol mixtures. (B) The linear response between the fluorescence intensity at 610 nm (lgI(Intensity)) of the probe IBS440 (10 μM) and the viscosity (lgη(Viscosity)) in the Ethanol/Glycerol solvent. (C) The fluorescence response of IBS440 (10 μM) to nitroreductase at the varied concentrations in reaction buffer (50 mM Tris-HCl, 150 mM NaCl, 1 mM DTT, 0.1 mM EDTA, pH 8.0). The spectra were recorded upon treatment of IBS440 (10 μM) with nitroreductase (0–9.0 μg/mL) in the presence of NADPH (500 μM). (D) A linear correlation between the concentration of nitroreductase and the fluorescence intensity of the reaction mixture. (E) Fluorescence intensity of IBS440 (10 μM) at 610 nm in various solvents of methanol (MeOH), N, N-Dimethylformamide (DMF), dimethyl sulfoxide (DMSO), acetonitrile (CH3CN), ethanol (EtOH), ethyl acetate (EtOAc), phosphate buffer saline (PBS), H2O, tetrahydrofuran (THF), glycerol. (F) Fluorescence responses of IBS440 (10 μM) in the presence of NADPH (500 μM) to various species. λex = 400 nm. λem = 520 nm. (G) Effects of pH on the response of IBS440 in solvents with different viscosity (ethanol and 50 % glycerol in ethanol). The fluorescence intensity at 610 nm was plotted against different pH values. λex = 500 nm. (H) The emission intensity (at 520 nm) of IBS224 and IBS440 at different pH Tris-HCl buffer, containing 20 % DMSO as a cosolvent. Error bars represent standard deviation of three repeated experiments.
-
Figure 1—source data 1
The original raw data of fluorescence emission and absorption profiles.
- https://cdn.elifesciences.org/articles/70471/elife-70471-fig1-data1-v2.zip
Figure 1—figure supplement 1
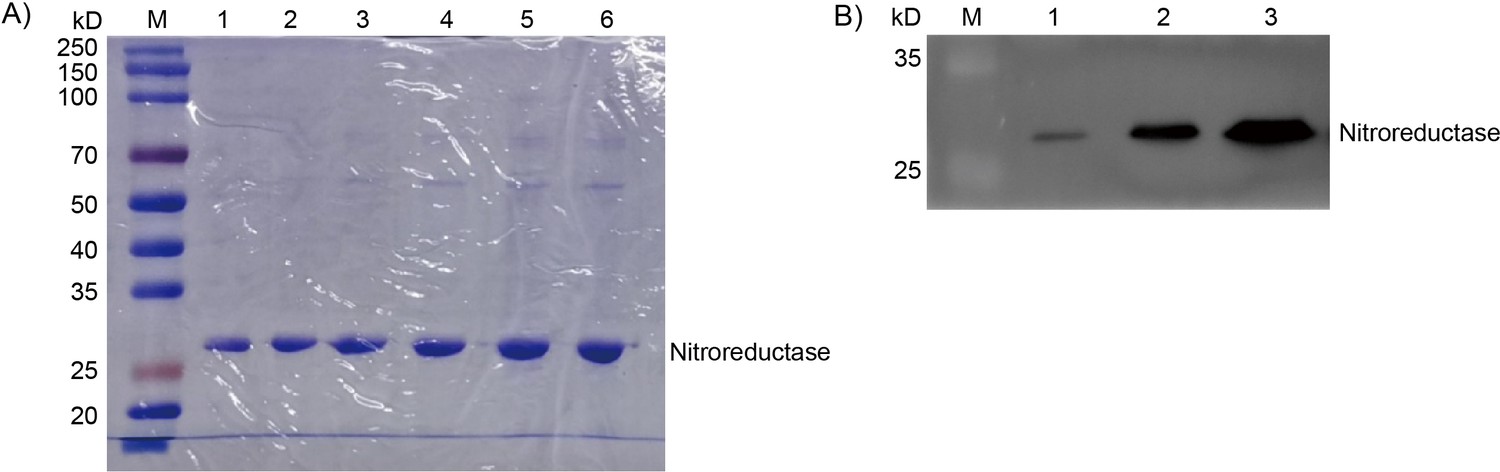
Confirmation and immunoblotting analysis of nitroreductase.
(A) SDS-PAGE (12%) confirmation and (B) Immunoblotting analysis of different concentration of Recombinant nitroreductase. M: Prestained Protein Molecular Weight Marker. (A) 1–6: 50 μg/mL, 100 μg/mL, 150 μg/mL, 200 μg/mL, 250 μg/mL, 300 μg/mL of NTR. (B) 1–3: 0.2 μg/mL, 0.8 μg/mL, 1.6 μg/mL.
Figure 1—figure supplement 2

Absorption spectra of the probe IBS440 (10 μM), IBS440 (10 μM)+ NADPH (500 μM)+ nitroreductase (9 μg/mL), IBS224 (10 μM) in reaction buffer, containing 20 % DMSO as a co-solvent.
Figure 1—figure supplement 3
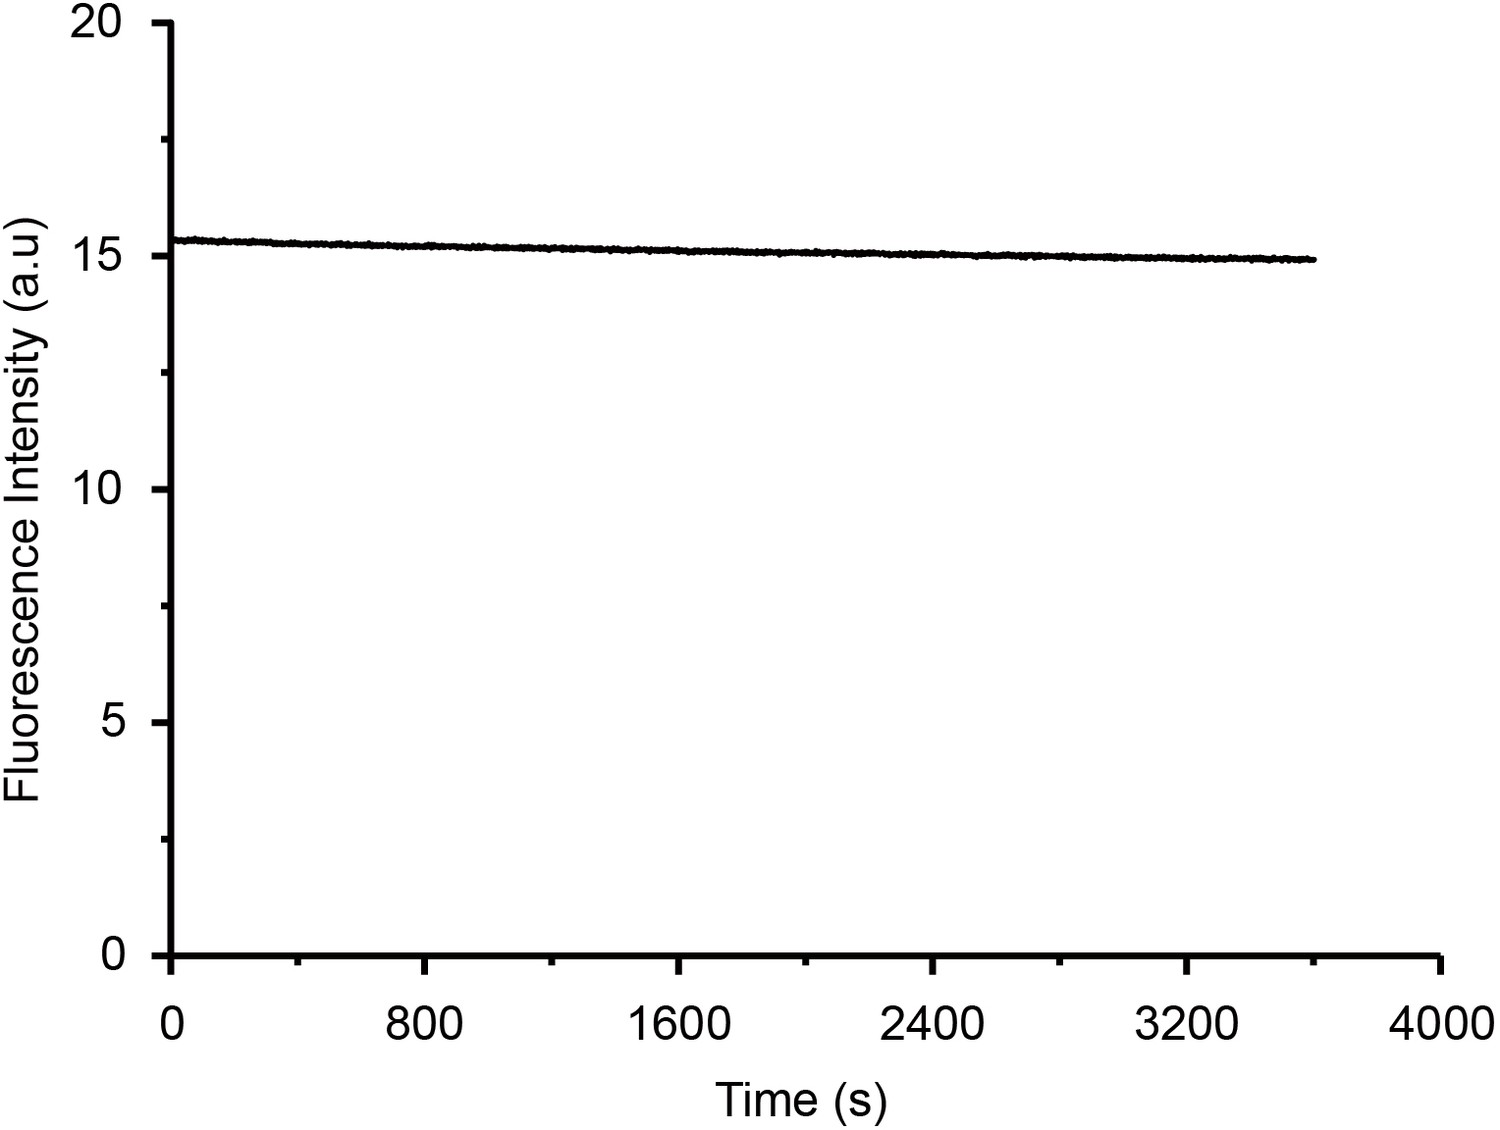
Photostability test of IBS440 (10 μM) in glycerol for 3600 s.
λex = 500 nm, λem = 610 nm.
Figure 2 with 7 supplements

Fluorescence localization of IBS440 in live cells and ex vivo tumor tissues.
(A) The cells were treated with IBS440 (5 μM) for 20 min and then stained with Hoechst 33,342 (1x) and Mito Tracker Green (10 μM) for 10 min. Blue channel (λex = 405 nm, λem = 430–480 nm). Green channel (λex = 488 nm, λem = 500–550 nm). Red channel (λex = 488 nm, λem = 580–630 nm). Scale bar: 25 μm. (B) Visualization in 3D reconstruction (i) and the max merge image of 3D structure (ii). Scale bar: 100 μm.
-
Figure 2—source data 1
The original raw data of fluorescence localization.
- https://cdn.elifesciences.org/articles/70471/elife-70471-fig2-data1-v2.zip
Figure 2—figure supplement 1
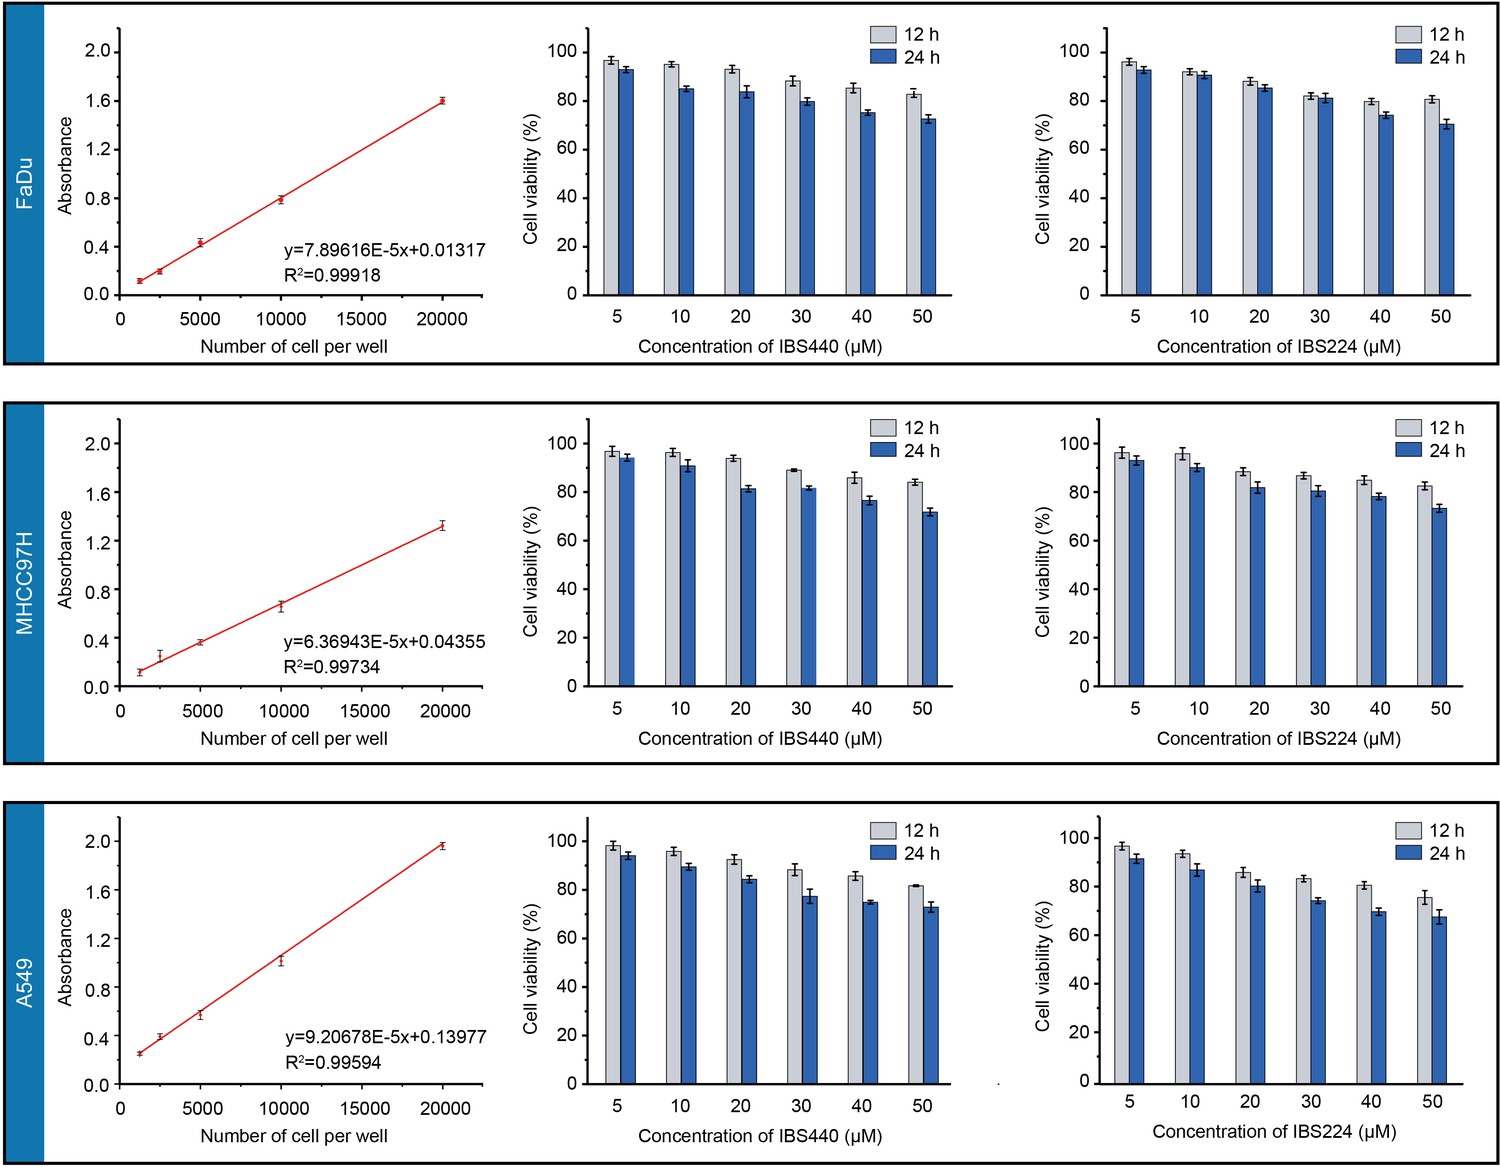
Cell viability test (%) in three cell lines (FaDu cell, MHCC97H cell and A549 cell) incubated with IBS440 or compound IBS224 (5–50 μM) for different incubation time.
The error bar is the mean standard deviation of six separate measurements.
Figure 2—figure supplement 2

Fluorescence imaging of cancerous cells (MHCC97H, FaDu and A549 cells) and noncancerous cells (RAW264.7 and A7r5 cells).
They were incubated with a commercial lipophilic mitochondrial dye Mito-Tracker Green (1 μM) for 20 min. Blue channel (λex = 405 nm, λem = 430–480 nm). Green channel (λex = 488 nm, λem = 500–550 nm). Scale bar: 25 μm.
-
Figure 2—figure supplement 2—source data 1
The original raw data of fluorescence imaging of Mito-Tracker Green.
- https://cdn.elifesciences.org/articles/70471/elife-70471-fig2-figsupp2-data1-v2.zip
Figure 2—figure supplement 3
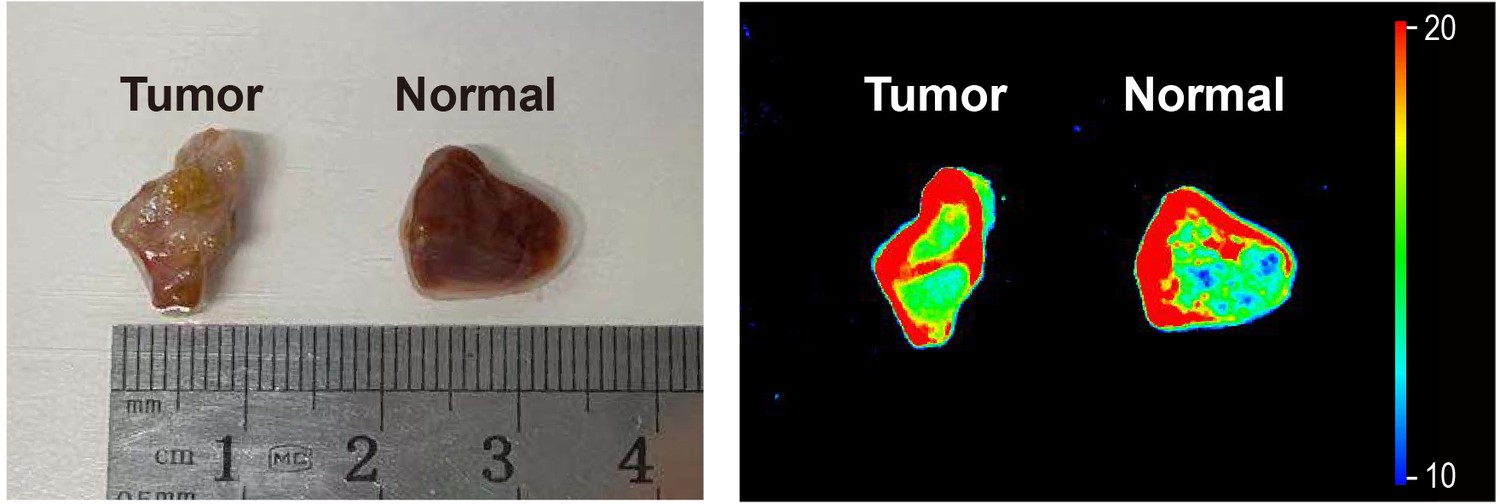
Fluorescence imaging of hepatocellular tumor and normal tissues.
They were incubated with a commercial lipophilic mitochondrial dye Mito-Tracker Green (1 μM) for 20 min. Blue channel (λex = 405 nm, λem = 430–480 nm). Green channel (λex = 488 nm, λem = 500–550 nm).
Figure 2—figure supplement 4

HIF-1α expression level in three different cell lines under normoxia (20 % O2) and hypoxia (2 % O2) conditions for 12 hr or 24 hr by immunoblotting.
β-actin were served as loading control.
Figure 2—figure supplement 5
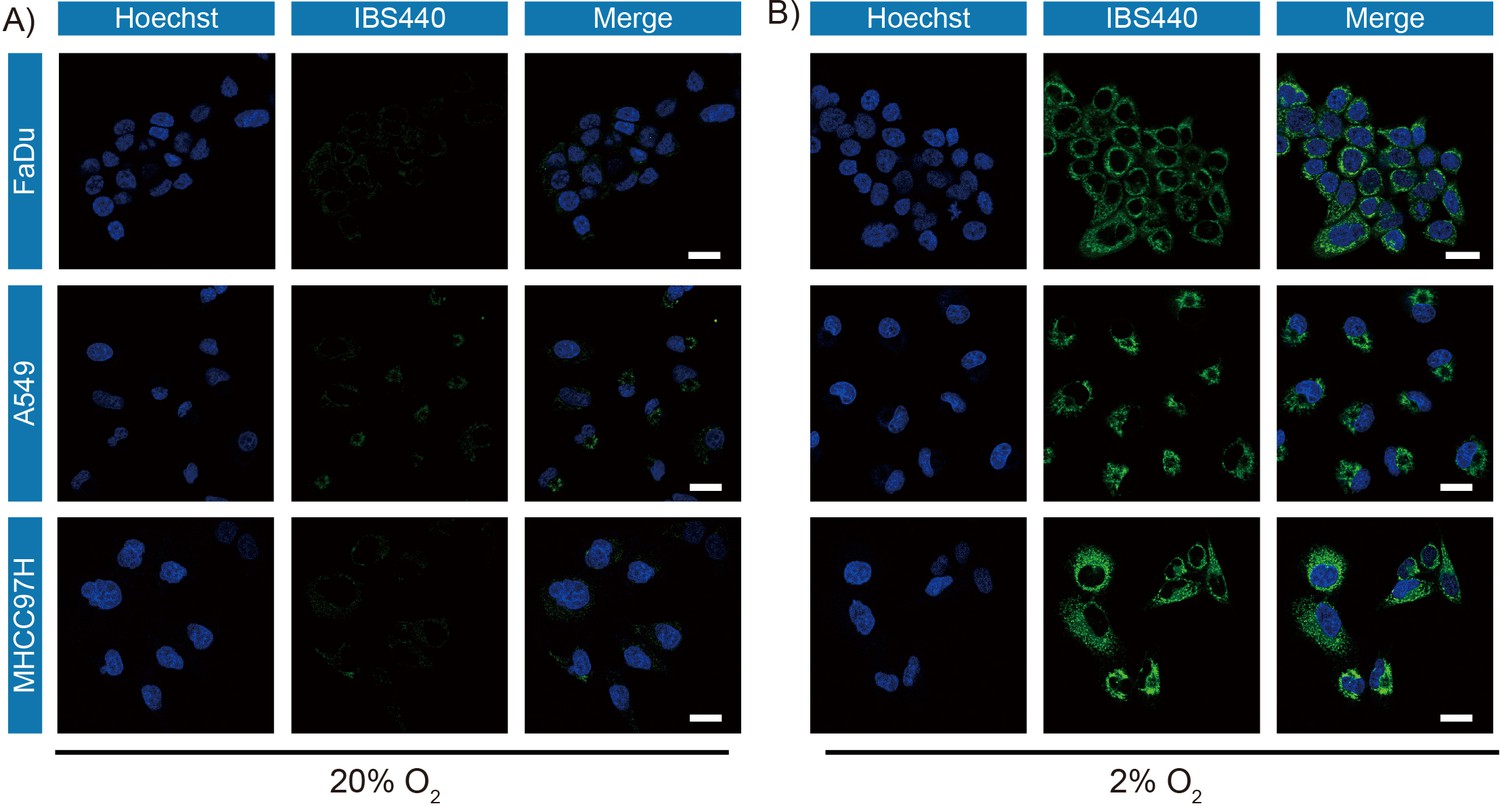
Fluorescence imaging of hypoxia in live cells.
(A) Cells were cultured under normoxic (20 % O2) for 12 hr and then treated with IBS440. (B) Cells were cultured under hypoxic (2 % O2) conditions for 12 hr and then treated with IBS440. Blue channel (λex = 405 nm, λem = 430–480 nm). Green channel (λex = 488 nm, λem = 500–550 nm). Scale bar: 25 μm.
-
Figure 2—figure supplement 5—source data 1
The original raw data of fluorescence imaging of hypoxia in live cells.
- https://cdn.elifesciences.org/articles/70471/elife-70471-fig2-figsupp5-data1-v2.zip
Figure 2—figure supplement 6
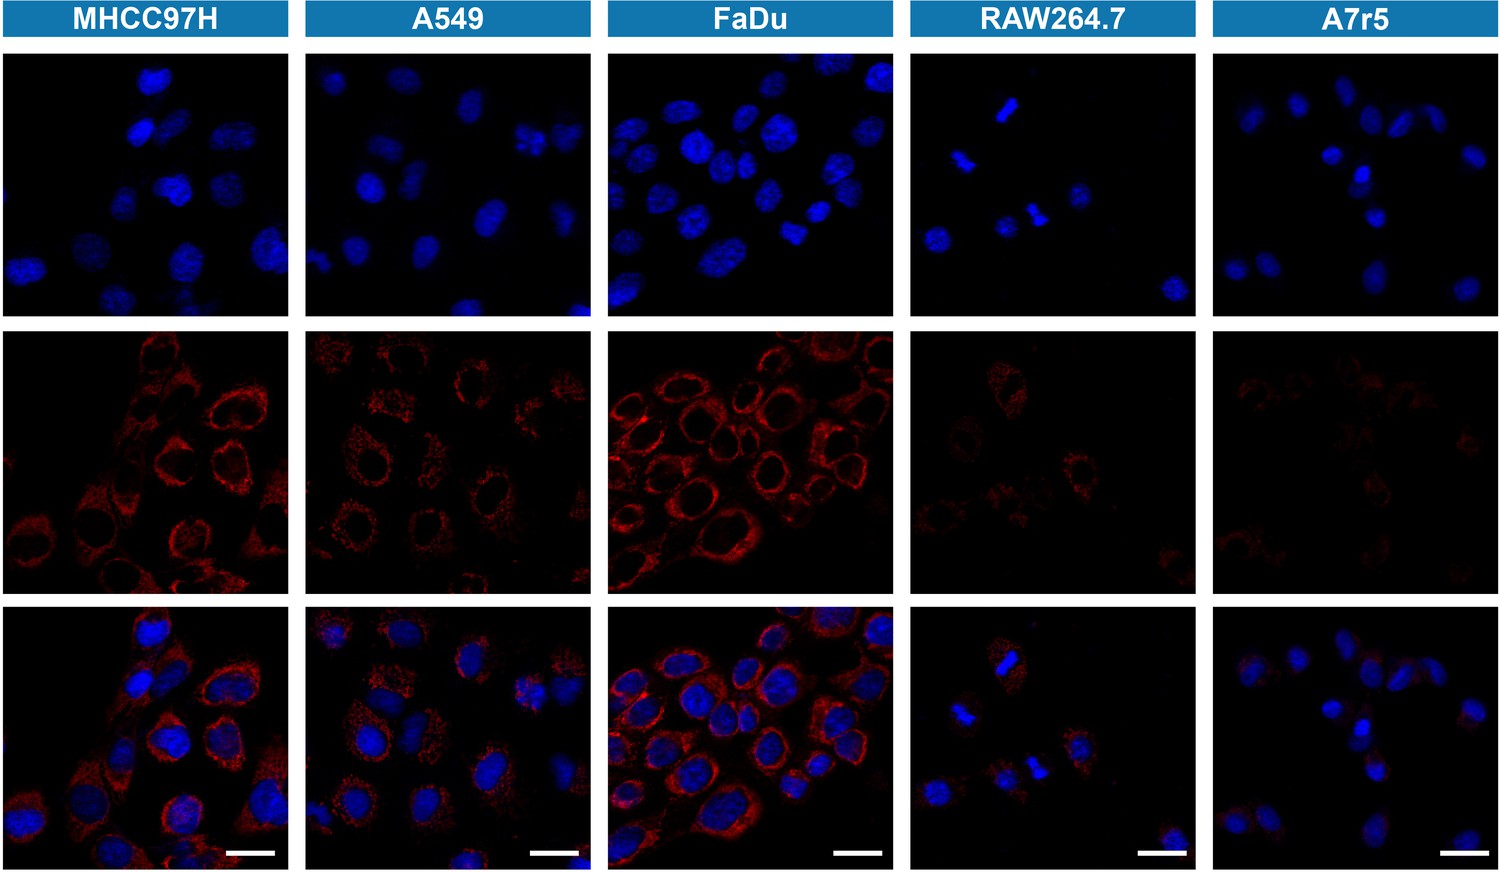
Fluorescence imaging of viscosity in cancer cells (MHCC97H, FaDu and A549 cells) and normal cells (RAW264.7 and A7r5 cells) treated with IBS440 (5 μM) for 20 min.
Blue channel (λex = 405 nm, λem = 430–480 nm). Red channel (λex = 488 nm, λem = 580–630 nm). Scale bar: 25 μm.
-
Figure 2—figure supplement 6—source data 1
The original raw data of fluorescence imaging of viscosity in live cells.
- https://cdn.elifesciences.org/articles/70471/elife-70471-fig2-figsupp6-data1-v2.zip
Figure 2—figure supplement 7
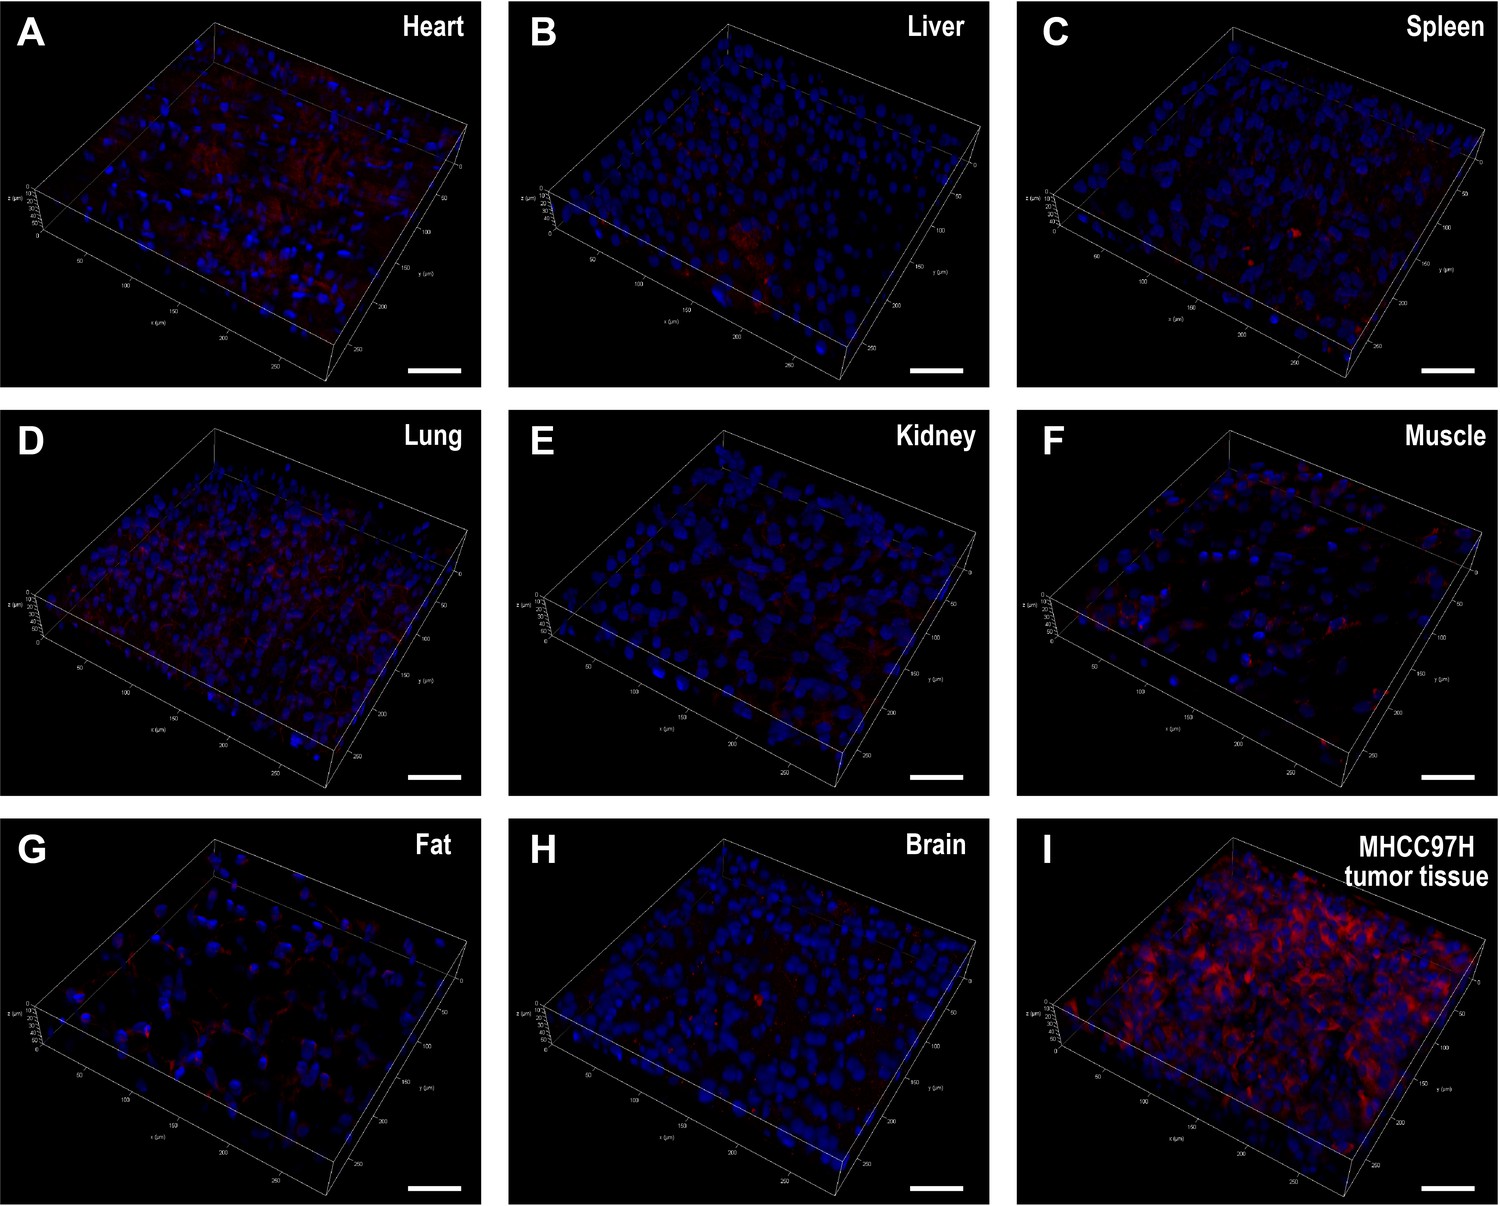
Visualization of the normal tissues of mice (A).
heart, B. liver, C. spleen, D. lung, E. kidney, F muscle, G. fat, H. brain and MHCC97H tumor tissue (I) in confocal fluorescence 3D reconstruction. All tissues were incubated with IBS440 (10 μM) for 20 min. Blue channel (λex = 405 nm, λem = 430–480 nm). Red channel (λex = 488 nm, λem = 580–630 nm). Scale bar: 50 μm.
-
Figure 2—figure supplement 7—source data 1
The original raw data of fluorescence 3D reconstruction image in tissues.
- https://cdn.elifesciences.org/articles/70471/elife-70471-fig2-figsupp7-data1-v2.zip
Figure 3 with 1 supplement

In vivo and ex vivo fluorescence imaging of mouse tumors.
(A) In vivo fluorescence imaging of the tumor-bearing mice after stained with IBS440. (B) Ex vivo fluorescence imaging of the major organs (heart, liver, spleen, lung, and kidney) and tumor tissues of tumor-bearing mice. (C) Hematoxylin and eosin microscopic imaging of the resected tumor tissues. Scale bar: 100 μm.
-
Figure 3—source data 1
The original raw data of fluorescence imaging of mouse tumor.
- https://cdn.elifesciences.org/articles/70471/elife-70471-fig3-data1-v2.zip
-
Figure 3—source data 2
The original raw data of fluorescence imaging of mouse tumor.
- https://cdn.elifesciences.org/articles/70471/elife-70471-fig3-data2-v2.zip
Figure 3—figure supplement 1
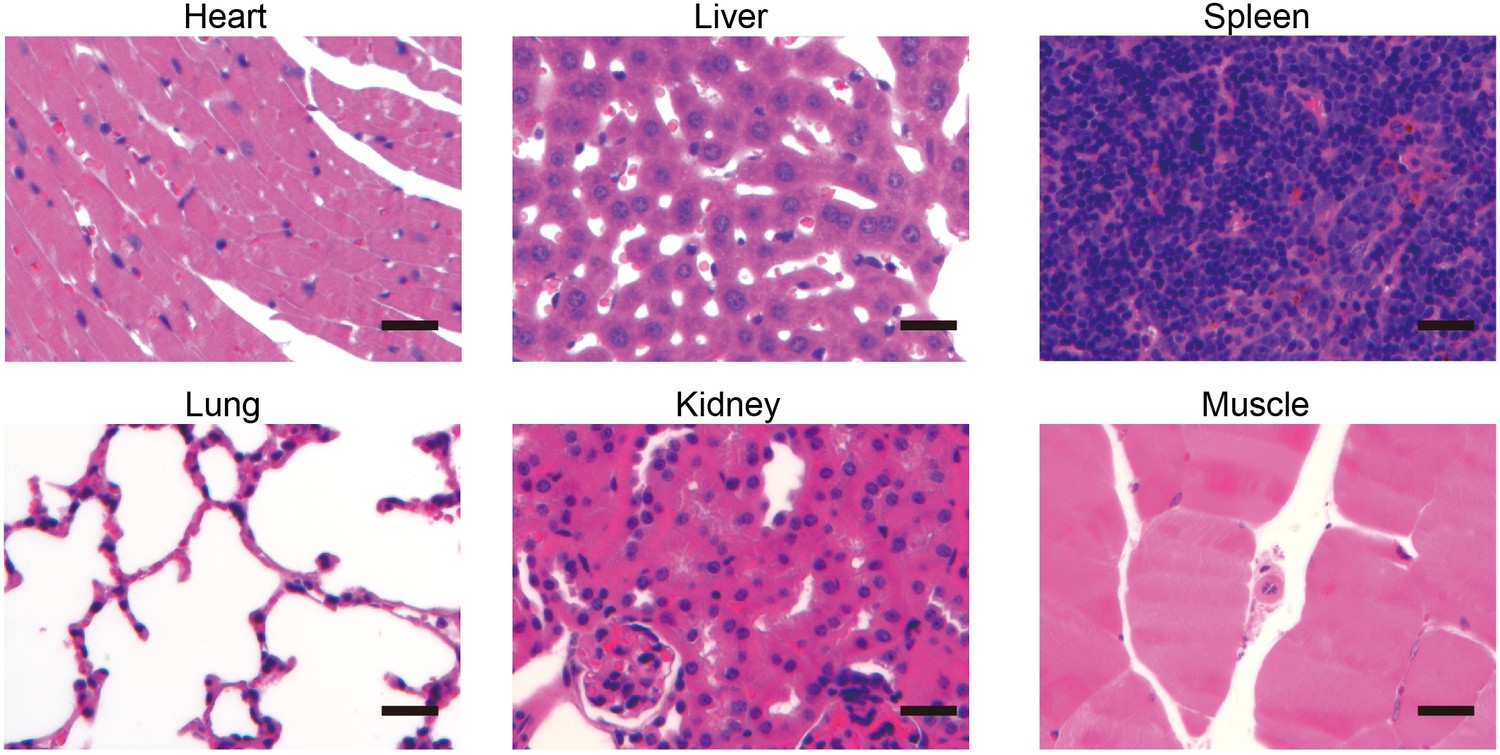
Hematoxylin and eosin staining of the major organ of the tumor-bearing mice.
Figure 4 with 1 supplement
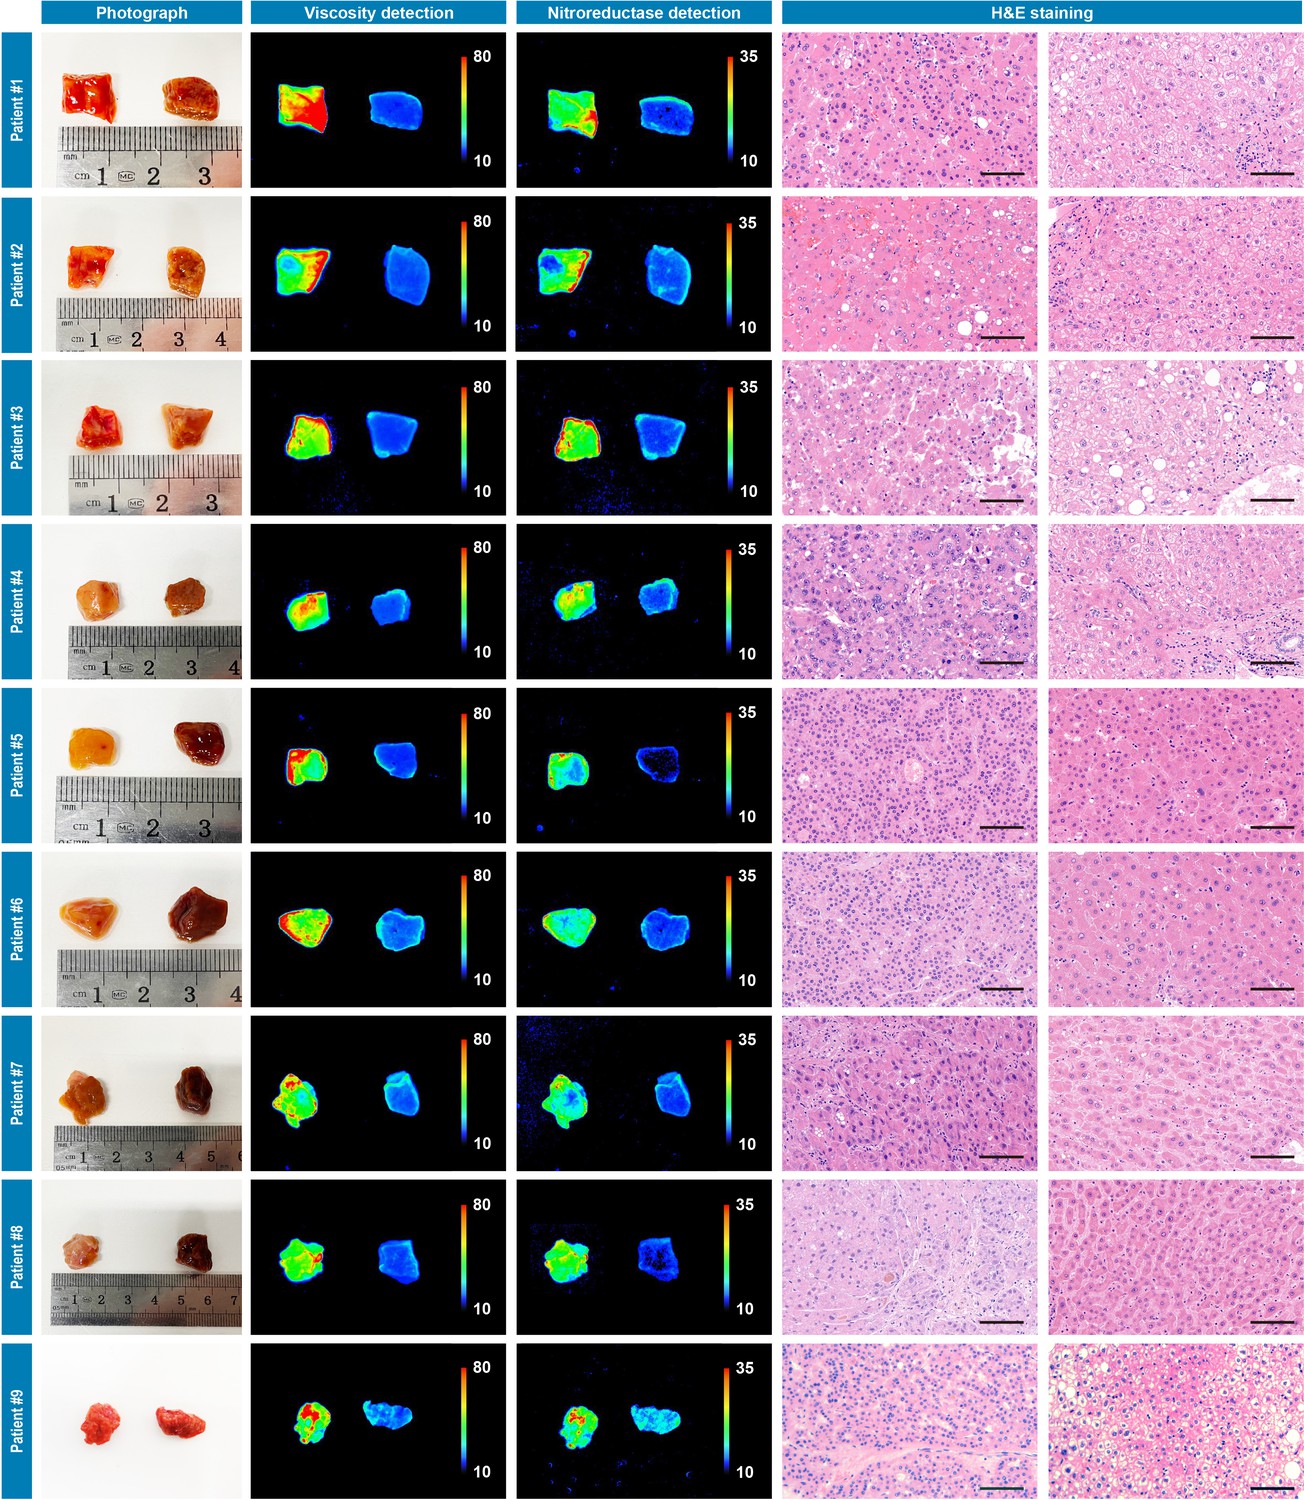
Photograph imaging, fluorescence imaging, and hematoxylin and eosin microscopic imaging of nine pairs of cancerous/noncancerous tissues derived from nine individual hepatocellular cancer patients.
They were incubated with IBS440 (10 μM) for 20 min and taken imaging. Scale bar: 100 μm.
-
Figure 4—source data 1
The original raw data of fluorescence imaging and hematoxylin and eosin staining results of nine pairs of cancerous/noncancerous liver tissues.
- https://cdn.elifesciences.org/articles/70471/elife-70471-fig4-data1-v2.zip
Figure 4—figure supplement 1
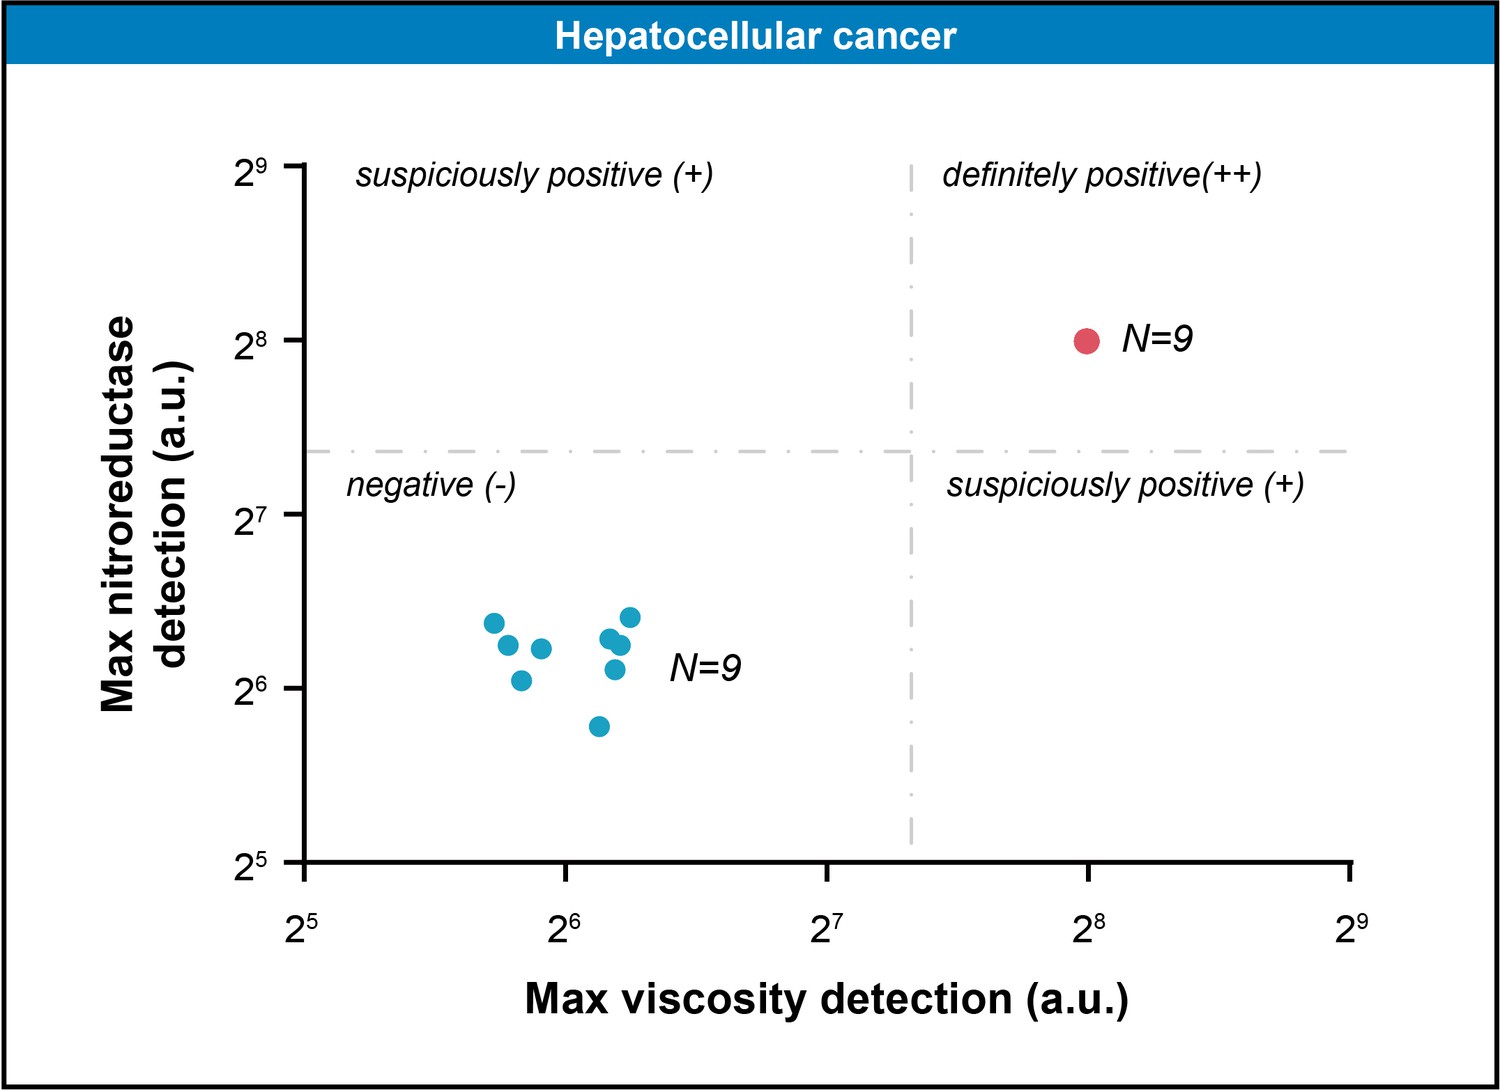
The scatter plot represented the maximal gray-scales signal intensities of nine pairs of liver tissue samples in nitroreductase and viscosity detection channels.
The threshold (160.3,164.3) was computed by K-means clustering algorithm.
Figure 5 with 5 supplements
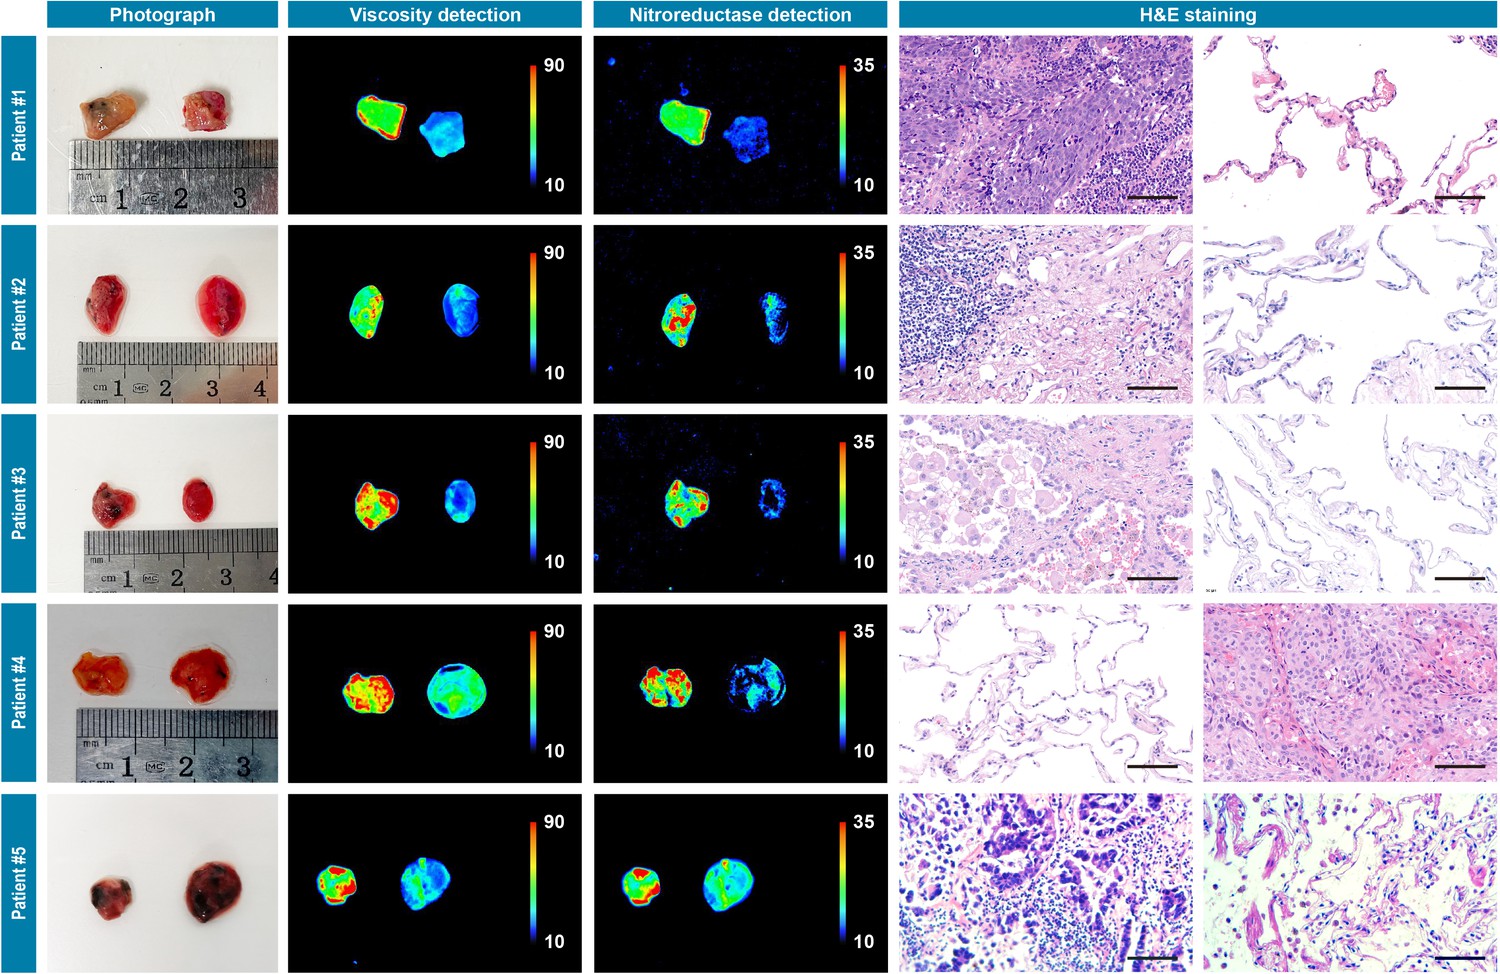
Photograph imaging, fluorescence imaging, and hematoxylin and eosin microscopic imaging of five pairs of cancerous/noncancerous tissues derived from five individual lung cancer patients.
They were incubated with IBS440 (10 μM) for 20 min and taken imaging. Scale bar: 100 μm.
-
Figure 5—source data 1
The original raw data of fluorescence imaging and hematoxylin and eosin staining results of five pairs of cancerous/noncancerous lung tissues.
- https://cdn.elifesciences.org/articles/70471/elife-70471-fig5-data1-v2.zip
Figure 5—figure supplement 1

The scatter plot represented the maximal gray-scales signal intensities of five pairs of lung tissue samples in nitroreductase and viscosity detection channels.
The threshold (164.4,165.8) was computed by K-means clustering algorithm.
Figure 5—figure supplement 2
Photograph imaging, fluorescence imaging, and hematoxylin and eosin microscopic imaging of five pairs of cancerous/noncancerous tissues derived from five individual oral cancer patients.
They were incubated with IBS440 (10 μM) for 20 min and taken imaging. Scale bar: 100 μm.
-
Figure 5—figure supplement 2—source data 1
The original raw data of fluorescence imaging and hematoxylin and eosin staining results of five pairs of cancerous/noncancerous oral tissues.
- https://cdn.elifesciences.org/articles/70471/elife-70471-fig5-figsupp2-data1-v2.zip
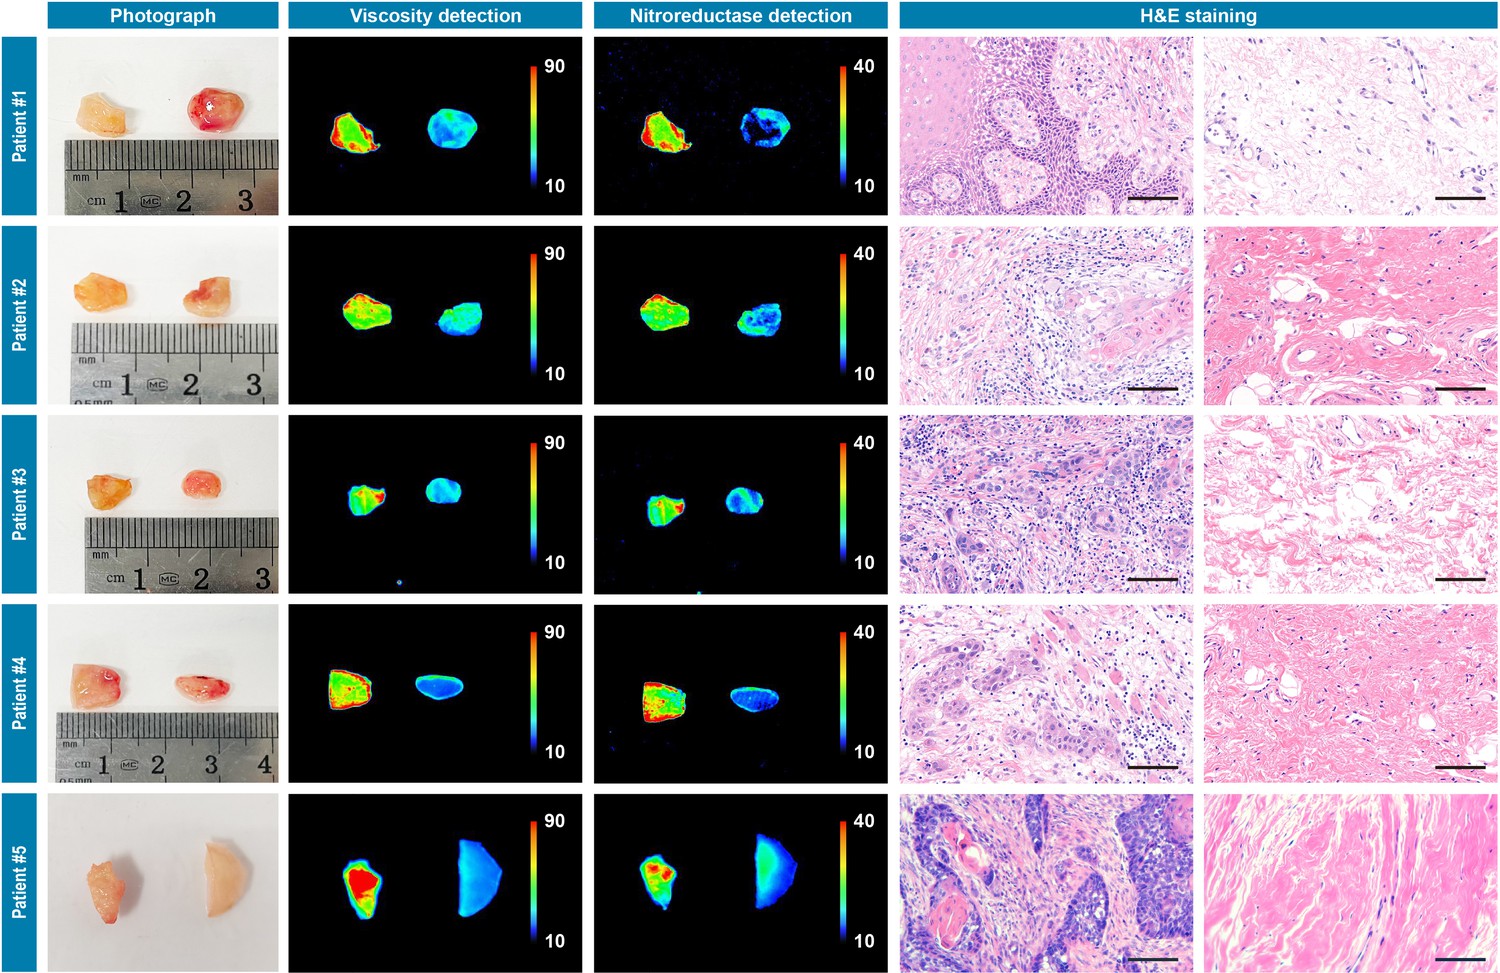
Figure 5—figure supplement 3
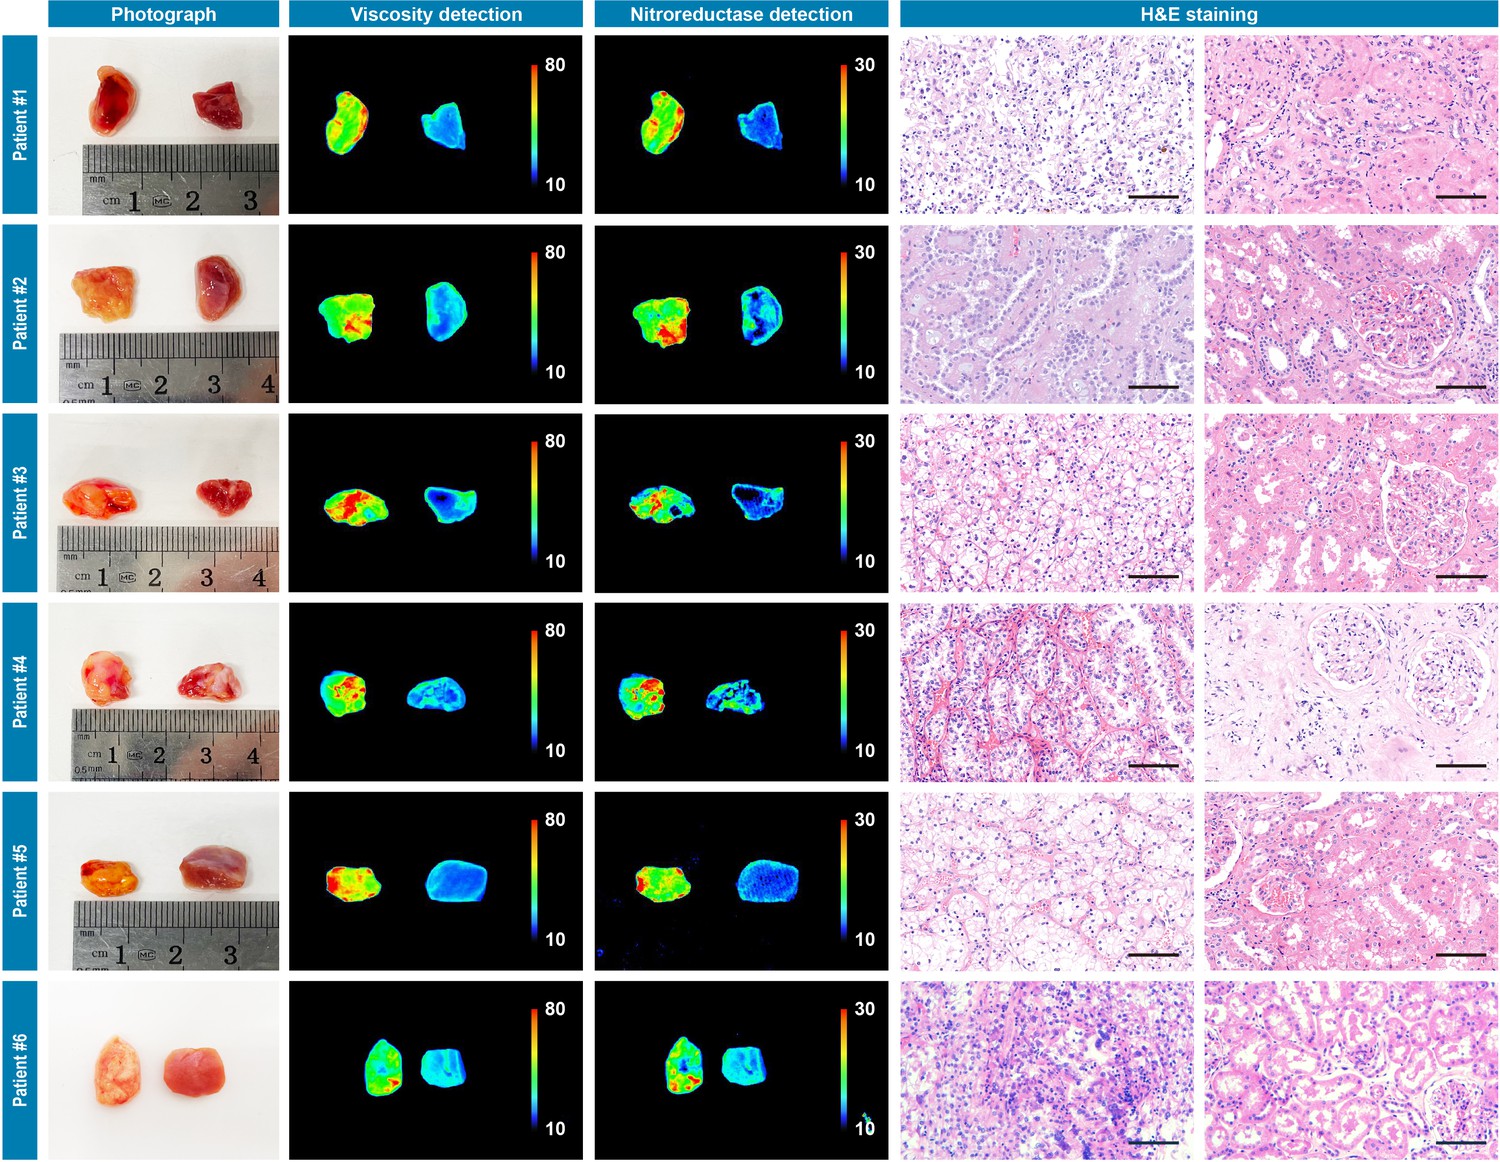
Photograph imaging, fluorescence imaging, and hematoxylin and eosin microscopic imaging of six pairs of cancerous/noncancerous tissues derived from six individual renal cancer patients.
They were incubated with IBS440 (10 μM) for 20 min and taken imaging. Scale bar: 100 μm.
-
Figure 5—figure supplement 3—source data 1
The original raw data of fluorescence imaging and hematoxylin and eosin staining results of six pairs of cancerous/noncancerous renal tissues.
- https://cdn.elifesciences.org/articles/70471/elife-70471-fig5-figsupp3-data1-v2.zip
Figure 5—figure supplement 4
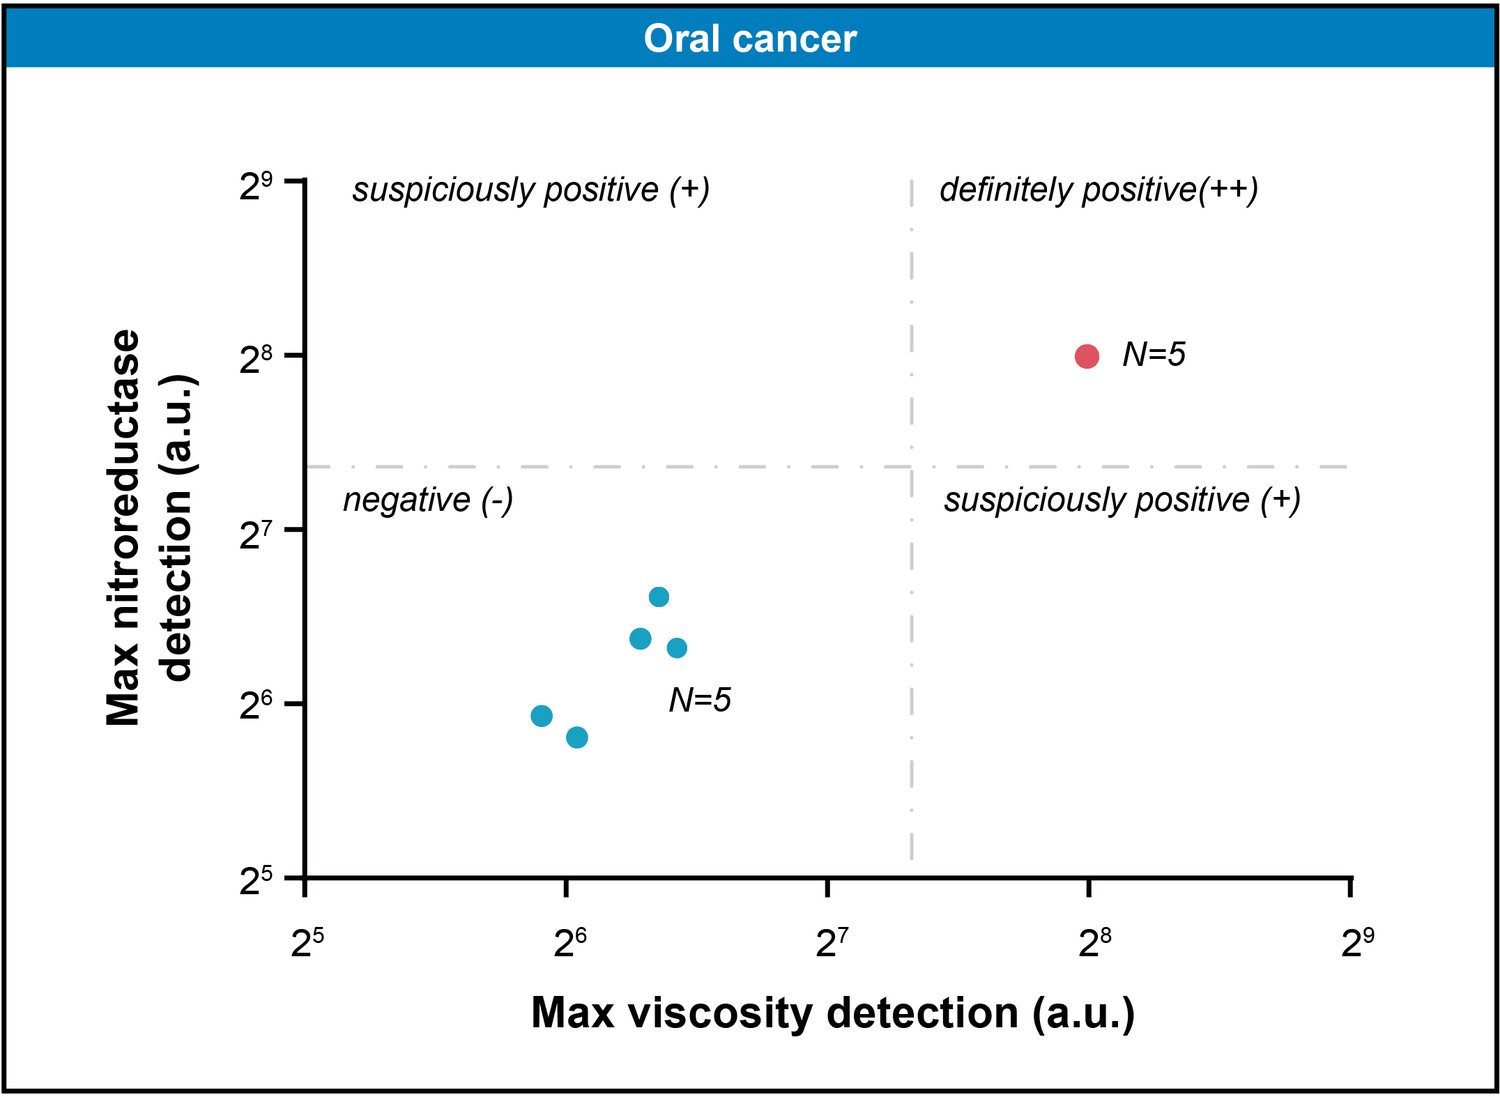
The scatter plot represented the maximal gray-scales signal intensities of five pairs of oral tissue samples in nitroreductase and viscosity detection channels.
The threshold (164.7,165.3) was computed by K-means clustering algorithm.
Figure 5—figure supplement 5
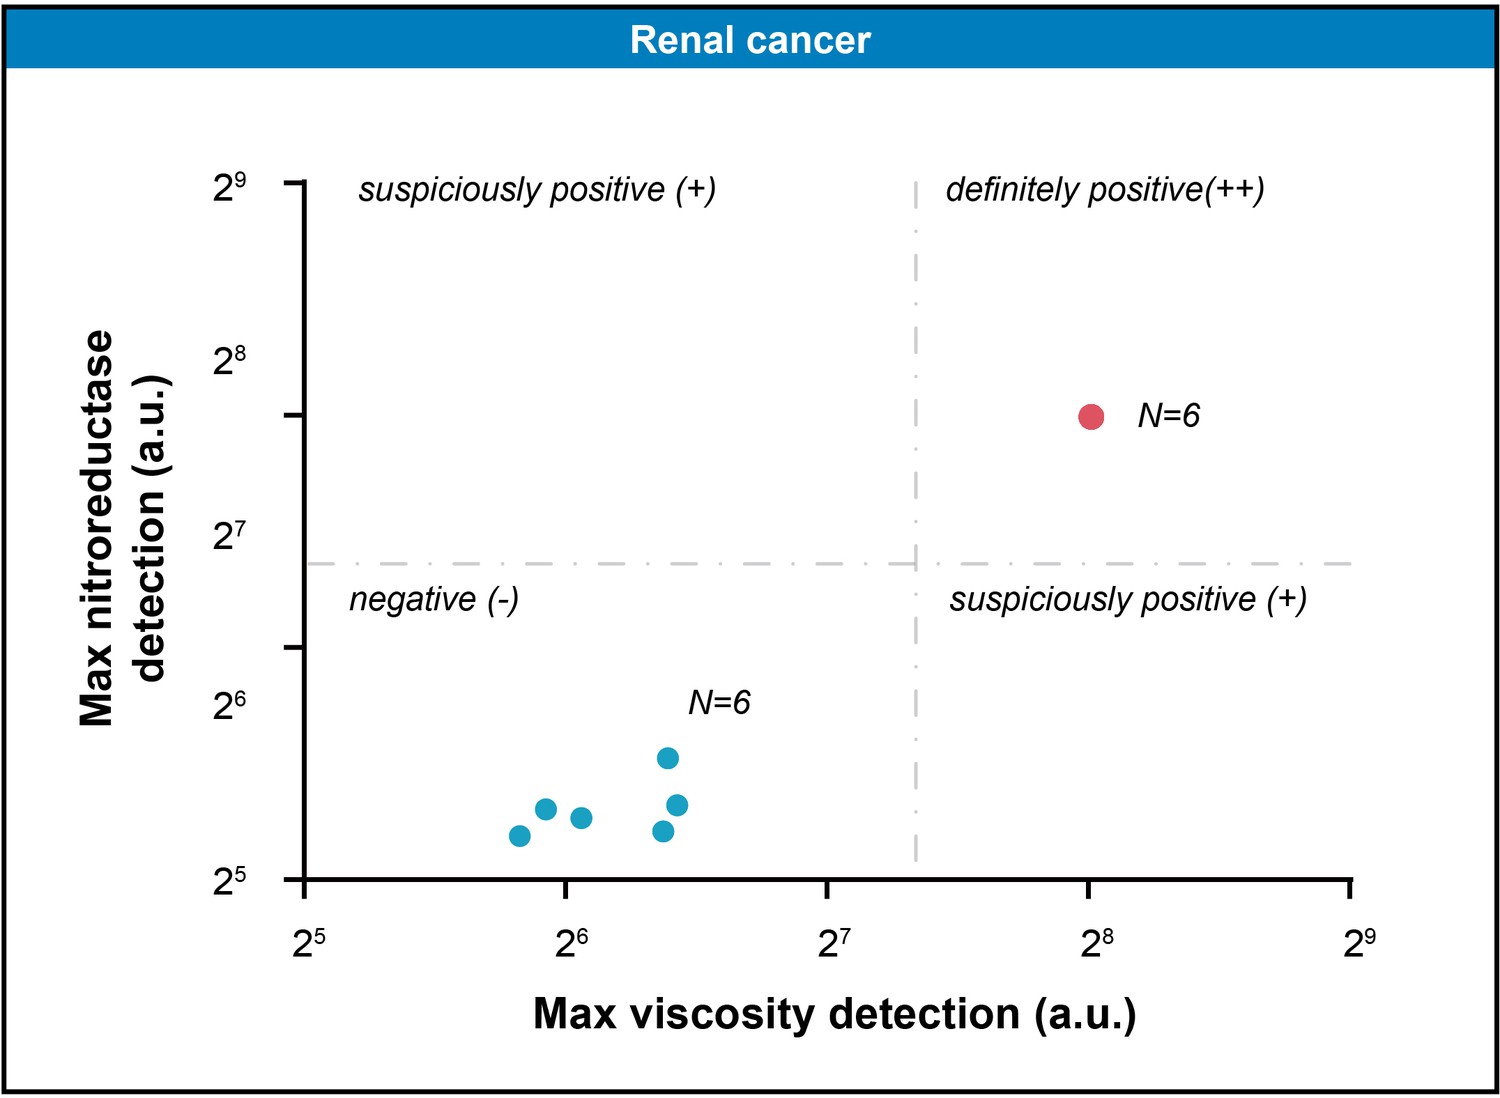
The scatter plot represented the maximal gray-scales signal intensities of six pairs of renal tissue samples in nitroreductase and viscosity detection channels.
The threshold (163.5, 167.1) was computed by K-means clustering algorithm.
Figure 6 with 1 supplement
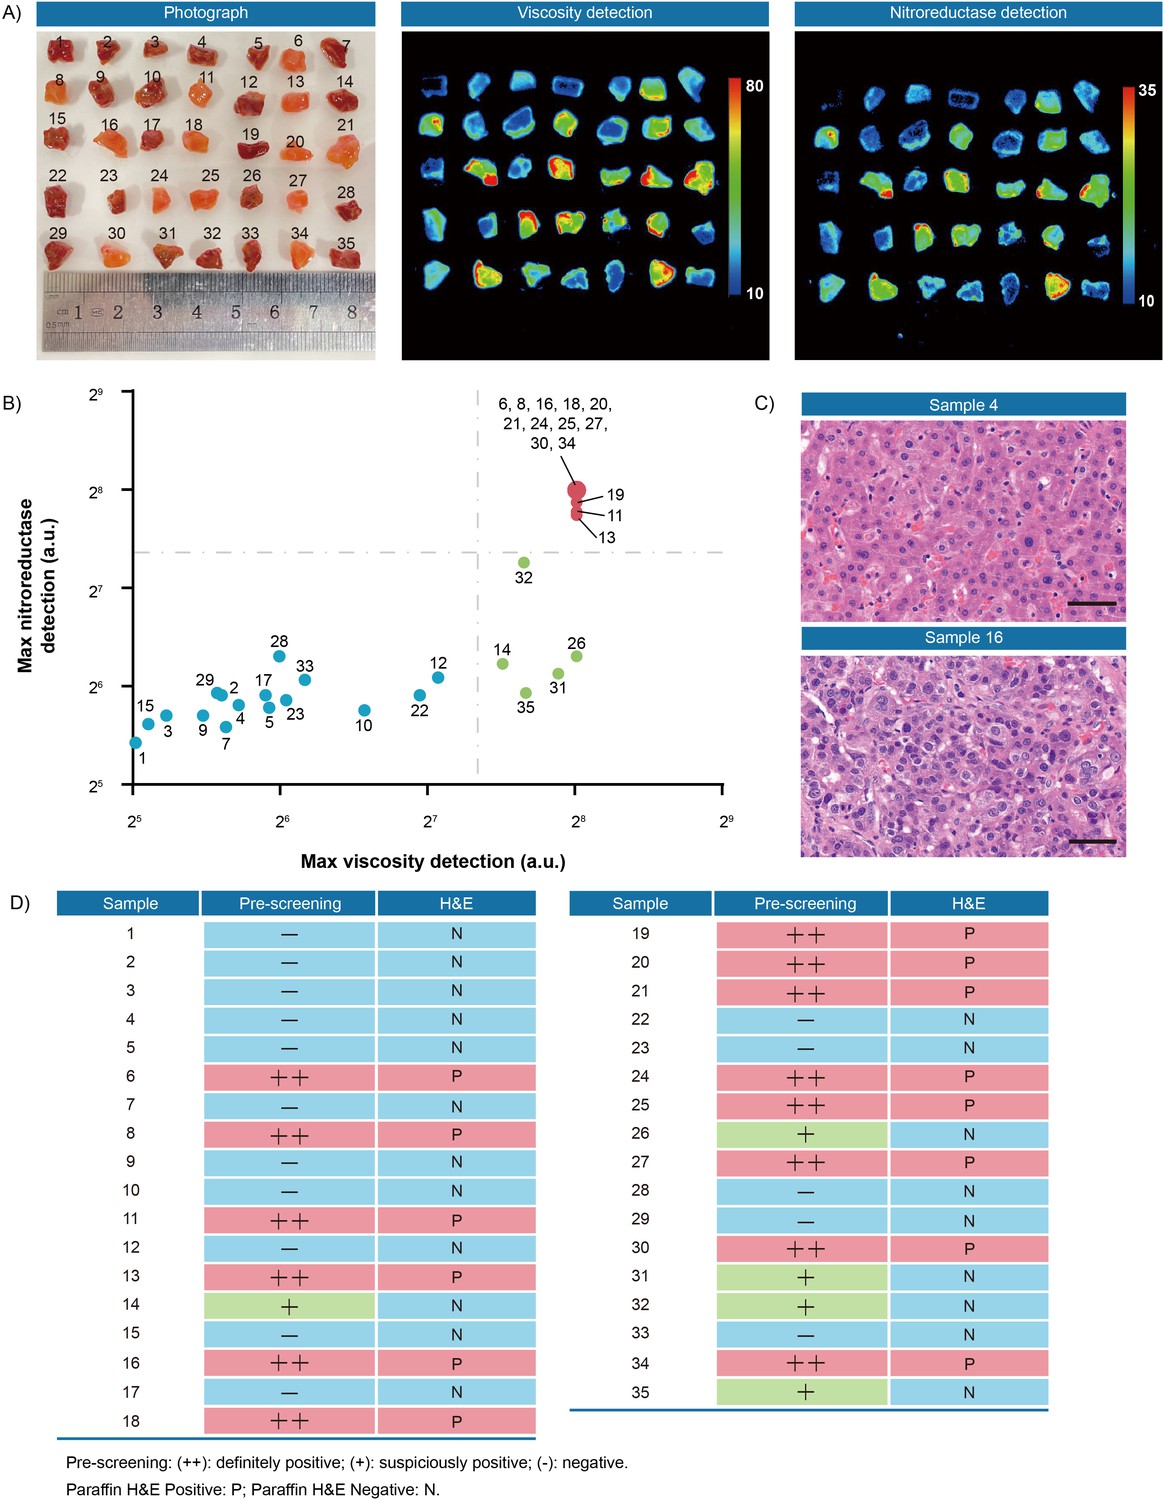
Fluorescence pre-screening of 35 pieces of resection margin tissues derived from one hepatocellular cancer patient.
(A) Photograph imaging and fluorescence imaging of resected tissues. (B) Clustering analysis using K-means algorithm on the maximal gray-scales signal intensities of each tissue sample in nitroreductase and viscosity detection channels. (C) Hematoxylin and eosin microscopic imaging of the representative liver samples. Scale bar: 50 μm. (D) The correlation analysis of liver tissue samples between fluorescence signals and hematoxylin and eosin staining results. Pre-screening: (++): definitely positive; (+): suspiciously positive; (-): negative. Paraffin H&E Positive: P; Paraffin H&E Negative: N.
-
Figure 6—source data 1
The original raw data of fluorescence imaging and hematoxylin and eosin staining results of 35 pieces of resection margin tissues.
- https://cdn.elifesciences.org/articles/70471/elife-70471-fig6-data1-v2.zip
Figure 6—figure supplement 1

Hematoxylin and eosin staining results of 35 pieces of resected margin tissues derived from one hepatocellular cancer patient.
Figure 7 with 1 supplement
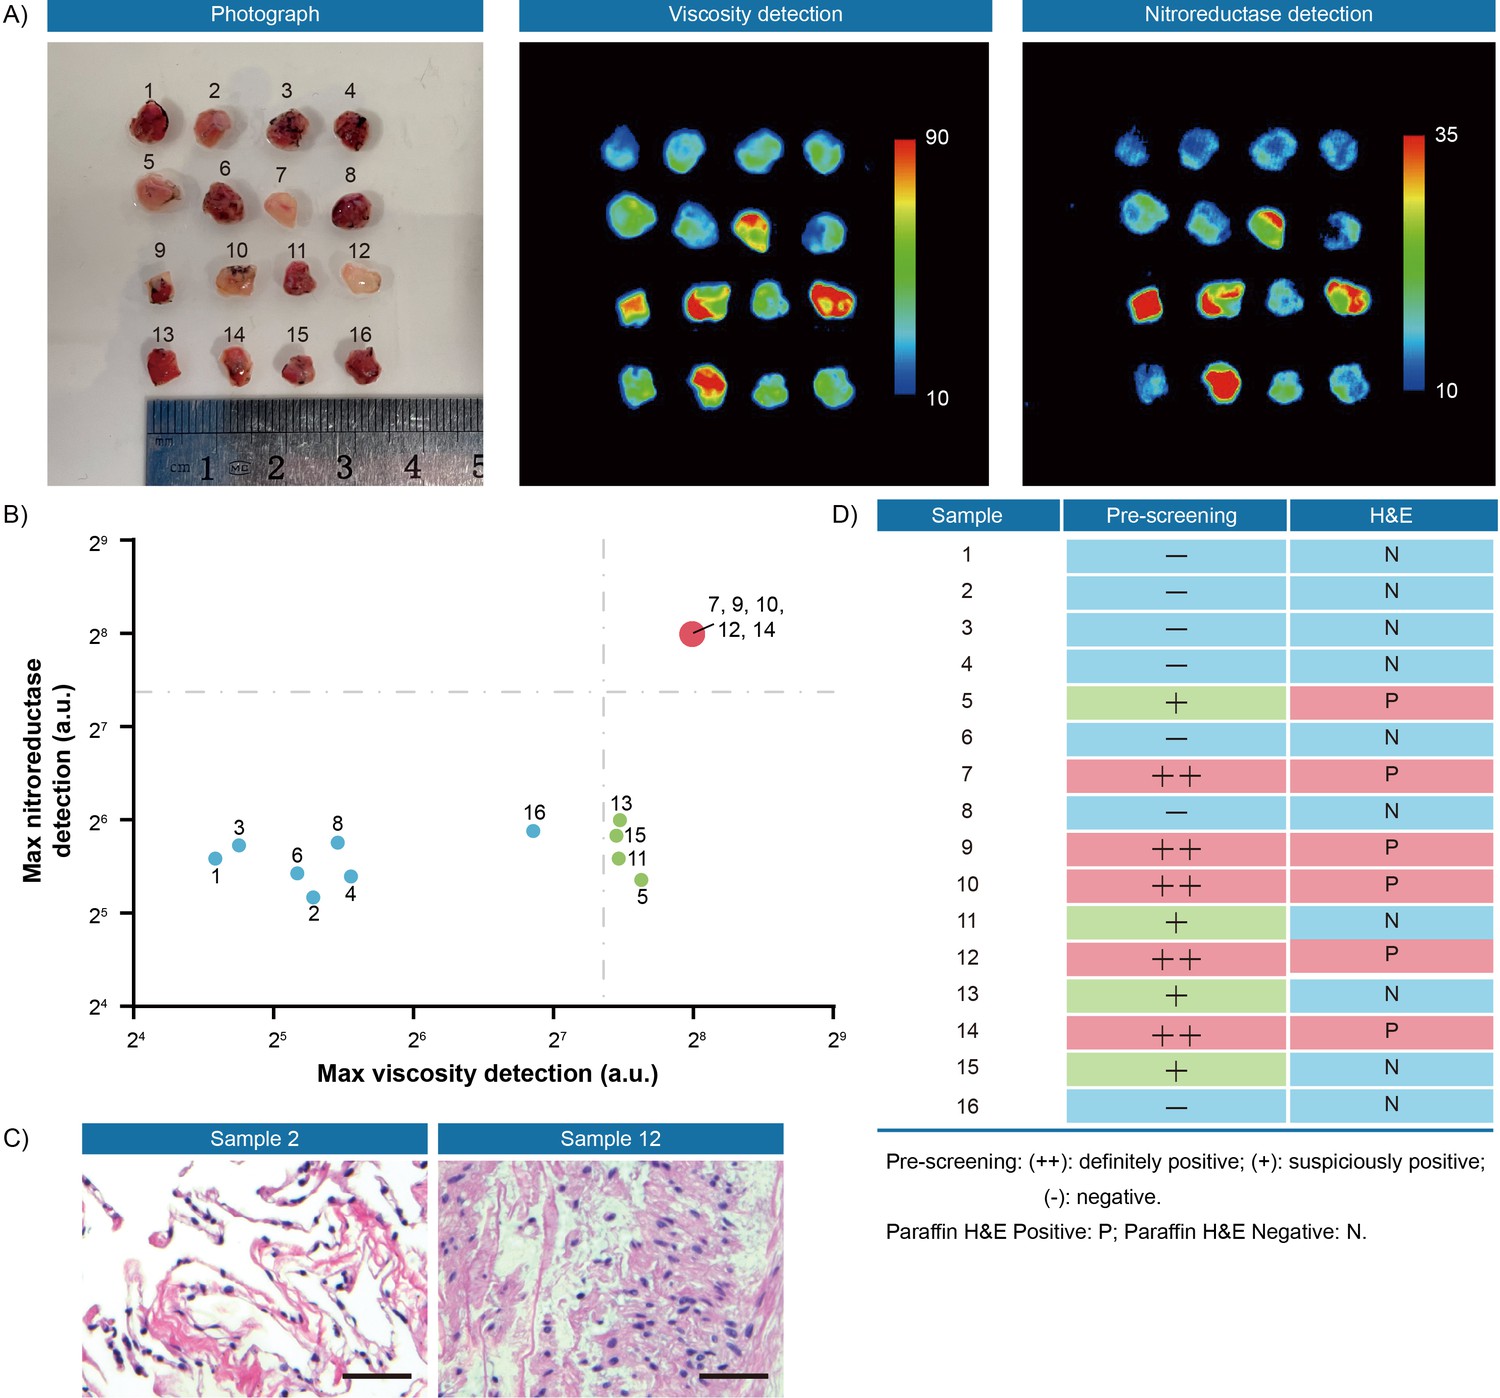
Fluorescence pre-screening of 16 pieces of resection margin tissues derived from one lung cancer patient.
(A) Photograph imaging and fluorescence imaging of resected tissues. (B) Clustering analysis using K-means algorithm on the maximal gray-scales signal intensities of each tissue sample in nitroreductase and viscosity detection channels. (C) Hematoxylin and eosin microscopic imaging of the representative lung samples. Scale bar: 50 μm. (D) The correlation analysis of lung tissue samples between fluorescence signals and hematoxylin and eosin staining results. Pre-screening: (++): definitely positive; (+): suspiciously positive; (-): negative. Paraffin H&E Positive: P; Paraffin H&E Negative: N.
-
Figure 7—source data 1
The original raw data of fluorescence imaging and hematoxylin and eosin staining results of 16 pieces of resection margin tissues.
- https://cdn.elifesciences.org/articles/70471/elife-70471-fig7-data1-v2.zip
Figure 7—figure supplement 1
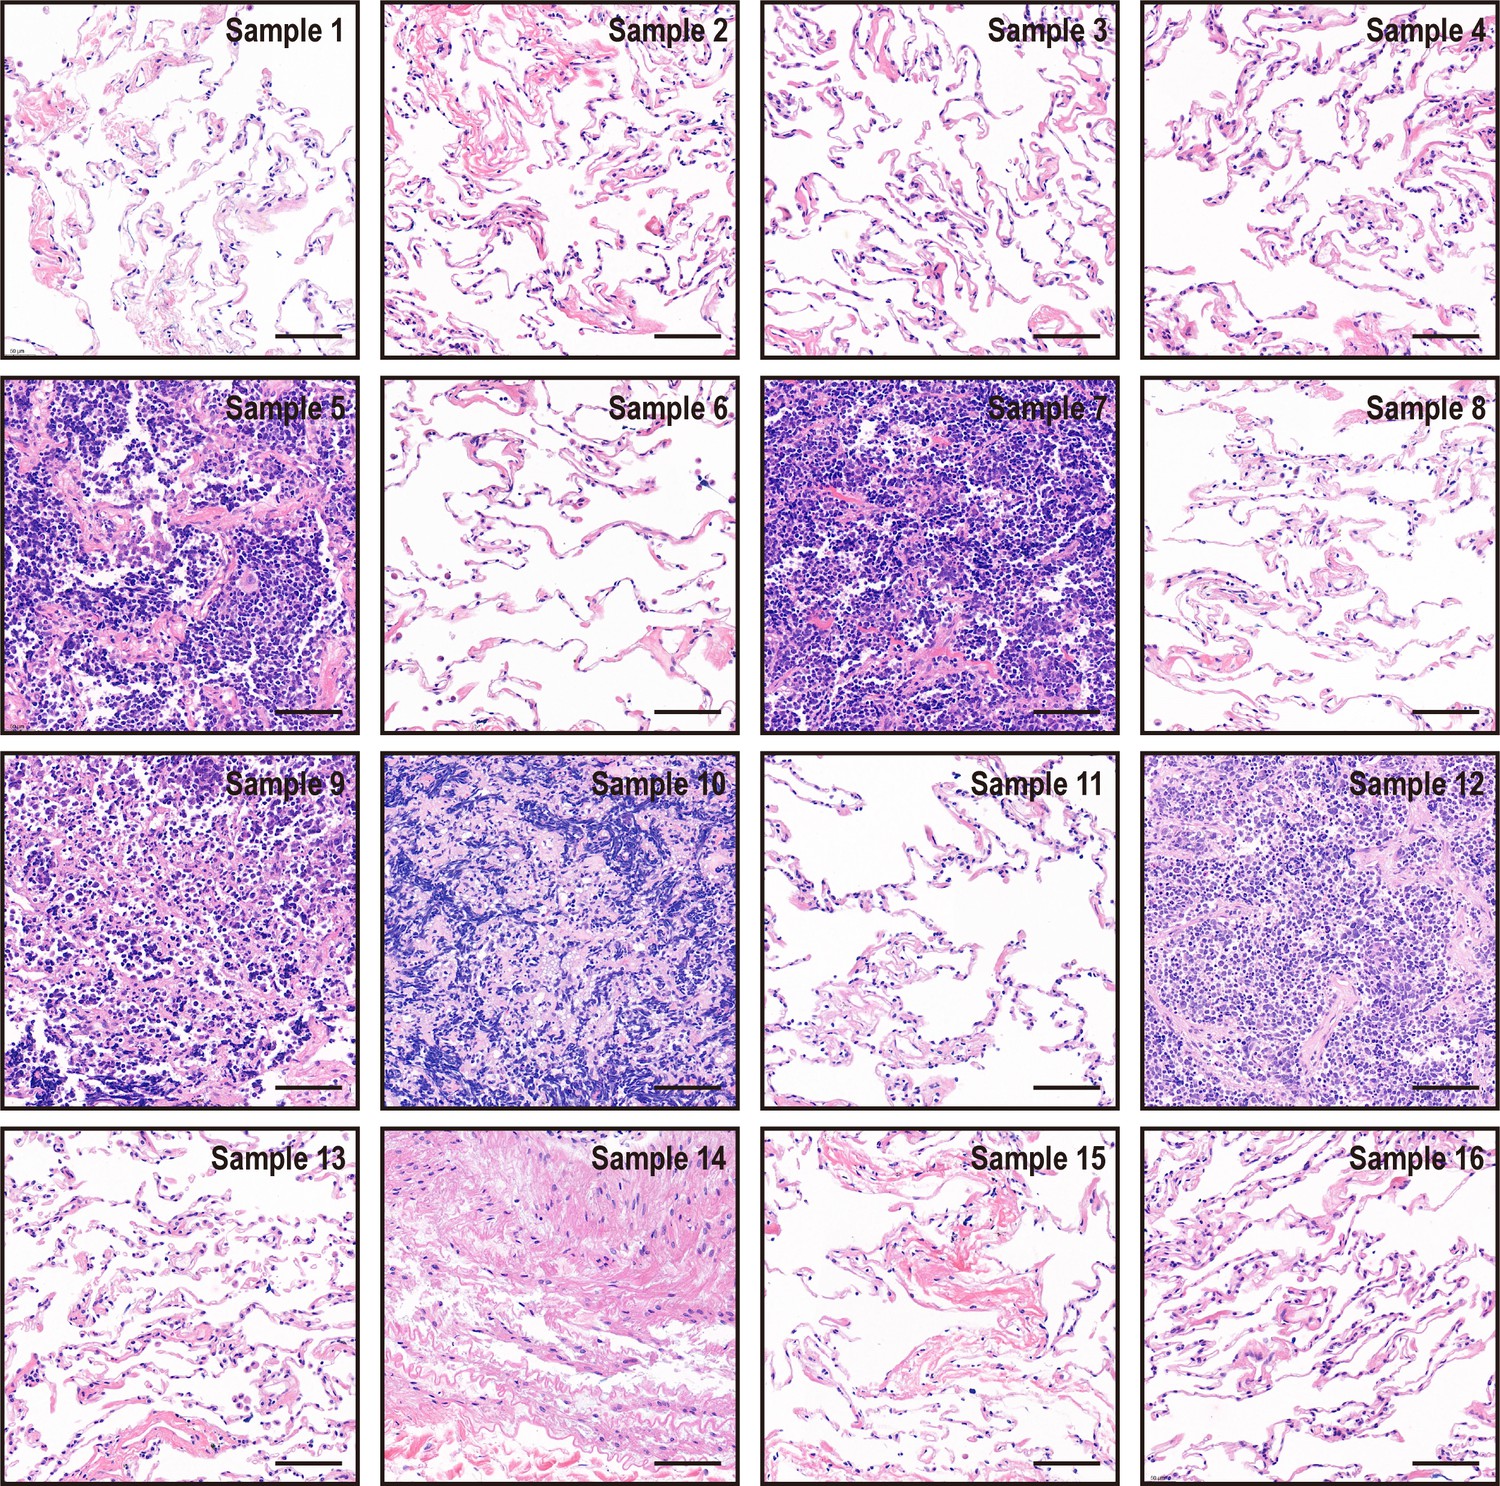
Hematoxylin and eosin staining results of 16 pieces of resected margin tissues derived from one lung cancer patient.
Figure 8
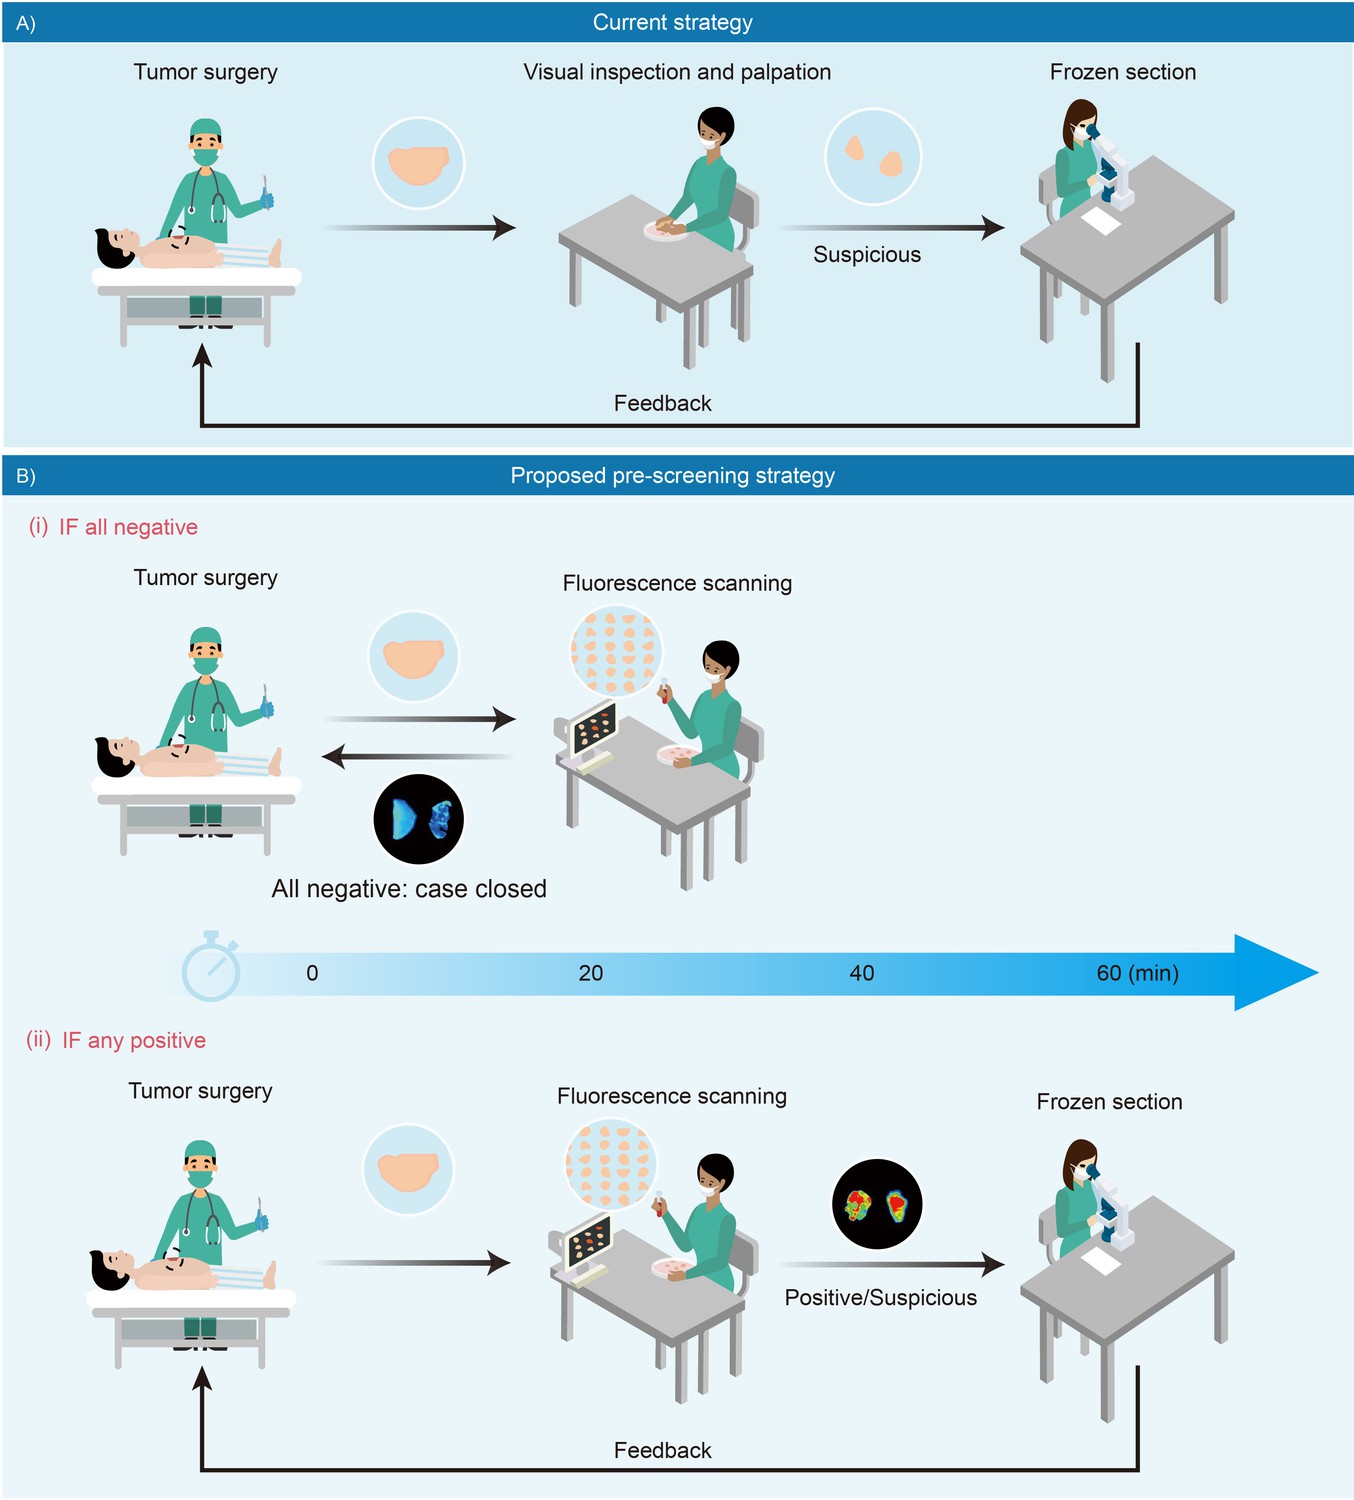
Schematic presentation of intraoperative pathological assessment.
(A) The current strategy used during a tumor operation. Based on surgeon’s gross examination, multiple resected tissues are prioritized for frozen-section analysis. Occasionally, an extended resection is indicated with positive feedback to avoid unnecessary re-operations. In principle, frozen section analysis takes minimally 30 min to 1 hr; while in practice, such procedure requires more time to complete due to a large number of samples received in overloaded pathological laboratories. (B) Fluorescence-based pre-screening strategy described in this paper. It allows the pre-screening of tumor involvement with high sensitivity by incubating multiple resected ex vivo tissues with chemical fluorescent agent for minutes and then imaged. (i) Negative result is rapidly conveyed to the operation room to close the case with 20 min. (ii) Positive ones are prioritized for further frozen-section double-checks and reviews.
Scheme 1
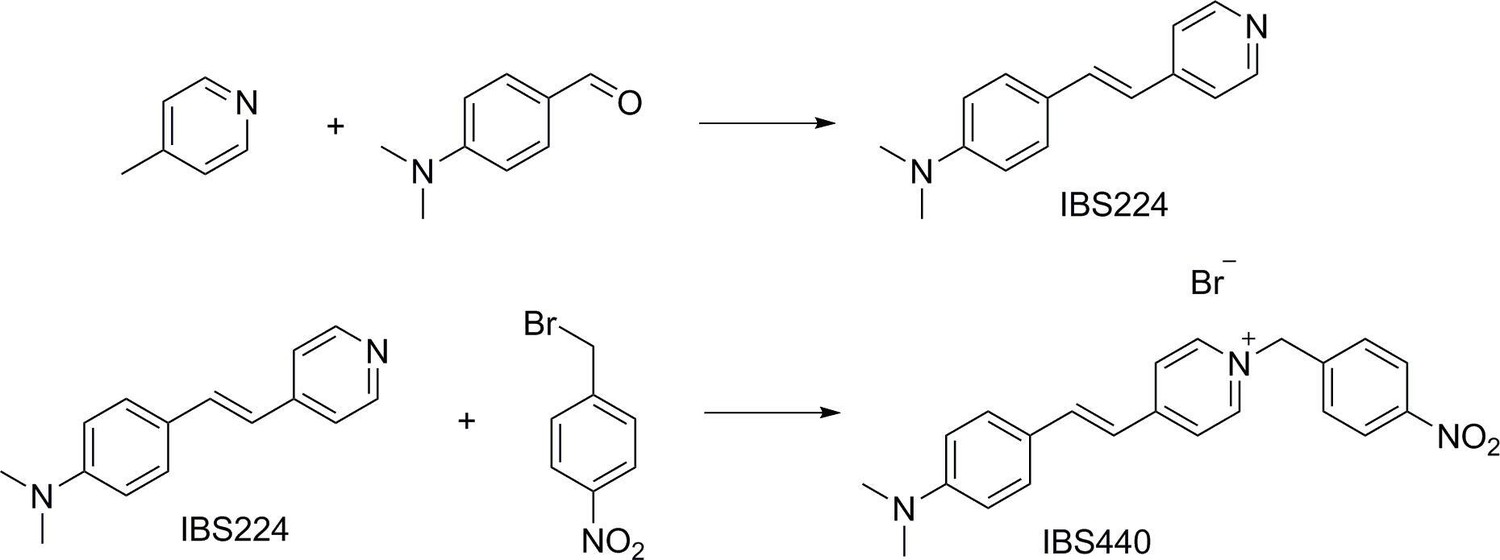
Synthesis of IBS224 and IBS440.
Appendix 1—figure 1
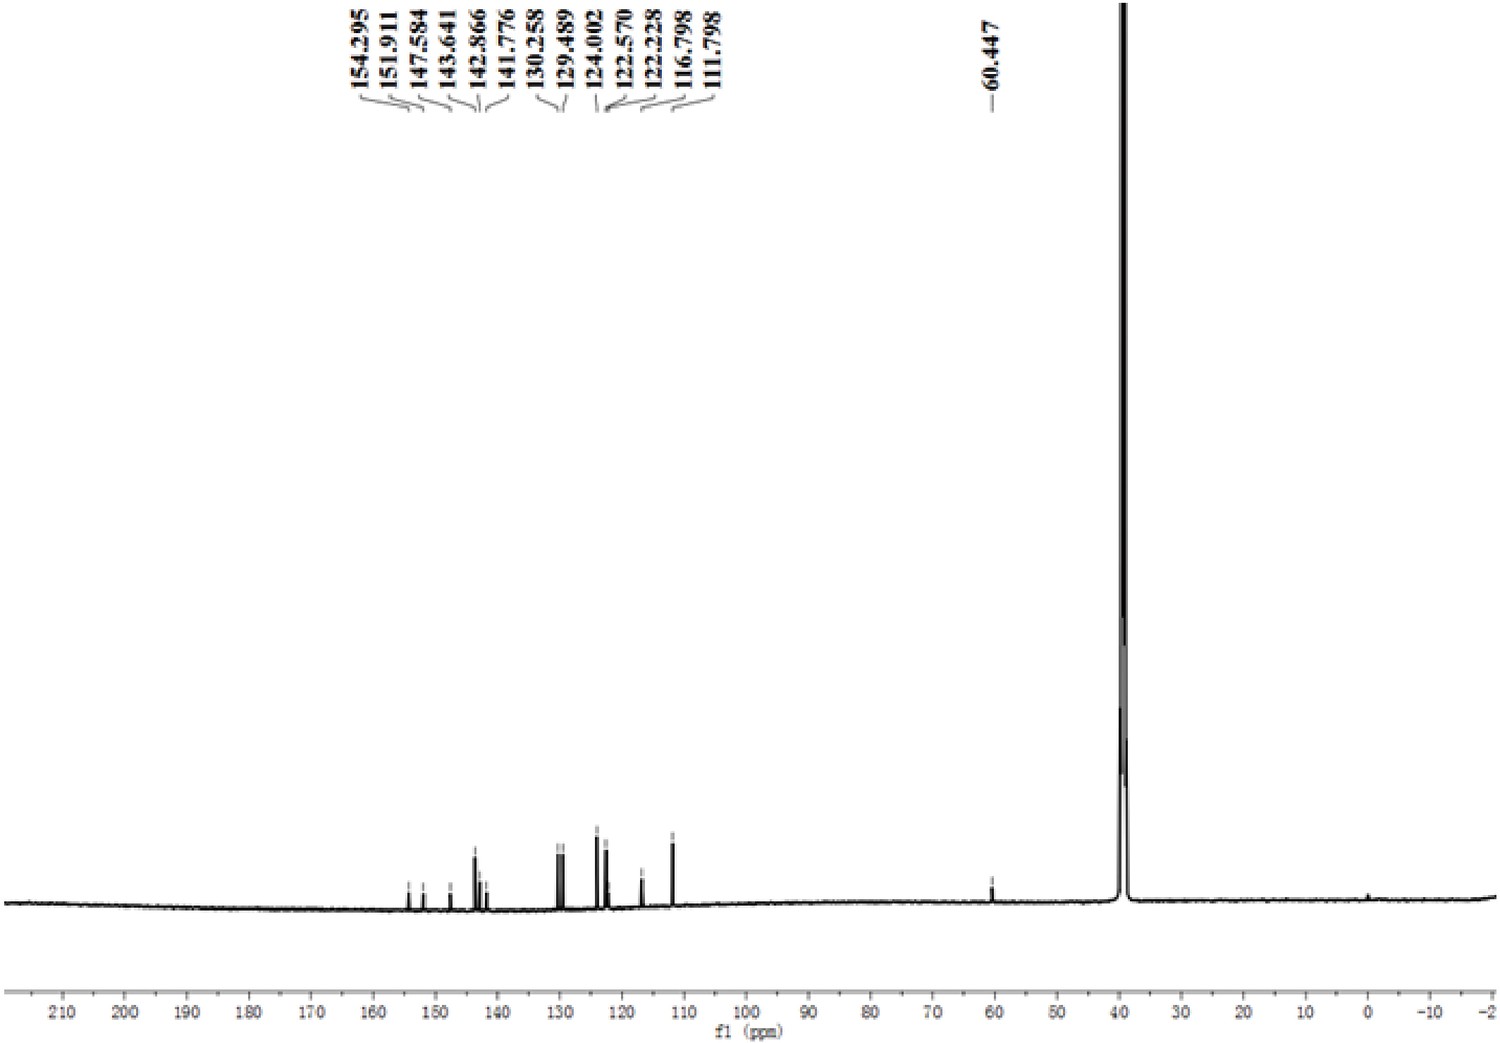
13C-NMR (DMSO-d6) spectrum of IBS440.
Appendix 1—figure 2
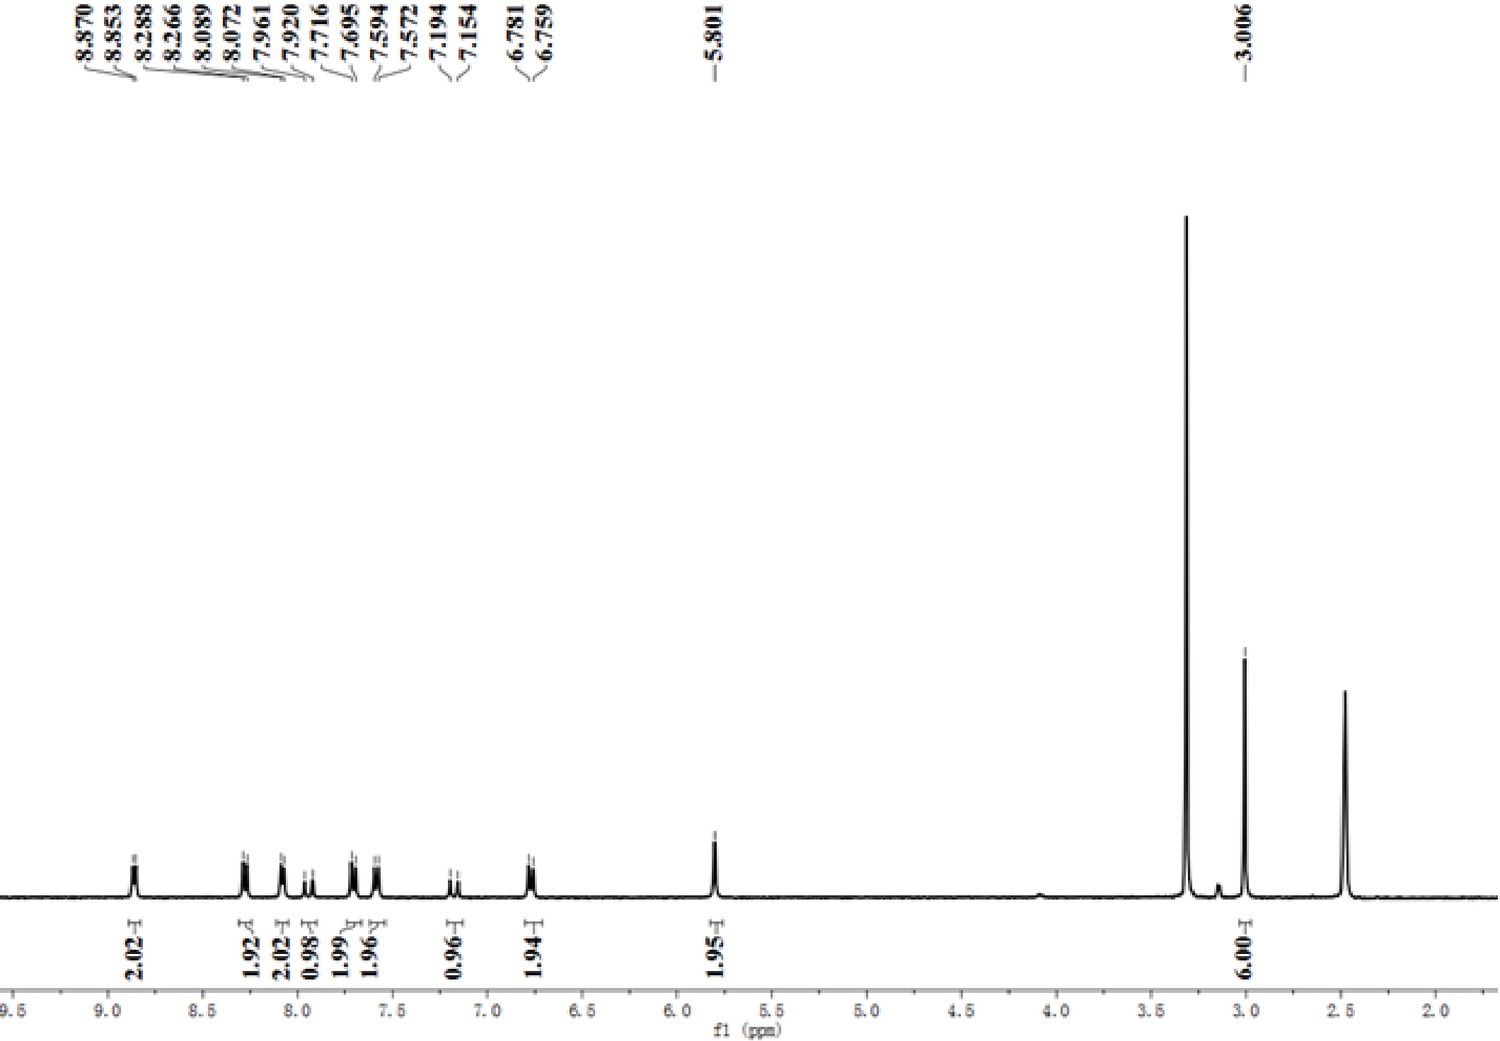
1H-NMR (DMSO-d6) spectrum of IBS440.
Appendix 1—figure 3
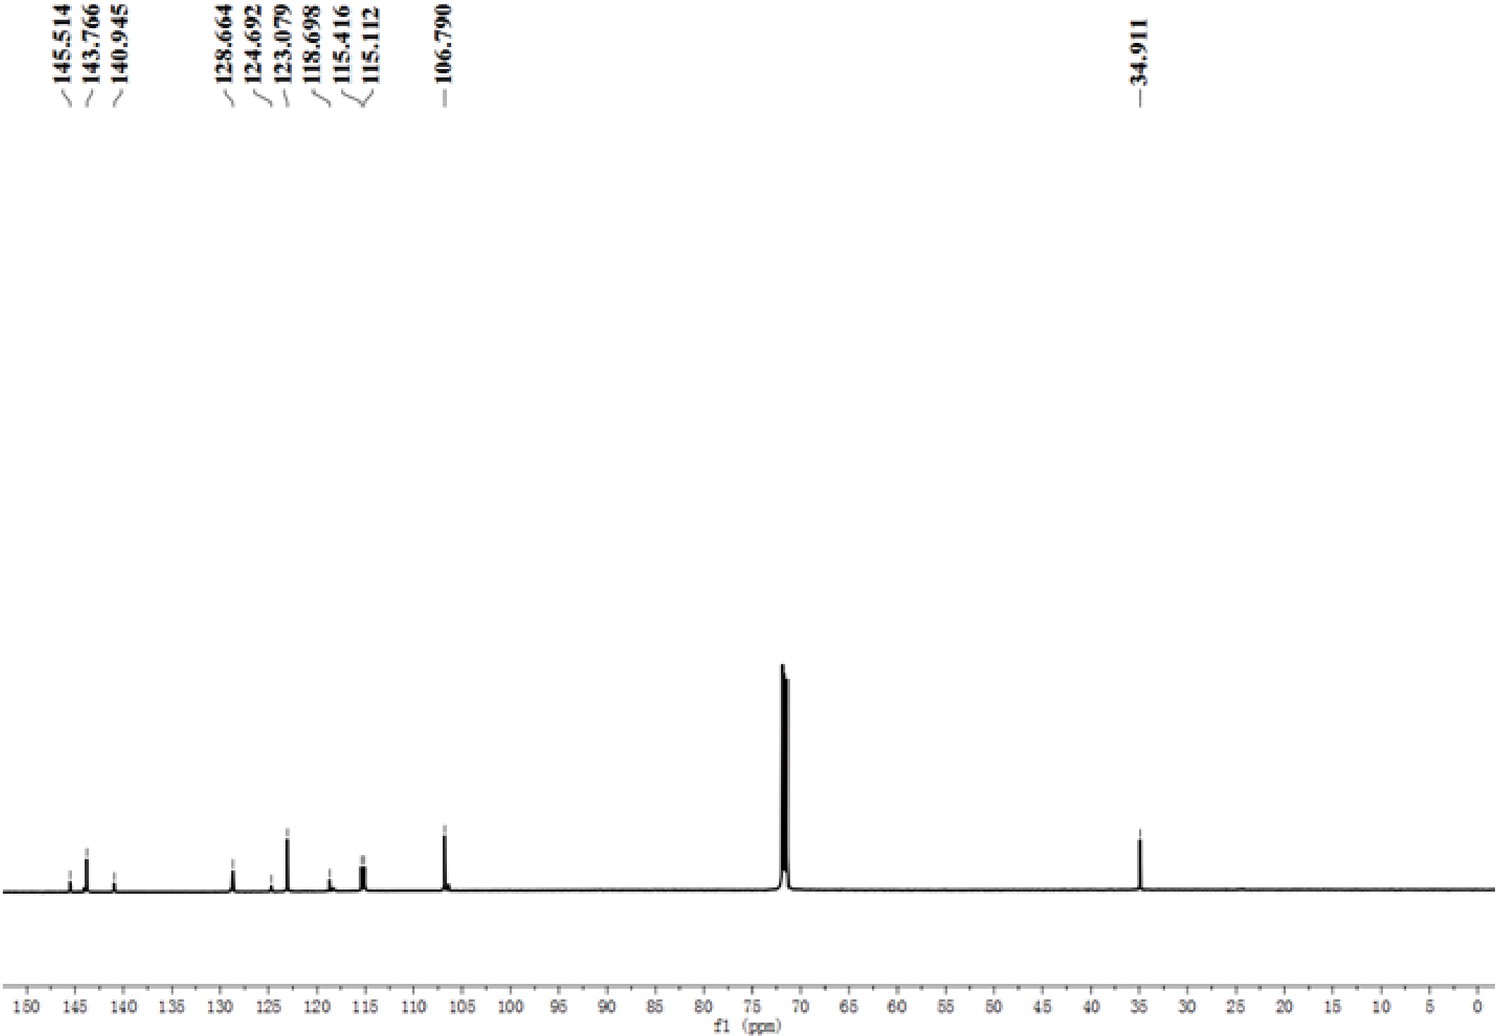
13C-NMR (DMSO-d6) spectrum of IBS224.
Appendix 1—figure 4
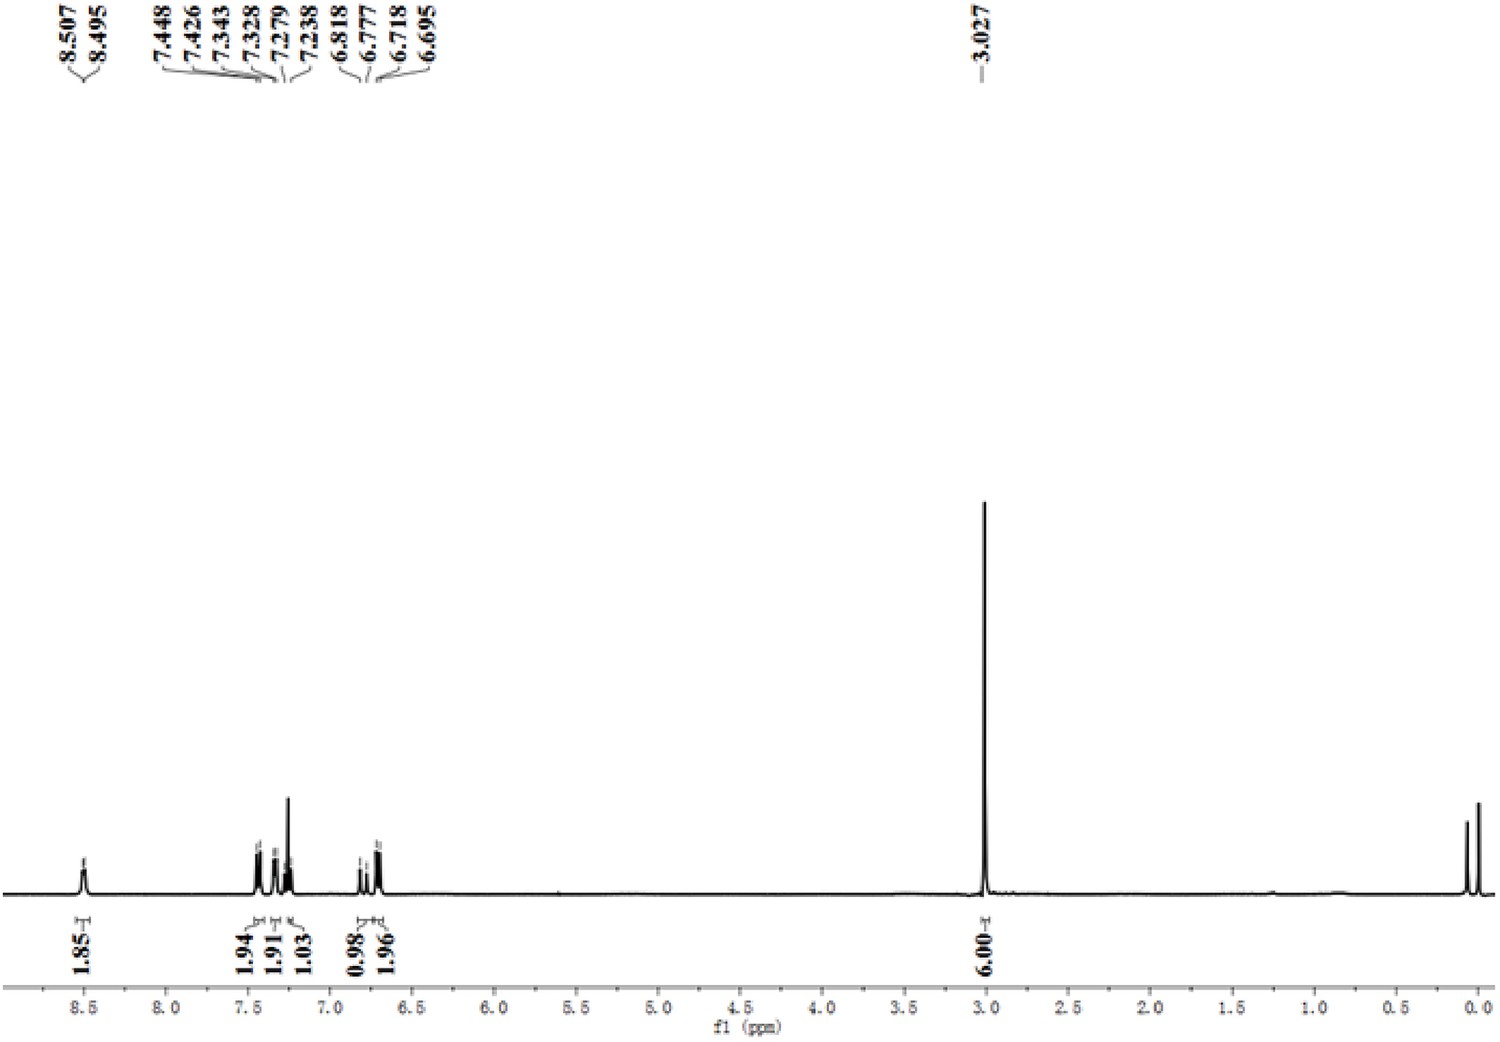
1H-NMR (CDCl3) spectrum of IBS224.
Appendix 1—figure 5
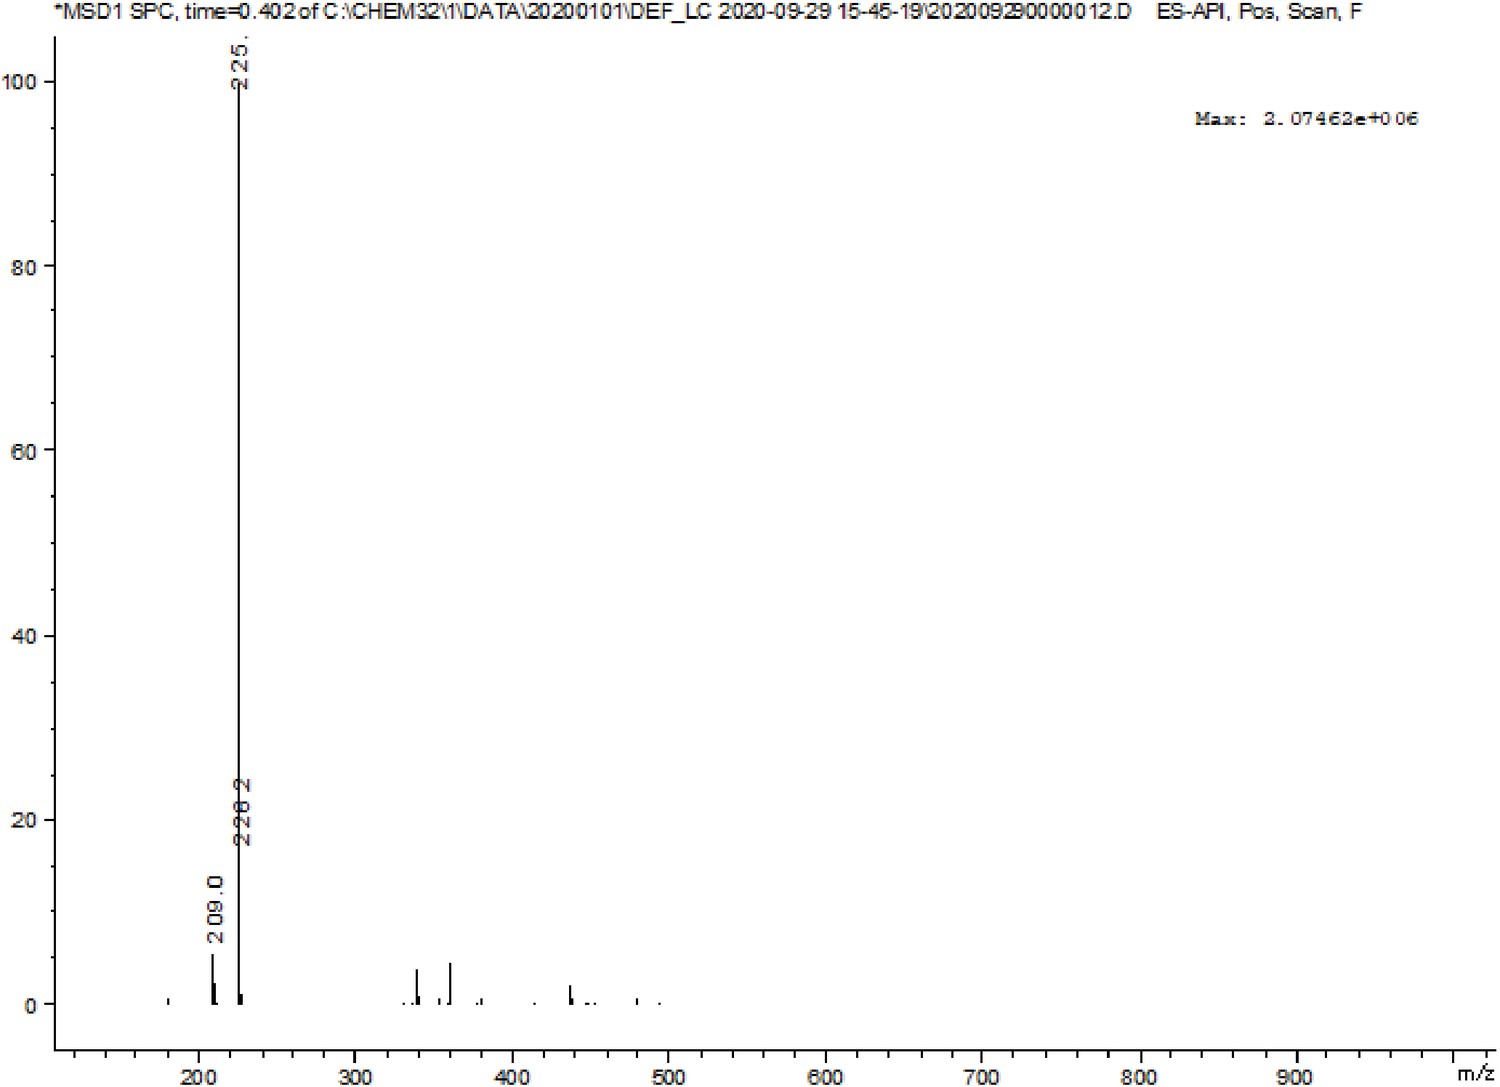
MS spectrum of IBS224.
Appendix 1—figure 6
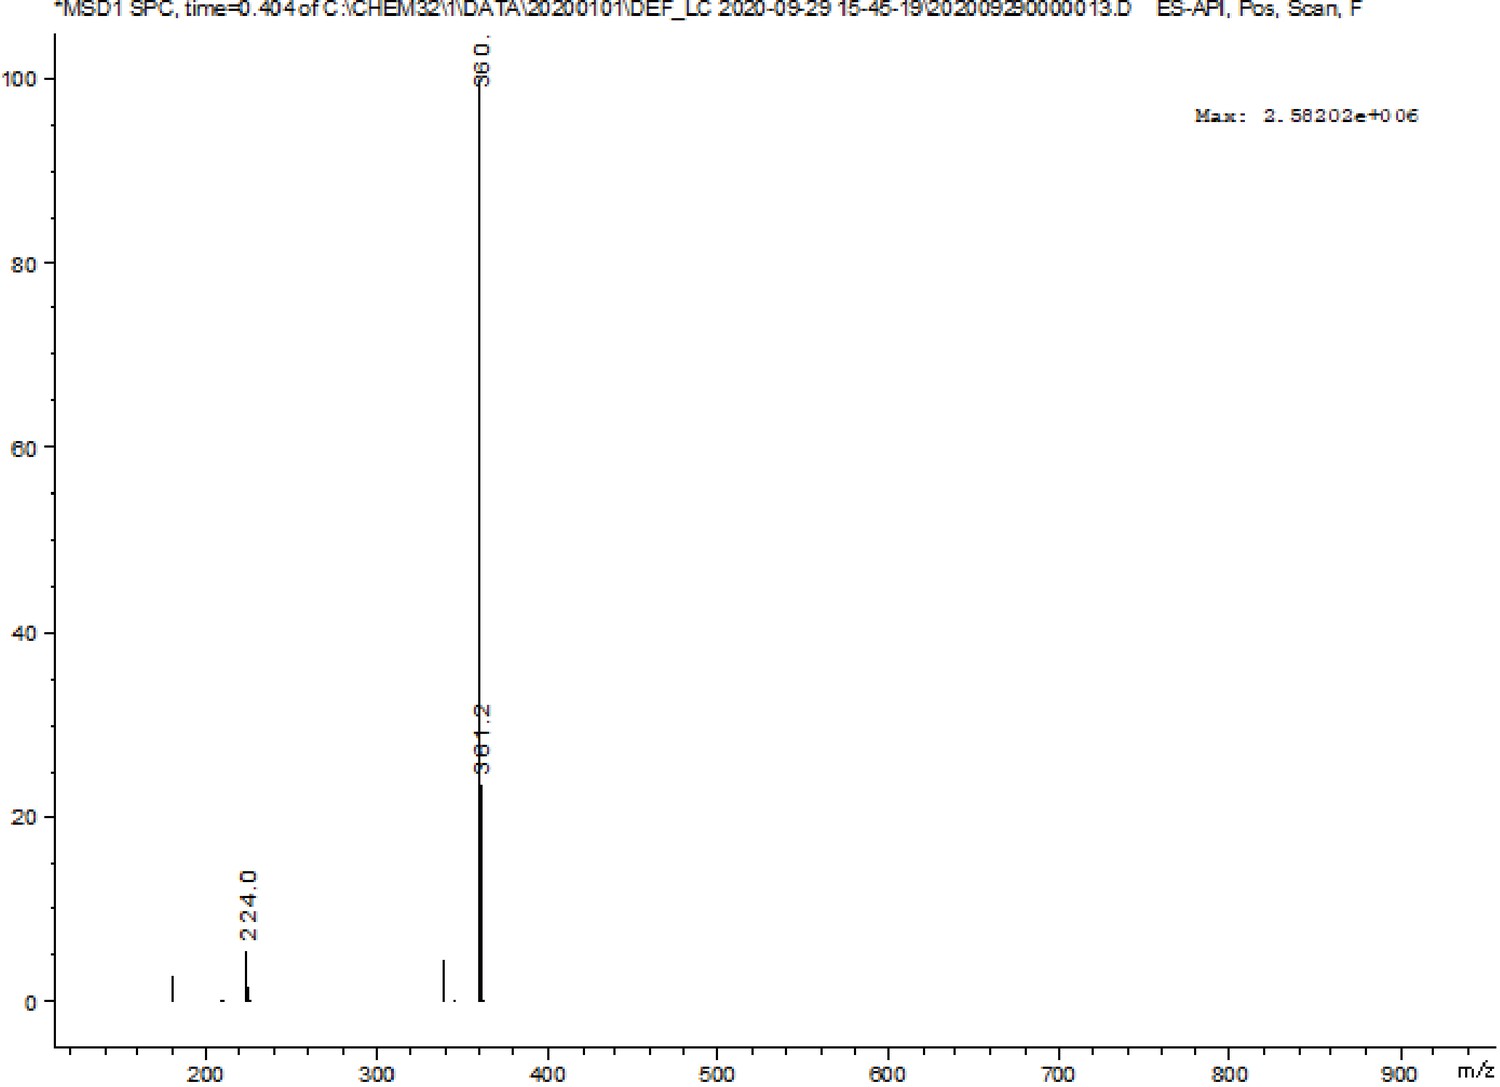
MS spectrum of IBS440.
Tables
Key resources table
| Reagent type (species) or resource | Designation | Source or reference | Identifiers | Additional information |
|---|---|---|---|---|
| Strain, strain background (Escherichia coli) | BL21(DE3) | TransGen Biotech | Cat#CD701 | |
| Antibody | Anti-HIF-1A antibody (Rabbit polyclonal) | Sangon Biotech | Cat#D162108RRID:AB_1674786 | WB (1:500) |
| Antibody | Anti-6 His antibody (Rabbit polyclonal) | Sangon Biotech | Cat#D110002RRID:AB_10575638 | WB (1:2000) |
| Cell line (Homo sapiens) | FaDu cells | Stem Cell Bank, Chinese Academy of Sciences | Cat#TCHu132 | RRID:CVCL_1218 |
| Cell line (Homo sapiens) | A549 cells | Stem Cell Bank, Chinese Academy of Sciences | Cat#SCSP-503 | RRID:CVCL_0023 |
| Cell line (Homo sapiens) | MHCC97H cells | Zhongshan Hospital, Fudan University | ||
| Cell line (Mus musculus) | RAW264.7 cells | Stem Cell Bank, Chinese Academy of Sciences | Cat#TCM13 | RRID:CVCL_0493 |
| Cell line (Rattus norvegicus) | A7r5 cells | Stem Cell Bank, Chinese Academy of Sciences | Cat#GNR 7 | RRID:CVCL_0137 |
| Biological sample (mouse) | BALB/c nude mouse (4–6 weeks old, female) | School of Pharmacy,Fudan University | http://www.lacsp.fudan.edu.cn/ | |
| Biological sample (human) | Lung carcinoma specimens | Zhongshan Hospital, Fudan University | ||
| Biological sample (human) | Renal carcinoma specimens | Zhongshan Hospital, Fudan University | ||
| Biological sample (human) | Hepatocellular carcinoma specimens | Zhongshan Hospital, Fudan University | ||
| Biological sample (human) | Oral carcinoma specimens | Shanghai Ninth People’s Hospital | ||
| Chemical compound, drug | 4-picoline | Energy-Chemical | Cat#W3300080250 | CAS: 108-89-4 |
| Chemical compound, drug | potassium tert-butoxide | Energy-Chemical | Cat#E0600050250 | CAS: 865-47-4 |
| Chemical compound, drug | 1-(bromomethyl)–4-nitrobenzene | Energy-Chemical | Cat#W610062 | CAS: 100-11-8 |
| Chemical compound, drug | NaCl | Energy-Chemical | Cat#E010368 | CAS: 7647-14-5 |
| Chemical compound, drug | Nicotinamide Adenine Dinucleotide Phosphate (NADPH) | Energy-Chemical | Cat#10107824001 | CAS: 2646-71-1 |
| Chemical compound, drug | glycerol | Energy-Chemical | Cat#A0404071000 | CAS: 56-81-5 |
| Peptide, recombinant protein | T4 DNA ligase | New England Biolabs | Cat#M0202 | a final concentration of 20 units/μL |
| Peptide, recombinant protein | XhoI | New England Biolabs | Cat#R0146 | a final concentration of 0.4 units/μL |
| Peptide, recombinant protein | BamHI-HF | New England Biolabs | Cat#R3136 | a final concentration of 0.4 units/μL |
| Peptide, recombinant protein | Taq DNA polymerase | New England Biolabs | Cat#M0273 | a final concentration of 0.025 units/μL |
| Commercial assay or kit | BCA protein assay kit | Beyotime | Cat#P0012 | |
| Commercial assay or kit | Cell Counting Kit-8 | Beyotime | Cat#C0038 | |
| Commercial assay or kit | gel extraction kit | Tiangen Biotech | Cat#DP209 | |
| Software, algorithm | Chemdraw 20 | PerkinElmer Informatics | https://www.chemdraw.com.cn | RRID:SCR_016768 |
| Software, algorithm | Origin 8.0 | Origin Lab | https://www.originlab.com/ | |
| Software, algorithm | Ilustrator 2021 | Adobe | https://www.adobe.com | |
| Software, algorithm | Image J | Image J | https://imagej.nih.gov/ij/ | RRID:SCR_003070 |
| Other | Hoechst 33,342 | Beyotime | Cat#C1029 | dilution (1:100) |
| Other | Mito-Tracker Green | Beyotime | Cat#C1048 | a final concentration of 1 μM |
Additional files
-
Transparent reporting form
- https://cdn.elifesciences.org/articles/70471/elife-70471-transrepform1-v2.docx
-
Supplementary file 1
Clinical Characteristics of the patients.
- https://cdn.elifesciences.org/articles/70471/elife-70471-supp1-v2.docx
-
Source data 1
Chemical structure characterization.
- https://cdn.elifesciences.org/articles/70471/elife-70471-supp2-v2.zip
Download links
A two-part list of links to download the article, or parts of the article, in various formats.
Downloads (link to download the article as PDF)
Open citations (links to open the citations from this article in various online reference manager services)
Cite this article (links to download the citations from this article in formats compatible with various reference manager tools)
A pre-screening strategy to assess resected tumor margins by imaging cytoplasmic viscosity and hypoxia
eLife 10:e70471.
https://doi.org/10.7554/eLife.70471


