Remote immune processes revealed by immune-derived circulating cell-free DNA
- Department of Developmental Biology and Cancer Research, The Institute for Medical Research, Israel-Canada, The Hebrew University-Hadassah Medical School, Israel
- School of Computer Science and Engineering, The Hebrew University of Jerusalem, Israel
- Department of Epidemiology and Preventive Medicine, School of Public Health, Sackler Faculty of Medicine, Tel-Aviv University, Tel-Aviv, Israel, and Central Virology Laboratory, Ministry of Health, Chaim Sheba Medical Center, Israel
- Division of Allergy and Immunology, Department of Pediatrics, Cincinnati Children’s Hospital Medical Center, University of Cincinnati, United States
- GRAIL, United States
- Department of Hematology, Hadassah Hebrew University Medical Center, Israel
- Department of Developmental Biology and Cancer Research, The Institute for Medical Research, The Hebrew University-Hadassah Medical School, Israel
- Endocrinology and Metabolism Service, Hadassah Hebrew University Medical Center, Israel
Figures
Figure 1 with 1 supplement
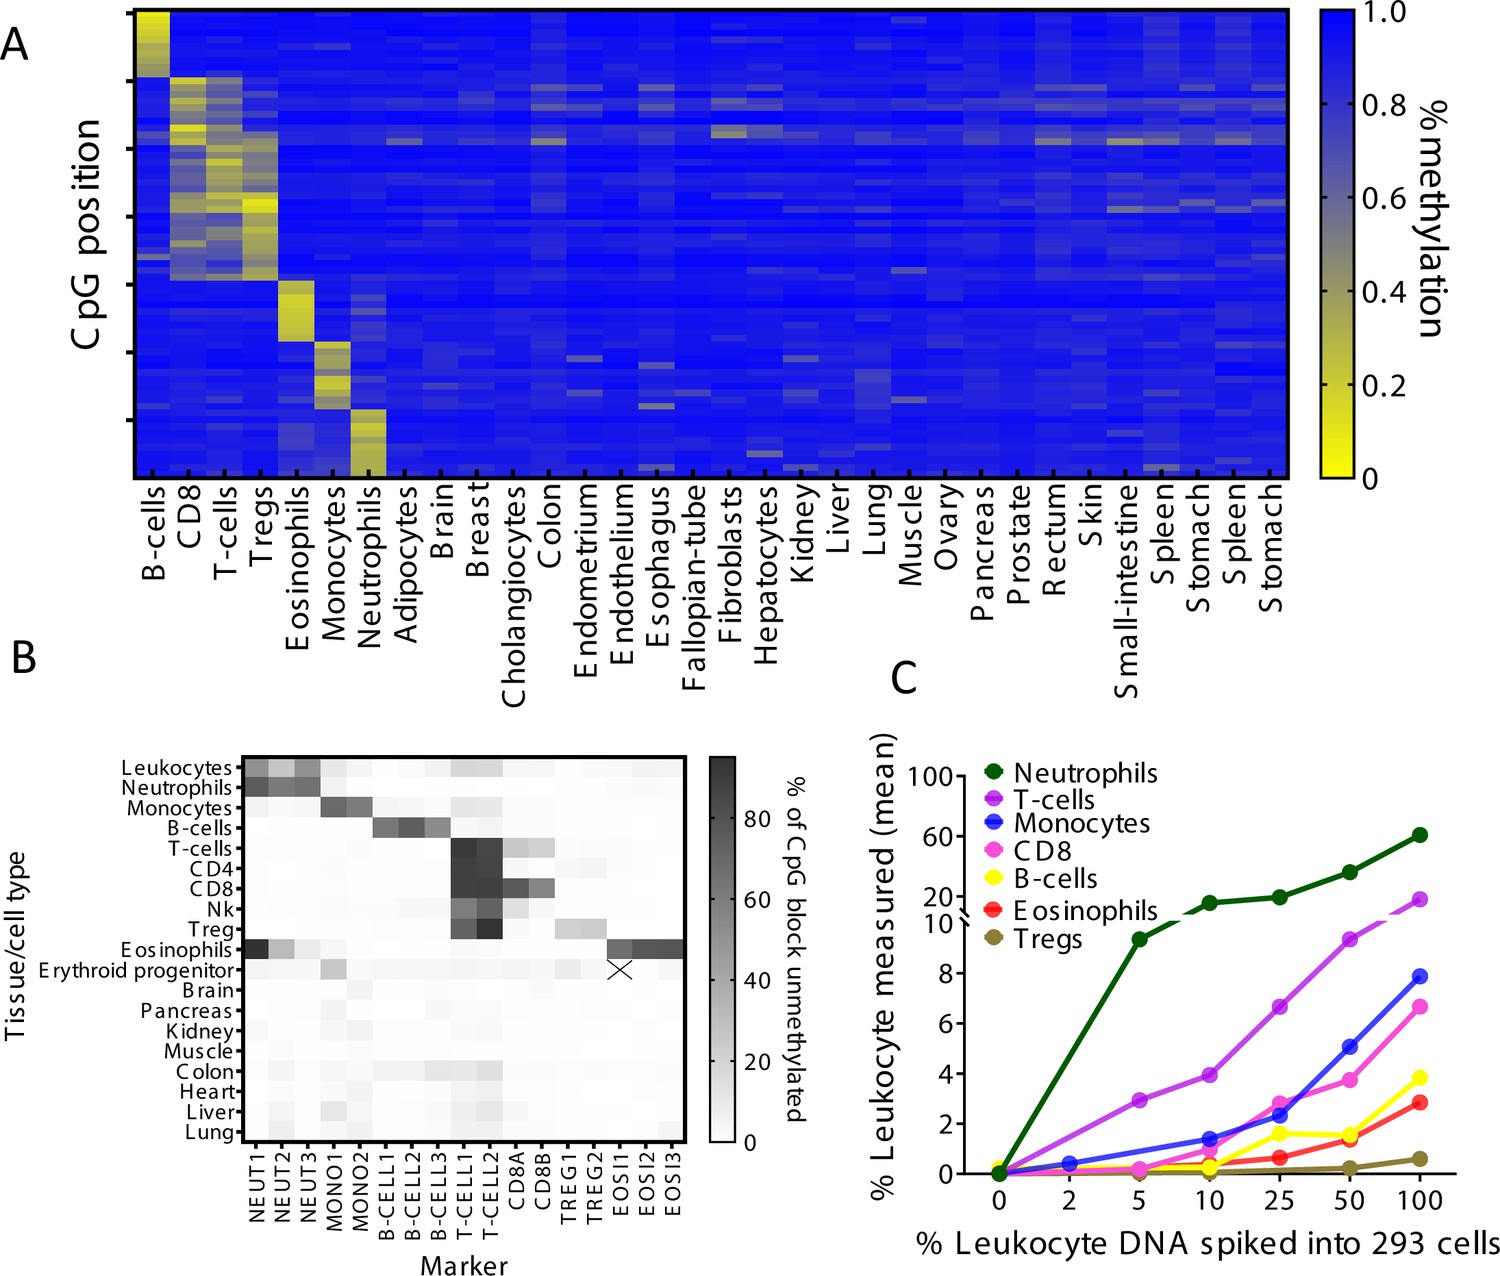
Identification of specific immune cell DNA methylation markers.
(A) Methylation atlas, based on Illumina 450K arrays, composed of 32 tissues and sorted cells (columns). For each immune cell type we chose the top 10 CpGs that are hypomethylated (yellow) in the specific immune cell type and hypermethylated (blue) in other tissues and cells. This yielded 70 cell-specific CpG sites (rows) for seven different immune cell subtypes – B-cells, CD8 cytotoxic T-cells, CD3 T-cells, regulatory T-cells, eosinophils, monocytes, and neutrophils. (B) Methylation patterns of 17 loci, selected from the 70 shown in panel A, based on the presence of multiple adjacent hypomethylated CpGs within an amplicon of up to 160 bp. Each methylation marker (columns) was assessed using genomic DNA from 19 different tissues and cell types (rows). All 17 markers were amplified in one multiplex PCR. Shades of gray represent the percentage of fully unmethylated molecules from the indicated marker in DNA from the indicated cell type. (C) Spike-in experiments assessing assay sensitivity. Human leukocyte DNA was mixed with DNA from HEK-293 cells (human embryonic kidney cells) in the indicated proportions. Colored lines show the inferred percentage of DNA from the indicated immune cell type in the mixture, as a function of the percentage of leukocyte DNA in the mixture. The percentage of DNA from each immune cell type was calculated using markers specific to neutrophils (NEUT1, NEUT2, NEUT3), monocytes (MONO1, MONO2), eosinophils (EOSI2, EOSI3), B-cells (B-CELL1, B-CELL2, B-CELL3), CD3 T-cells (T-CELL1, T-CELL2), CD8 cytotoxic T-cells (CD8A, CD8B), and regulatory T-cells (TREG1, TREG2).
Figure 1—figure supplement 1
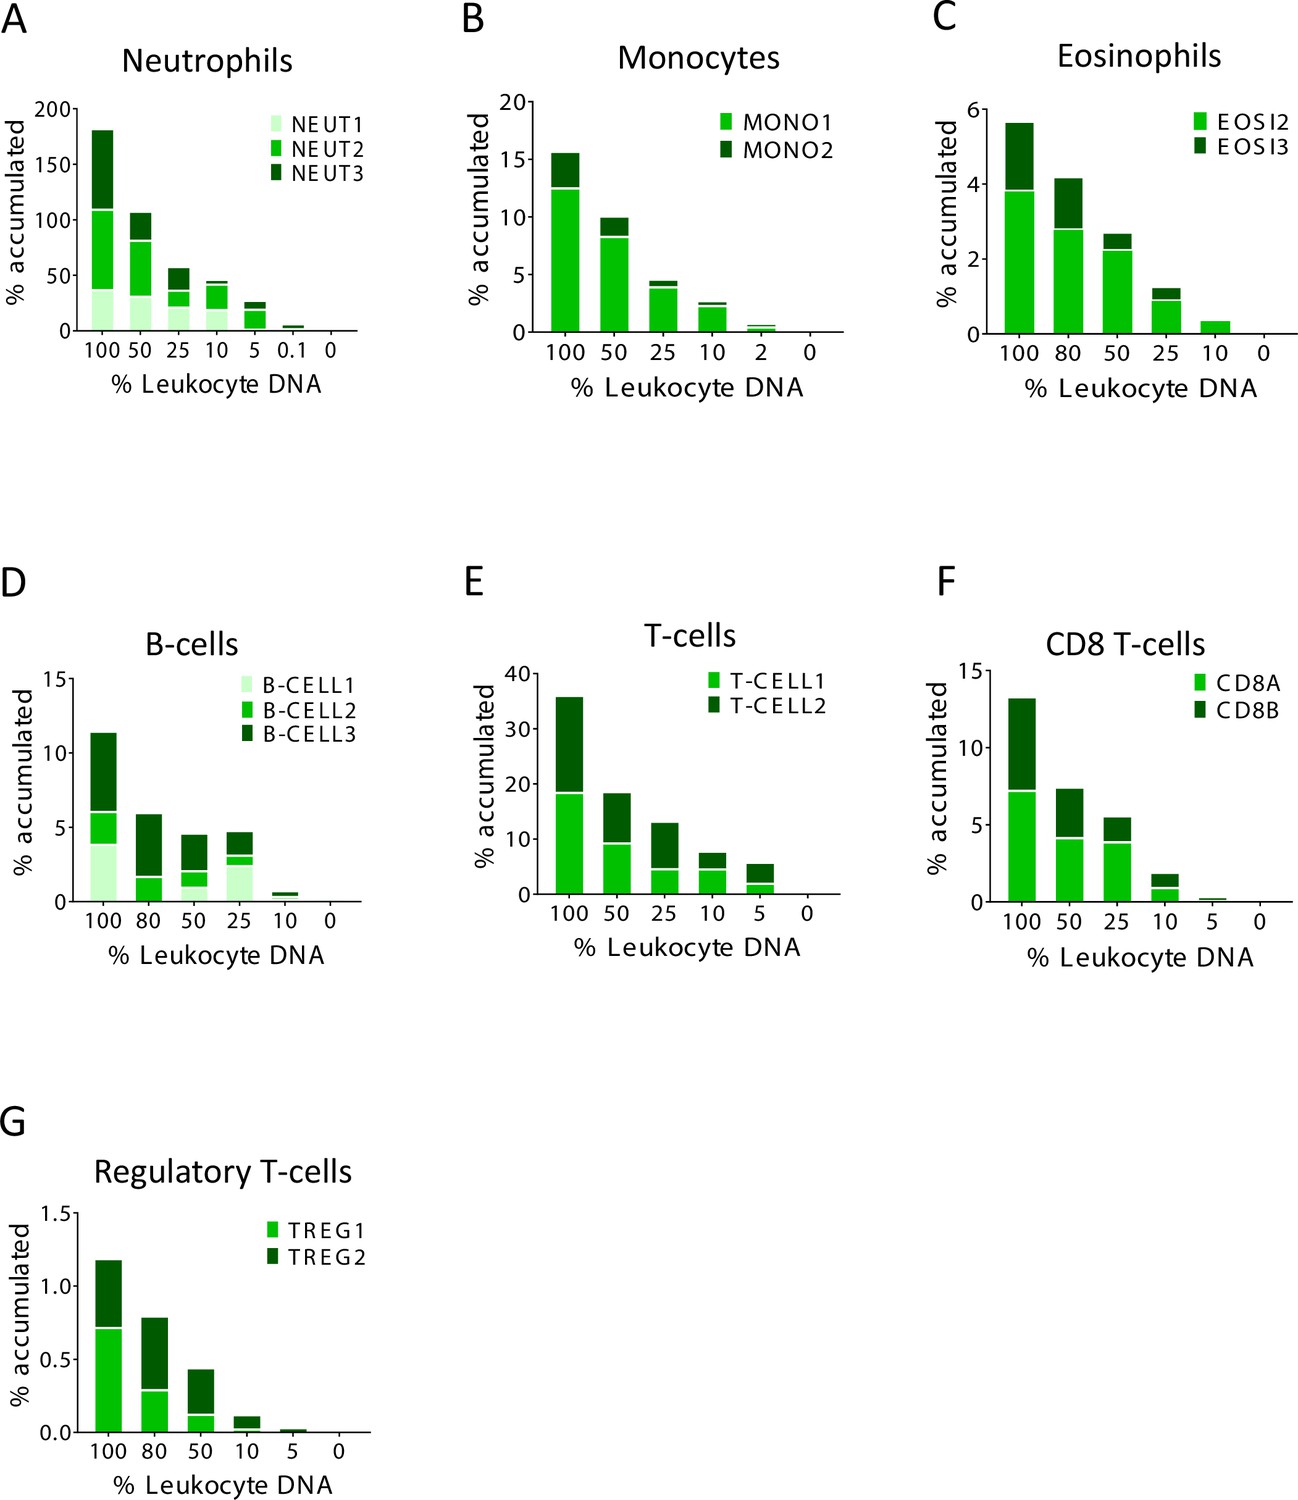
Identification of specific immune cell DNA methylation markers.
(A–G) Spike-in experiments for the assessment of assay sensitivity. Human leukocyte DNA was mixed with DNA from HEK-293 cells in the indicated proportion. The fraction of DNA from each immune type cell was assessed using the indicated methylation markers. The Y axis shows cumulative values for percentage contribution from each marker, to underscore the signal from each individual marker.
Figure 2 with 2 supplements
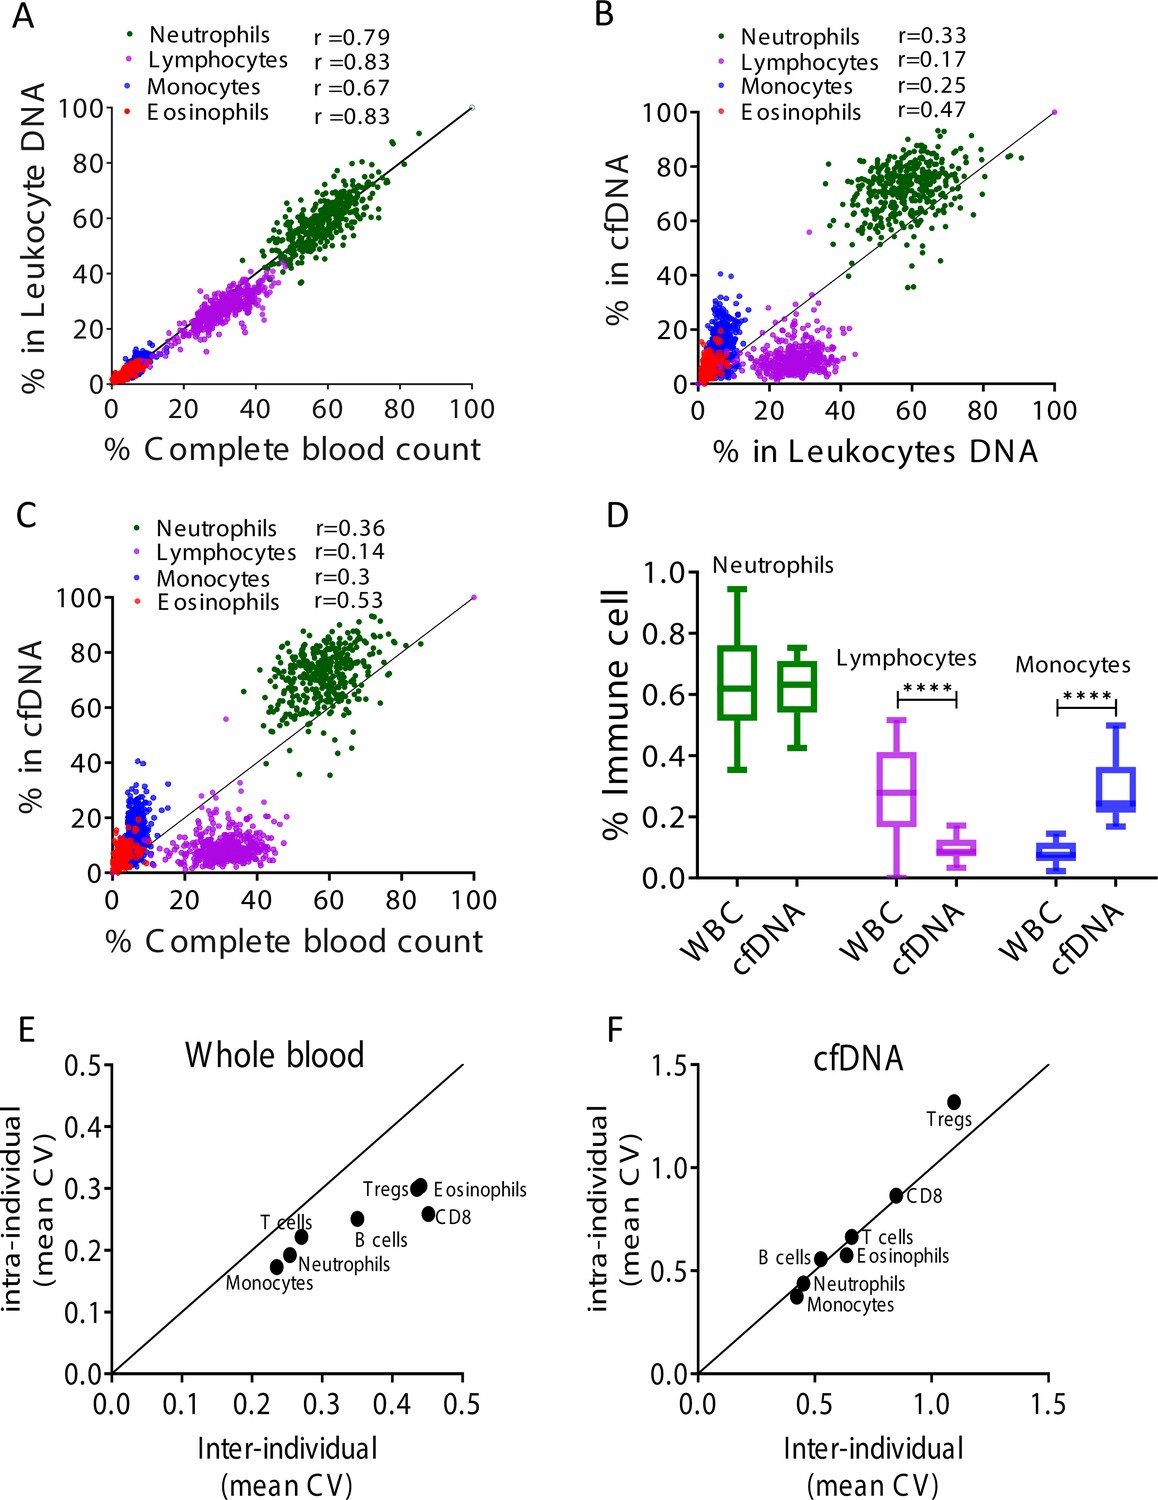
Immune cell-free DNA (cfDNA) methylation markers distribute differently than circulating immune cells and reflect immune cell turnover.
(A) Levels of immune methylation markers in genomic DNA extracted from whole blood, versus complete blood counts (CBC) from same donors. A total of 392 plasma and blood samples were obtained from 79 healthy donors (47 females, 32 males; age range 20–73). Shown are Pearson’s correlations; p-value < 0.0001. (B) cfDNA methylation versus whole blood methylation of the same donors. (C) cfDNA methylation versus CBC of the same donors. Note that cfDNA proportions of immune cells differ from the proportions of these cell types in peripheral blood. (D) Deconvolution of cfDNA and white blood cell (WBC) methylomes generated using whole genome bisulfite sequencing (WGBS) of 23 healthy donors. Note under-representation of lymphocyte DNA and over-representation of monocyte DNA in cfDNA compared with blood DNA (lymphocytes, p-value = 0.0021; monocytes, p-value = 0.0005, Kruskal-Wallis). (E–F) XY scatter plots showing the average of inter-individual coefficient of variation (X-axis) and intra-individual coefficient of variation (Y-axis) for each immune cell type in whole blood (E) and in cfDNA (F) based on methylation markers. Black line represents perfect correlation between inter- and intra-individual dual variation. Dots below the black line reflect greater inter-individual variation and dots that are above reflect greater intra-individual variance. A smaller intra-individual variation in whole blood suggests a set point for proportions of blood cell types in each individual. By contrast, cfDNA levels of immune markers vary similarly within and between individuals.
Figure 2—figure supplement 1
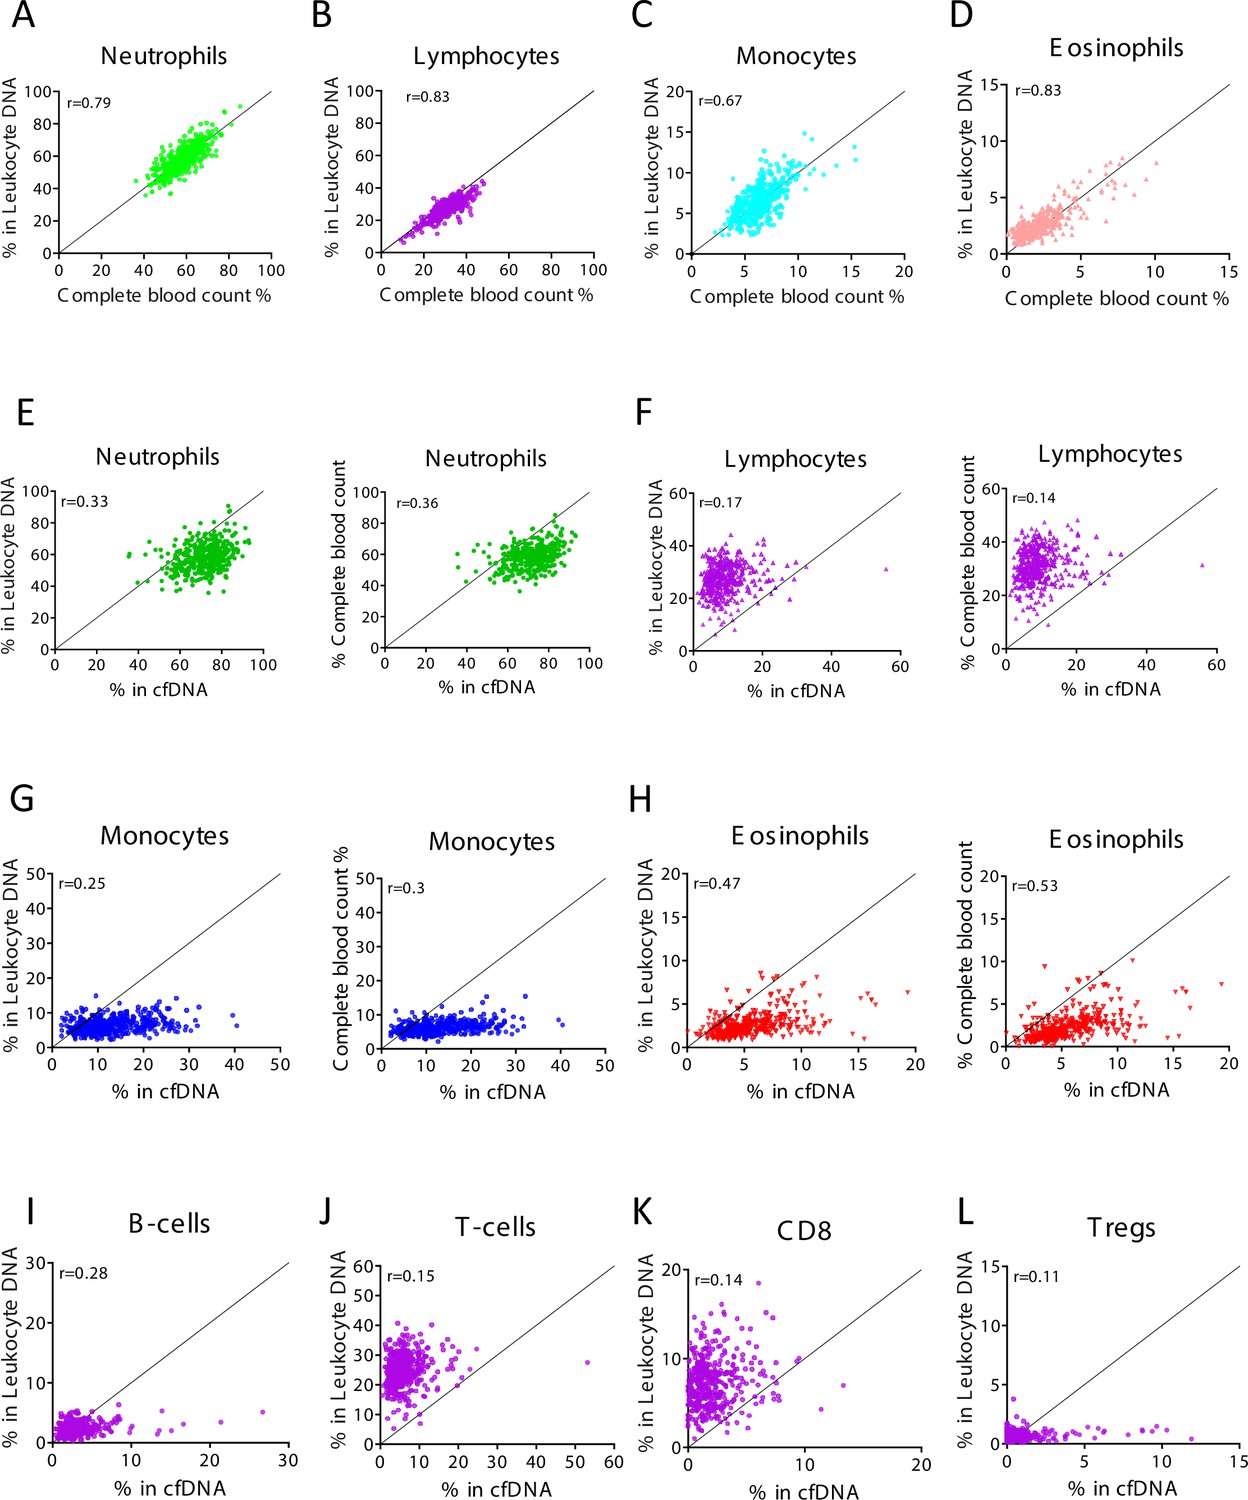
Levels of immune cell-derived cell-free DNA (cfDNA) are not correlated with the counts of these cells in circulation, and reflect cell type-specific turnover rates.
Plasma and blood samples (n = 392) were obtained from 79 healthy individuals that vary in age and gender. Methylation-based immune markers were determined on genomic DNA from whole blood, and on plasma cfDNA. Standard complete blood counts (CBC) values were also obtained. (A–D) Correlation between CBC and methylation markers in cfDNA. (E–H) Correlation between cfDNA methylation signals and whole blood methylation signals (left graph in each panel) or CBC (right graph in each panel). (I–L) Correlation between cfDNA methylation signals whole blood methylation signals for cell types that are not scored in CBC.
Figure 2—figure supplement 2
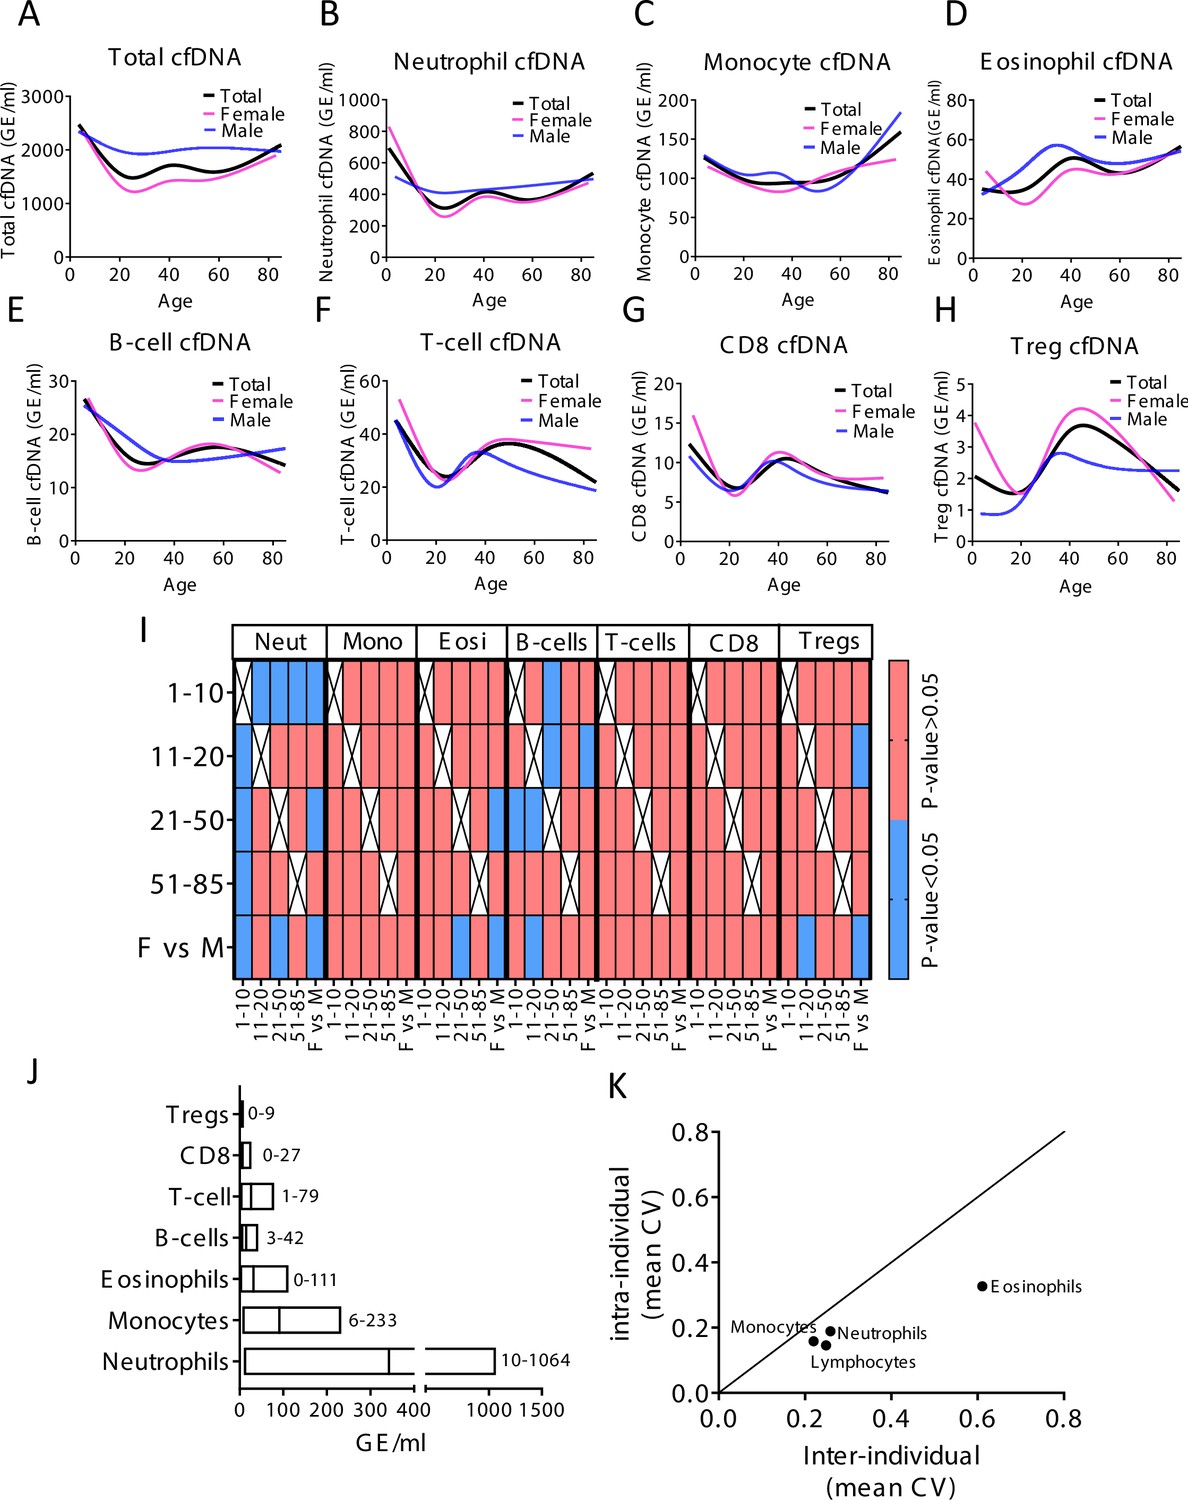
Immune-derived cell-free DNA (cfDNA) characterization in a healthy population.
(A–H) Total and immune-derived cfDNA was characterized in healthy individuals (n = 227) as a spline curve fit showing the trend of the data across different age groups (black line), with a breakdown to gender (female pink lines, male blue lines) for the indicated immune cell types. (I) A categorical heat map showing significant (blue, p-value < 0.05) and non-significant (red, p-value > 0.05, Kruskal-wallis) differences in cfDNA values for each immune cell type across different age groups and between genders. Age groups were 1–10 years (n = 21), 11–20 (n = 30), 21–50 (n = 134), and >50 (n = 37). (J) The normal cfDNA range for each cell type: neutrophils (mean = 390, range 10–1064 GE/ml), monocytes (mean = 101, range 6–233 GE/ml), eosinophils (mean = 38, range 0–111 GE/ml) T-cells (mean = 30, range1-79) B-cells (mean = 17, range 3–42 GE/ml) CD8 T-cells (mean = 8, range 0–27 GE/ml), and regulatory T-cells (Tregs) (mean = 2, range 0–9 GE/ml) based on samples from 227 individuals excluding outliers using the ROUT outlier test (Q = 5%). (K) XY scatter plot showing the average of inter-individual coefficient of variation (X-axis) and intra-individual coefficient of variation (Y-axis) for the fraction of cells from each immune cell types based on CBC. Black line represents perfect correlation between inter- and intra-individual variation. Dots below the black line represent greater inter-individual variation and dots above represent greater intra-individual variance.
Figure 3 with 2 supplements
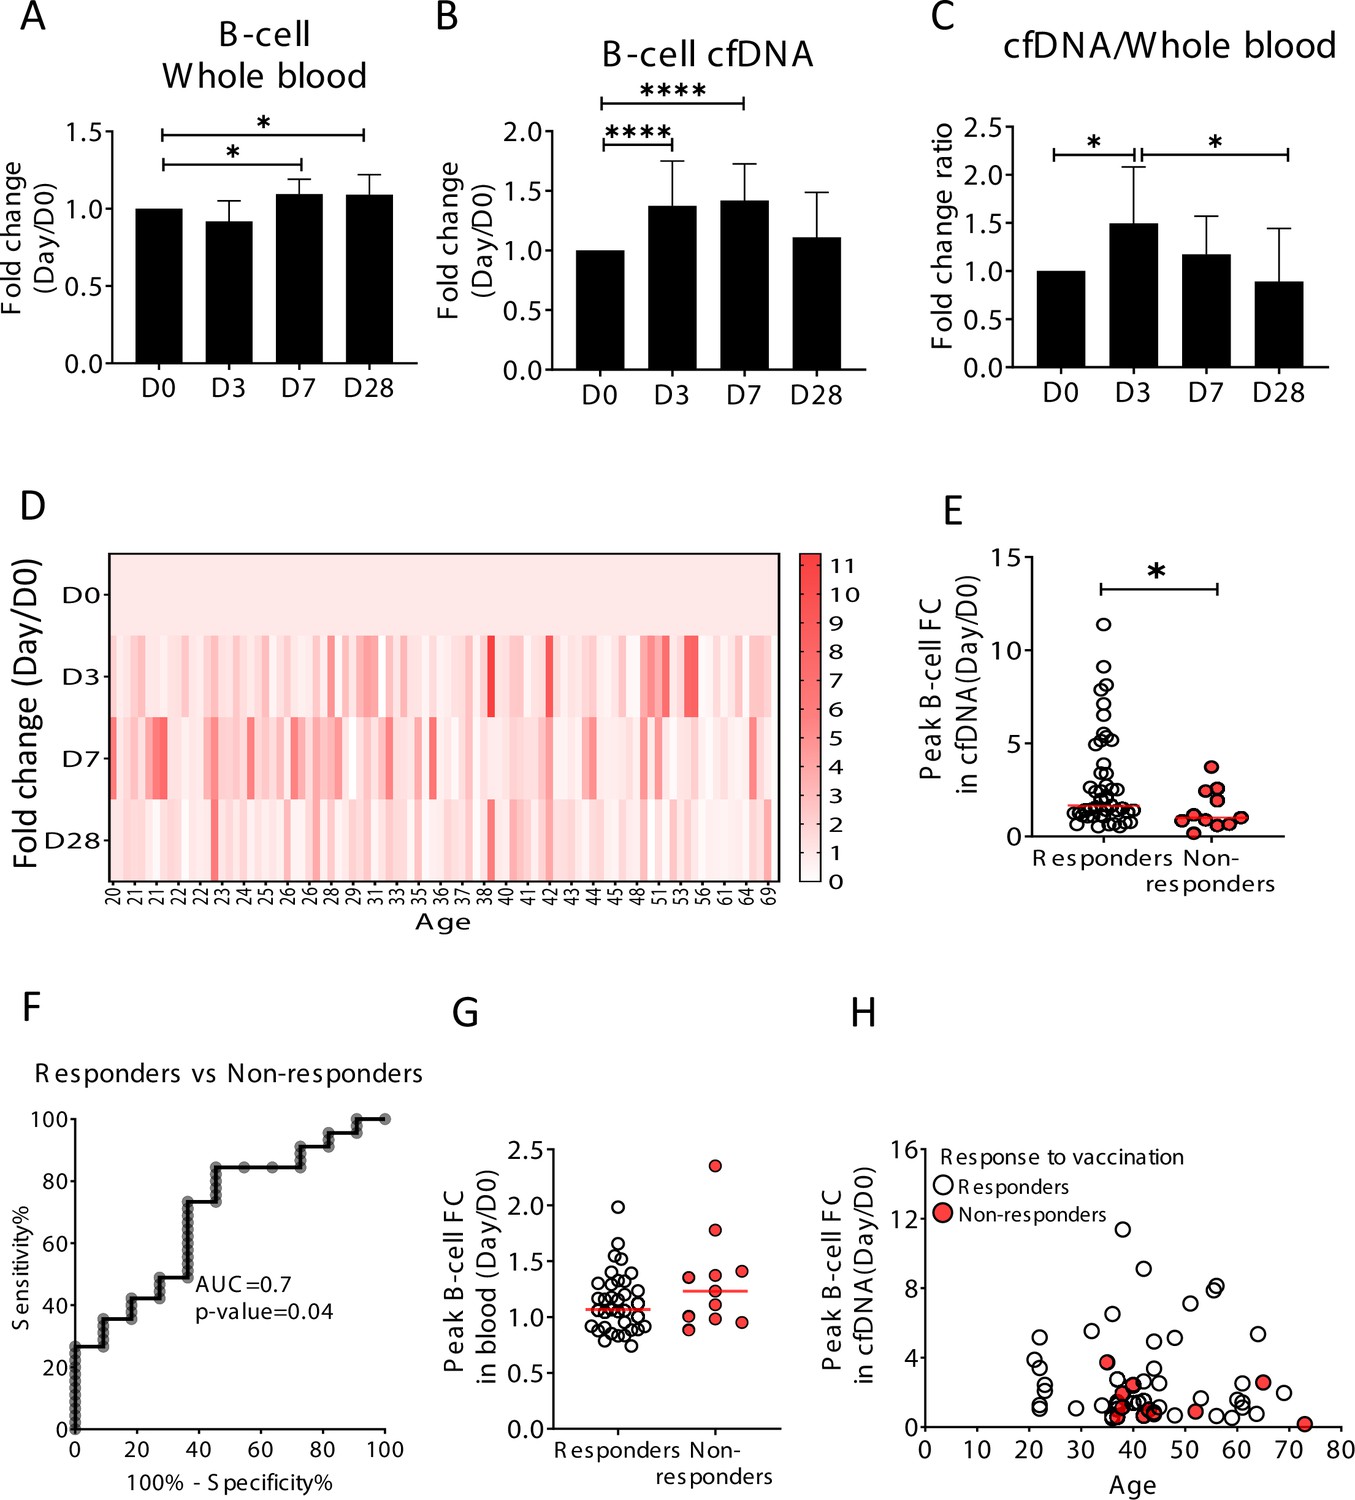
Elevation of B-cell-derived cell-free DNA (cfDNA) after influenza vaccination precedes changes in cell counts and reflects efficacy of response to vaccination.
Plasma, serum, and blood samples were obtained from 92 healthy donors receiving the influenza vaccination (55 females, 37 males, age range 20–73 years). (A) Circulating B-cells, assessed using methylation markers, are elevated on days 7 (p-value = 0.03) and 28 (p-value = 0.021) compared to baseline (Kruskal-Wallis) (N = 64). (B) B-cell-derived cfDNA markers were normalized to the levels of each individual at baseline (D0) and represented as fold change. B-cell-derived cfDNA is elevated compared to baseline on days 3 and 7 after influenza vaccination (p-value < 0.0001, Kruskal-Wallis) (N = 92). (C) The ratio of B-cell-derived cfDNA and B-cells in blood was calculated for each individual. On day 3 the ratio was significantly higher than at baseline (p-value = 0.016). Bars indicate the median and error bars indicate the confidence interval. (D) A heat map showing the change of B-cell-derived cfDNA in each individual following vaccination relative to baseline. Donors are ordered by their age. (E) Serum antibody titers were used to divide donors into responders (n = 45) who have developed antibodies following vaccination, and non-responders (n = 11) who have not. Graph shows the maximal elevation (fold change [FC] from baseline) in B-cell-derived cfDNA that was recorded for each donor. (p-value = 0.045, Mann-Whitney). (F) Receiver operating characteristic (ROC) curve for distinguishing responders and non-responders to vaccination. (G) Maximal elevation in B-cell counts in blood based on methylation markers does not differ between responders and non-responders. p-Value = 0.2, Mann-Whitney test. (H) XY scatter plot for peak B-cell cfDNA elevation as a function of age. Non-responders (colored with red) tend to be older and show reduced elevation.
Figure 3—figure supplement 1
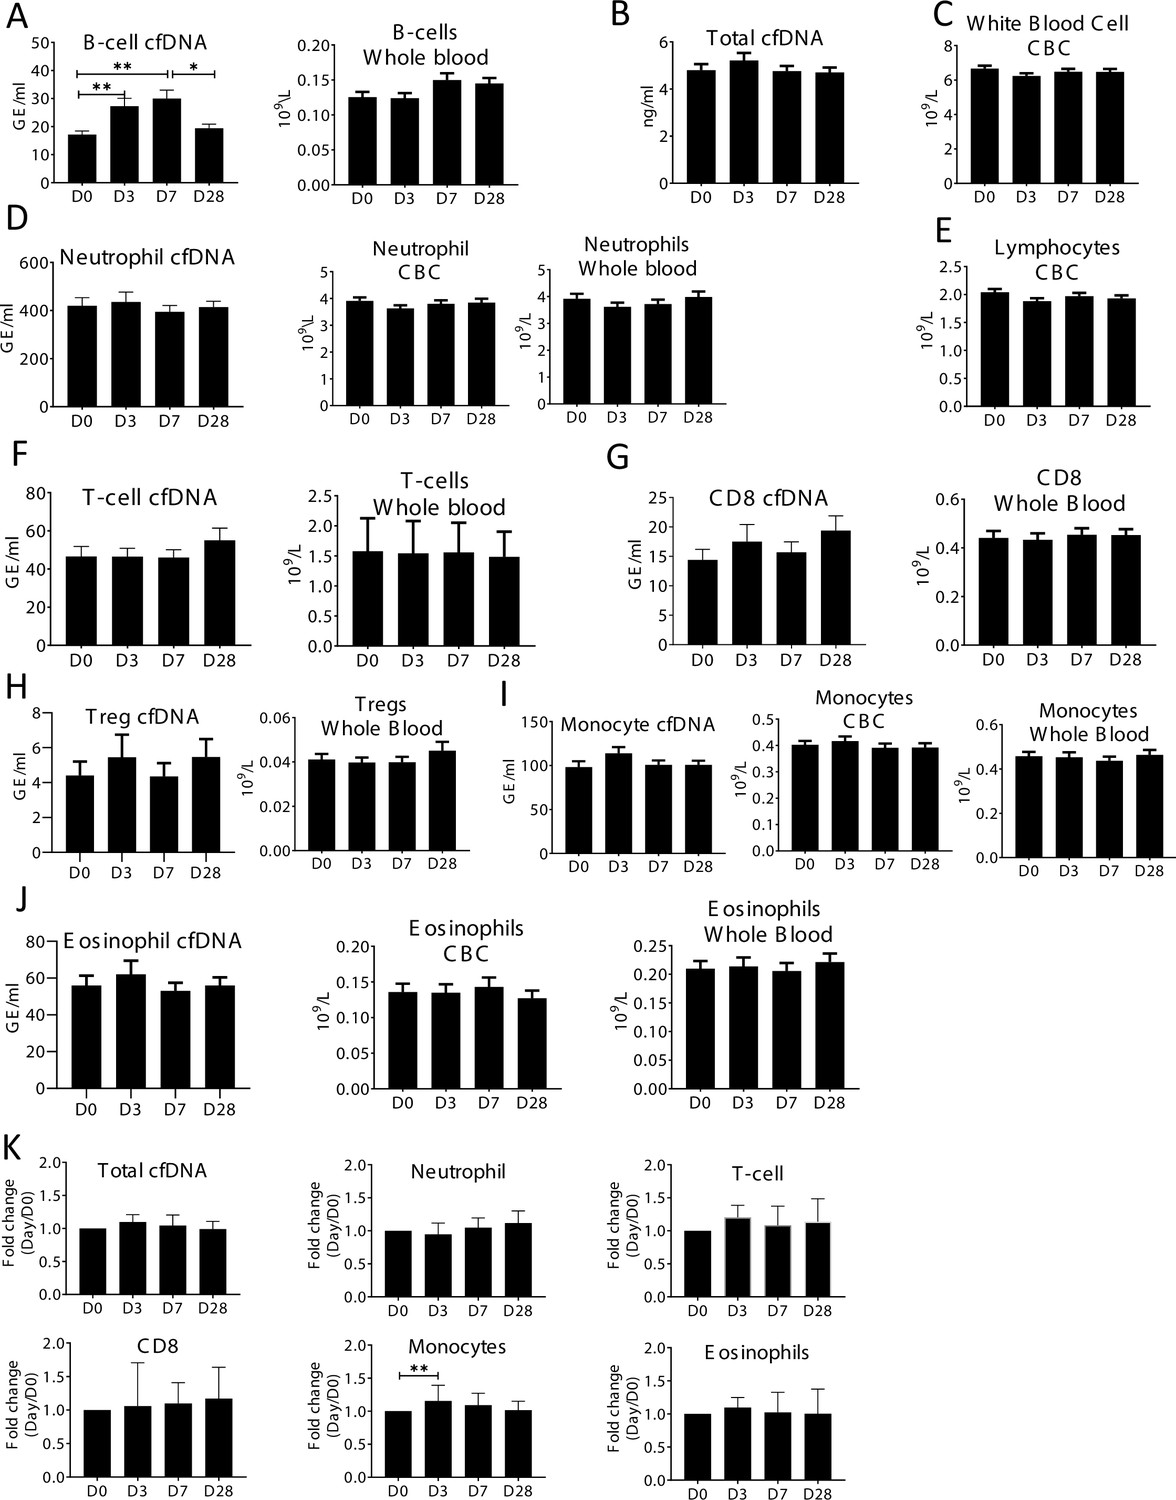
Specific elevation of B-cell-derived cell-free DNA (cfDNA) after influenza vaccination, prior to changes in cell counts and in correlation to efficacy of response to vaccination.
Plasma and blood samples were taken from volunteers (n = 92) receiving the annual influenza vaccination. Samples were obtained on the day before vaccination (D0), and at days 3,7, and 28 (D3, D7, D28). Immune methylation markers were tested on both cfDNA and whole blood. Statistical significance is calculated relative to the levels at D0. (A) B-cell-derived cfDNA markers are elevated on days 3 and 7 (p-value = 0.0002) after influenza vaccination. Circulating B-cell counts did not change significantly at the population level (p-value = 0.078). (B) Total cfDNA (p-value = 0.9). (C) White blood cells count (p-value = 0.28). (D) Neutrophil DNA in plasma (p-value = 0.65) and whole blood (p-value = 0.53), and neutrophil counts in CBC (p-value = 0.47). (E) Lymphocyte counts in CBC (p-value = 0.26). (F) T-cell DNA in plasma (p-value = 0.58) and whole blood (p-value = 0.84). (G) CD8 T-cell DNA in plasma (p-value = 0.5) and whole blood (p-value = 0.83). (H) Regulatory T-cell (Treg) DNA in plasma (p-value = 0.78) and whole blood (p-value = 0.85). (I) Monocyte DNA in plasma (p-value = 0.22) and whole blood (p-value = 0.68), and monocyte counts in CBC (p-value = 0.79). (J) Eosinophil DNA in plasma (p-value = 0.76) and whole blood (p-value = 0.81), and eosinophil counts in CBC (p-value = 0.93). (K) cfDNA measurements normalized to baseline at D0 of each individual: total cfDNA (p-value = 0.37), neutrophil cfDNA (p-value = 0.57), T-cell cfDNA (p-value = 0.69), CD8 cfDNA (p-value = 0.48), monocyte cfDNA (p-value = 0.01), and eosinophil cfDNA (p-value = 0.88) (Kruskal-wallis).
Figure 3—figure supplement 2
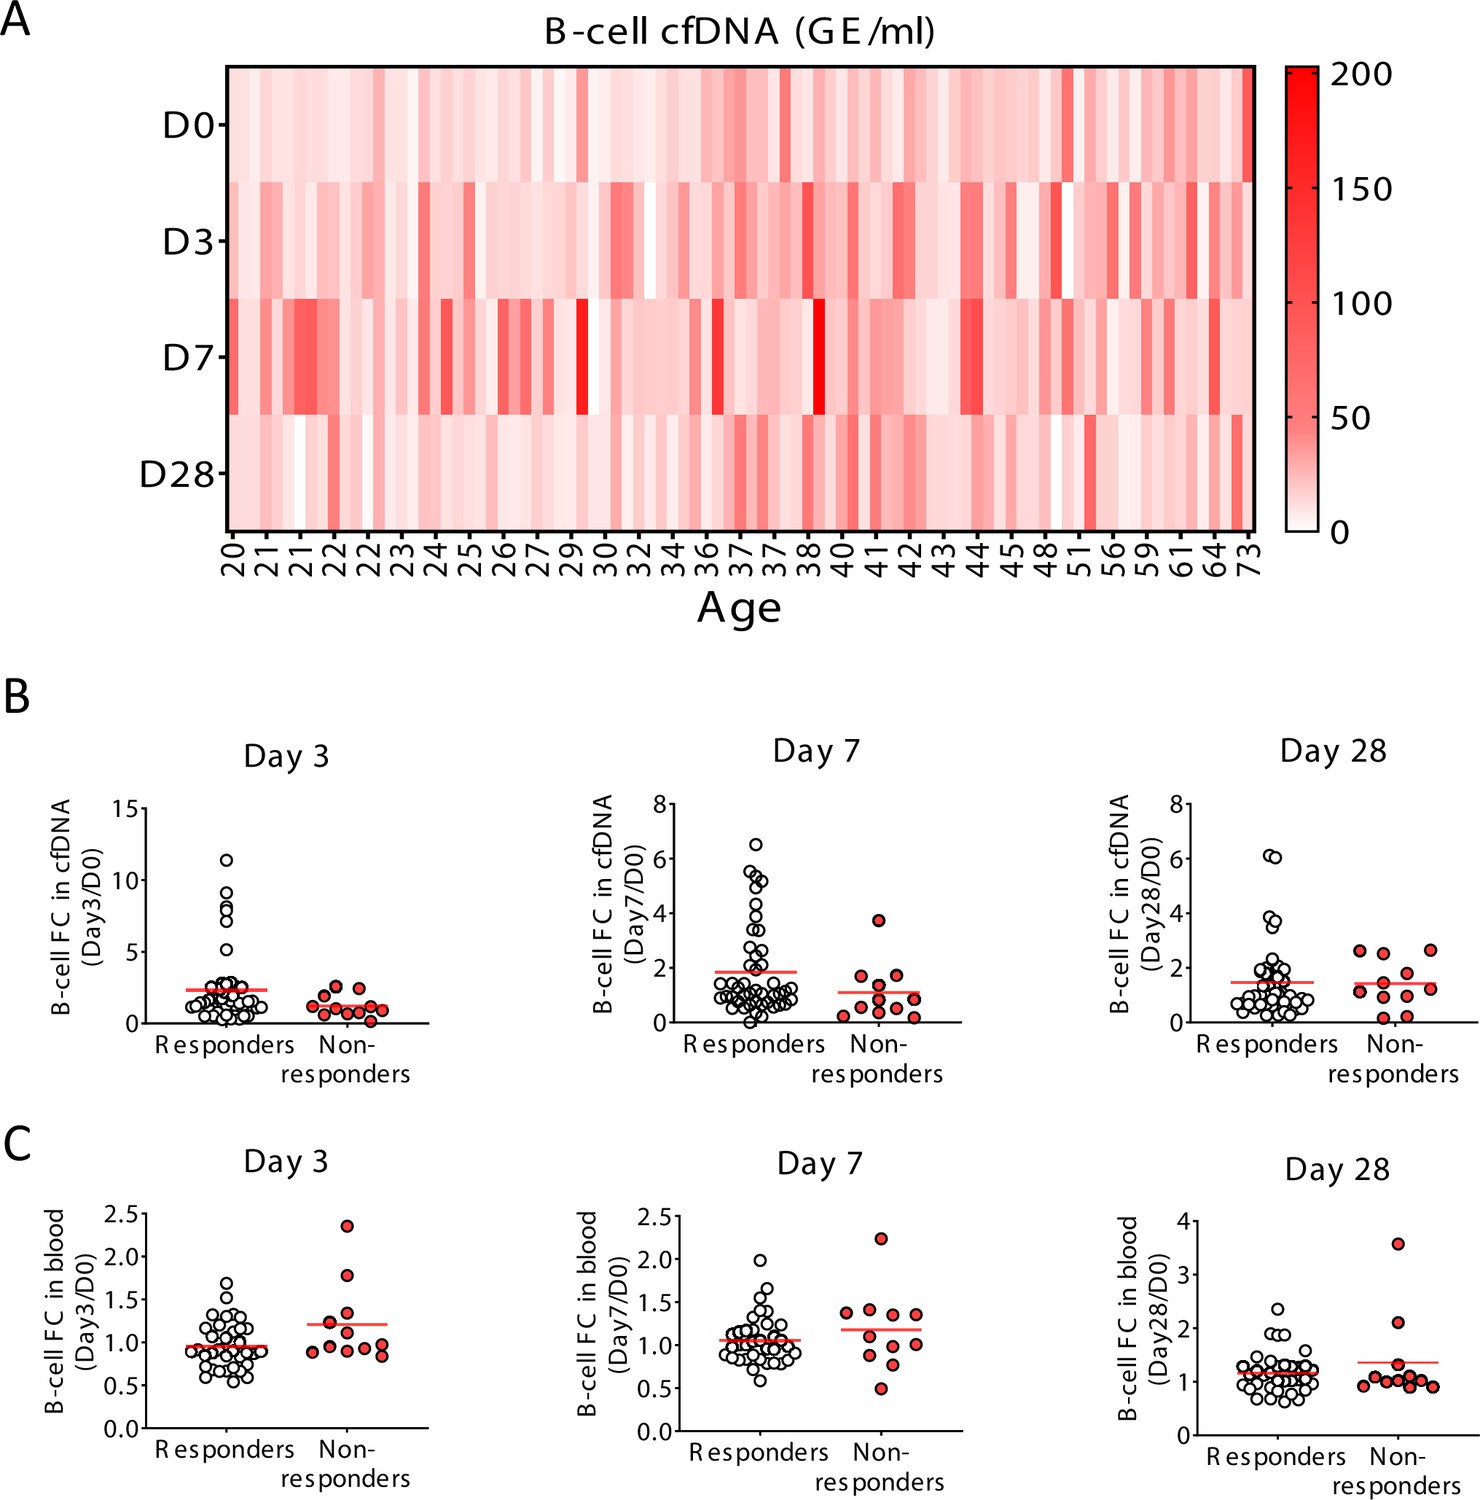
Specific elevation of B-cell-derived cell-free DNA (cfDNA) after influenza vaccination, prior to changes in cell counts and in correlation to efficacy of response to vaccination.
(A) A heat map showing the level of B-cell cfDNA(GE/ml) in each individual following vaccination. (B–C) Normalized B-cell-derived cfDNA (B) and normalized circulating B-cells (C) in responders versus non-responders on days 3, 7, and 28. There are no statistically significant differences between the groups (Mann-Whitney test). Note that when the peak value of B-cell cfDNA in blood is considered (at any day after vaccination), responders have a stronger signal, as shown in main Figure 4.
Figure 4 with 1 supplement

Selective elevation of eosinophil-derived cell-free DNA (cfDNA) in patients with eosinophilic esophagitis (EoE).
(A) Eosinophil-derived cfDNA in active EoE patients (n = 21) compared with healthy controls (n = 14, p-value = 0.0056) and patients with EoE in remission (inactive EoE, n = 24, p-value = 0.0003, Kruskal-Wallis). (B) Differences between immune cfDNA populations in active EoE patients and healthy controls (mean active EoE/ mean control). (C) Eosinophil DNA markers in whole blood of patients and controls (p-value = 0.1, Kruskal-Wallis test). (D) XY scatter plot for eosinophil-derived cfDNA levels versus eosinophil absolute count (ABS) in blood. Dashed lines indicate healthy maximal baseline levels of eosinophil absolute counts in blood, and eosinophil-derived cfDNA in plasma. (E) Receiver operating characteristic (ROC) curve for the diagnosis of active EoE, using eosinophil cfDNA levels in plasma of healthy controls and patients with active EoE. (F) ROC curve for discriminating active from inactive EoE patients.
Figure 4—figure supplement 1
Selective elevation of eosinophil-derived cell-free DNA (cfDNA) in patients with eosinophilic esophagitis (EoE).
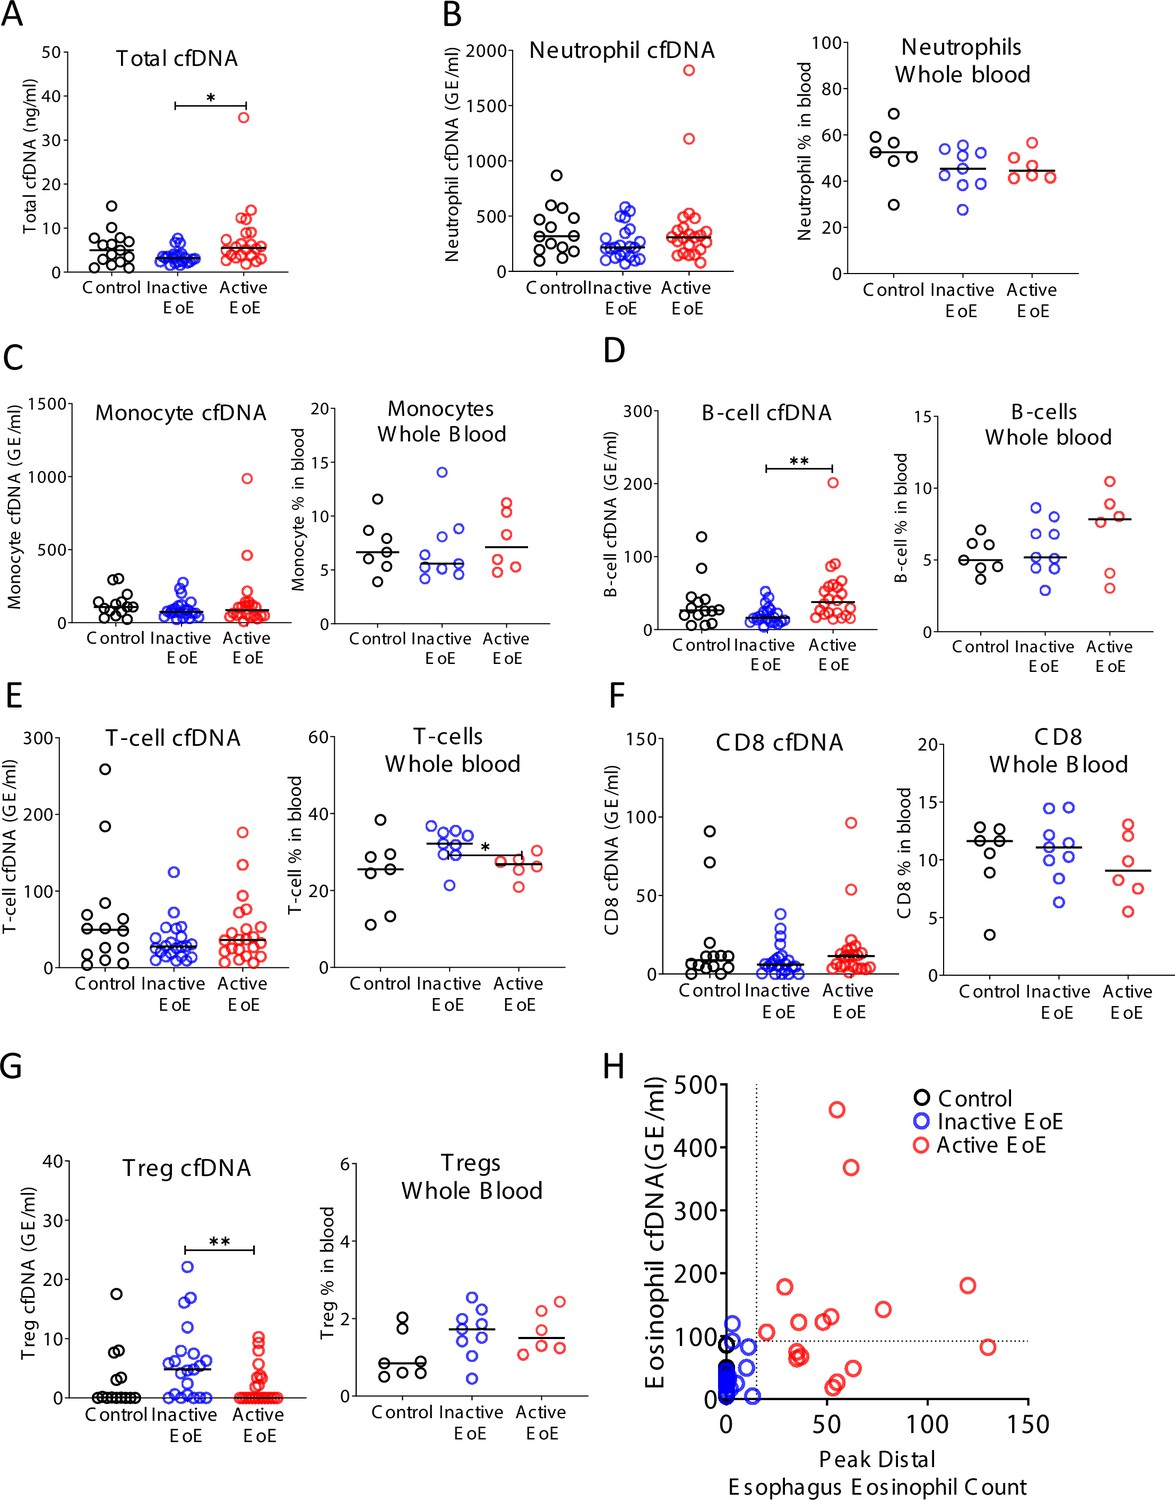
Plasma was collected from three groups: healthy controls (n = 14), inactive EoE (n = 24), and active EoE (n = 21). Some of the patients had also PBMCs collected: healthy controls (n = 7), inactive EoE (n = 9), and active EoE (n = 6). (A) Total cfDNA levels were significantly higher in active EoE compared to inactive EoE (p-value = 0.01). (B) Neutrophil-derived cfDNA (p-value = 0.19) and neutrophil DNA in whole blood (p-value = 0.23) are not different in EoE. (C) Monocyte cfDNA (p-value = 0.45) and monocytes DNA in whole blood are not different in EoE (p-value = 0.75). (D) B-cell-derived cfDNA is significantly higher in active EoE compared with inactive EoE (p-value = 0.0021), but B-cell DNA in whole blood is not significantly different in EoE (p-value = 0.47). (E) T-cell-derived cfDNA is not significantly different between the groups (p-value = 0.48). However, the fraction of T-cell DNA in whole blood is significantly higher in inactive EoE compared with active EoE (p-value = 0.0454). (F) There is no significant difference in CD8-derived cfDNA (p-value = 0.4) and in CD8-derived DNA in whole blood among EoE patients (p-value = 0.6). (G) Regulatory T-cell (Treg) cfDNA levels are significantly higher in inactive EoE compared with active EoE (p-value = 0.009) while Treg DNA in whole blood is not different between patients and controls (p-value = 0.15, Kruskal-Wallis test). (H) XY scatter plot for eosinophil-derived cfDNA levels versus peak distal esophagus eosinophil count, in healthy controls and in patients with inactive or active EoE. Dashed lines indicate thresholds for negative and positive peak distal esophagus eosinophil count (HPF), and negative and positive eosinophil cfDNA.
Figure 5 with 3 supplements
B-cell-derived cell-free DNA (cfDNA) elevation in patients with B-cell lymphoma.
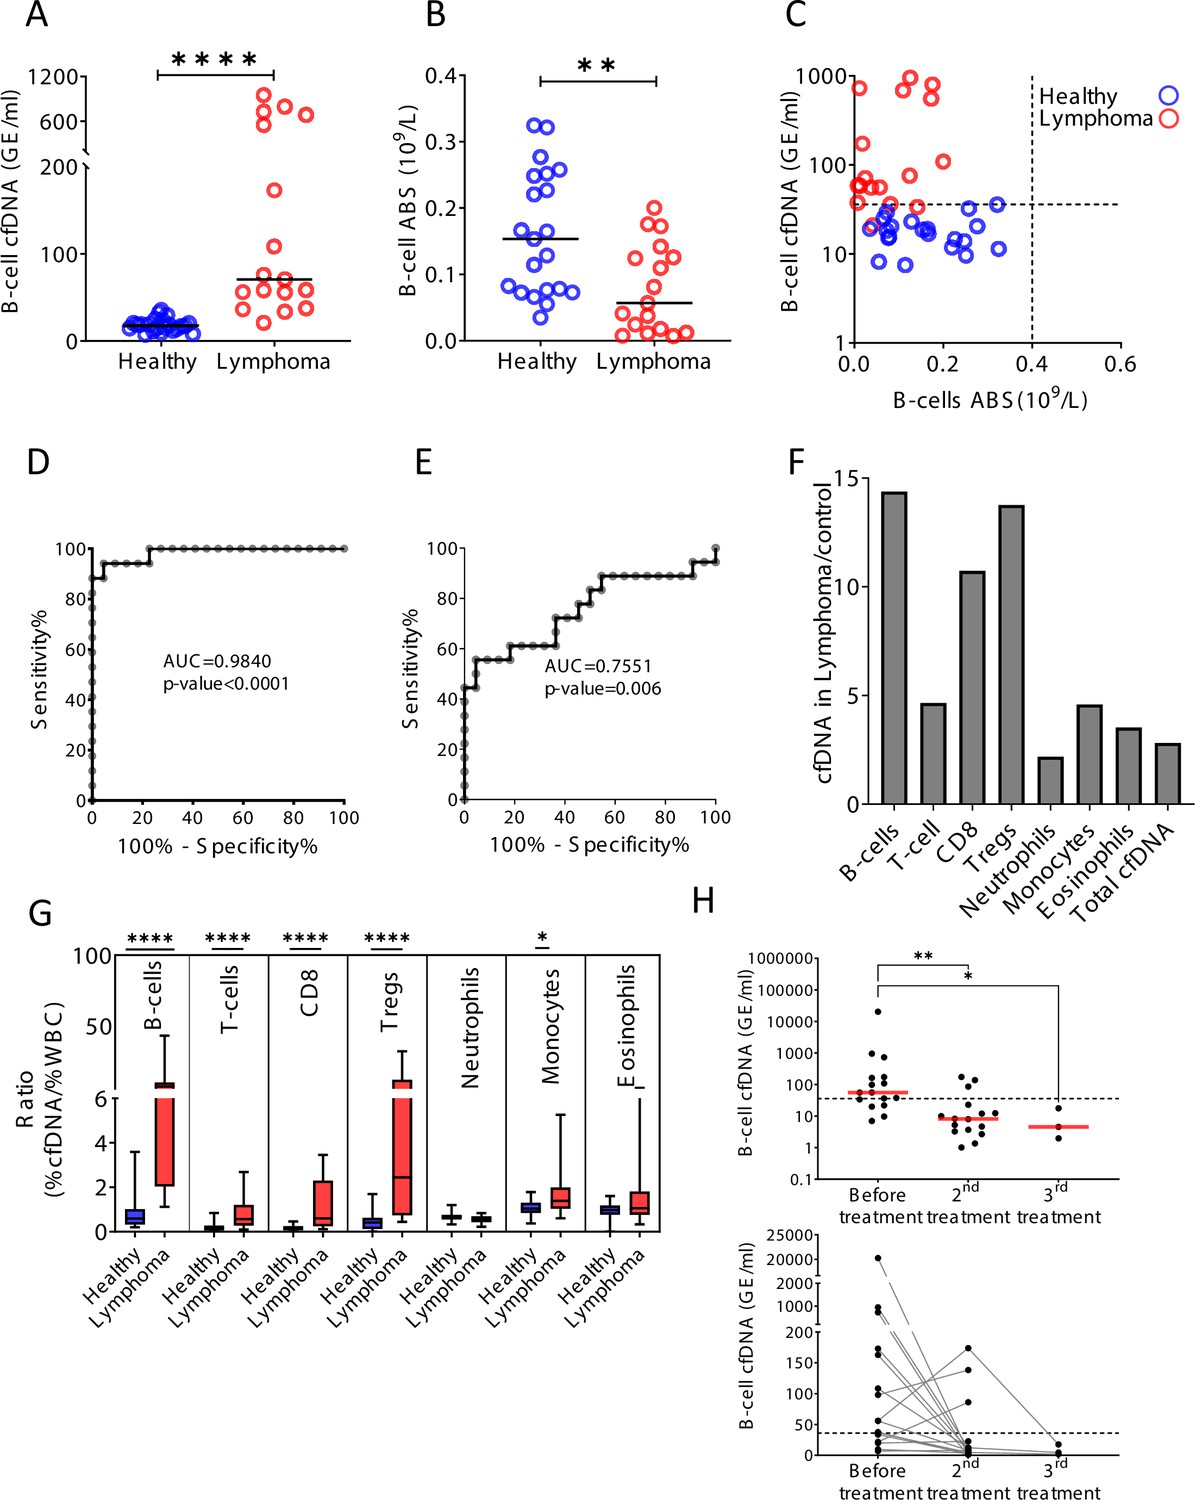
(A) B-cell-derived cfDNA in patients with lymphoma (n = 17) compared with age-matched healthy controls (n = 23, p-value < 0.0001, Mann-Whitney). (B) B-cell absolute counts in patients with lymphoma compared with age-matched healthy controls (p-value = 0.0059, Mann-Whitney). (C) XY scatter plot for B-cell-derived cfDNA levels versus B-cell absolute counts in blood. Dashed lines indicate healthy baseline levels of B-cell absolute counts in blood and B-cell cfDNA. (D) Receiver operating characteristic (ROC) curve for the diagnosis of lymphoma based on B-cell cfDNA levels in healthy subjects and patients with B-cell lymphoma. (E) ROC curve for diagnosis of lymphoma based on B-cell counts. (F) Levels of immune cell type-specific cfDNA in lymphoma patients and healthy controls (mean lymphoma/ mean control). (G) The ratio between the percentage of cfDNA from a given immune cell type and the percentage of cells from this population in blood according to complete blood counts (CBC), in each donor among the healthy volunteers (n = 23, blue bars) and patients with lymphoma (n = 17, red bars). Boxes represent 25th and 75th percentiles around the median, whiskers span min to max. (H) B-cell-derived cfDNA in lymphoma patients (n = 16) before and after treatment (p-value = 0.0032, Kruskal-Wallis).
Figure 5—figure supplement 1
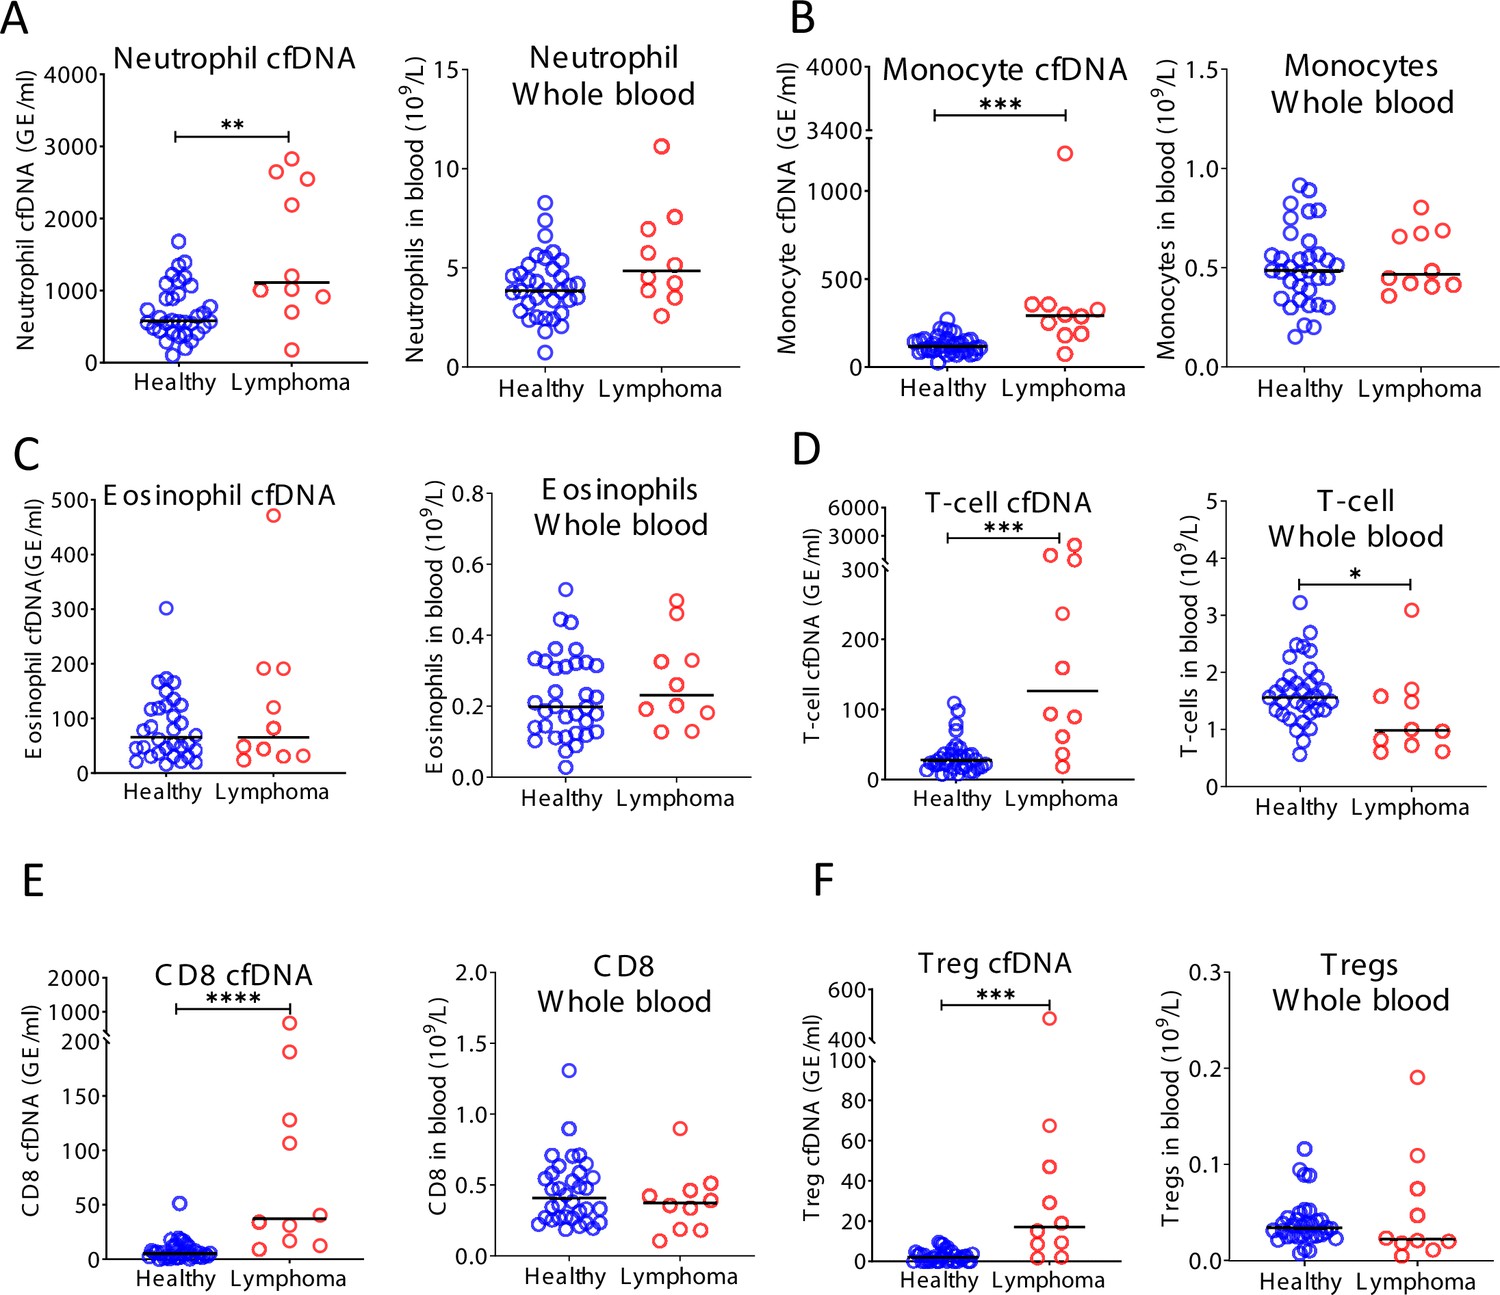
Immune-derived cell-free DNA (cfDNA) in lymphoma patients.
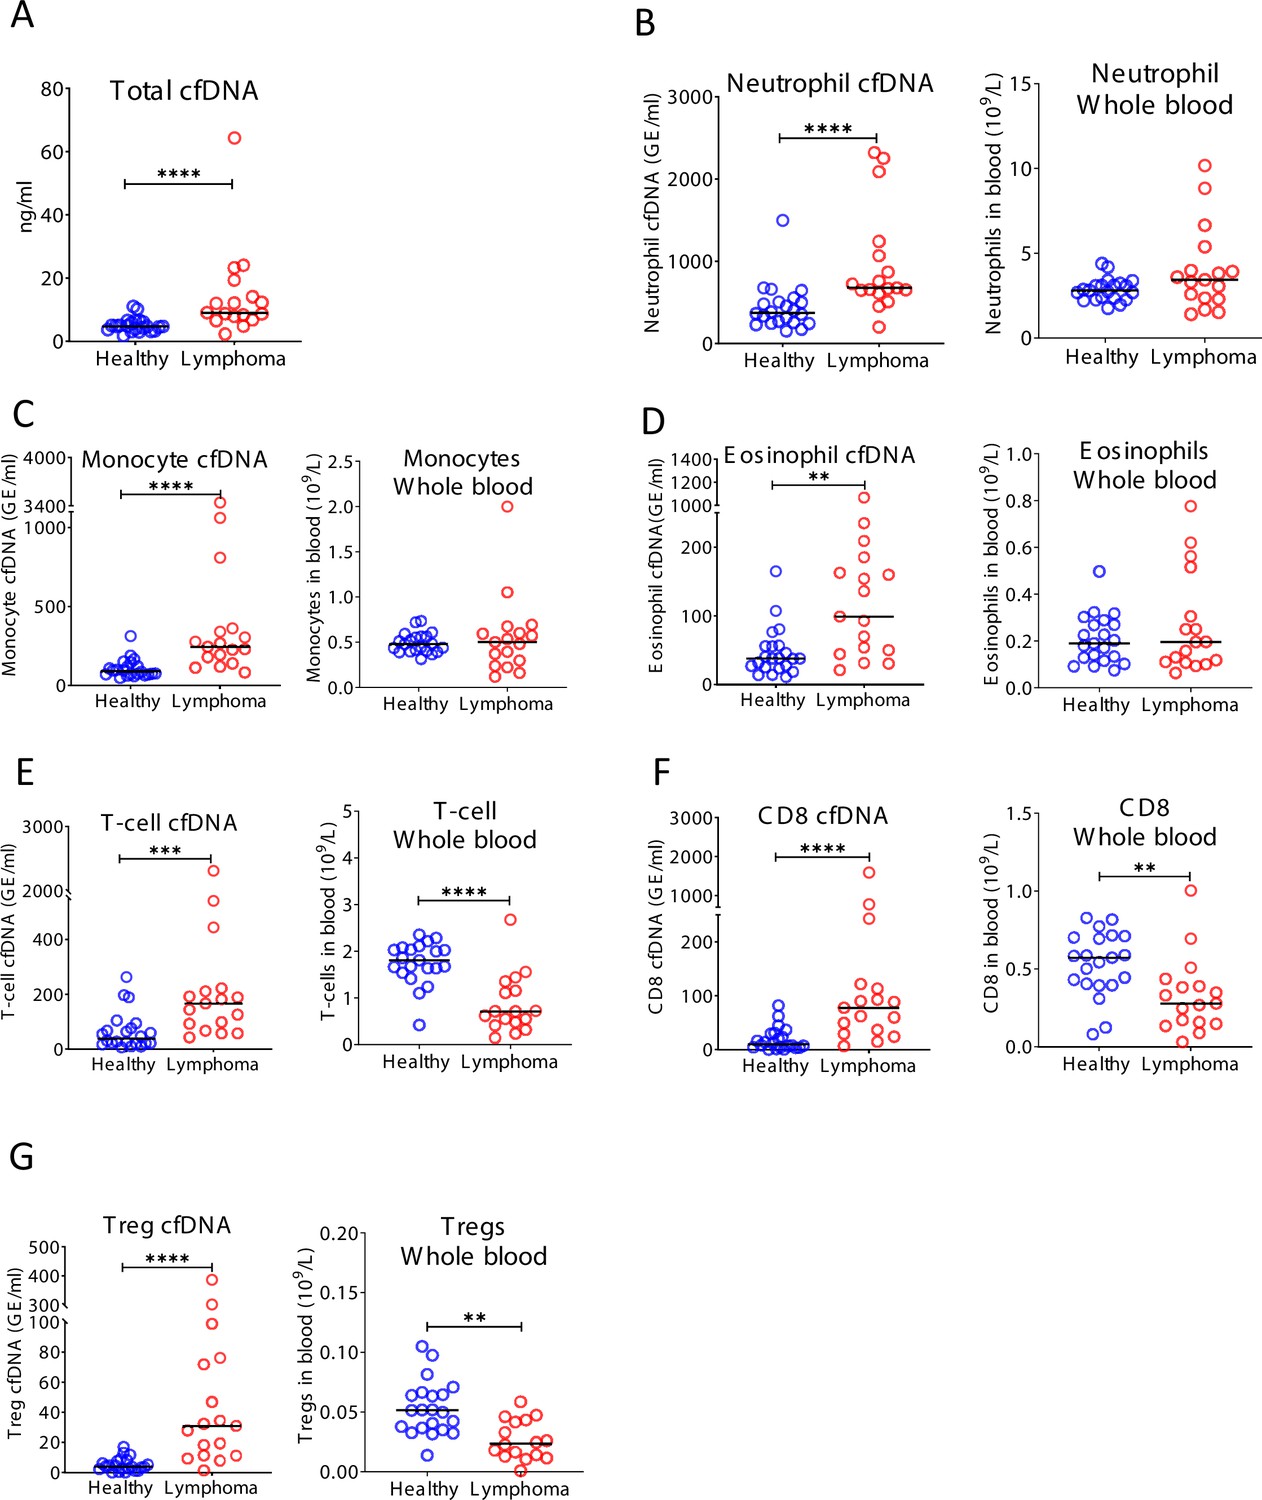
Plasma and blood were collected from healthy controls (n = 22) and patients with lymphoma (n = 17). (A) Total cfDNA levels are significantly higher in lymphoma patients compared with healthy controls (p-value < 0.0001 Mann-Whitney test). (B) Neutrophil-derived cfDNA levels are higher in lymphoma patients compared with controls (p-value < 0.0001), but neutrophil DNA levels in whole blood are not different between patients and controls (p-value = 0.17). (C) Monocyte-derived cfDNA levels are elevated in lymphoma patients (p-value < 0.0001), but monocyte DNA levels in whole blood are not different between patients and controls (p-value = 0.95). (D) Eosinophil-derived cfDNA are elevated in lymphoma patients (p-value < 0.0019) but eosinophil DNA in whole blood is not elevated (p-value = 0.86). (E) T-cell-derived cfDNA levels are elevated in lymphoma (p-value = 0.003) while T-cell DNA is reduced in whole blood (p-value < 0.0001). (F) CD8 T-cell-derived cfDNA levels are elevated in lymphoma (p-value < 0.0001) while CD8 T-cell DNA is reduced in whole blood (p-value = 0.003). (G) Regulatory T-cell (Treg)-derived cfDNA levels are elevated in lymphoma patients (p-value < 0.0001), while Treg DNA in whole blood is reduced (p-value = 0.0026, Mann-Whitney test).
Figure 5—figure supplement 2
Cell-free DNA (cfDNA) analysis of a second cohort of lymphoma patients.
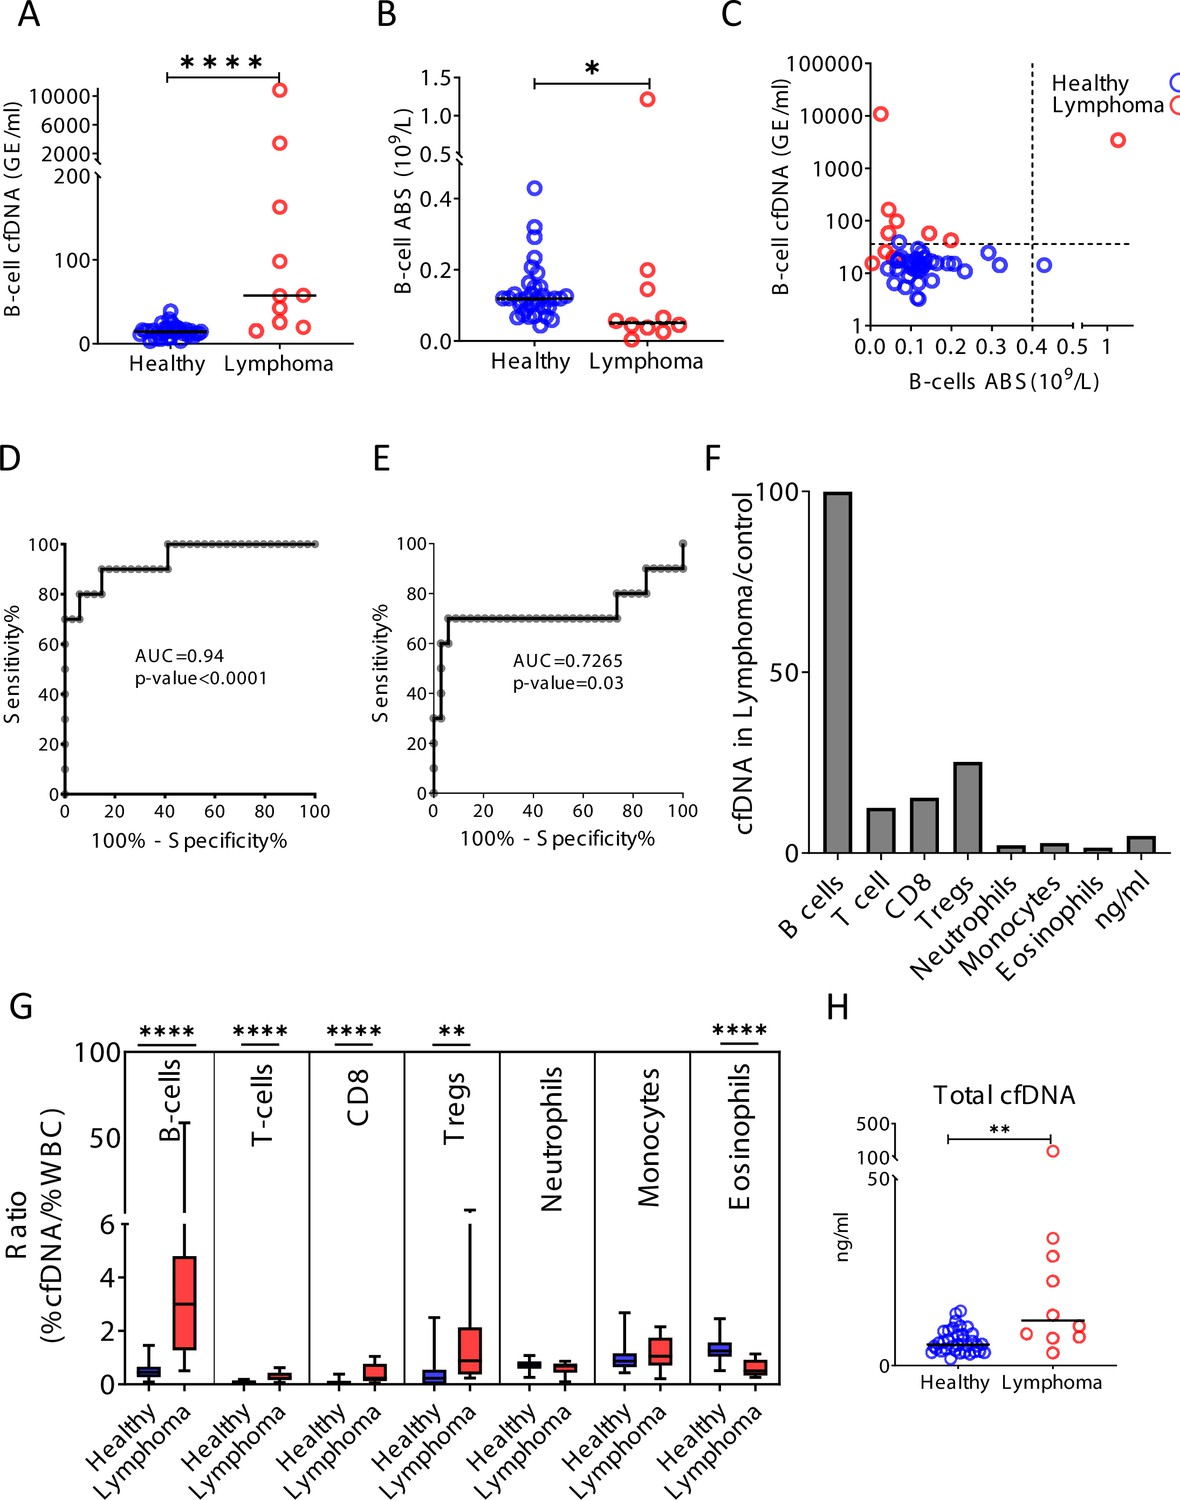
Blood was collected from a second cohort of donors including 34 healthy controls and 10 patients with lymphoma. (A) B-cell-derived cfDNA in an independent second cohort of patients with lymphoma (n = 10) compared with healthy controls (n = 34, p-value < 0.0001, Mann-Whitney). (B) B-cell counts (p-value = 0.03, Mann-Whitney). (C) XY scatter plot for B-cell-derived cfDNA levels versus B-cell absolute counts. Dashed lines indicate healthy baseline levels of B-cell absolute counts and B-cell cfDNA. (D) Receiver operating characteristic (ROC) curve for the diagnosis of lymphoma based on B-cell cfDNA levels in healthy subjects and patients with B-cell lymphoma. (E) ROC curve for diagnosis of lymphoma based on B-cell counts. (F) Levels of immune cell type-specific cfDNA in lymphoma patients and healthy controls (mean lymphoma/ mean control). (G) The ratio between the percentage of cfDNA from a given immune cell type and the percentage of cells from this population in blood according to CBC, in each donor of the second cohort (healthy blue bars; lymphoma red bars). Boxes represent 25th and 75th percentiles around the median, whiskers span min to max. (H) Total cfDNA levels are significantly higher in lymphoma patients compared with healthy controls (p-value = 0.0027 Mann-Whitney test).
Figure 5—figure supplement 3
Cell-free DNA (cfDNA) analysis of a second cohort of lymphoma patients.
(A) Neutrophil-derived cfDNA levels are higher in lymphoma patients compared with controls (p-value = 0.0067), but neutrophil DNA levels in whole blood are not different between patients and controls (p-value = 0.07). (B) Monocyte-derived cfDNA levels are elevated in lymphoma patients (p-value = 0.001), but monocyte DNA levels in whole blood are not different between patients and controls (p-value = 0.71). (C) Eosinophil-derived cfDNA and whole blood are not significantly higher in lymphoma patient’s versus healthy controls (p-value = 0.63; p-value = 0.28). (D) T-cell-derived cfDNA levels are elevated in lymphoma (p-value = 0.0001) while T-cell DNA is reduced in whole blood (p-value = 0.036). (E) CD8 T-cell-derived cfDNA levels are elevated in lymphoma (p-value < 0.0001) while CD8 T-cell DNA in whole blood is not different between patients and controls (p-value = 0.37). (F) Regulatory T-cell (Treg)-derived cfDNA levels are elevated in lymphoma patients (p-value = 0.0001) while Treg DNA is not significantly different in whole blood (p-value = 0.41, Mann-Whitney test).
Figure 6

A schematic view of immune marker variance within individuals.
Intra-individual variance of immune cell count (blue) and immune-derived cell-free DNA (cfDNA) (red) in multiple time points. Our findings suggest that while immune cell counts are stable and typical within an individual, immune cell cfDNA levels vary greatly, reflecting changes in cell turnover that help maintain the cell count set point.
Additional files
-
Supplementary file 1
Blood donor characteristics.
- https://cdn.elifesciences.org/articles/70520/elife-70520-supp1-v2.xlsx
-
Supplementary file 2
Genomic coordinates of immune cell type-specific methylation markers used in this study, and primer sequences used to amplify these loci after bisulfite conversion.
- https://cdn.elifesciences.org/articles/70520/elife-70520-supp2-v2.docx
-
Transparent reporting form
- https://cdn.elifesciences.org/articles/70520/elife-70520-transrepform1-v2.docx
Download links
A two-part list of links to download the article, or parts of the article, in various formats.
Downloads (link to download the article as PDF)
Open citations (links to open the citations from this article in various online reference manager services)
Cite this article (links to download the citations from this article in formats compatible with various reference manager tools)
Remote immune processes revealed by immune-derived circulating cell-free DNA
eLife 10:e70520.
https://doi.org/10.7554/eLife.70520


