Natural variation in the consequences of gene overexpression and its implications for evolutionary trajectories
- Microbiology Doctoral Training Program, University of Wisconsin-Madison, United States
- Great Lakes Bioenergy Research Center, University of Wisconsin-Madison, United States
- Center for Genomic Science Innovation, University of Wisconsin-Madison, United States
- Department of Medical Genetics, University of Wisconsin-Madison, United States
Figures
Figure 1
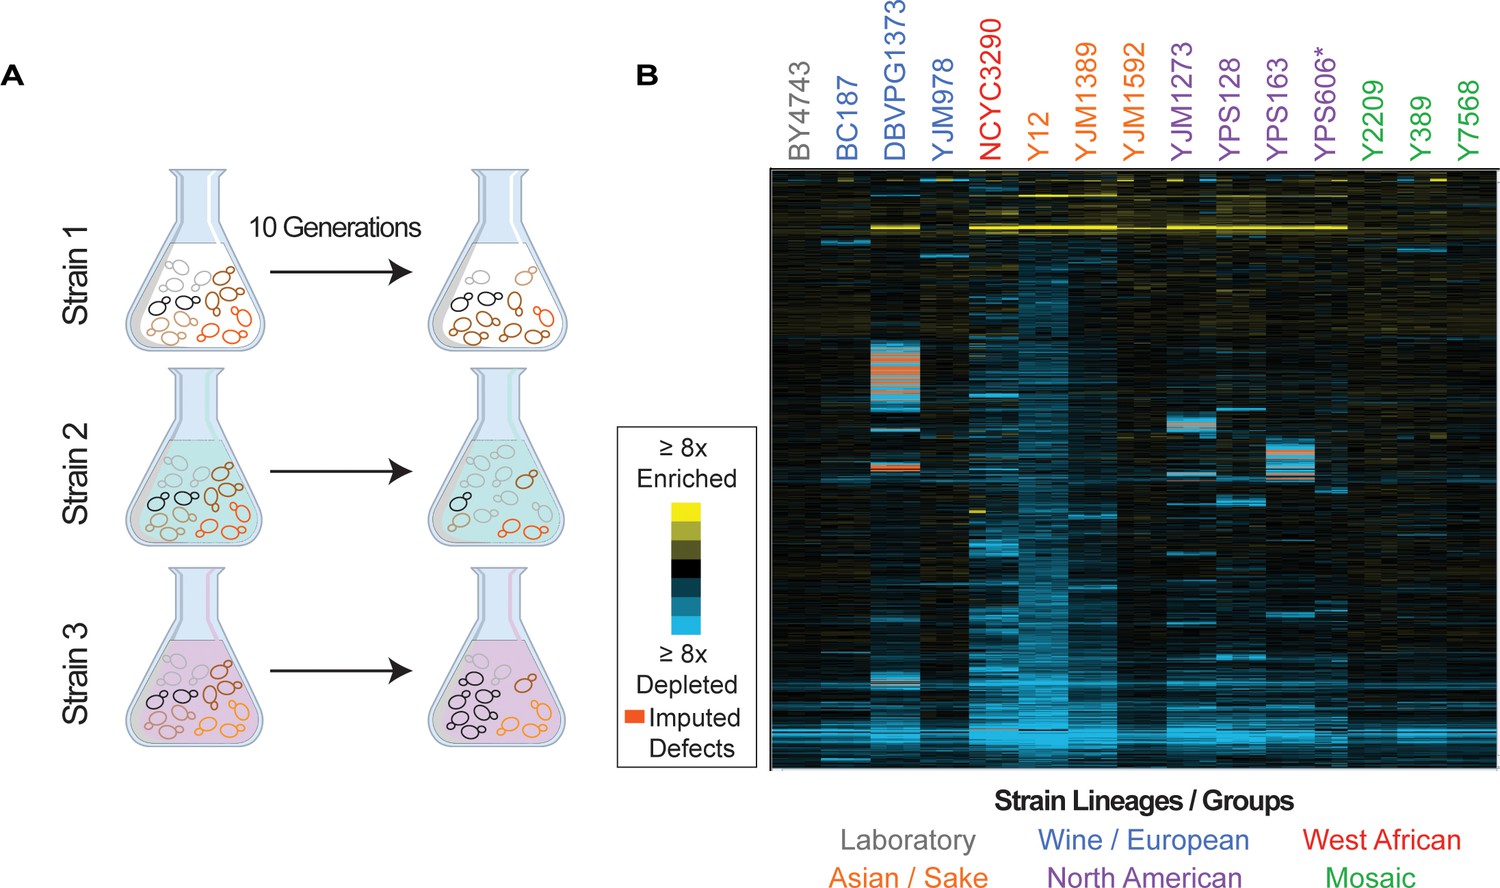
Overview of experiment and results.
(A) Isolates transformed with the MoBY 2.0 overexpression library were grown competitively and changes in plasmid abundance were quantified, see Materials and methods for details. (B) Heat map of hierarchically clustered log2(relative fitness scores) for 4064 genes (rows) measured in 15 strains in biological triplicate (columns) after 10 generations of growth. Strain labels are colored according to lineage. Blue and yellow colors represent plasmids that become enriched or depleted in frequency to indicate fitness defects or benefits, respectively, according to the key. Some barcodes with missing values after growth were inferred (see Materials and methods); those that are significant are indicated as an orange box in the heat map. A source data file is included (see Figure 1—source data 1: Hierarchical clustered fitness scores).
-
Figure 1—source data 1
Hierarchical clustered fitness scores.
- https://cdn.elifesciences.org/articles/70564/elife-70564-fig1-data1-v2.txt
Figure 2 with 2 supplements
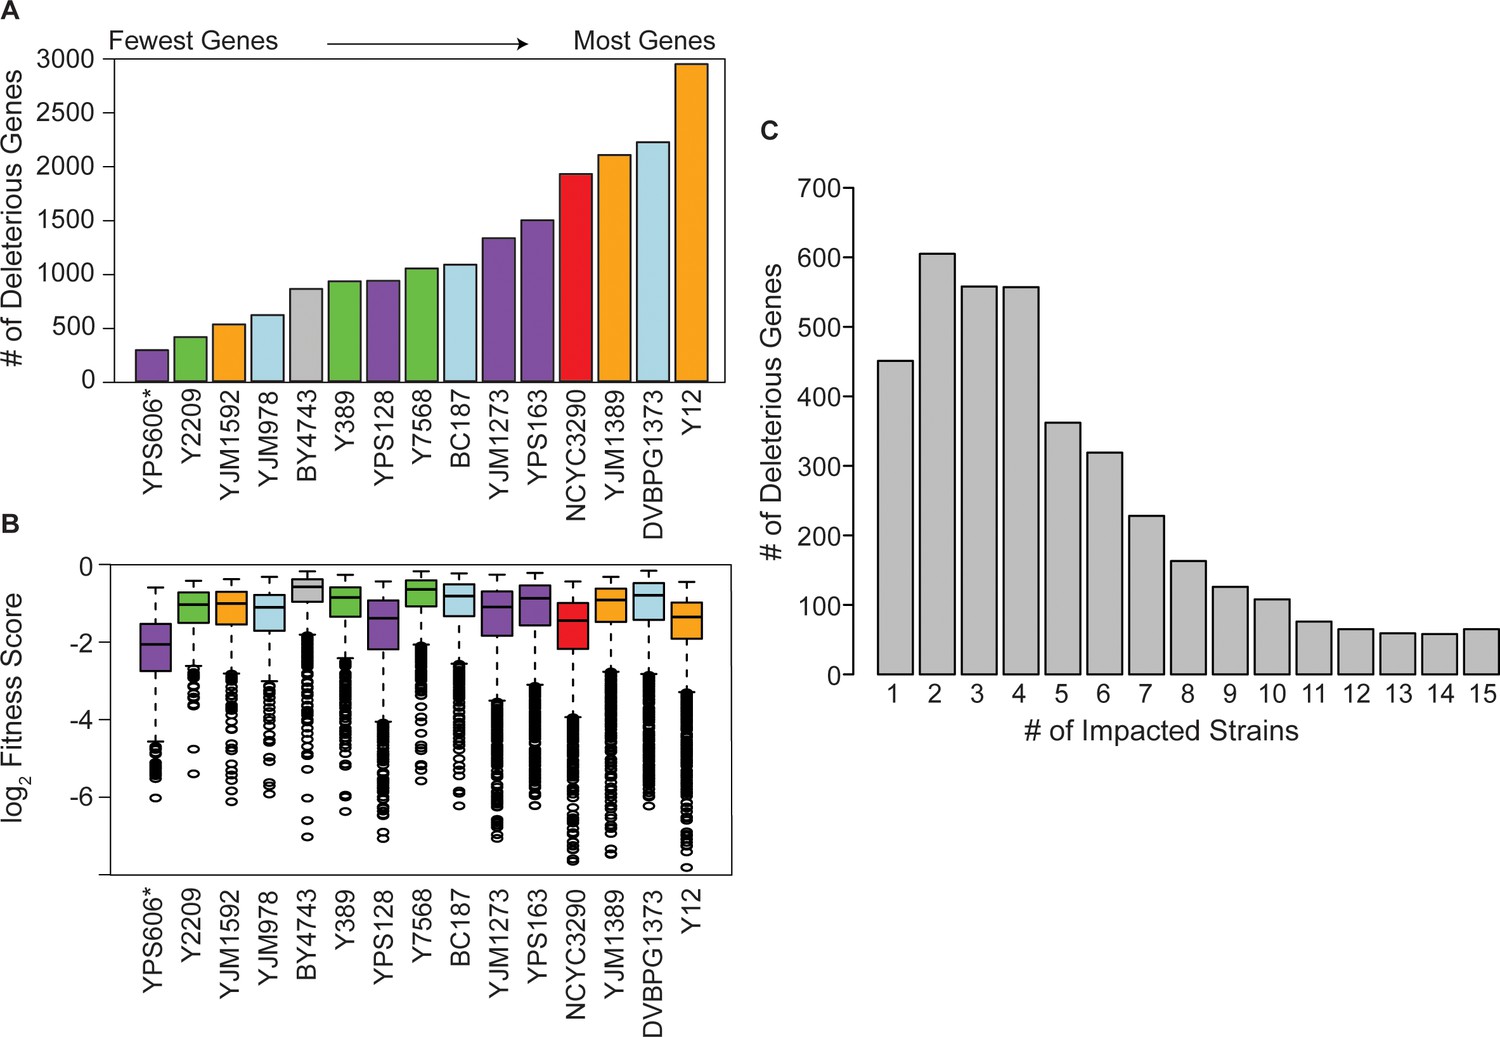
Strain backgrounds display a wide range of fitness effects.
(A) The number of deleterious genes in each strain (FDR<0.05), colored by lineage as in Figure 1B. The number of deleterious and beneficial genes in each strain (FDR<0.05) are shown in Figure 2—figure supplement 1. The number of deleterious genes per strain is not related to 2-µm abundance (see Figure 2—figure supplement 2). (B) The distributions of log2 (relative fitness scores) for genes identified as deleterious in each strain. Imputed ratios were not included. The strains are ordered based on the number of fitness defects from smallest to largest (left to right); YPS606 (asterisk) likely had lower statistical power due to analysis of only duplicates. (C) Deleterious genes were binned according to the number of strains in which the gene had a deleterious fitness effect (x-axis). Commonly deleterious genes were defined as a set of 431 genes with a deleterious effect in ≥10 strains.
Figure 2—figure supplement 1

Number of significant genes across strains.
The number of beneficial genes (light gray) and deleterious genes (dark gray) for each strain is shown. The strains are ordered by the number of deleterious genes from left to right.
Figure 2—figure supplement 2
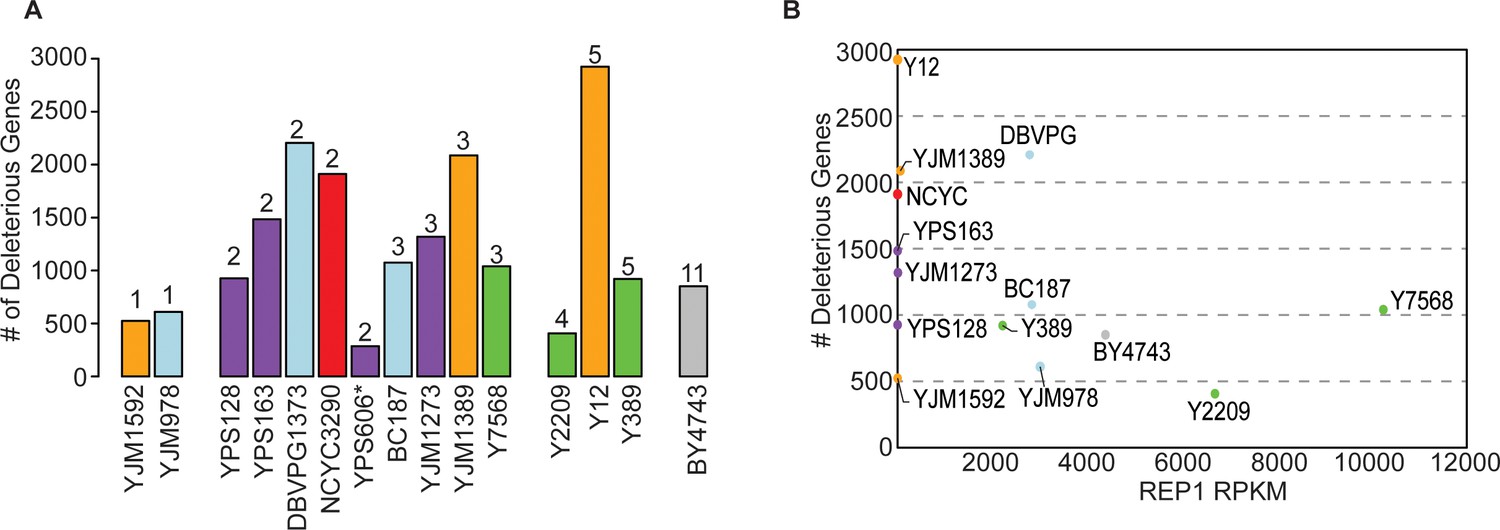
The number of deleterious genes per strain is not related to 2-µm abundance.
(A) Copy number of the empty Moby 2.0 vector in each strain was measured by qPCR (n=3) (comparing the KAN-MX drug marker on the Moby 2.0 plasmid to native genomic TUB1 recovered in the DNA preparations, normalized to BY4743 KAN/TUB1 ratios of 2-µm vector relative to CEN vector, see Materials and methods). There was variation in the measurements such that plasmid abundance was not statistically different across strains; nonetheless, we binned strains according to the mean copy number (rounded to the nearest inter) measured across biological-triplicate measurements. The figure shows that the number of deleterious genes identified in each strain (y-axis) is not related to the average Moby 2.0 copy number listed above each histogram. (B) The number of deleterious genes (y-axis) is plotted against the native 2-µm abundance in each strain, taken as the RPKM for 2-µm gene REP1 (x-axis) from past sequencing studies (see Materials and methods). Note: BY4741 sequencing data was used for the BY4743 plot. The figure shows that native 2-µm plasmid abundance is not related to the number of deleterious genes or Moby 2.0 copy number. qPCR, quantitative PCR.
Figure 3
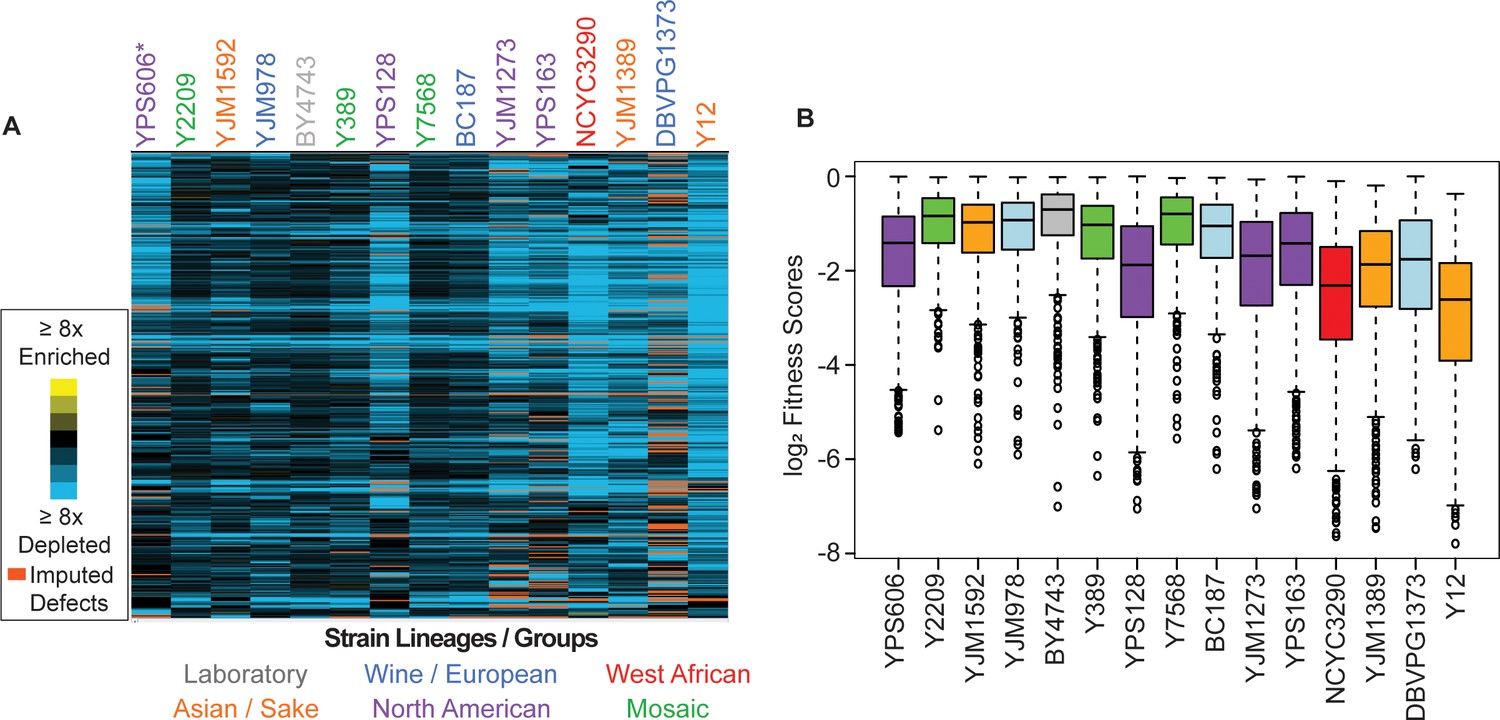
Commonly deleterious genes affect many strains but to different degrees.
(A) Heat map of log2 (relative fitness scores) as shown in Figure 1B but for 431 commonly deleterious genes. (B) The distribution of the log2 (relative fitness scores) (taking the replicate average for each gene) for 431 commonly deleterious genes are plotted. Imputed scores were not included. The strains are ordered based on the total number of deleterious genes, from smallest to largest (left to right). A source data file is included (see Figure 3—source data 1).
-
Figure 3—source data 1
Hierarchical clustered commonly deleterious genes fitness scores.
- https://cdn.elifesciences.org/articles/70564/elife-70564-fig3-data1-v2.txt
Figure 4 with 1 supplement
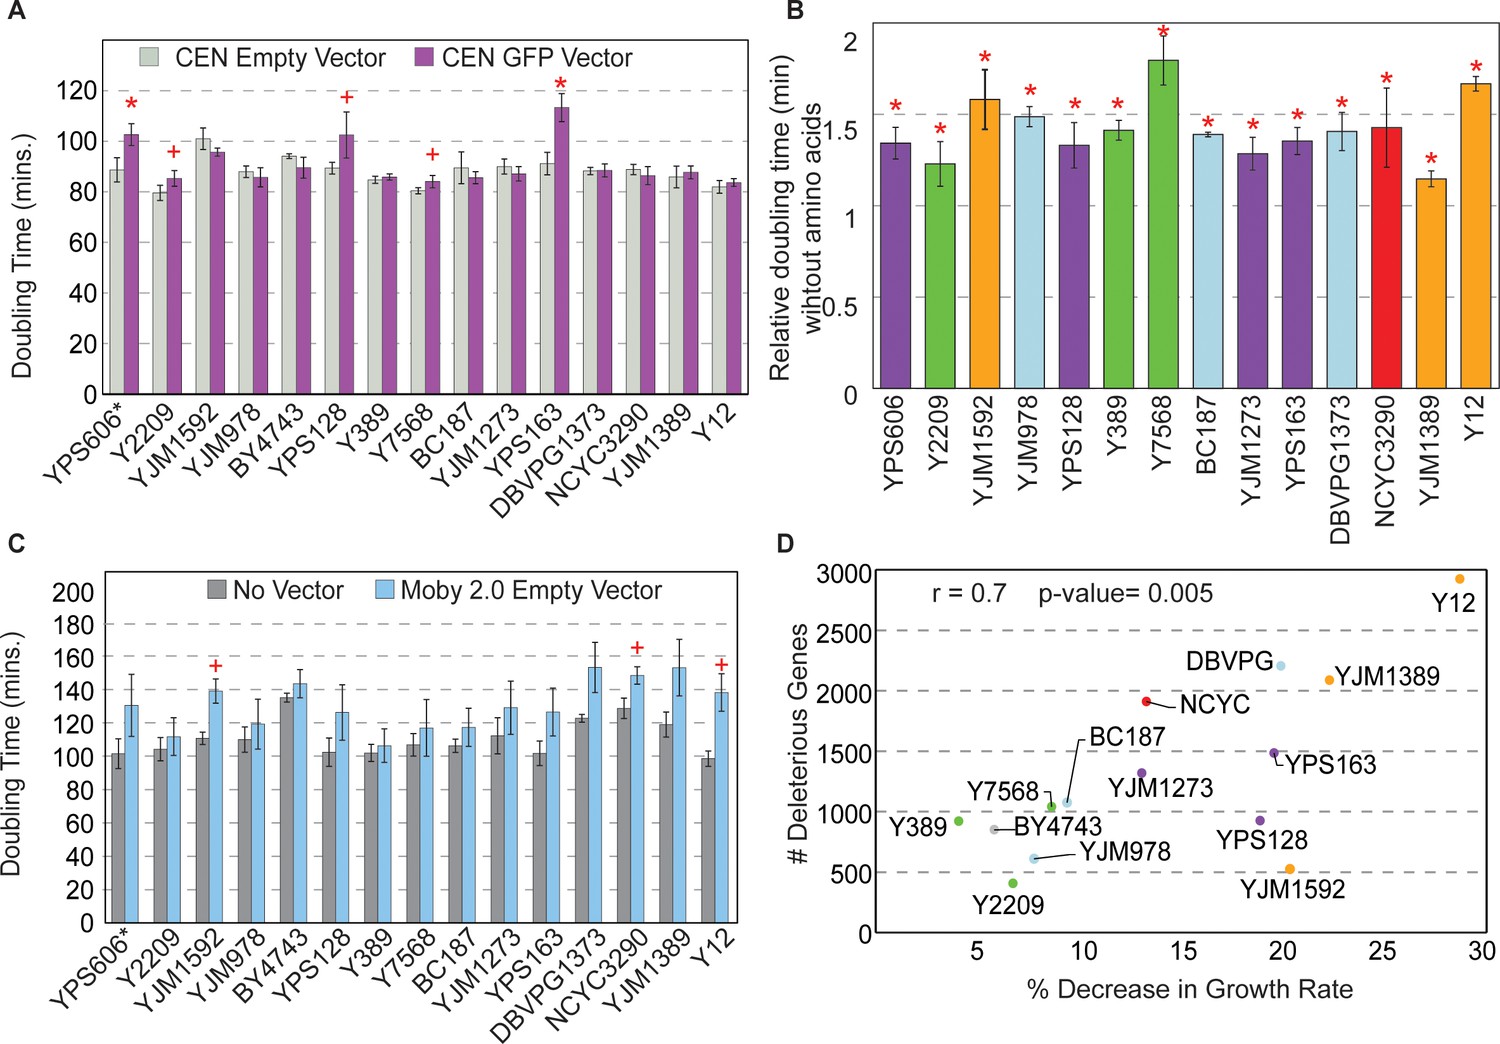
Strains show different sensitivities to protein and DNA expression.
(A) The average and standard deviation (n=3) of doubling times for strains containing a CEN empty vector (light gray) or CEN vector expressing GFP from the TEF1 promoter (purple). Asterisk indicates FDR<0.005 and plus sign indicates FDR<0.07, paired t-tests. Western blot analysis of strains expressing the GFP vector is shown in Figure 4—figure supplement 1. (B) Doubling times of GFP-expressing strains from (A) grown in synthetic medium without amino acids relative to synthetic-complete medium (n=3). All strains grow significantly slower without amino acids (asterisk; FDR<0.05). (C) Average and standard deviation of doubling times for each strain carrying the Moby 2.0 empty vector grown in selection (blue) or with no vector and grown in the absence of selection (gray) (n=3). A plus sign indicates FDR<0.1, one-tailed t-test. (D) Number of deleterious genes per strain (y-axis) compared to the % decrease in growth rate for each strain carrying the Moby 2.0 empty vector (x-axis) as measured in (C). There is a positive correlation between the number of deleterious OE genes and % decrease in doubling time in response to the vector (r=0.7, p=0.005, excluding YPS606). FDR, false discovery rate.
Figure 4—figure supplement 1
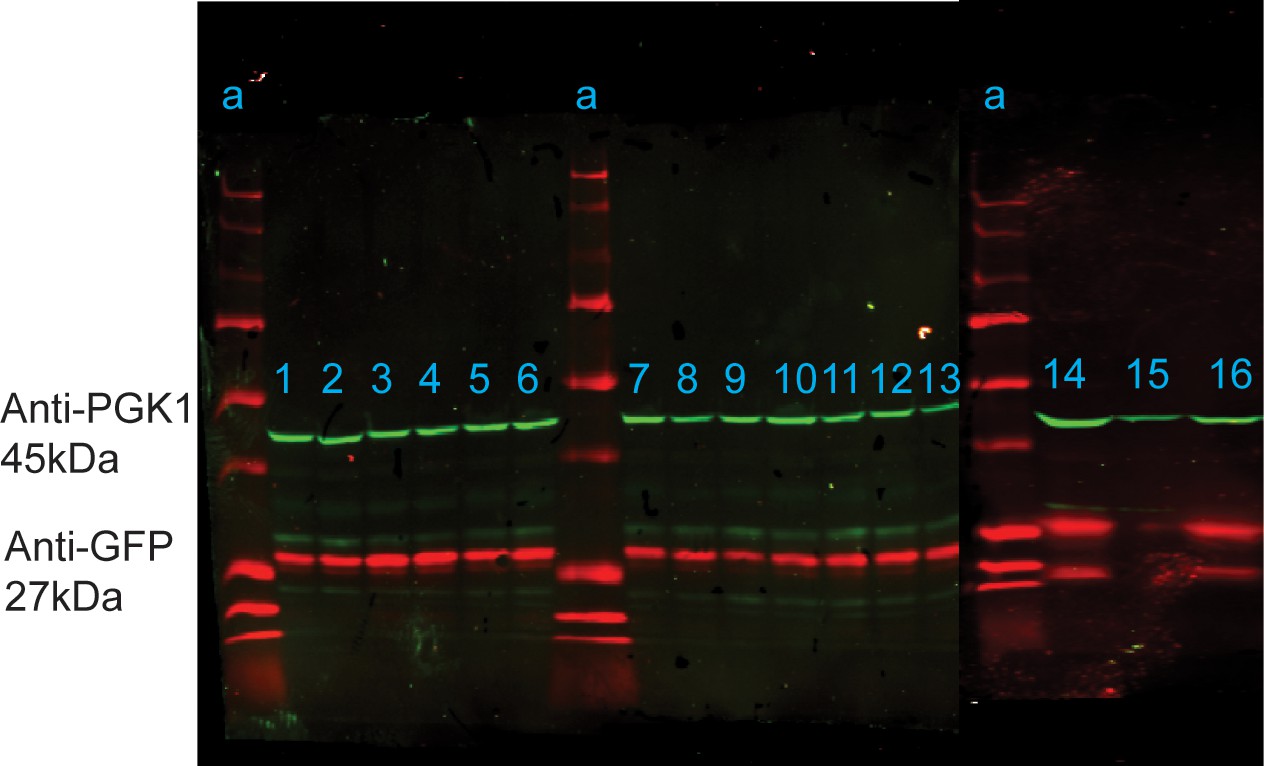
Western blot analysis of anti-GFP (red) and anti-PGK1 loading control (green) in strains carrying to GFP plasmid, grown to log phase in SC.
Lanes: a=Precision All Blue Standard (Bio-Rad) Ladder, 1=BC187, 2=BY4743, 3=DBVPG1373, 4=NCYC3290, 5=Y12, 6=Y2209, 7=Y7568, 8=YJM1273, 9=YJM1592, 10=YJM978, 11=YPS128, 12=YPS163, 13=YPS606, 14=BY4743, 15=Y389, and 16=YJM1389. A source data file of the raw unedited blots detecting anti-PGK1 in samples 1–13 (Figure 4—figure supplement 1—source data 1), anti-PGK1 in samples 14–16 (Figure 4—figure supplement 1—source data 2), anti-GFP in samples 1–13 (Figure 4—figure supplement 1—source data 3), and anti-GFP in samples 13–16 (Figure 4—figure supplement 1—source data 4) are included. The uncropped Western blot images for all samples are shown in Figure 4—figure supplement 1—source data 5.
-
Figure 4—figure supplement 1—source data 1
Raw blot detecting anti-PGK1 in samples 1–13.
- https://cdn.elifesciences.org/articles/70564/elife-70564-fig4-figsupp1-data1-v2.tiff.zip
-
Figure 4—figure supplement 1—source data 2
Raw blot detecting anti-PGK1 in samples 14–16.
- https://cdn.elifesciences.org/articles/70564/elife-70564-fig4-figsupp1-data2-v2.tiff.zip
-
Figure 4—figure supplement 1—source data 3
Raw blot detecting anti-GFP in samples 1–13.
- https://cdn.elifesciences.org/articles/70564/elife-70564-fig4-figsupp1-data3-v2.tiff.zip
-
Figure 4—figure supplement 1—source data 4
Raw blot detecting anti-GFP in samples 14–16.
- https://cdn.elifesciences.org/articles/70564/elife-70564-fig4-figsupp1-data4-v2.tiff.zip
-
Figure 4—figure supplement 1—source data 5
Uncropped Western blot images for all samples.
- https://cdn.elifesciences.org/articles/70564/elife-70564-fig4-figsupp1-data5-v2.tif.zip
Figure 5
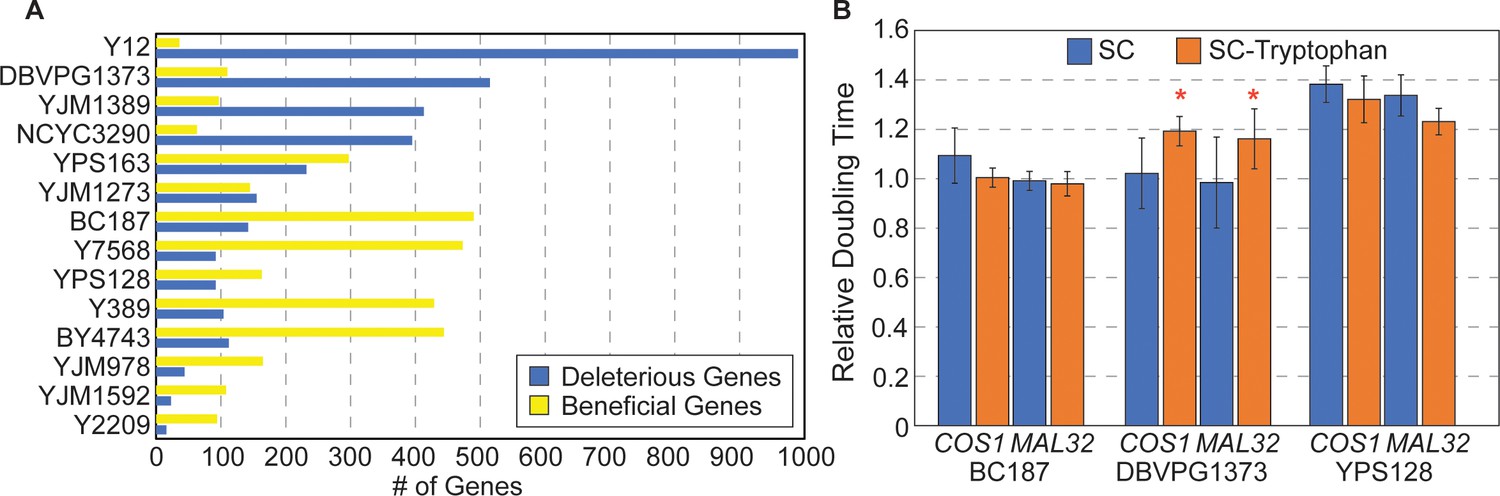
Strain-specific responses to gene OE.
(A) The number of strain-specific genes that were deleterious (blue) or beneficial (yellow) are shown for each strain. (Note: YPS606 was not included due to low statistical power of duplicate replicates.) (B) Average and standard deviation of doubling times in denoted strains overexpressing COS1 or MAL32, relative to the growth rate of each strain carrying the empty vector, when strains were grown in synthetic complete medium (blue) or medium lacking tryptophan (orange) (n=3). Asterisk indicates slower relative growth in tryptophan-minus media (p<0.05, one-tailed paired t-test).
Figure 6
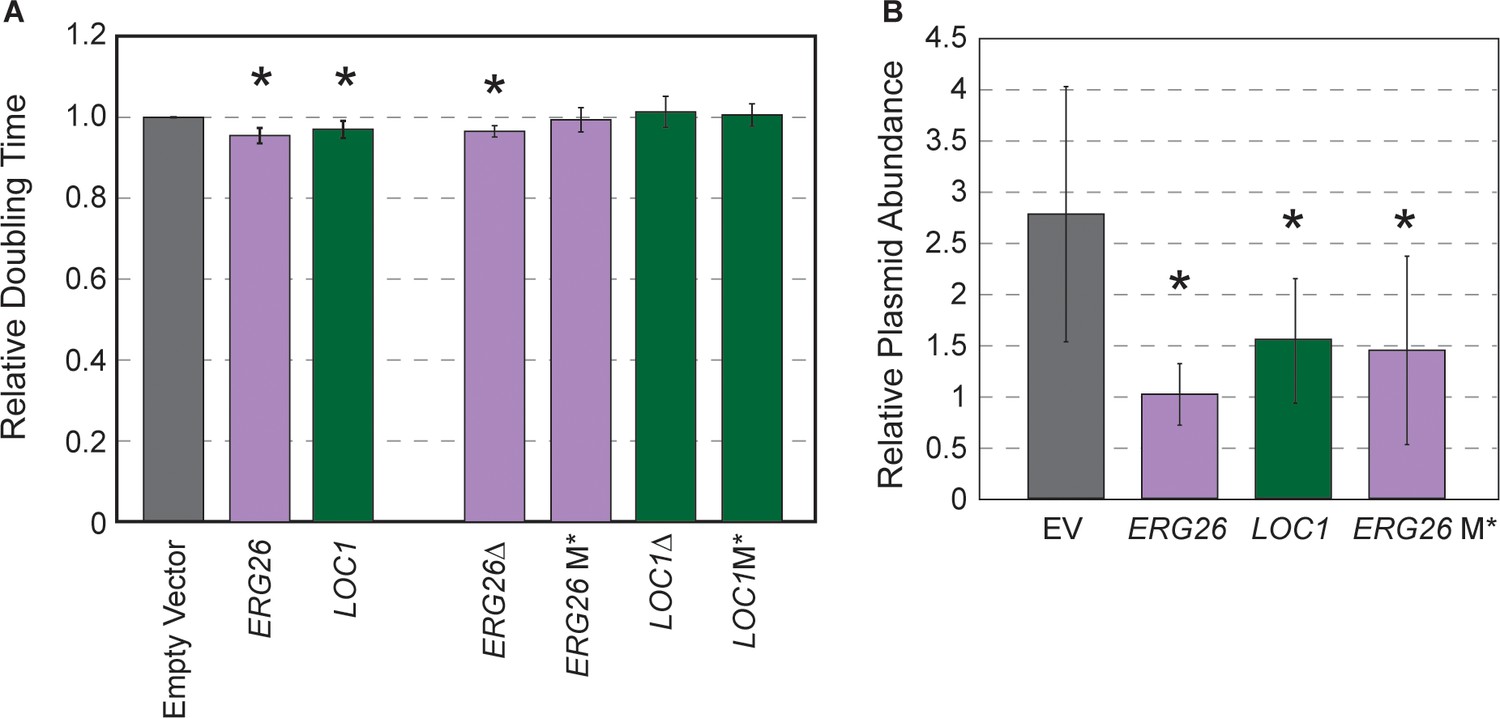
Highly beneficial genes may relate to 2-µm replication.
(A) Average and standard deviation of doubling times of strain YPS128 carrying ERG26 or LOC1 Moby 2.0 vectors relative to the empty vector (n=5), or vectors in which the gene portion was deleted (Δ) or the start codon was mutated (M*). Asterisk indicates significantly faster growth rate versus the empty-vector control (p<0.05, paired t-test). (B) Abundance of Moby 2.0 vectors was adjusted relative to a CEN vector (see Materials and methods, n=5 except for LOC1 in which n=3).
Tables
Key resources table
| Reagent type (species) or resource | Designation | Source or reference | Identifiers | Additional information |
|---|---|---|---|---|
| Gene (kanr) | kanr | Yeast knockout Collection; Horizon Discovery | kanMX | |
| Strain, strain background (Saccharomyces cerevisiae) | BY4743 MATa/α his3Δ1/his3Δ1 leu2Δ0/leu2Δ0 LYS2/lys2Δ0 met15Δ0/MET15 ura3Δ0/ura3Δ0 | ATCC | BY4743 | |
| Strain, strain background (S. cerevisiae) | BC187 | Gerke et al., 2006, doi: 10.1534/genetics.106.058453 | BC187 | |
| Strain, strain background (S. cerevisiae) | DBVPG1373 | Capriotti, 1955 | DBVPG1373 | |
| Strain, strain background (S. cerevisiae) | NCYC3290 | Bili wine, Liti et al., 2009, doi: 10.1038/nature07743 | NCYC3290 | |
| Strain, strain background (S. cerevisiae) | Y12 | Palm wine, C. Kurtzman and the ARS culture collection | Y12 | |
| Strain, strain background (S. cerevisiae) | Y2209 | Lepidopterous sample, C. Kurtzman and the ARS culture collection | Y2209 | |
| Strain, strain background (S. cerevisiae) | Y389 | Mushrooms, C. Kurtzman and the ARS culture collection | Y389 | |
| Strain, strain background (S. cerevisiae) | Y7568 | Papaya, C. Kurtzman and the ARS culture collection | Y7568 | |
| Strain, strain background (S. cerevisiae) | YJM1273 | Sniegowski et al., 2002. doi: 10.1111/j.1567–1364.2002.tb00048.x | YJM1273 | |
| Strain, strain background (S. cerevisiae) | YJM1389 | Strope et al., 2015 doi: 10.1101/gr.185538.114 | YJM1389 | |
| Strain, strain background (S. cerevisiae) | YJM1592 | Strope et al., 2015 doi: 10.1101/gr.185538.114 | YJM1592 | |
| Strain, strain background (S. cerevisiae) | YJM978 | Human, clinical, Strope et al., 2015 doi: 10.1101/gr.185538.114 | YJM978 | |
| Strain, strain background (S. cerevisiae) | YPS128 | Sniegowski et al., 2002. doi: 10.1111/j.1567–1364.2002.tb00048.x | YPS128 | |
| Strain, strain background (S. cerevisiae) | YPS163 | Sniegowski et al., 2002. doi: 10.1111/j.1567–1364.2002.tb00048.x | YPS163 | |
| Strain, strain background (S. cerevisiae) | YPS606 | Oak tree bark, Sniegowski et al., 2002. doi: 10.1111/j.1567–1364.2002.tb00048.x | YPS606 | |
| Antibody | Rabbit anti-GFP (Rabbit polyclonal) | Abcam | Abcam Cat# ab290, RRID:AB_303395 | (1:2000) |
| Antibody | Mouse anti-PGK1 (Mouse monoclonal) | Abcam | Abcam Cat# ab113687, RRID:AB_10861977 | (1:1000) |
| Recombinant DNA reagent | Moby 2.0 yeast gene overexpression library | Magtanong et al., 2011. doi: 10.1038/nbt.1855 | ||
| Recombinant DNA reagent | pPKI | Hose et al., 2020 DOI: 10.7554/eLife.52063 | AGB185 | CEN plasmid with the natMX selection marker |
| Recombinant DNA reagent | pJH2 | This study | AGB91 | pKI's NAT cassette was replaced with the KAN cassette |
| Recombinant DNA reagent | pJH3 | This study | AGB92 | GFP was digested out of pJH2 to obtain pJH3; this was used as the CEN empty vector control |
| Recombinant DNA reagent | pJH2_TEFprom-GFP-ADH1term | This study | In BY4741 under AGY1566 | pJH2 plasmid with TEF promoter and ADH1 terminator sewn together with GFP |
| Recombinant DNA reagent | MoBY 2.0 Empty Vector Control | Magtanong et al., 2011. doi: 10.1038/nbt.1855 | AGB181 | |
| Recombinant DNA reagent | ERG26Δ | This study | AGY1672 | Strain expressing plasmid from Moby 2.0 with ERG26 coding sequence deleted |
| Recombinant DNA reagent | ERG26 M* | This study | AGY1673 | Strain expressing ERG26 plasmid from Moby 2.0 with start codon replaced with a stop codon |
| Recombinant DNA reagent | LOC1Δ | This study | AGY1674 | Strain expressing plasmid from Moby 2.0 with LOC1 coding sequence deleted |
| Recombinant DNA reagent | LOC1 M* | This study | AGY1675 | Strain expressing LOC1 plasmid from Moby 2.0 with start codon replaced with a stop codon |
| Chemical compound, drug | G418 (G-418 Disulfate) | RPI | RPI SKU G64000 | CAS #108321-42-2 |
Additional files
-
Supplementary file 1
Strains used in this study.
- https://cdn.elifesciences.org/articles/70564/elife-70564-supp1-v2.xlsx
-
Supplementary file 2
Translation-related genes.
Genes annotated as involved in translation that were removed from analysis, where indicated in the text.
- https://cdn.elifesciences.org/articles/70564/elife-70564-supp2-v2.xlsx
-
Supplementary file 3
Primers used for quantitative PCR to measure plasmid abundances.
- https://cdn.elifesciences.org/articles/70564/elife-70564-supp3-v2.xlsx
-
Supplementary file 4
Moby Fitness Scores and gene lists.
Tab 1: Unnormalized read counts for each strain. Tab 2: Library-size normalized and scaled read counts for each strain, see Materials and methods. Tab 3: Average (log2) change in fitness and Benjamini and Hochberg-corrected FDR as outputted by edgeR, without data imputation. Tab 4: Average (log2) change in fitness and Benjamini and Hochberg-corrected FDR as outputted by edgeR, using data in which some ratios had been imputed, see Methods for details. Tab 5: List of commonly deleterious genes. Tab 6: Strain-specific deleterious genes for each strain. Tab 7: Strain-specific beneficial genes for each strain.
- https://cdn.elifesciences.org/articles/70564/elife-70564-supp4-v2.xlsx
-
Supplementary file 5
RNA-seq read counts.
Tab 1: Unnormalized reads counts per gene as outputted by HT-Seq. Tab 2: Average log2(expression ratio) comparing indicated strain versus the mean of all strains, followed by the FDR value, as outputted by edgeR and for each strain.
- https://cdn.elifesciences.org/articles/70564/elife-70564-supp5-v2.xlsx
-
Supplementary file 6
Moby Functional Enrichments.
Enrichments for commonly deleterious genes or strain-specific genes, as indicated in each tab title. Quantitative data were scored by Wilcoxon rank-sum tests and categorical data were scored by Hypergeometric test, as described in the Materials and methods. Each column indicates the category, enrichment p-value(s), and either Bonferroni corrected p-value (p/number of tests) or the significance score (1=FDR<0.05, 0=FDR>0.05) using Benjamini and Hochberg ranking.
- https://cdn.elifesciences.org/articles/70564/elife-70564-supp6-v2.xlsx
-
Supplementary file 7
RNA-Seq functional enrichments.
Functional enrichment of differentially expressed (d.e.) genes in each strain using Hypergeometric tests. Overlap between the query cluster and comparison cluster of GO and compiled categories is indicated with various p-values from Hypergeometric tests.
- https://cdn.elifesciences.org/articles/70564/elife-70564-supp7-v2.xlsx
-
Supplementary file 8
Background gene sets used for statistical tests.
Tab 1: List of Moby genes measured in all three replications at generation 0 in at least one strain, minus the set of 431 common genes. This list was used as the background data set for Wilcoxon rank-sum tests analyzing common genes. Tab 2: List of Moby genes with no effect (FDR>0.1) in each strain, used for Wilcoxon rank-sum tests of strain-specific genes. Tab 3: List of Moby genes significant in at least one strain (FDR<0.05), used for Hypergeometric enrichment tests analyzing common genes. Tab 4: List of Moby genes significant in at least one strain (FDR<0.05) excluding the 431 common genes, used for Hypergeometric tests for strain-specific genes.
- https://cdn.elifesciences.org/articles/70564/elife-70564-supp8-v2.xlsx
-
Transparent reporting form
- https://cdn.elifesciences.org/articles/70564/elife-70564-transrepform-v2.docx
Download links
A two-part list of links to download the article, or parts of the article, in various formats.
Downloads (link to download the article as PDF)
Open citations (links to open the citations from this article in various online reference manager services)
Cite this article (links to download the citations from this article in formats compatible with various reference manager tools)
Natural variation in the consequences of gene overexpression and its implications for evolutionary trajectories
eLife 10:e70564.
https://doi.org/10.7554/eLife.70564


