Deletion of Calsyntenin-3, an atypical cadherin, suppresses inhibitory synapses but increases excitatory parallel-fiber synapses in cerebellum
- Department of Molecular and Cellular Physiology, Stanford University, United States
- Howard Hughes Medical Institute, Stanford University, United States
- Department of Brain Sciences, Daegu Gyeongbuk Institute of Science and Technology, Republic of Korea
Figures
Figure 1 with 1 supplement
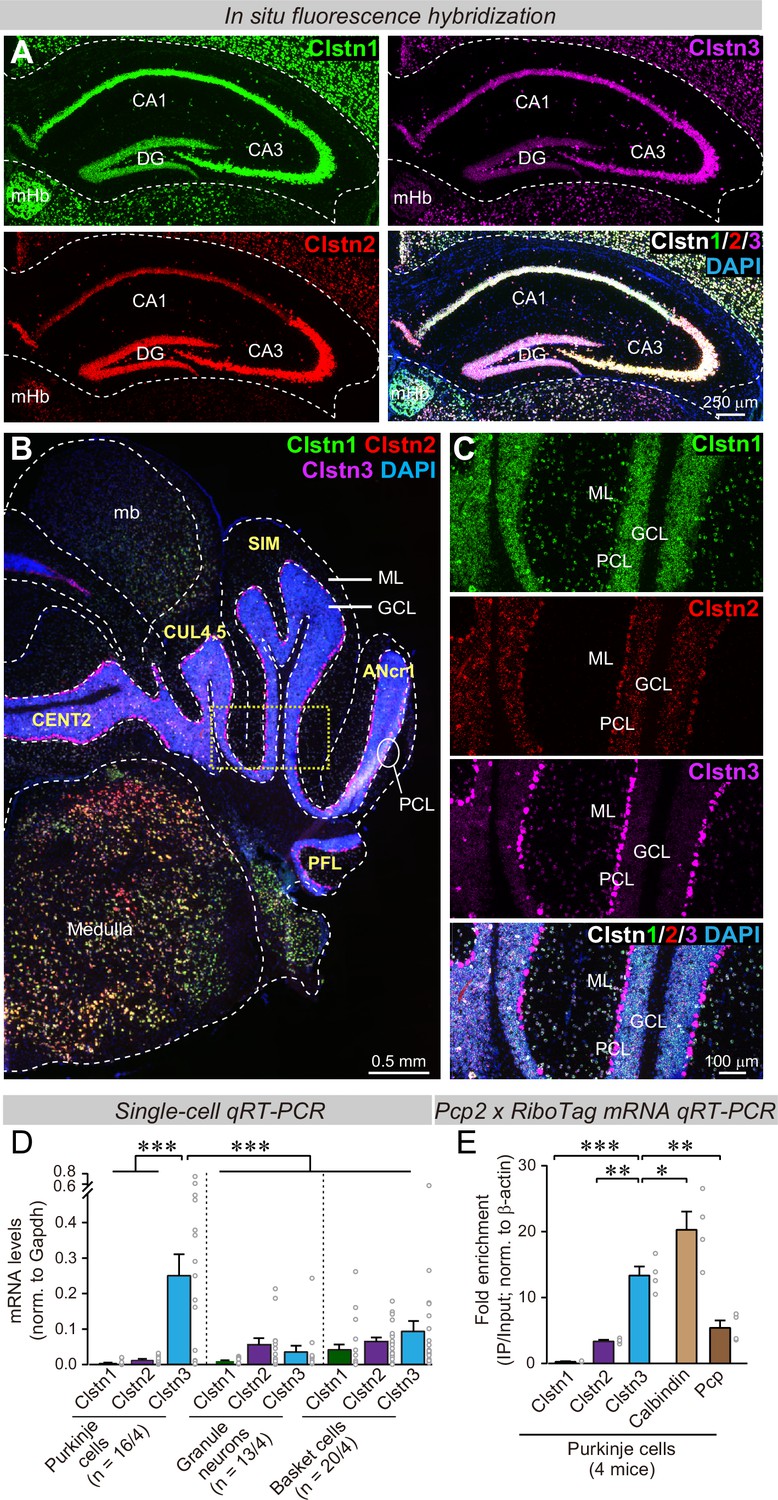
Clstn1, Clstn2, and Clstn3 are co-expressed in overlapping neuronal populations in the mouse hippocampus, but are largely expressed in separate neuronal populations in the mouse cerebellum.
(A) Single-molecule in situ fluorescent hybridization (RNAscope) reveals that Clstn1, Clstn2 and Clstn3 exhibit largely overlapping expression patterns in the dorsal hippocampus. Representative images show sections from a mouse at P30 labeled with probes to Clstn1 (green), Clstn2 (red), and Clstn3 (magenta) and with DAPI (blue) as indicated (DG, dentate gyrus; CA1 and CA3, CA1- and CA3-regions of the hippocampus proper; mHb, medial habenula). (B & C) Different from the hippocampus, Clstn1 (green), Clstn2 (red), and Clstn3 (magenta) exhibit largely distinct, non-overlapping expression patterns in the cerebellum as visualized by single-molecule in situ hybridization (B, overview; C, expanded views of the area boxed in B; Mb, midbrain; ML, molecular layer; PCL, Purkinje cell layer; GCL, granule cell layer). Scale bars apply to all images in a set. (D) Single-cell qRT-PCR demonstrates that Purkinje cells uniquely express high levels of Clstn3 mRNAs. The cytosol of singe Purkinje, granule and basket cells in acute cerebellar slices from wild-type mice (n = 4 mice; number of cells are indicated in the graph) was aspirated via a glass pipette and subjected to qRT-PCR with primers validated in Figure 1—figure supplement 1B. mRNA levels were normalized to those of Gapdh using threshold cycle values (Ct). (E) Analyses of ribosome-associated mRNAs isolated from Purkinje cells confirms enrichment of Clstn3 expression in Purkinje cells. Ribosome-associated mRNAs were immunoprecipitated using HA-antibodies from the cerebellum of RiboTag mice that had been crossed with Pcp2-Cre mice. mRNA levels of Clstn1, Clstn2, Clstn3, Calbindin, and Pcp (Purkinje cell protein-2) were measured using qRT-PCR and normalized to the internal control of β-actin using threshold cycle values (Ct). Samples were from 4 mice. Data in D and E are means ± SEM. Statistical analyses were performed using one-way ANOVA and post-hoc Tukey tests for multiple comparisons. For D, F(8, 138) = 8.786, p < 0.000. ***denotes p < 0.001. For E, F(4,15)=33.065, p < 0.000. *denotes p < 0.05, **denotes p < 0.01, ***denotes p < 0.001.
Figure 1—figure supplement 1
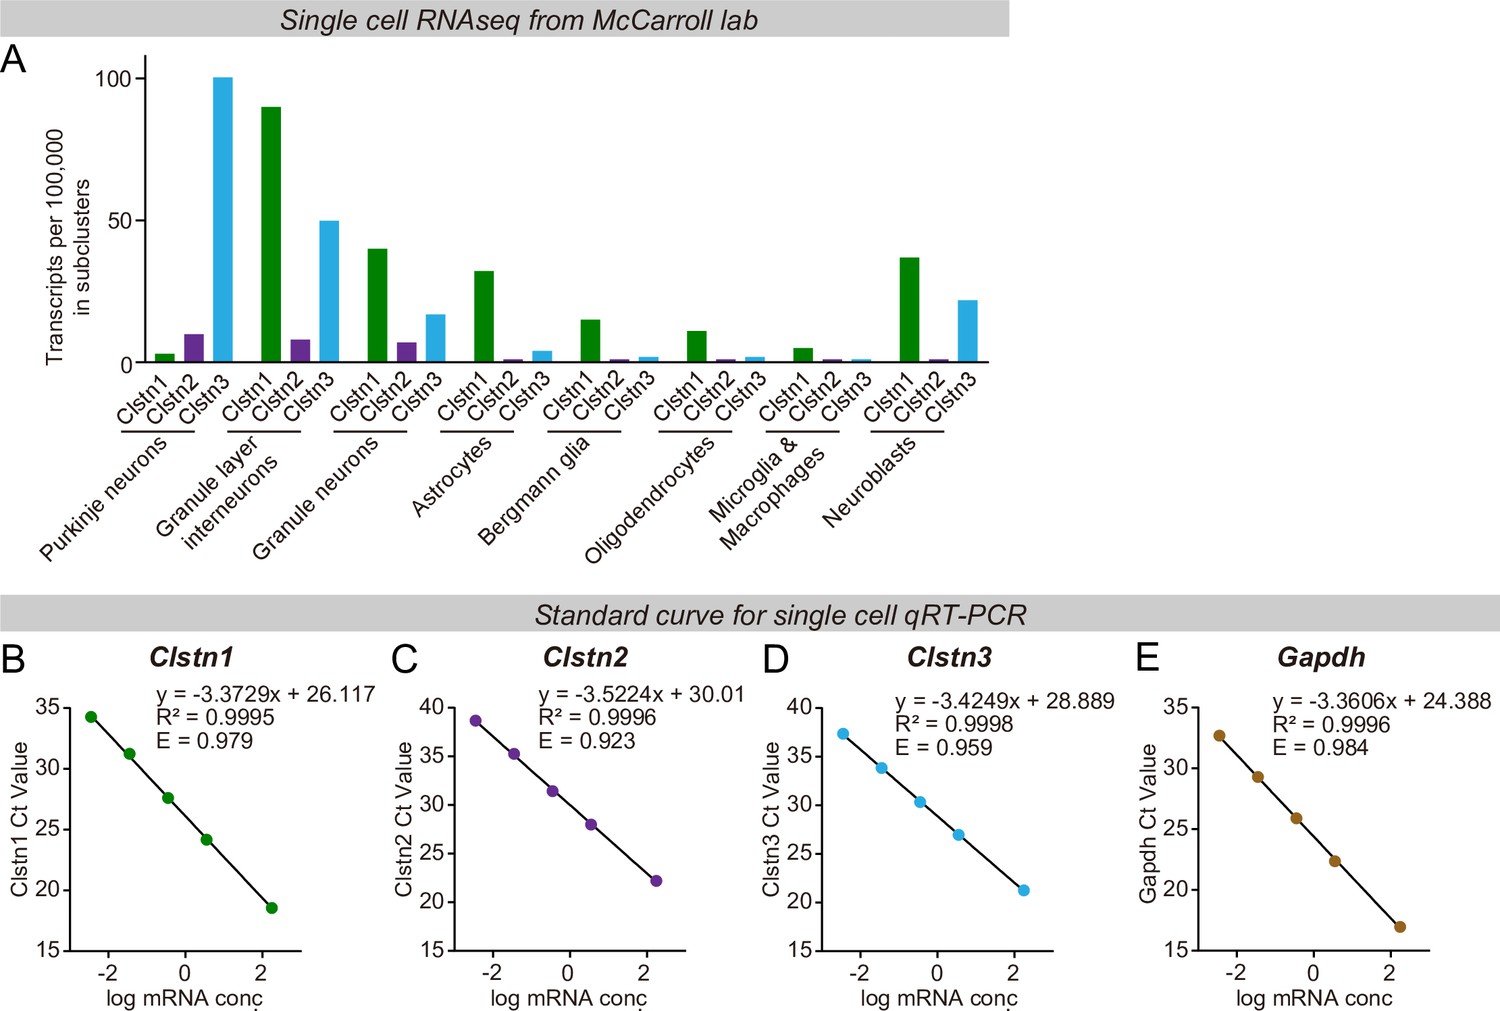
Unbiased single-cell RNAseq analyses demonstrate that most Clstn3 in the cerebellum is expressed in Purkinje cells, which in turn express little Clstn1 or Clstn2, whereas other cells in cerebellum primarily express other calsyntenins (A), and validation of the qRT-PCR primers using standard curves to ensure that the qRT-PCR measurements are reliable (B-E, Clstn1, Clstn2, Clstn3, and Gapdh).
(A)Clstn1, Clstn2, and Clstn3 mRNA levels measured by single-cell RNAseq in the indicated cell types. Plotted values were derived by analysis of the RNAseq data published from the McCarroll lab (Saunders et al., 2018). (B–E) Validation of the qRT-PCR primers for the Clstn1, Clstn2, and Clstn3 mRNA level measurements (R2 and efficiency score are labeled in the relative panels).
Figure 2 with 2 supplements
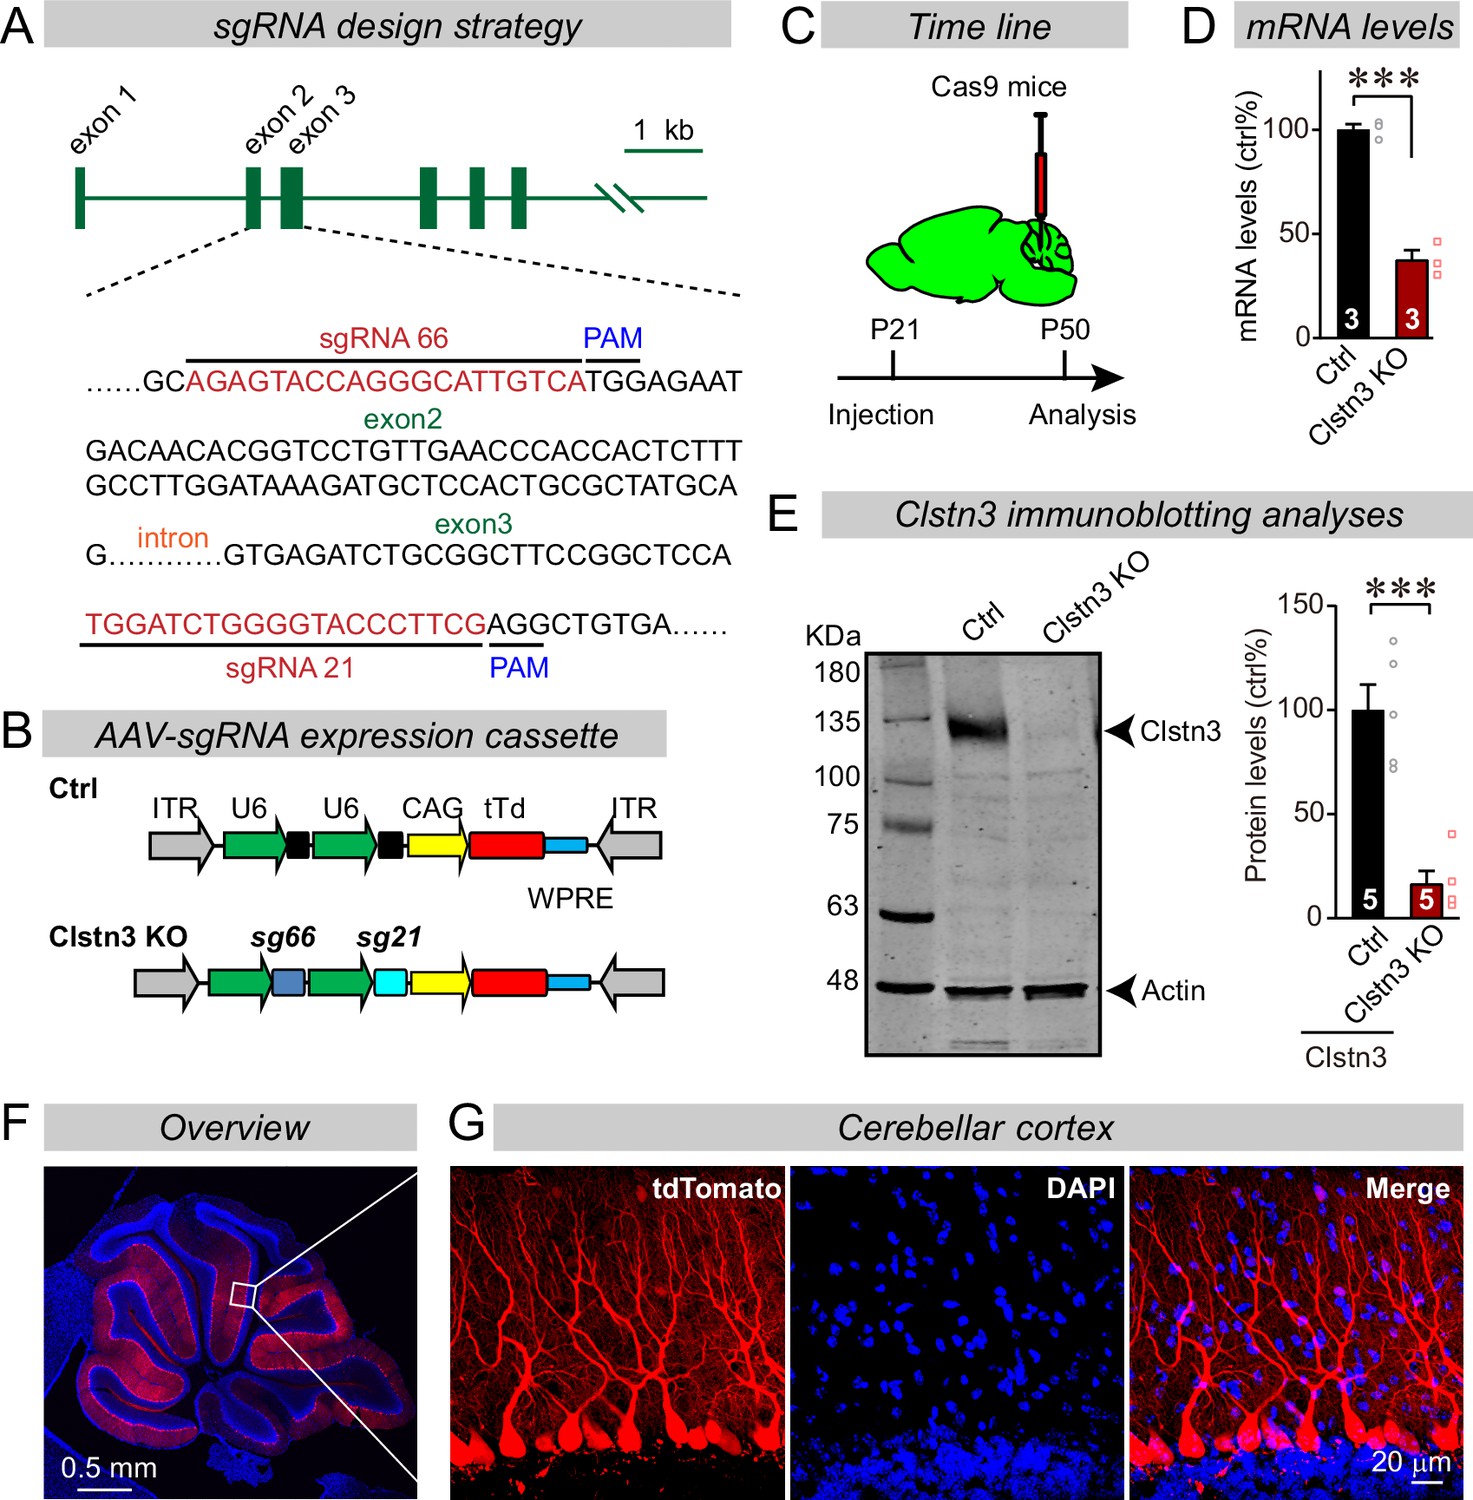
CRISPR/Cas9 manipulations enable rapid and highly efficient in vivo deletions of Clstn3 in Purkinje cells.
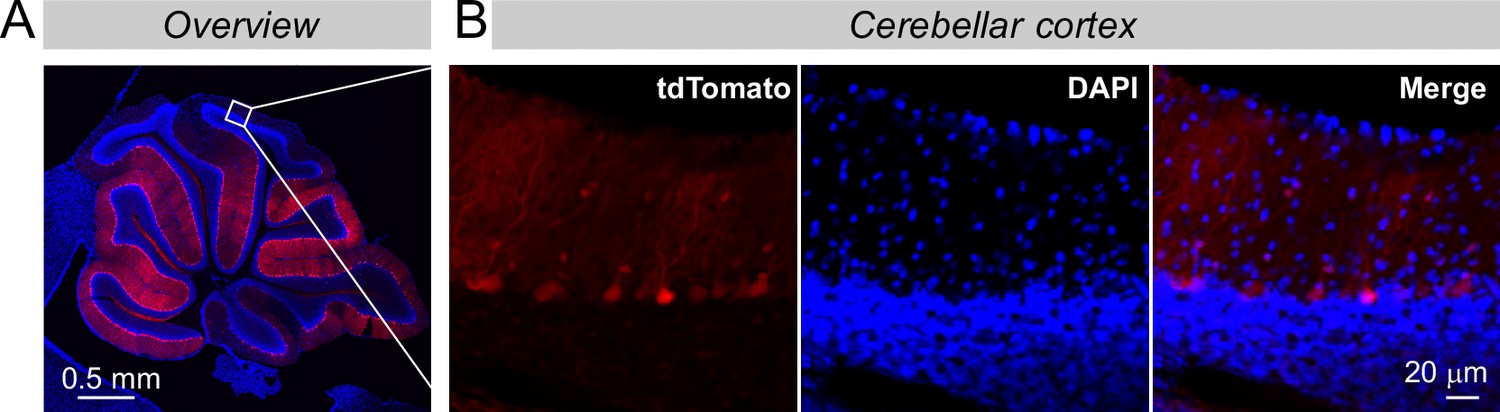
(A) Schematic of the sgRNA design strategy. Both sgRNAs target the positive strand of DNA, with sg66 targeting exon2, and sg21 targeting exon3. (B) Schematic of the AAV-DJ expression cassette in which sgRNAs and tdTomato (tdT) synthesis are driven by U6 and CAG promoters, respectively. Control mice were infected with AAVs that lacked sgRNAs but were otherwise identical. (C) Experimental strategy for CRISPR-mediated acute Clstn3 deletions in the cerebellum. AAVs expressing the sgRNAs and tdTomato were stereotactically injected into the cerebellum of constitutively expressing Cas9 mice at P21, and mice were analyzed after P50. (D) Quantitative RT-PCR shows that the CRISPR-mediated Clstn3 deletion severely suppresses Clstn3 mRNA levels in the total cerebellum. Relative gene expression levels were first normalized to GAPDH using threshold cycle (CT) values, and then normalized to control. (E) Immunoblotting analyses confirm that the CRISPR-mediated deletion greatly suppresses Clstn3 protein levels in the overall cerebellum (left, representative immunoblot; right, summary graph of quantifications using fluorescently labeled secondary antibodies). (F & G) Representative images of a sagittal cerebellar section from a mouse that was stereotactically infected with AAVs as described in C (F, overview of the cerebellum; G, cerebellar cortex; red = AAV-encoded tdTomato; blue, DAPI). Note that AAVs infect all Purkinje cells but few granule cells or inhibitory neurons. Data in panels D and E are means ± SEM. Statistical analyses were performed using double-tailed unpaired t-test for D and E (***p < 0.001). Numbers of animals for each experiment are indicated in the graphs.
Figure 2—figure supplement 1
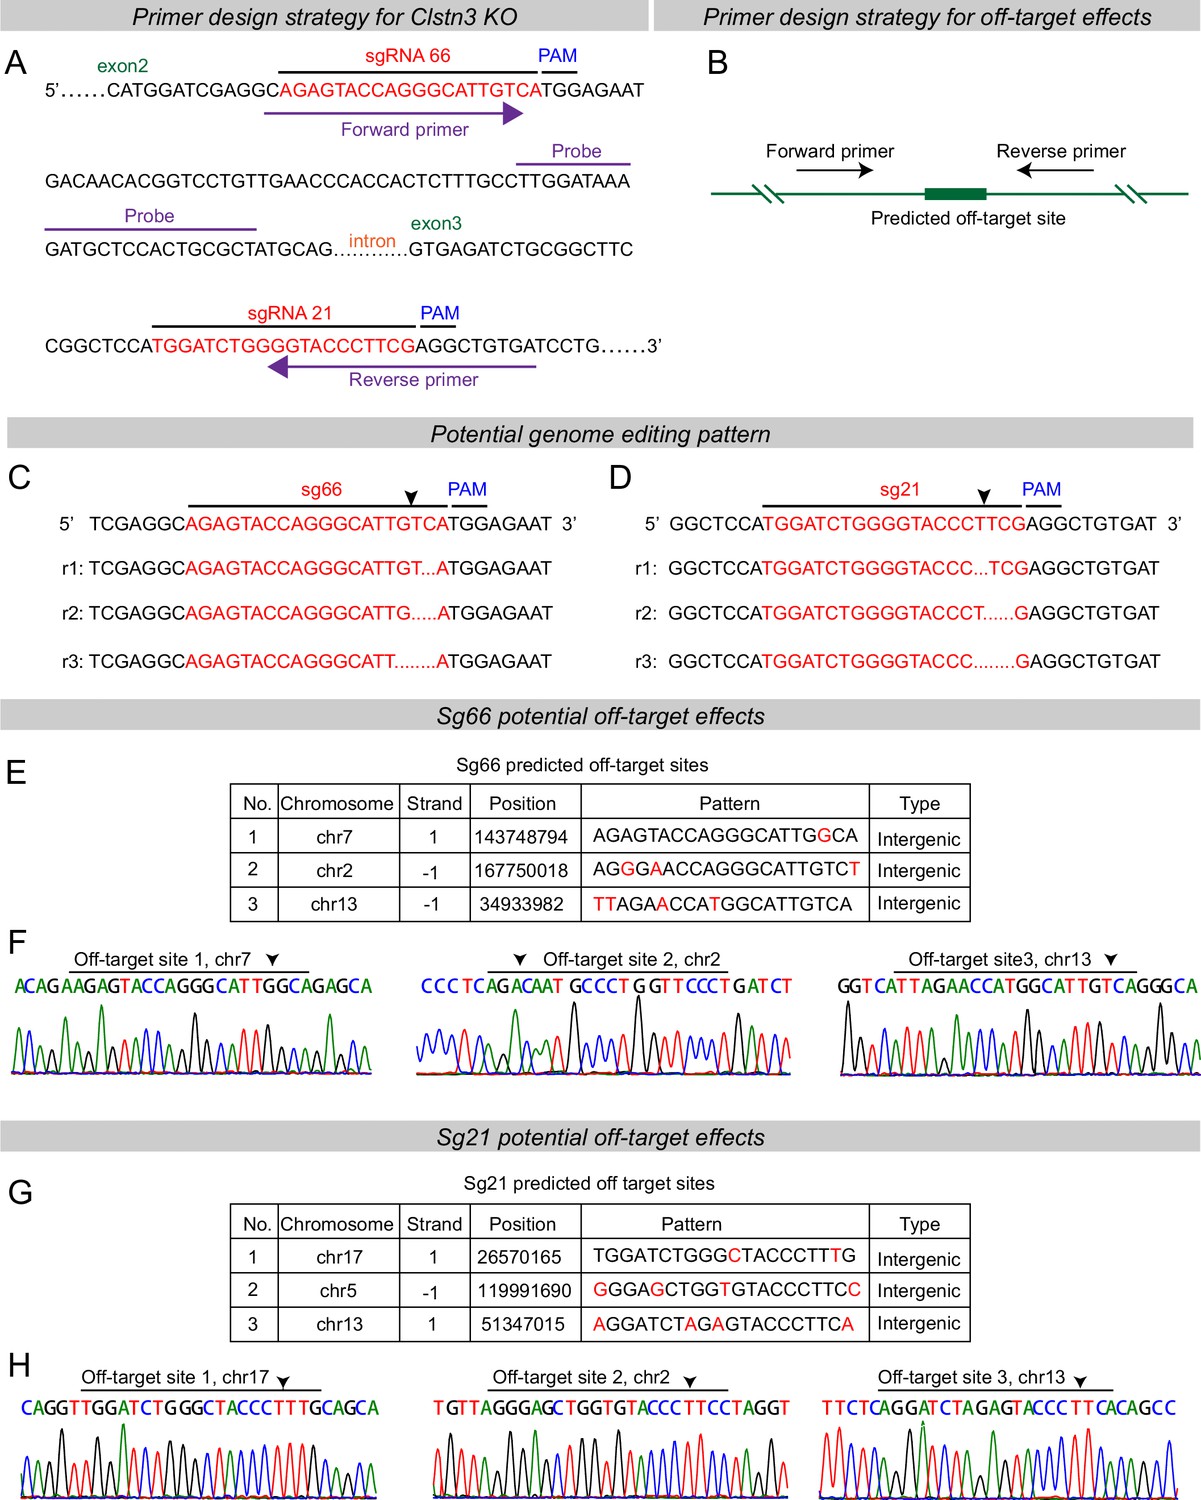
Predicted genome editing patterns by the sgRNAs used for the Clstn3 KO in the current study and analysis of potential off-target effects of the sgRNAs using genomic sequencing of targeted Clstn3 KO cerebellum.
(A & B) Primer design strategies for RT-qPCR detecting Clstn3 KO efficiency (A) and off-target effects (B). (C & D) Predicted genome editing effects for sg66 (A) and sg21 (B). (E & F) The three top-ranked potential off-target sites for sgRNA66 as identified by sequence predictions from the design website (https://zlab.bio/guide-design-resources) (C), and their analysis by genomic sequencing of Clstn3 KO cerebellum, demonstrating that CRISPR with sgRNA66 does not detectably mutant these three sites (D). Arrow indicates potential cutting positions. (G & H) Same as C and D, but for sgRNA21.
Figure 2—figure supplement 2
The more distal cortex of the cerebellum is also infected by the AAVs that were stereotactically injected, but the expression levels are lower like due to a lower virus titer in areas more distant to the injection site.
(A & B) Overview of the infected cerebellum (A) and zoomed-in images from more distal areas of the cerebellar cortex (B). These images complement those seen in Figure 2F to illustrate the weak but clearly detectable tdTomato expression even in the distal cerebellar cortex. Note that the tdTomato expression directly correlates with the viral load because tdTomato is encoded by the viruses directly and not produced by a Cre-dependent recombination event (see Figure 2B).
Figure 3
The CRISPR/Cas9-mediated deletion of Clstn3 in cerebellum impairs motor learning and gait performance.
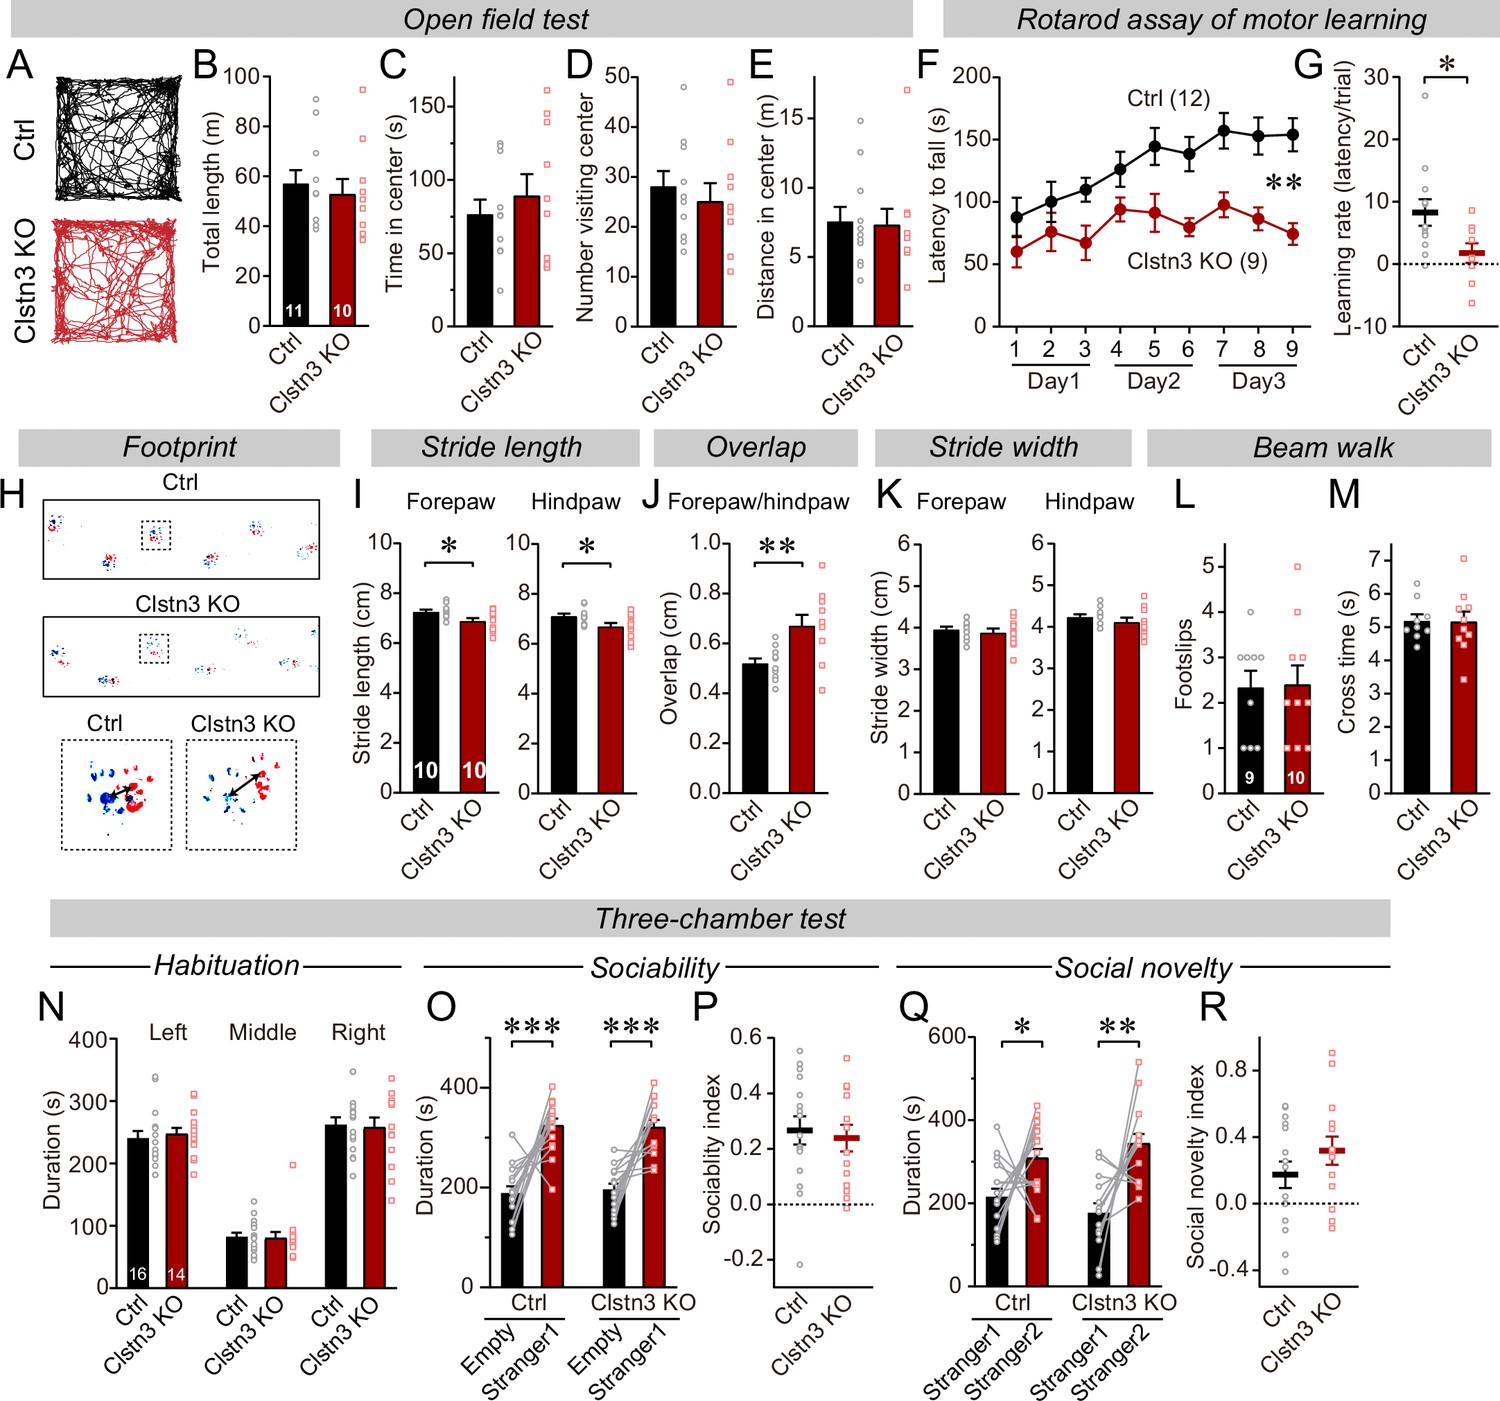
(A–E) The CRISPR-mediated Clsn3 KO had no effects on the open field behaviors. (A, representative tracks for both control and Clstn3 KO; B, total length travelled (m); C, time spent in center; D, number of the mice visiting center; E, distance in center). (F & G) The CRISPR-mediated Clstn3 KO in the cerebellum severely impairs motor learning as analyzed by the rotarod assay (F, rotarod learning curve; G, slope of rotarod curve used as an index of the learning rate). (H–K) Clstn3 deletion significantly impaired gait performance. (H, upper images are representative footprints from both control and Clstn3 KO group, the lower shows footprints of forepaw and hindpaw placements; I, stride length of forepaw and hindpaw from both control and Clstn3 KO groups; J, distance between the center of forepaw and hindpaws; K, stride width of forepaw and hindpaw from both groups). (L & M) Beam walk test reveal no difference between the control group and the Clstn3 KO group. (L, footslips; M, cross times).(N–R) CRISPR deletion of Clstn3 in the cerebellum in vivo does not affect social behaviors. (N, control and Clstn3 KO mice exhibited the same exploration behavior of the left and right chambers during the habituation period O and P, test mice were exposed to a non-familiar ‘stranger’ mouse in one of the outer chambers O, the time that the test mouse spent in the chambers with empty cup or ‘stranger1’ mouse; P, sociability index). Q & R, test mice were given the choice between exploring a ‘stranger 1’ mouse to which it was previously exposed, or a ‘stranger 2’ mouse that is novel, both control and cerebellar Clstn3 KO mice prefer the novel mouse for interactions (Q, the same as O, except empty cup has ‘stranger2’; R, social novelty index). All data are means ± SEM. Statistical analyses were performed using double-tailed and unpaired t-test for panels B-E, G, I-M, N, P, and R. Double-tailed paired t-tests were applied to analyze panel O and Q, *p < 0.05, **p < 0.01, ***p < 0.001. Repeat-measures ANOVA was applied for rotarod curve in panel F (F(1, 19) = 11.791, **p < 0.01). Numbers of animals for each experiment are indicated in graphs.
Figure 4
The Clstn3 KO decreases inhibitory synapse numbers in the cerebellar cortex as revealed by immunocytochemistry for pre- and post-synaptic markers.
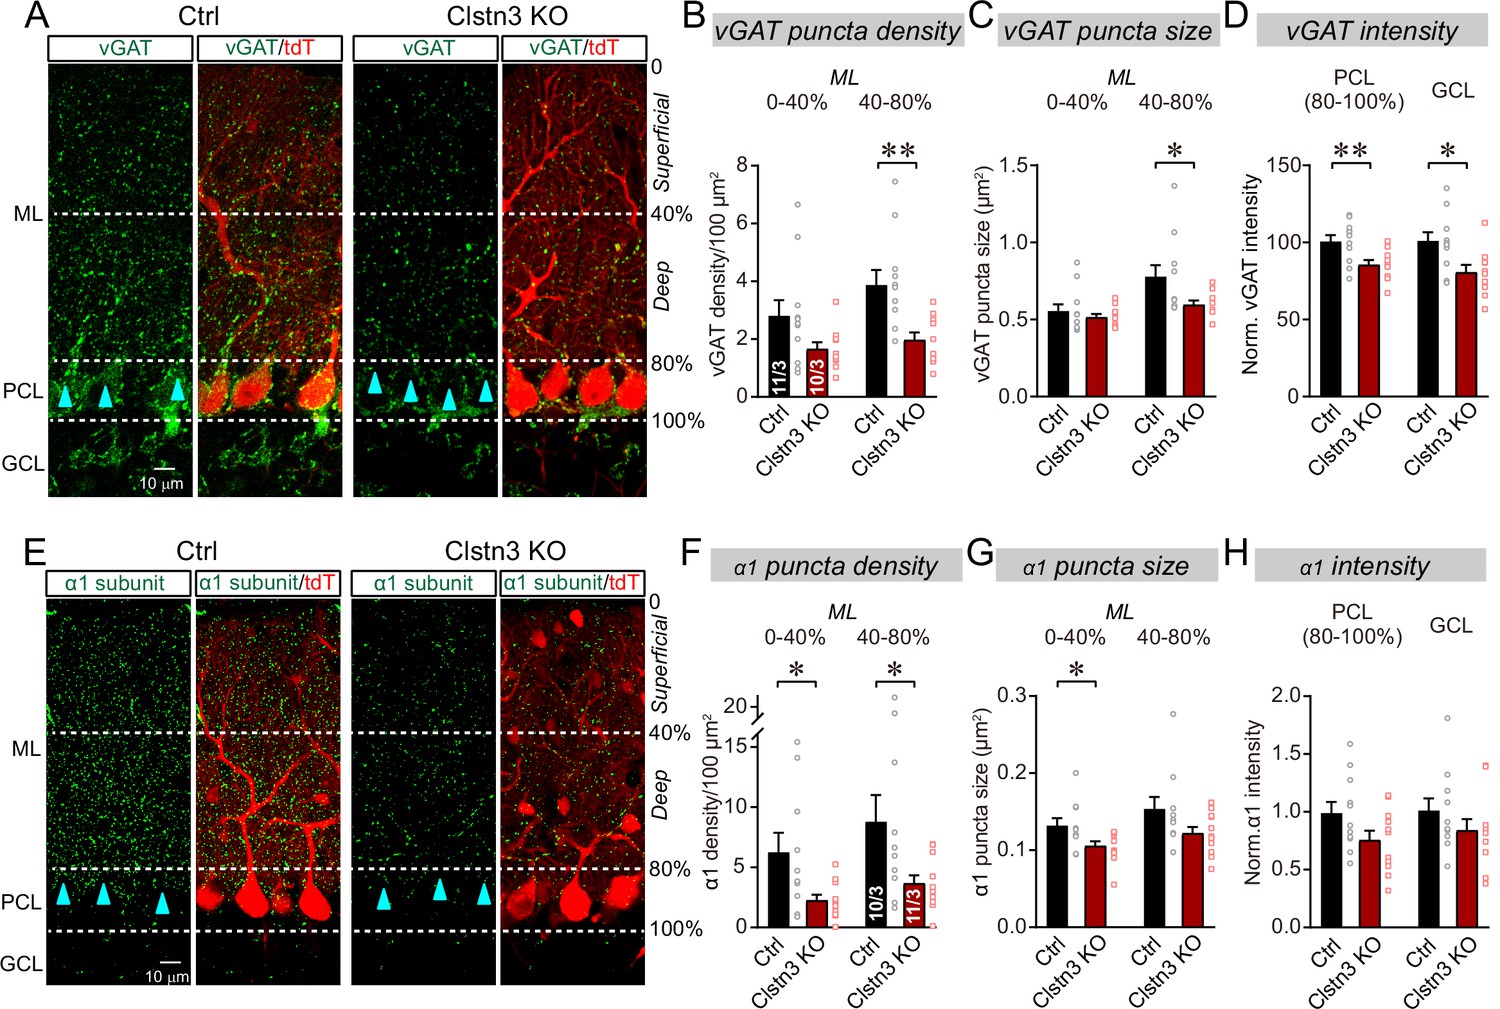
(A) Representative confocal images of cerebellar cortex sections imaged for presynaptic vGAT and for tdTomato. Sections are from mice in which the cerebellar cortex was infected with control AAVs (Ctrl) or AAVs that induce the CRISPR-mediated Clstn3 KO (green, vGAT; red, AAV-encoded tdTomato signal; ML, molecular layer; PCL, Purkinje cell layer; GCL, granule cell layer). Calibration bar applies to all images. (B–D) Quantifications of vGAT-positive synaptic puncta demonstrating that the Clstn3 KO suppresses the number of inhibitory synapses in the cerebellar cortex (B and C, density and size of vGAT-positive puncta in the molecular layer (ML) of the cerebellar cortex (separated into deep (40–80%) and superficial areas (0–14%)); D, vGAT-staining intensity in the Purkinje cell layer (PCL) and granule cell layer (GCL) of the cerebellar cortex as a proxy of synapse density since individual vGAT-positive puncta cannot be resolved in these layers). (E) Representative confocal images of cerebellar cortex sections imaged for postsynaptic GABA-Aα1 receptor subunits and for tdTomato (green, GABA-Aα1 receptor subunit; red, AAV-encoded tdTomato signal; labeling is the same as in A). (F–H) Quantifications of GABA-Aα1 receptor-positive synaptic puncta independently confirmed that the Clstn3 KO suppresses the number of inhibitory synapses in the cerebellar cortex (F-H are the same as B-D, but for GABA-Aα1 receptor staining instead of vGAT staining). Data are means ± SEM (numbers of sections/mice analyzed are indicated in bar graphs). Statistical analyses were performed using two tailed unpaired t-tests, with *p < 0.05, **p < 0.01.
Figure 5 with 2 supplements
The Clstn3 KO decreases spontaneous inhibitory synaptic ‘mini’ events in Purkinje cells.
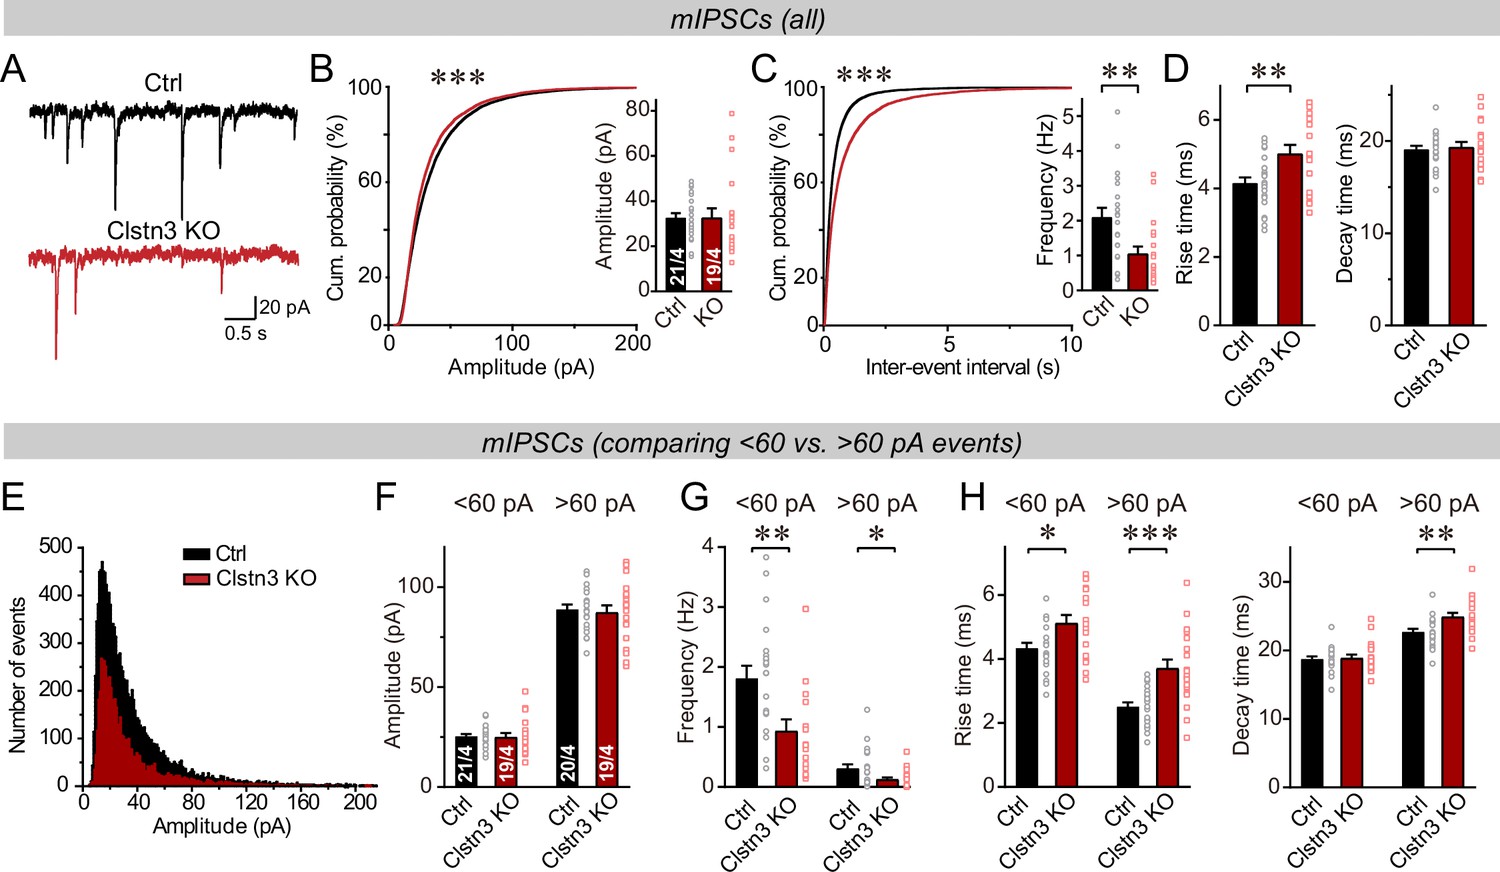
(A–C) The Clstn3 KO decreases the frequency but not the amplitude of mIPSCs (A, representative traces; B, left, cumulative probability plot of the mIPSC amplitude right, average amplitude; C, left, cumulative probability plot of the mIPSC inter-event interval right, average frequency). (D) The Clstn3 KO increases the rise but not decay times of mIPSCs. (E) Plot of the number of mIPSC events vs. amplitude exhibiting a normal distribution. (F–H) The Clstn3 KO similarly impairs mIPSCs with a larger ( > 60 pA) and a smaller amplitude ( < 60 pA), which in Purkinje cells are likely generated primarily by basket cell and stellate cell synapses, respectively (F & G, summary graphs for the mIPSC amplitude [F] and frequency [G] separately analyzed for high- and low-amplitude events; H, mIPSC rise [left] and decay times [right], separately analyzed for high- and low-amplitude events). All summary data are means ± SEM. Numbers of cells/mice analyzed are indicated in bar graphs. Statistical analyses were performed using unpaired t-tests (bar graphs with two groups) or Kolmogorov-Smirnov test (cumulative analysis), with *p < 0.05, **p < 0.01, ***p < 0.001.
Figure 5—figure supplement 1
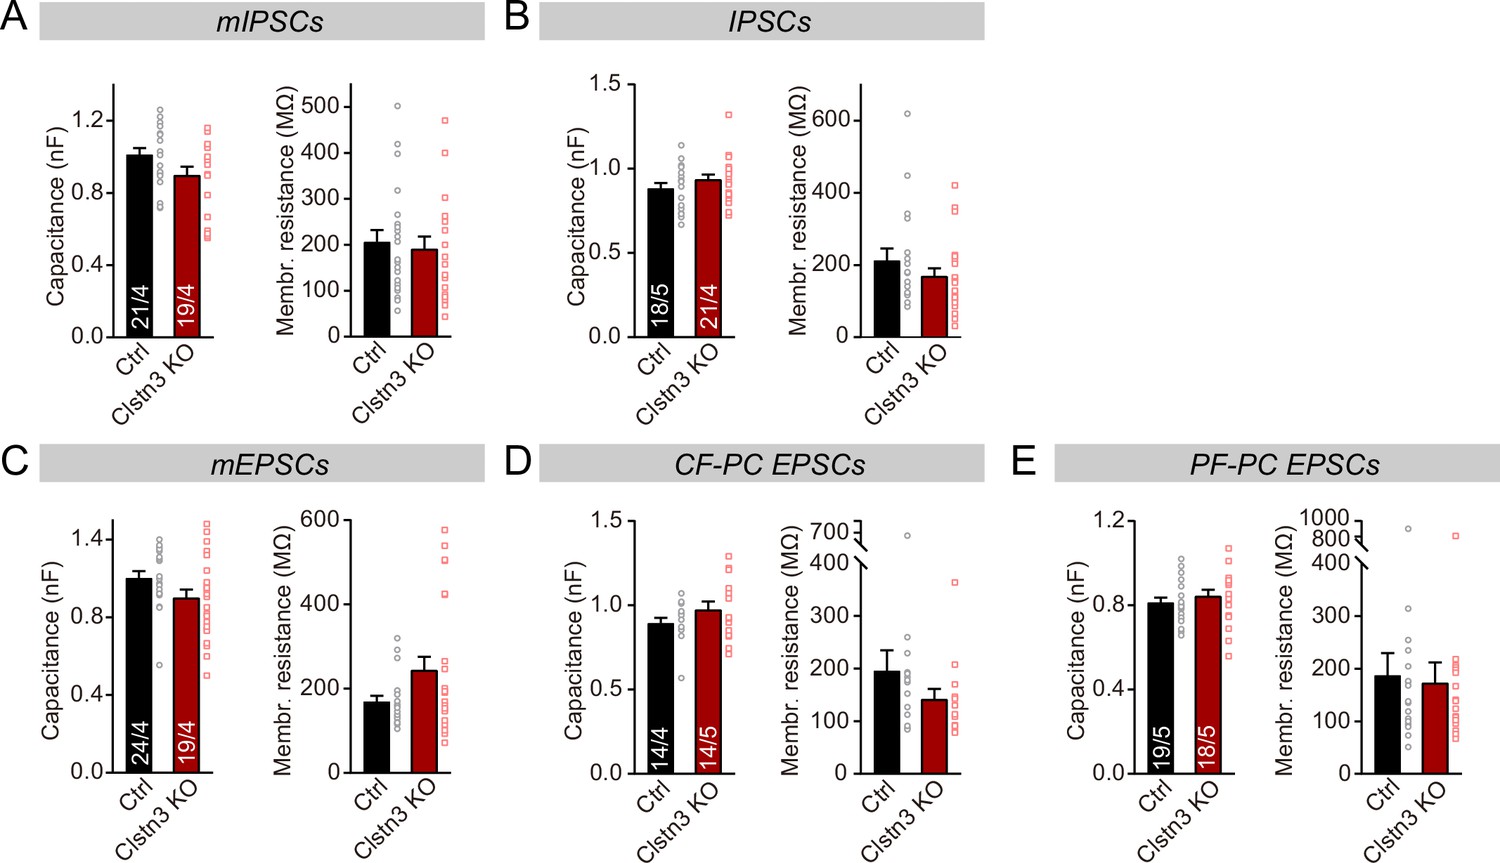
The capacitance and membrane resistance of Purkinje cells are unaffected by the Clstn3 KO.
Figure 5—figure supplement 2
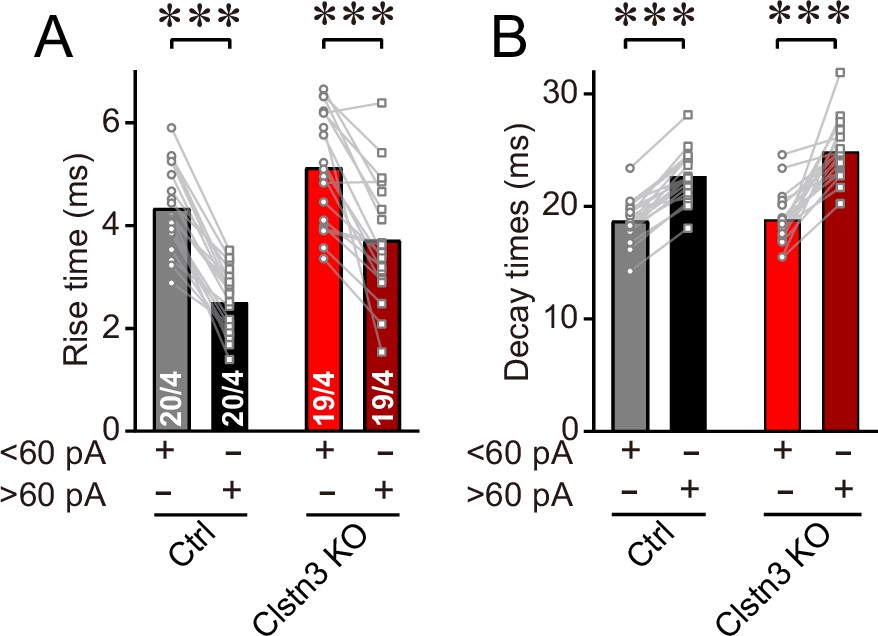
Analysis of the kinetics of large ( > 60 pA) and smaller ( < 60 pA) mIPSCs confirm that larger mIPSCs, which are presumably generated by basket-cell synapses closer to the soma, have faster rise but slower decay times.
(A & B) Rise (A) and decay times (B) of large and smaller mIPSCs examined in the same Purkinje cells. All data are means ± SEM. Statistical analyses were performed with paired t-test, ***p < 0.001.
Figure 6
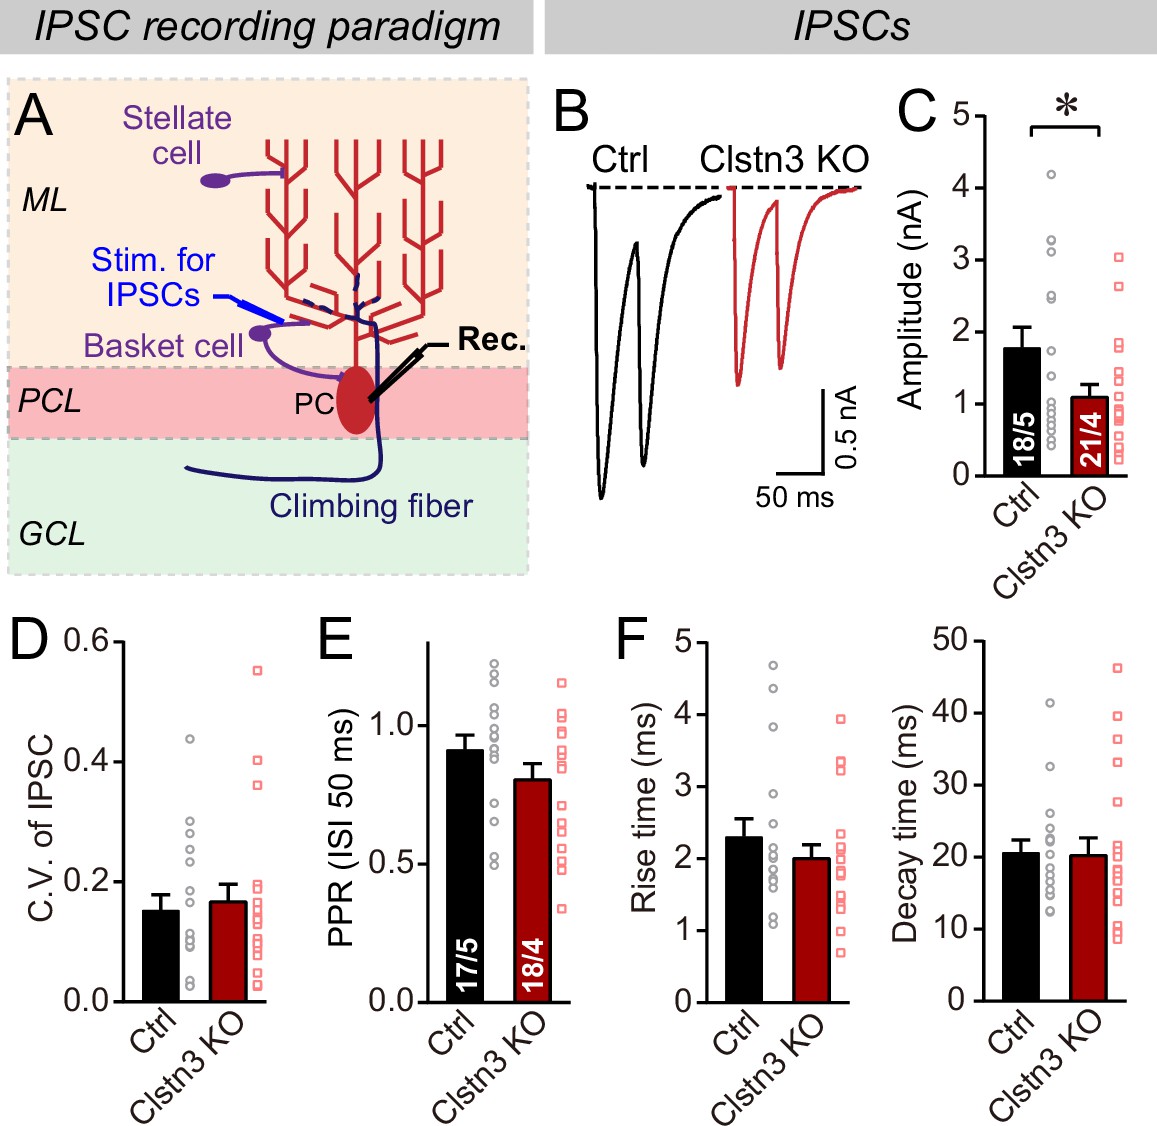
The Clstn3 KO decreases evoked inhibitory synaptic responses in Purkinje cells.
(A) Experimental design for recordings of IPSCs evoked by stimulation of basket cell axons (ML, molecular layer; PCL, Purkinje cell layer; GCL, granule cell layer; PC, Purkinje cell; Rec., recording patch pipette). (B & C) The Clstn3 KO decreases the amplitude of evoked basket-cell IPSCs (B, representative traces of pairs of evoked IPSCs with a 50ms inter-stimulus interval; (C) summary graphs of the amplitude of the first IPSC). (D & E) The Clstn3 KO in Purkinje cells does not affect the release probability at inhibitory synapses as judged by the coefficient of variation (D) and the paired-pulse ratio with an interstimulus interval of 50ms (E) of evoked IPSCs. (F) The Clstn3 KO in Purkinje cells has no significant effect on IPSC kinetics (left, rise times; right, decay times of evoked ISPCs). All summary data are means ± SEM. Numbers of cells/mice analyzed are indicated in bar graphs. Statistical analyses were performed using unpaired t-tests, with *p < 0.05.
Figure 7

CRISPR-mediated Clstn3 deletion in the cerebellar cortex increases parallel-fiber excitatory synapse numbers without changing climbing-fiber synapse numbers.
(A & B) Immunostaining of cerebellar cortex sections an with antibody to vGluT1 as a presynaptic marker for parallel-fiber synapses reveals a significant increase (A, representative confocal images from control and Clstn3 KO mice [green vGluT1; red, tdTomato]; (B) summary graphs of the vGluT1 staining intensity in the superficial (0–40%) and deep (40–80%) molecular layers of the cerebellar cortex). Note that the staining intensity is used as a proxy for synapse density since individual parallel-fiber synapse puncta cannot be resolved. (C & D) Immunostaining with an antibody to GluA2 as a postsynaptic marker for parallel-fiber synapses confirms the robust increase in parallel-fiber synapse abundance observed with vGluT1 staining (E, representative confocal images from control and Clstn3 KO mice [green, GluA2; red, tdTomato]; F, summary graphs of the GluA2 staining intensity in the superficial (0–40%) and deep (40–80%) molecular layers of the cerebellar cortex). (E & F) Immunostaining with antibody to GluA1, an astroglial marker for tripartite parallel-fiber synapses containing Bergmann glia processes, also uncovers a significant increase in staining intensity (C, representative confocal images from control and Clstn3 KO samples [green vGluT1; red, tdTomato]; (D) summary graphs of the GluA1 staining intensity in the superficial (0–40%) and deep (40–80%) molecular layers of the cerebellar cortex). (G–I) Immunostaining for vGluT2 as a marker for climbing-fiber synapses in cerebellar cortex fails to detect a Clstn3 KO-induced change (G, representative confocal images [green, vGluT2; red, tdTomato]; (H & I) summary graphs of the density (H) and size (I) of vGluT2-positive synaptic puncta in the superficial (0–40%) and deep (40–80%) molecular layers of the cerebellar cortex). All numerical data are means ± SEM; numbers of sections/mice analyzed are indicated in the first bar graphs for each experiment. Statistical significance was assessed by unpaired Student’s t-test (*p < 0.05, **p < 0.01, ***p < 0.001).
Figure 8 with 1 supplement
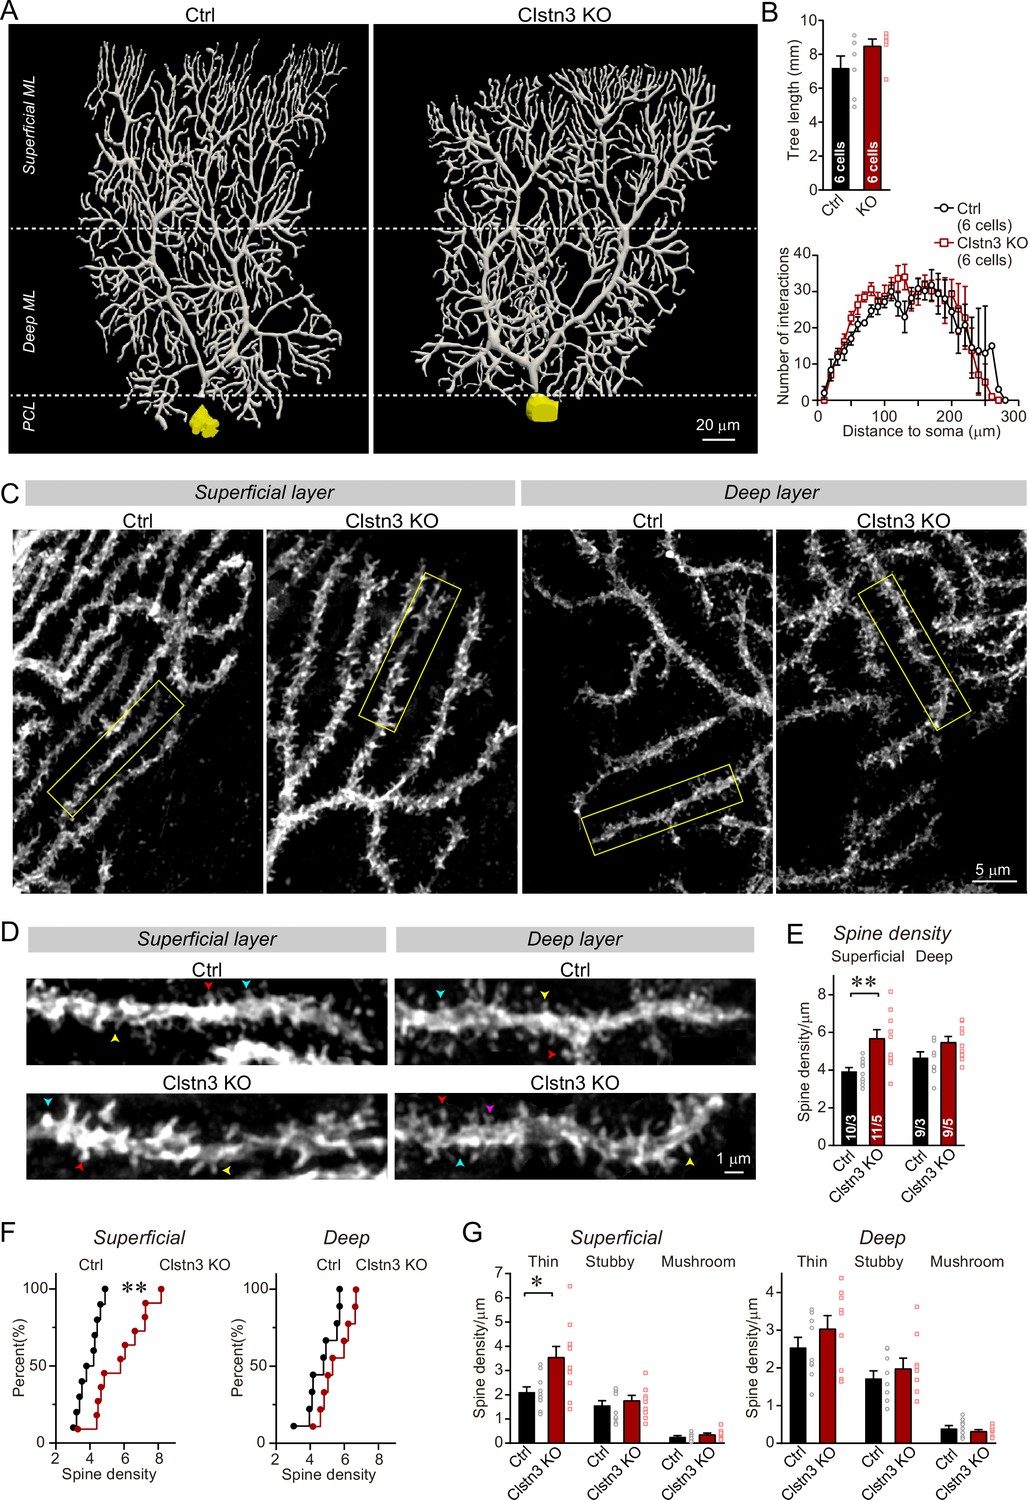
Morphological analysis of individual Purkinje cells reveals that the Clstn3 KO robustly increases the dendritic spine density of Purkinje cells without significantly altering their dendritic arborization.
(A & B) Biocytin filling of individual Purkinje cells via a patch pipette demonstrates that the Clstn3 KO does not significantly change the overall dendritic architecture of Purkinje cells (A, representative images of Purkinje cell dendritic trees for control and Clstn3 KO mice after 3D reconstruction [for more images, see , Figure 8—figure supplement 1]; B, quantifications of the dendritic tree length [top] or dendritic arborization using Scholl analysis [bottom]). (C–F) The Clstn3 KO increases the density of dendritic spines of Purkinje cells in the superficial part of the cerebellar cortex (C & D, representative images of spiny dendrites at low and high magnifications, respectively; [blue, red, and yellows arrowheads mark different spine types]; (E & F) summary graph [E] and cumulative distribution of the spine density [F]). (G) The Clstn3 KO in Purkinje cells increases preferentially the density of thin spines in the superficial part of the cerebellar cortex, based on a morphological classification of spine types into thin, stubby and mushroom spines. All data in B, E, and G are means ± SEM; 6 control and Clstn3 KO Purkinje cells were reconstructed for B; numbers in the first bars of E indicate the number of cell/animal analyzed for E-G. Statistical significance (*p < 0.05; **p < 0.01) in B and G was assessed by an unpaired t-test, and in E by one-way ANOVA (F(3, 35) = 5.693, p = 0.003), followed by Tukey’s post hoc comparisons for control and Clstn3 KO groups.
Figure 8—figure supplement 1
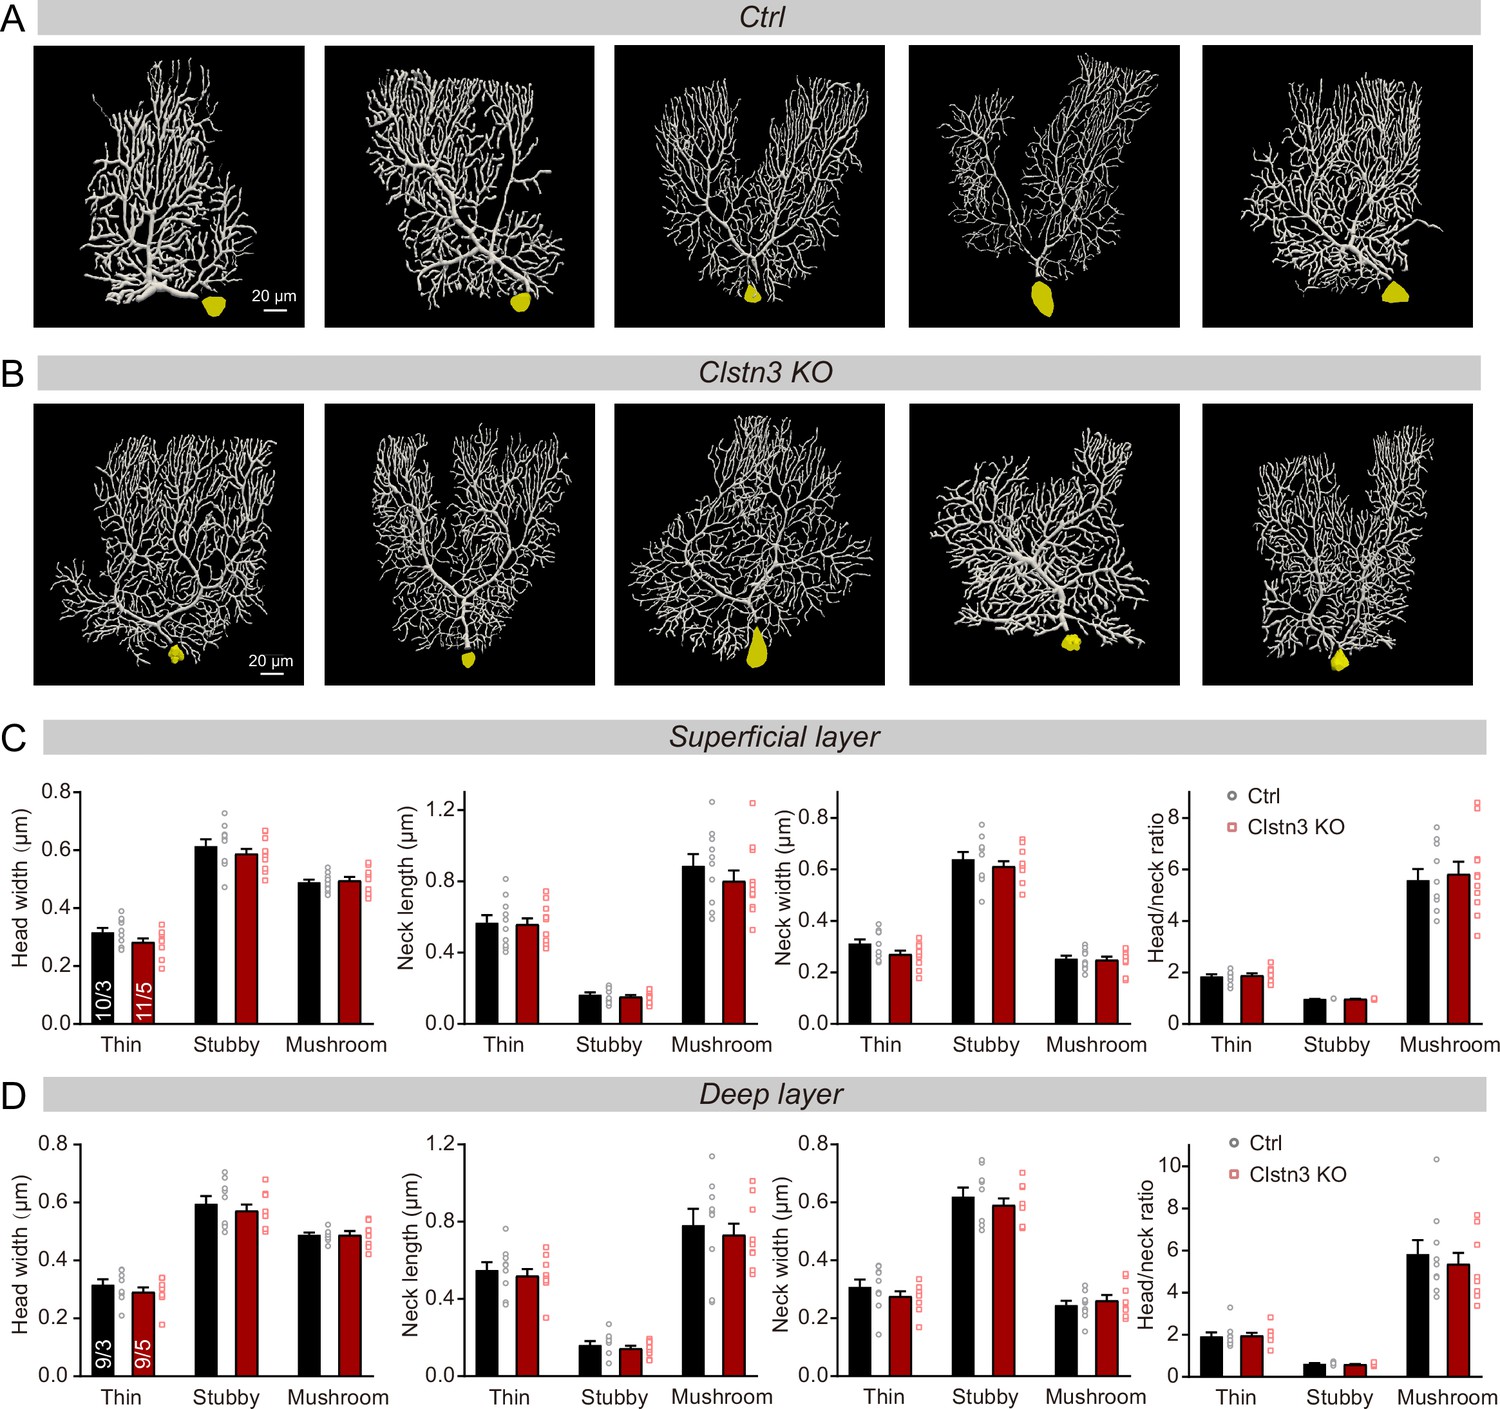
Images of individual reconstructed biocytin-filled Purkinje cells, and further quantifications of the morphological properties of spines from control and Clstn3 KO Purkinje cells.
(A & B) Images of all reconstructed Purkinje cells, as performed using Neurolucida360 software in control and Clstn3 KO cerebellar cortex. (C& D) Quantification of various spine parameters in the superficial (C) and deep layers (D) of control and Clstn3 KO mice (left, head width; middle left, neck length; middle right, neck width; right, head/neck ratio). Data are means ± SEM. Five to 8 spines were analyzed per layer per cell; the numbers of cells/mice examined are indicated in the left bar graph. Statistical analyses were performed with unpaired Student’s t-tests, p > 0.05.
Figure 9
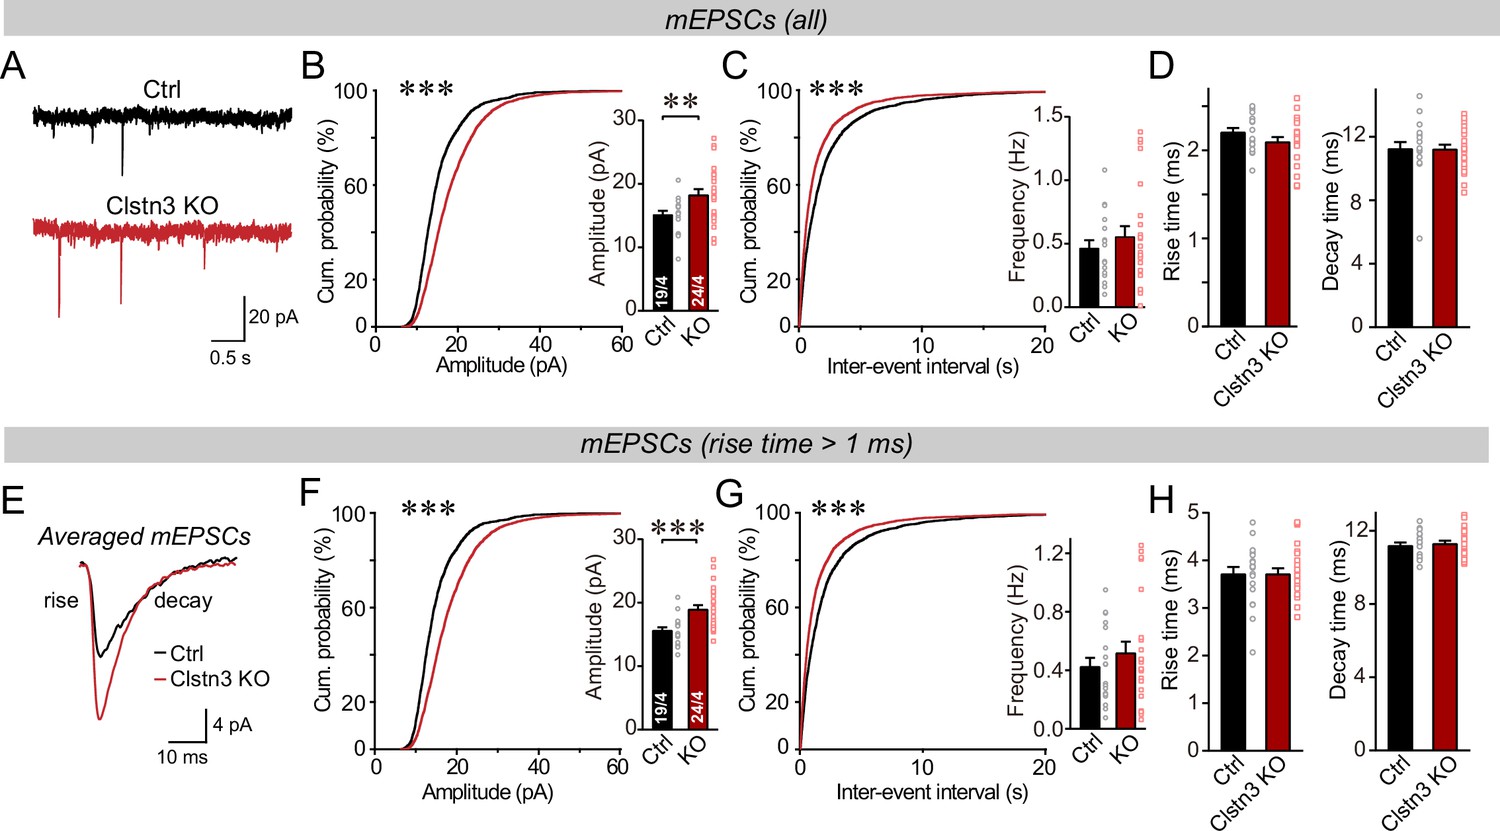
The Clstn3 KO in cerebellar cortex increases the amplitude and frequency of parallel-fiber mEPSCs.
(A–C) The cerebellar Clstn3 KO increases the amplitude and frequency of mEPSCs in Purkinje cells (A, representative traces; B, left, cumulative probability plot of the mEPSC amplitude right, average amplitude; C, cumulative probability plot of the mEPSC inter-event interval [inset, average frequency]). (D) The cerebellar Clstn3 KO has no effect on mEPSC kinetics (left, mEPSC rise times; right, mEPSC decay times). (E) Expanded traces of averaged mEPSCs to illustrate the kinetic similarity of control and Clstn3 KO events with a change in amplitude. (F & G) mEPSCs with slow rise times ( > 1ms) and that are likely primarily derived from parallel-fiber synapses exhibit the same phenotype as the total mEPSCs (same as B and C, but for mEPSCs with slow rise times). (H) The cerebellar Clstn3 KO has no effect on the kinetics of mEPSCs with slow rise times (left, mEPSC rise times; right, mEPSC decay times). All numerical data are means ± SEM. Statistical significance with two groups was assessed by unpaired t-test (*p < 0.05, **p < 0.01), with the number of cells/mice analyzed indicated in the first bar graphs for each experiment. Cumulative analysis was done with Kolmogorov-Smirnov test (***p < 0.001).
Figure 10
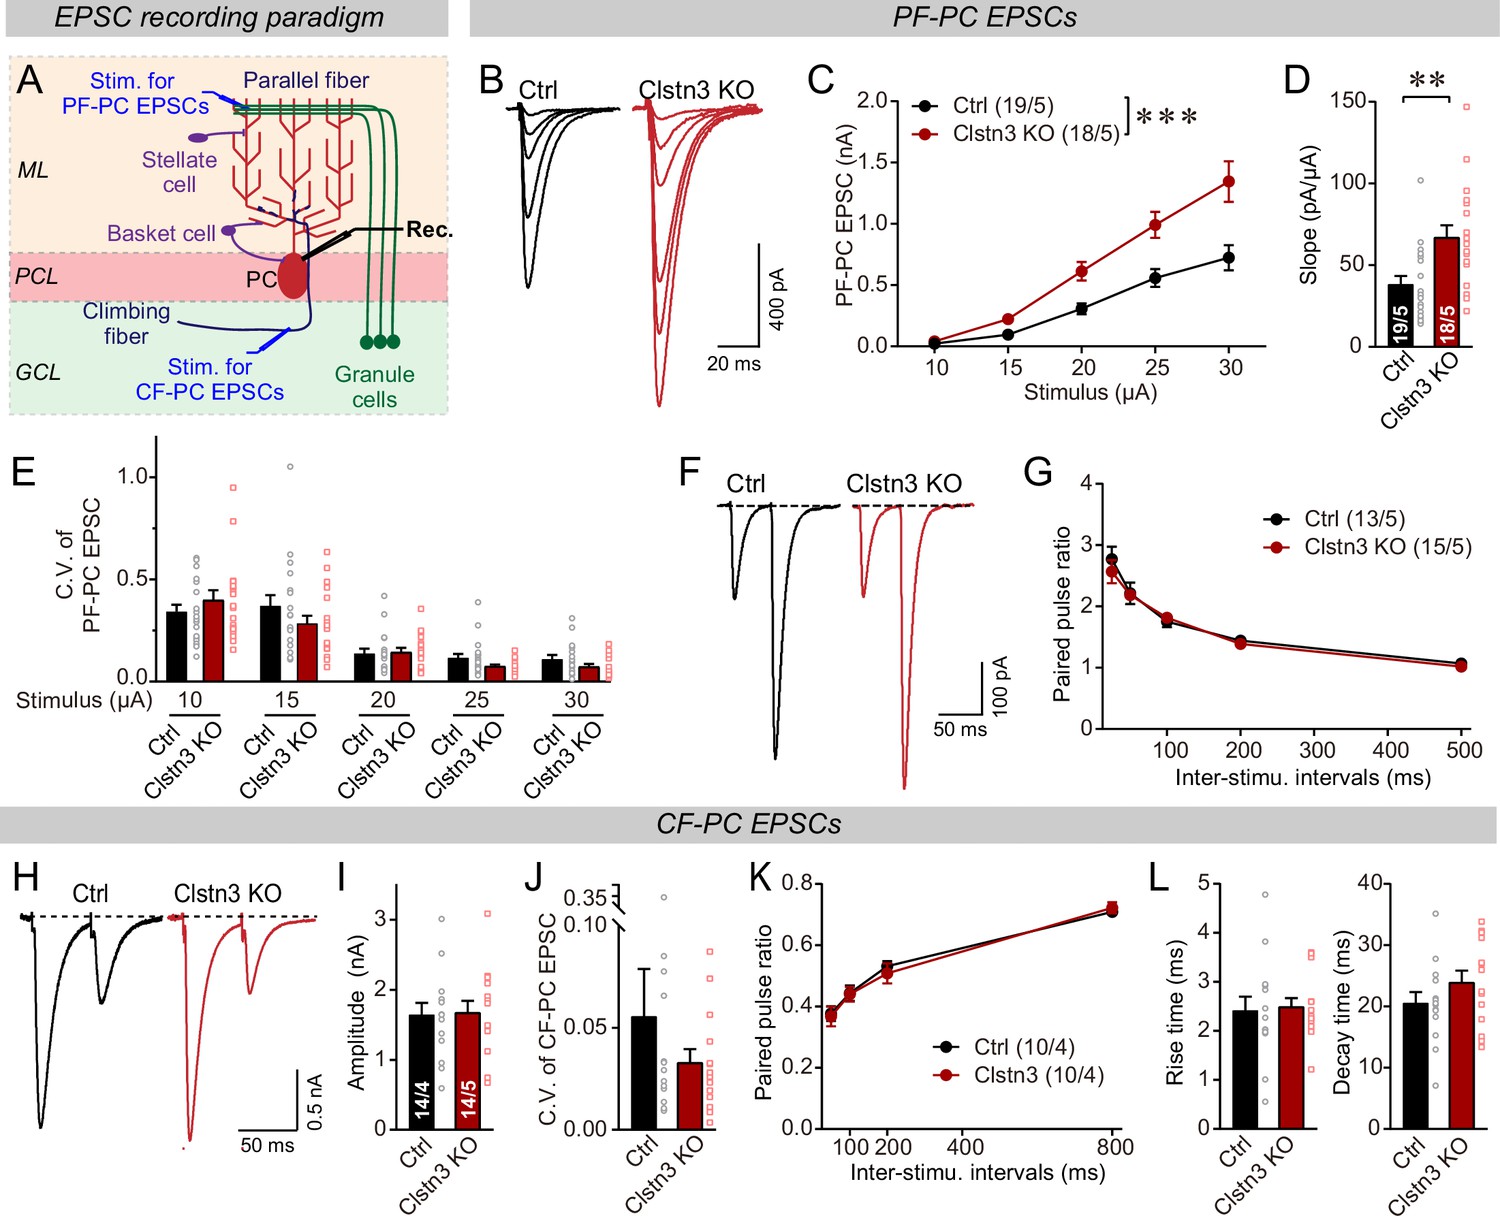
The Clstn3 KO elevates the strength of parallel-fiber synapses without altering their release probability, but leaves climbing-fiber synapses unchanged.
(A) Schematic of the recording configuration for monitoring evoked EPSCs induced by parallel-fiber (PF-PC) and climbing-fiber stimulation (CF-PC) in Purkinje cells. (B–D) The postsynaptic Clstn3 KO robustly increases the input/output relation of parallel-fiber synapses (B, representative traces; C, input/output curve; D, summary graph of the slope of the input/output curve determined in individual cells). (E–G) The postsynaptic Clstn3 KO in Purkinje cells has no effect on presynaptic release probability as assessed by monitoring the coefficient of variation of evoked EPSCs (E, separately analyzed for different stimulus strengths) or the paired-pulse ratio (F, sample traces; G, plot of the paired-pulse ratio of parallel-fiber EPSCs as a function of interstimulus interval). (H–L) The Clstn3 KO has no effect on the amplitude, coefficient of variation, paired-pulse ratio, or kinetics of climbing-fiber synapse EPSCs, suggesting that it does not alter their properties (H, representative traces of climbing-fiber EPSCs elicited with an interstimulus interval of 50ms; (I & J) amplitude (I) and coefficient of variation (J) of evoked climbing-fiber EPSCs; K, plot of the paired-pulse ratio of climbing-fiber EPSCs as a function of interstimulus interval; L, rise [left] and decay times [right] of evoked climbing-fiber EPSCs). All numerical data are means ± SEM. Statistical analyses were performed by two-way ANOVA followed by Tukey’s post hoc correction (C, G, K; for C, F(1, 150) = 15.24, p < 0.0001) or unpaired t-test for experiments with two groups (D, E, I, J, L), with *p < 0.05, **p < 0.01.
Figure 11 with 1 supplement

Sparse deletion of Clstn3 in Purkinje cells by low-titer lentiviral infection recapitulates the phenotype obtained with the AAV-mediated deletion of Clstn3 in the cerebellar cortex.
(A & B) Strategy and validation of the sparse Clstn3 deletion in Purkinje cells (A, experimental strategy; B, representative images of sparsely infected Purkinje cells, demonstrating that only isolated Purkinje cells and no granule or basket cells were infected). (C–E) The sparse Clstn3 KO in Purkinje cells decreases the amplitude of evoked IPSCs in the cerebellar cortex without changing the release probability (C, representative IPSC traces; D, IPSC amplitudes (left) and coefficient of variation (right); E, paired-pulse ratio of IPSCs with a 50ms inter-stimulus interval). (F–J) The sparse Clstn3 KO in Purkinje cells robustly increases the strength of parallel-fiber synapses, again without changing their release probability (F, representative traces; G, input/output curve of parallel-fiber EPSCs; H, summary graph of the slope of the input/output curve determined in individual cells; I coefficient of variation of evoked EPSCs at different stimulus intensities; J, plot of the paired-pulse ratio of parallel-fiber EPSCs). Data are means ± SEM. Two tailed unpaired t tests were applied to detect statistical significance with panels D, E and H. *p < 0.05. For panels G, I, and J, two-way ANOVA followed by post-hoc Tukey test was employed. For G, F(4, 68) = 31.695, **p < 0.000.
Figure 11—figure supplement 1
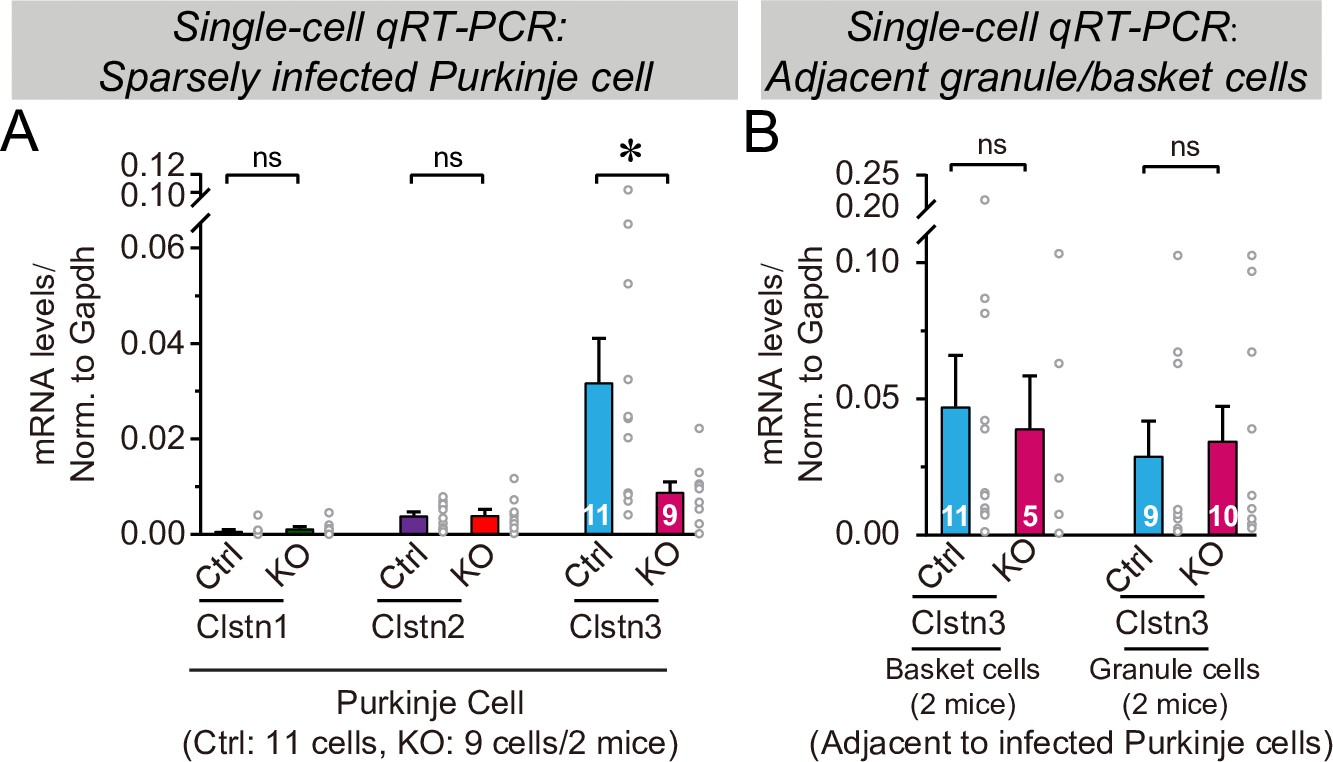
CRISPR-mediated sparse Clstn3 deletion in Purkinje cells causes a selective suppression of Clstn3 expression, but not of Clstn1 or Clstn2 expression, in Purkinje cells, but not in basket or granule cells, as analyzed by single-cell quantitative reverse transcription-PCR (qRT-PCR).
(A) Analysis of Clstn1, Clstn2, and Clstn3 mRNA levels in Purkinje cells after control CRISPR (Ctrl) or Clstn3 KO CRISPR manipulations. mRNAs were measured by qRT-PCR in the cytosol aspirated from patched Purkinje cells in acute slices cut from mice that had been sparsely infected with CRISRP lentiviruses at P21, and analyzed at P63 (see Figure 11). (B) Analysis of Clstn3 mRNA levels in patched basket and granule cells that were adjacent to infected Purkinje cells in acute slices in the experiments shown in A. Data are means ± SEM; n = 5–11 cells from 2 mice. Two-tailed unpaired t tests were applied to detect changes between control and KO groups, *p < 0.05.
Appendix 1—figure 1
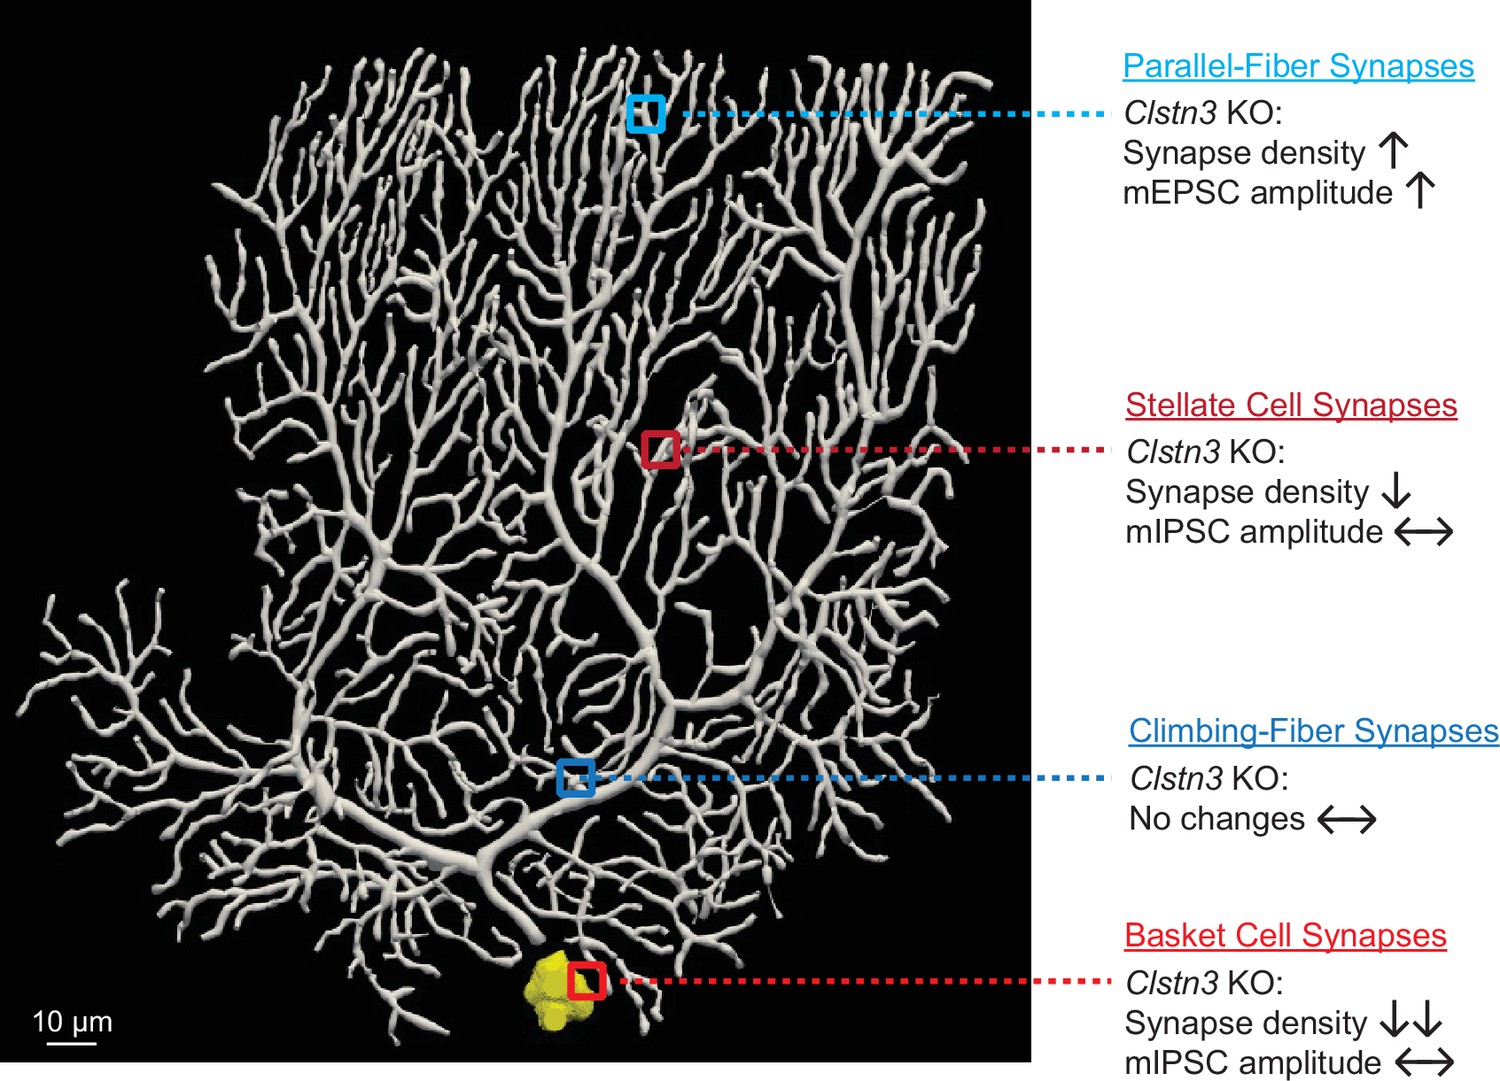
Summary of synaptic changes induced in Purkinje cells by the Clstn3 KO.
Tables
Key resources table
| Reagent type (species) or resource | Designation | Source or reference | Identifiers | Additional information |
|---|---|---|---|---|
| Genetic reagent(Mus musculus) | Constitutive Cas9 | PMID:25263330 | JAX ID: 024858 | |
| Genetic reagent(Mus musculus) | Pcp2-Cre | PMID:11105049 | JAX ID:004146 | |
| Genetic reagent(Mus musculus) | RiboTag | PMID:19666516 | JAX ID:029977 | |
| Cell line(Homo sapiens) | HEK293T | ATCC | CRL-11268 | |
| Recombinant DNA reagent | AAV-U6-sg66-U6-sg21-CAG tdTomato | This paper | Sg66 and sg21 were cloned in an AAV backbone and made into the AAVDJ serotype. See sgRNA design and generation of Vectors for cloning details, Virus production for how the AAVs were produced | |
| Recombinant DNA reagent | Lentiviral sg66 and sg21-CAG tdTomato | This paper | Sg66 and sg21 were cloned into a lentiviral shuttle plasmid for sparse infection. See Virus production for cloning details and how lentiviruses were produced. | |
| Sequence-based reagent | Clstn1 RNA FISH probe | Advanced Cell Diagnostics | Cat: 542611 | |
| Sequence-based reagent | Clstn2 RNA FISH probe | Advanced Cell Diagnostics | Cat: 542621 | |
| Sequence-based reagent | Clstn3 RNA FISH probe | Advanced Cell Diagnostics | Cat: 542631 | |
| Sequence-based reagent | Clstn3 qPCR primers and probe | This paper | See Quantitative RT-PCR and Figure 2—figure supplement 1A for how primers and probe were designed | |
| Antibody | Anti-Clstn3(rabbit polyclonal) | PMID:24613359 | Primary antibody, (1:1000) IB | |
| Antibody | Anti-Actb(mouse monoclonal) | Sigma | #A1978 | Primary antibody, (1:10000) IB |
| Antibody | Anti-vGluT1(rabbit polyclonal) | Yenzym | YZ6089 | Primary antibody, (1:1000) IHC |
| Antibody | Anti-vGluT2(rabbit polyclonal) | Yenzym | YZ6097 | Primary antibody, (1:1000) IHC |
| Antibody | Anti-vGAT(guinea pig polyclonal) | Sysy | 131004 | Primary antibody, (1:1000) IHC |
| Antibody | Anti-GluA1(rabbit polyclonal) | Millipore | AB1504 | Primary antibody, (1:1000) IHC |
| Antibody | Anti-GluA2(mouse monoclonal) | Millipore | MAB397 | Primary antibody, (1:1000) IHC |
| Antibody | Anti-GABA(A)Rα1(mouse monoclonal) | Neuromab | N95/35 | Primary antibody, (1:1000) IHC |
| Chemical compound, drug | Tribromoethanol | Sigma | T48402 | 250 mg/kg for anesthesia |
| Chemical compound, drug | Picrotoxin | Tocris | 1128 | |
| Chemical compound, drug | APV | Tocris | 0106 | |
| Chemical compound, drug | CNQX | Tocris | 1045 | |
| Chemical compound, drug | NBQX | Tocris | 1044 | |
| Chemical compound, drug | QX314 | Tocris | 1014 | |
| Chemical compound, drug | Tetrodotoxin | Cayman Chemical | 14964 | |
| Chemical compound, drug | DAPI | Sigma | D8417 | |
| Chemical compound, drug | Biocytin | Sigma | B4261 | |
| Chemical compund, drug | Pepsin | DAKO | S3002 | 1 mg/ml |
| Sequence-based reagent | Clstn1 | IDT | Mm.PT.58.6236597 | commercially designed |
| Sequence-based reagent | Clstn2 | IDT | Mm.PT.58.6443231 | commercially designed |
| Sequence-based reagent | Clstn3 | IDT | Mm.PT.58.45847813.g | commercially designed |
| Sequence-based reagent | Gapdh | Applied Biosystems | 4352932E | commercially designed |
| Software, algorithm | SnapGene | GSL Biotech | previously existing | |
| Software, algorithm | Image Studio Lite | LI-COR | previously existing | |
| Software, algorithm | pClamp10 | Molecular Device | previously existing | |
| Software, algorithm | Clampfit10 | Molecular Device | previously existing | |
| Software, algorithm | NIS-ElementsAR | Nikon | previously existing | |
| Software, algorithm | ImageJ | NIH | previously existing | |
| Software, algorithm | Neurolucida360 | MBF science | previously existing | |
| Software, algorithm | Adobe Illustrator | Adobe | previously existing | |
| Software, algorithm | GraphpadPrism 8.0 | Graphpad software | previously existing |
-
IB: immunoblotting, IHC: immunohistochemistry
Additional files
Download links
A two-part list of links to download the article, or parts of the article, in various formats.
Downloads (link to download the article as PDF)
Open citations (links to open the citations from this article in various online reference manager services)
Cite this article (links to download the citations from this article in formats compatible with various reference manager tools)
Deletion of Calsyntenin-3, an atypical cadherin, suppresses inhibitory synapses but increases excitatory parallel-fiber synapses in cerebellum
eLife 11:e70664.
https://doi.org/10.7554/eLife.70664


