Targeting DNA topoisomerases or checkpoint kinases results in an overload of chaperone systems, triggering aggregation of a metastable subproteome
- Department of Biomedical Sciences of Cells and Systems, University Medical Center Groningen, University of Groningen, Netherlands
- Laboratory of Cellular and Structural Biology, The Rockefeller University, United States
- European Research Institute for the Biology of Ageing, University Medical Center Groningen, University of Groningen, Netherlands
- Department of Radiation Oncology, University Medical Center Groningen, University of Groningen, Netherlands
Figures
Figure 1 with 1 supplement
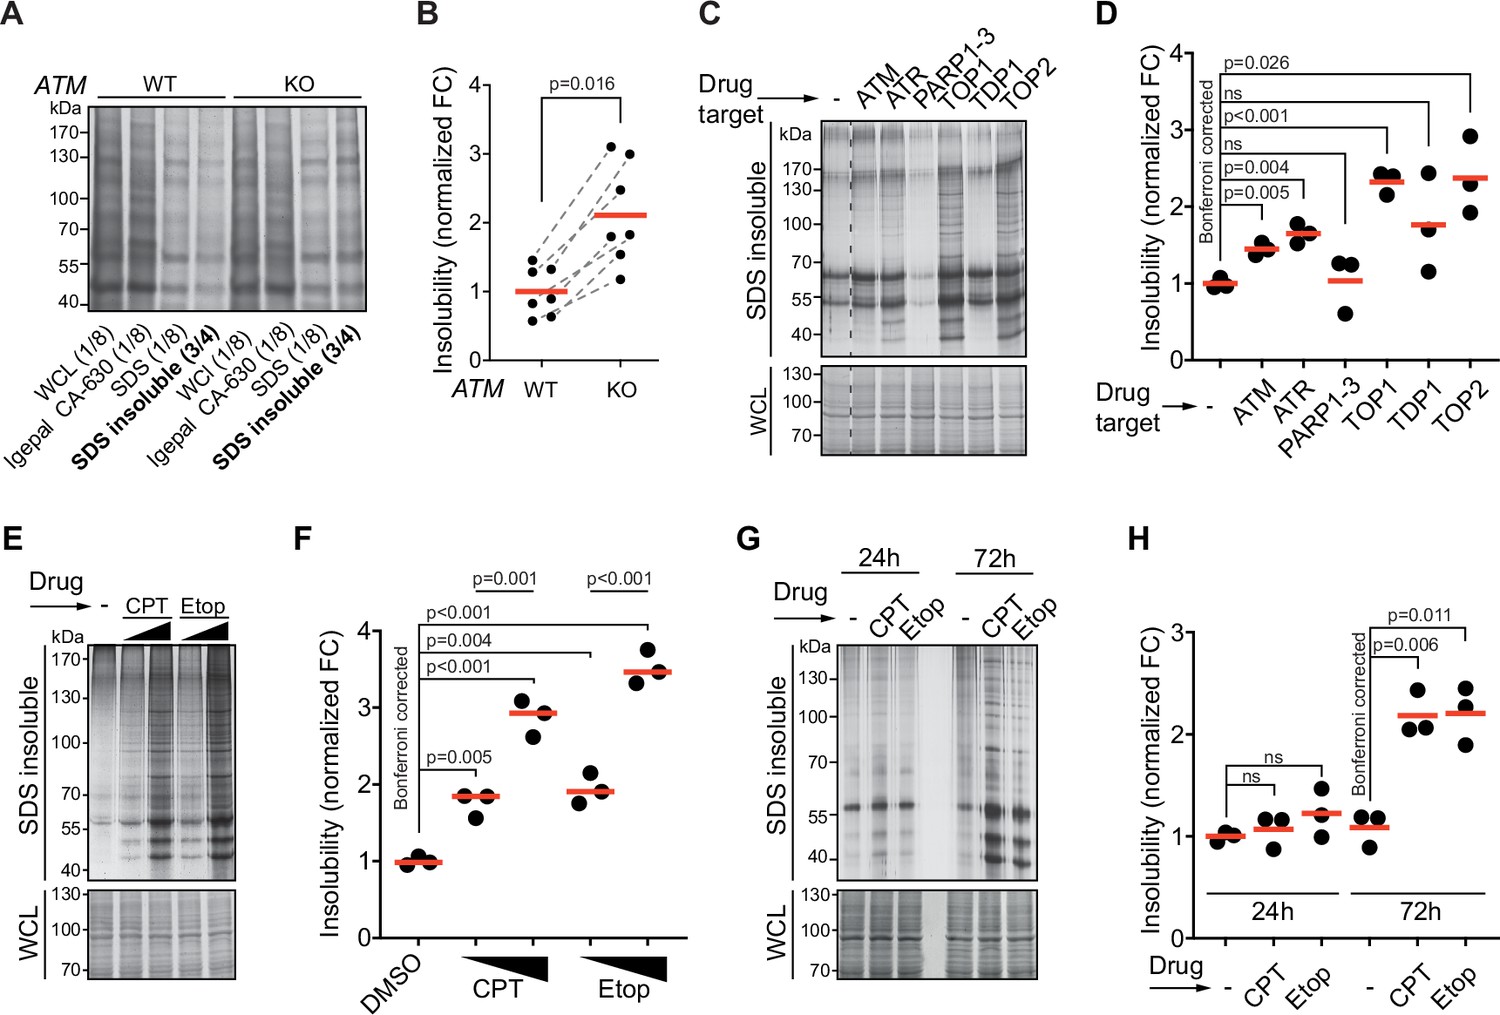
Protein aggregation is increased following a functional loss of ataxia telangiectasia mutated (ATM), ataxia telangiectasia and Rad3-related (ATR), and upon topoisomerase poisoning.
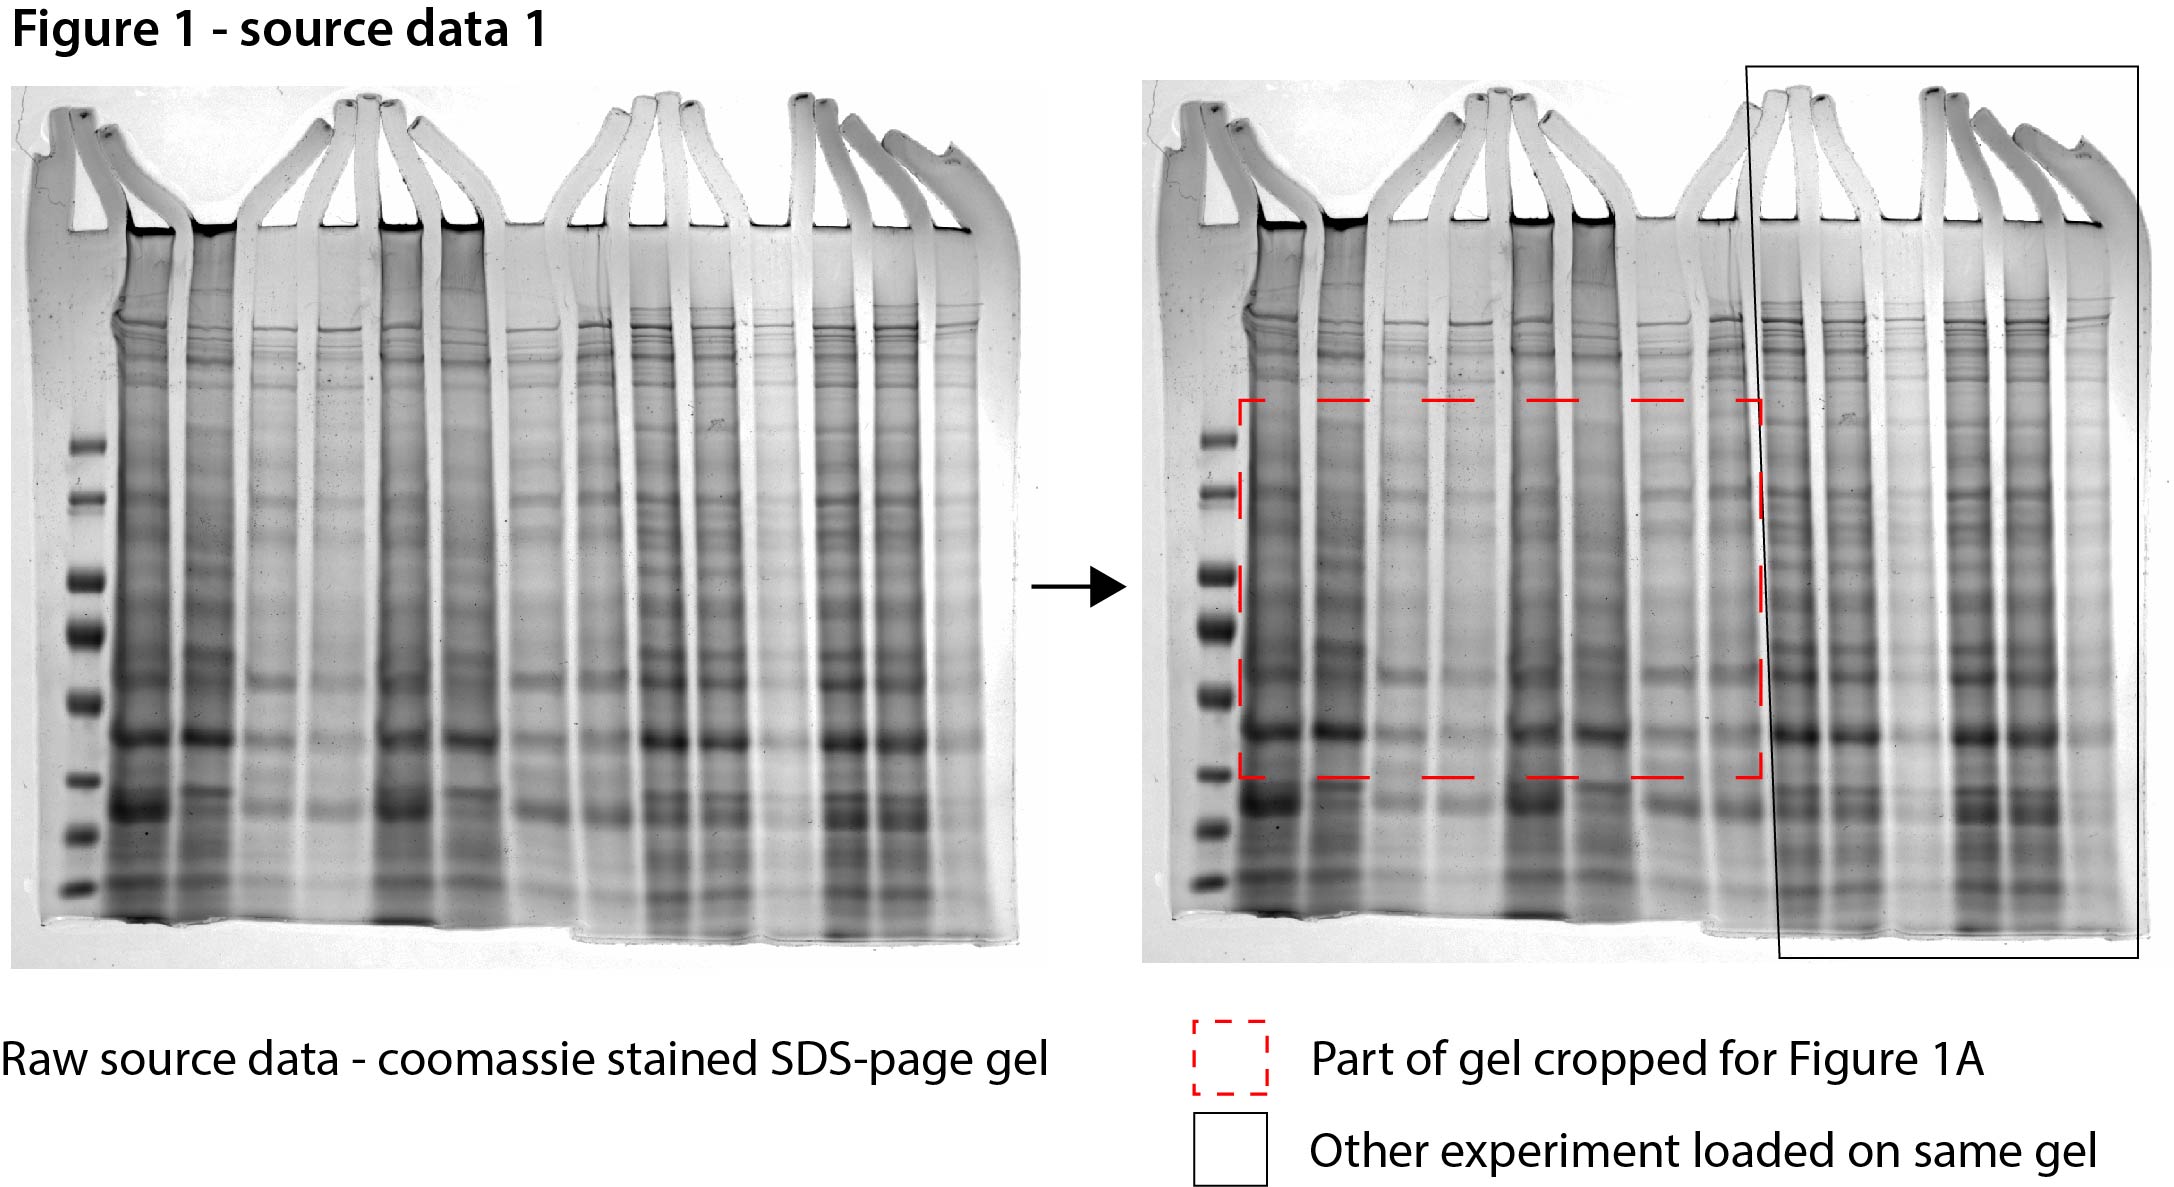
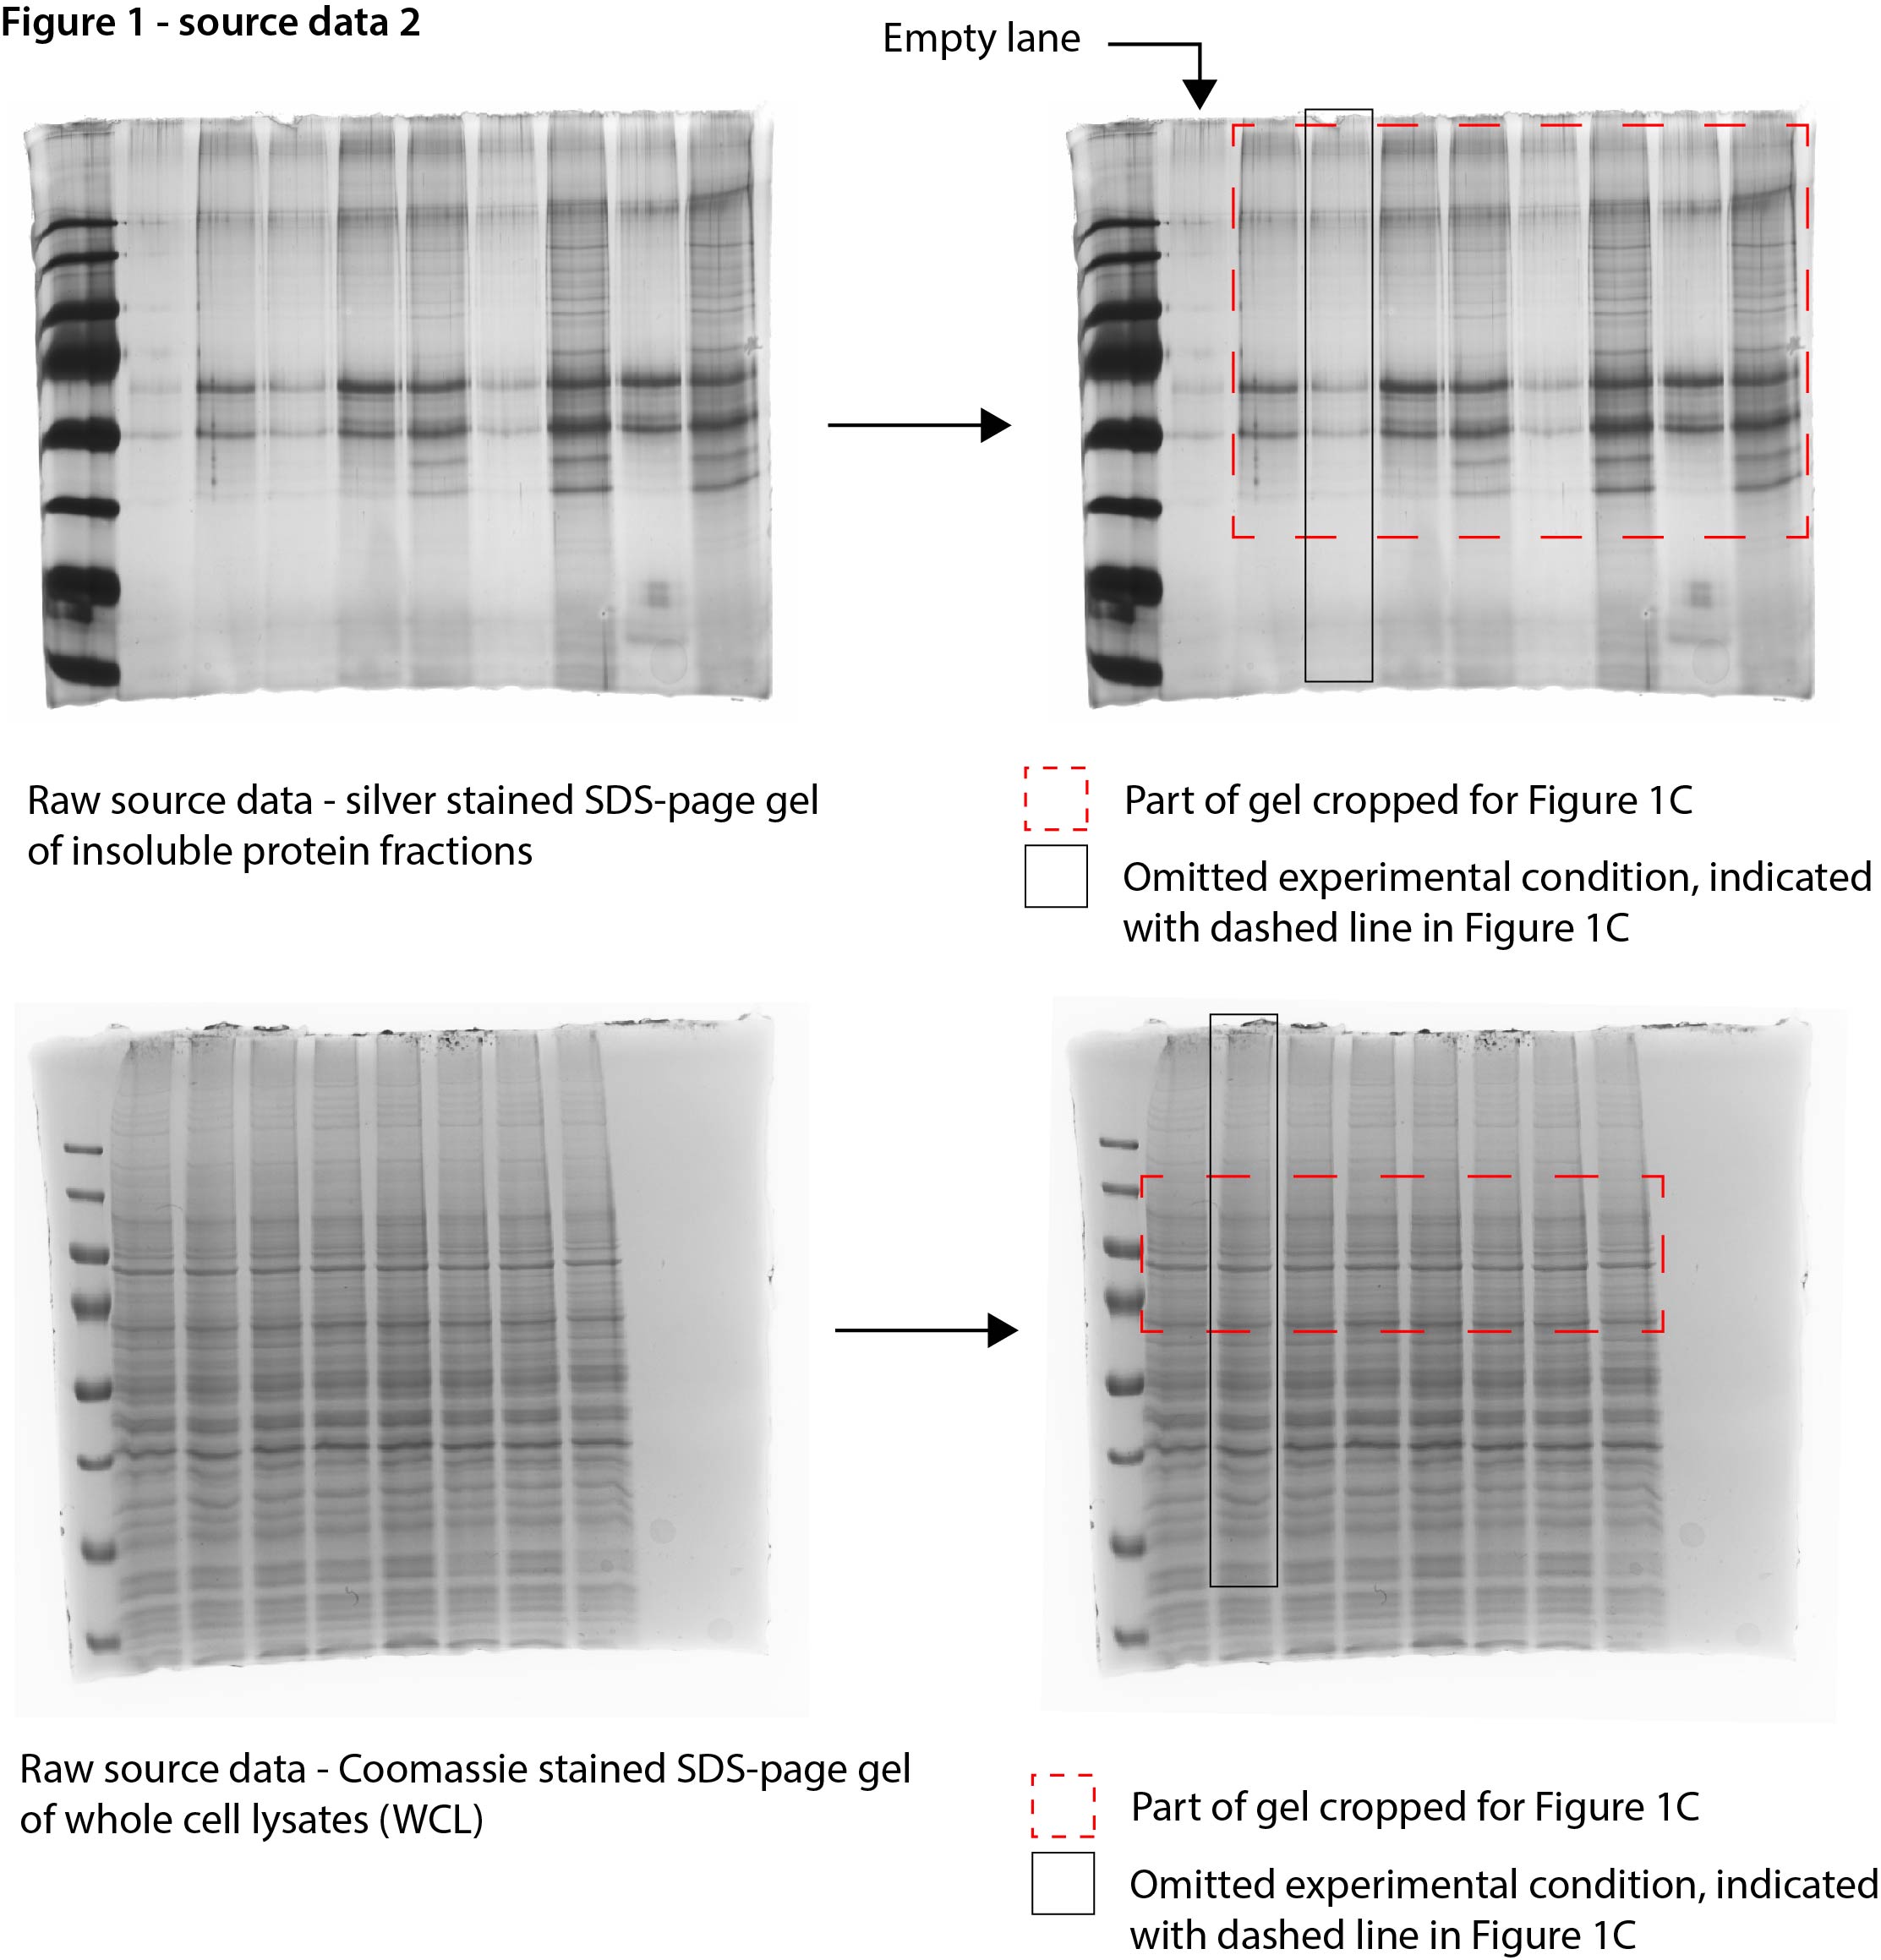
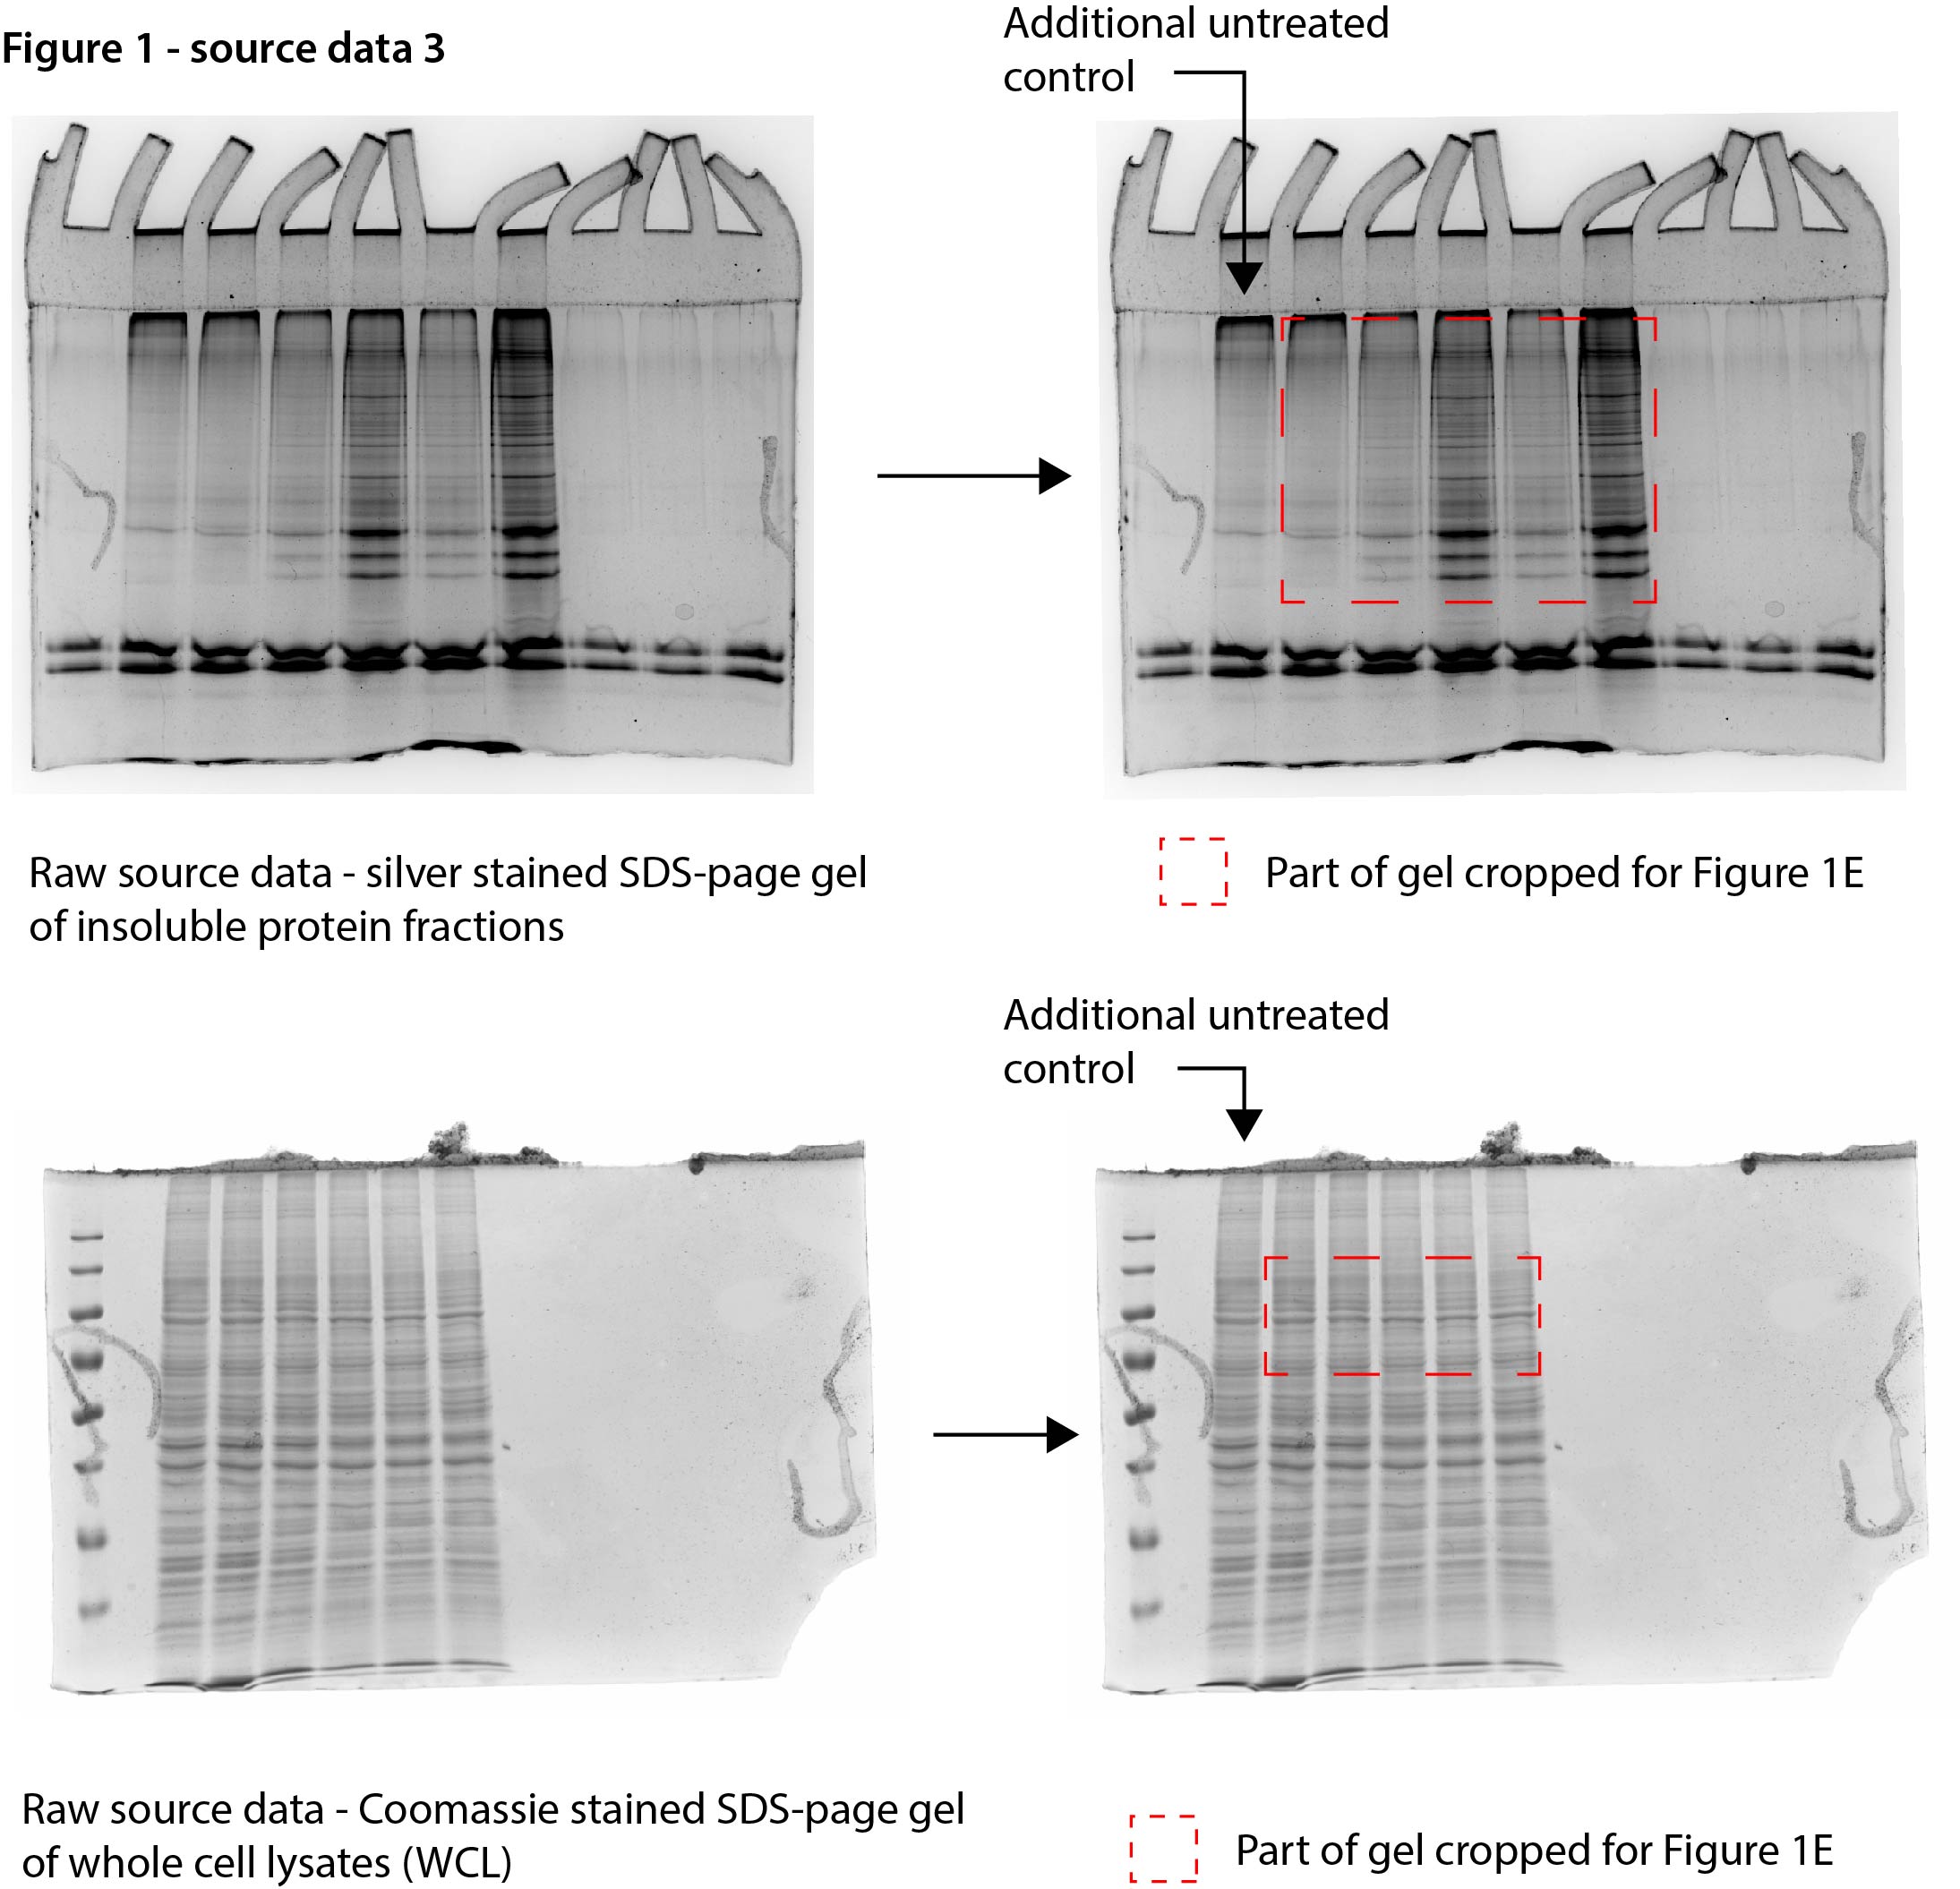
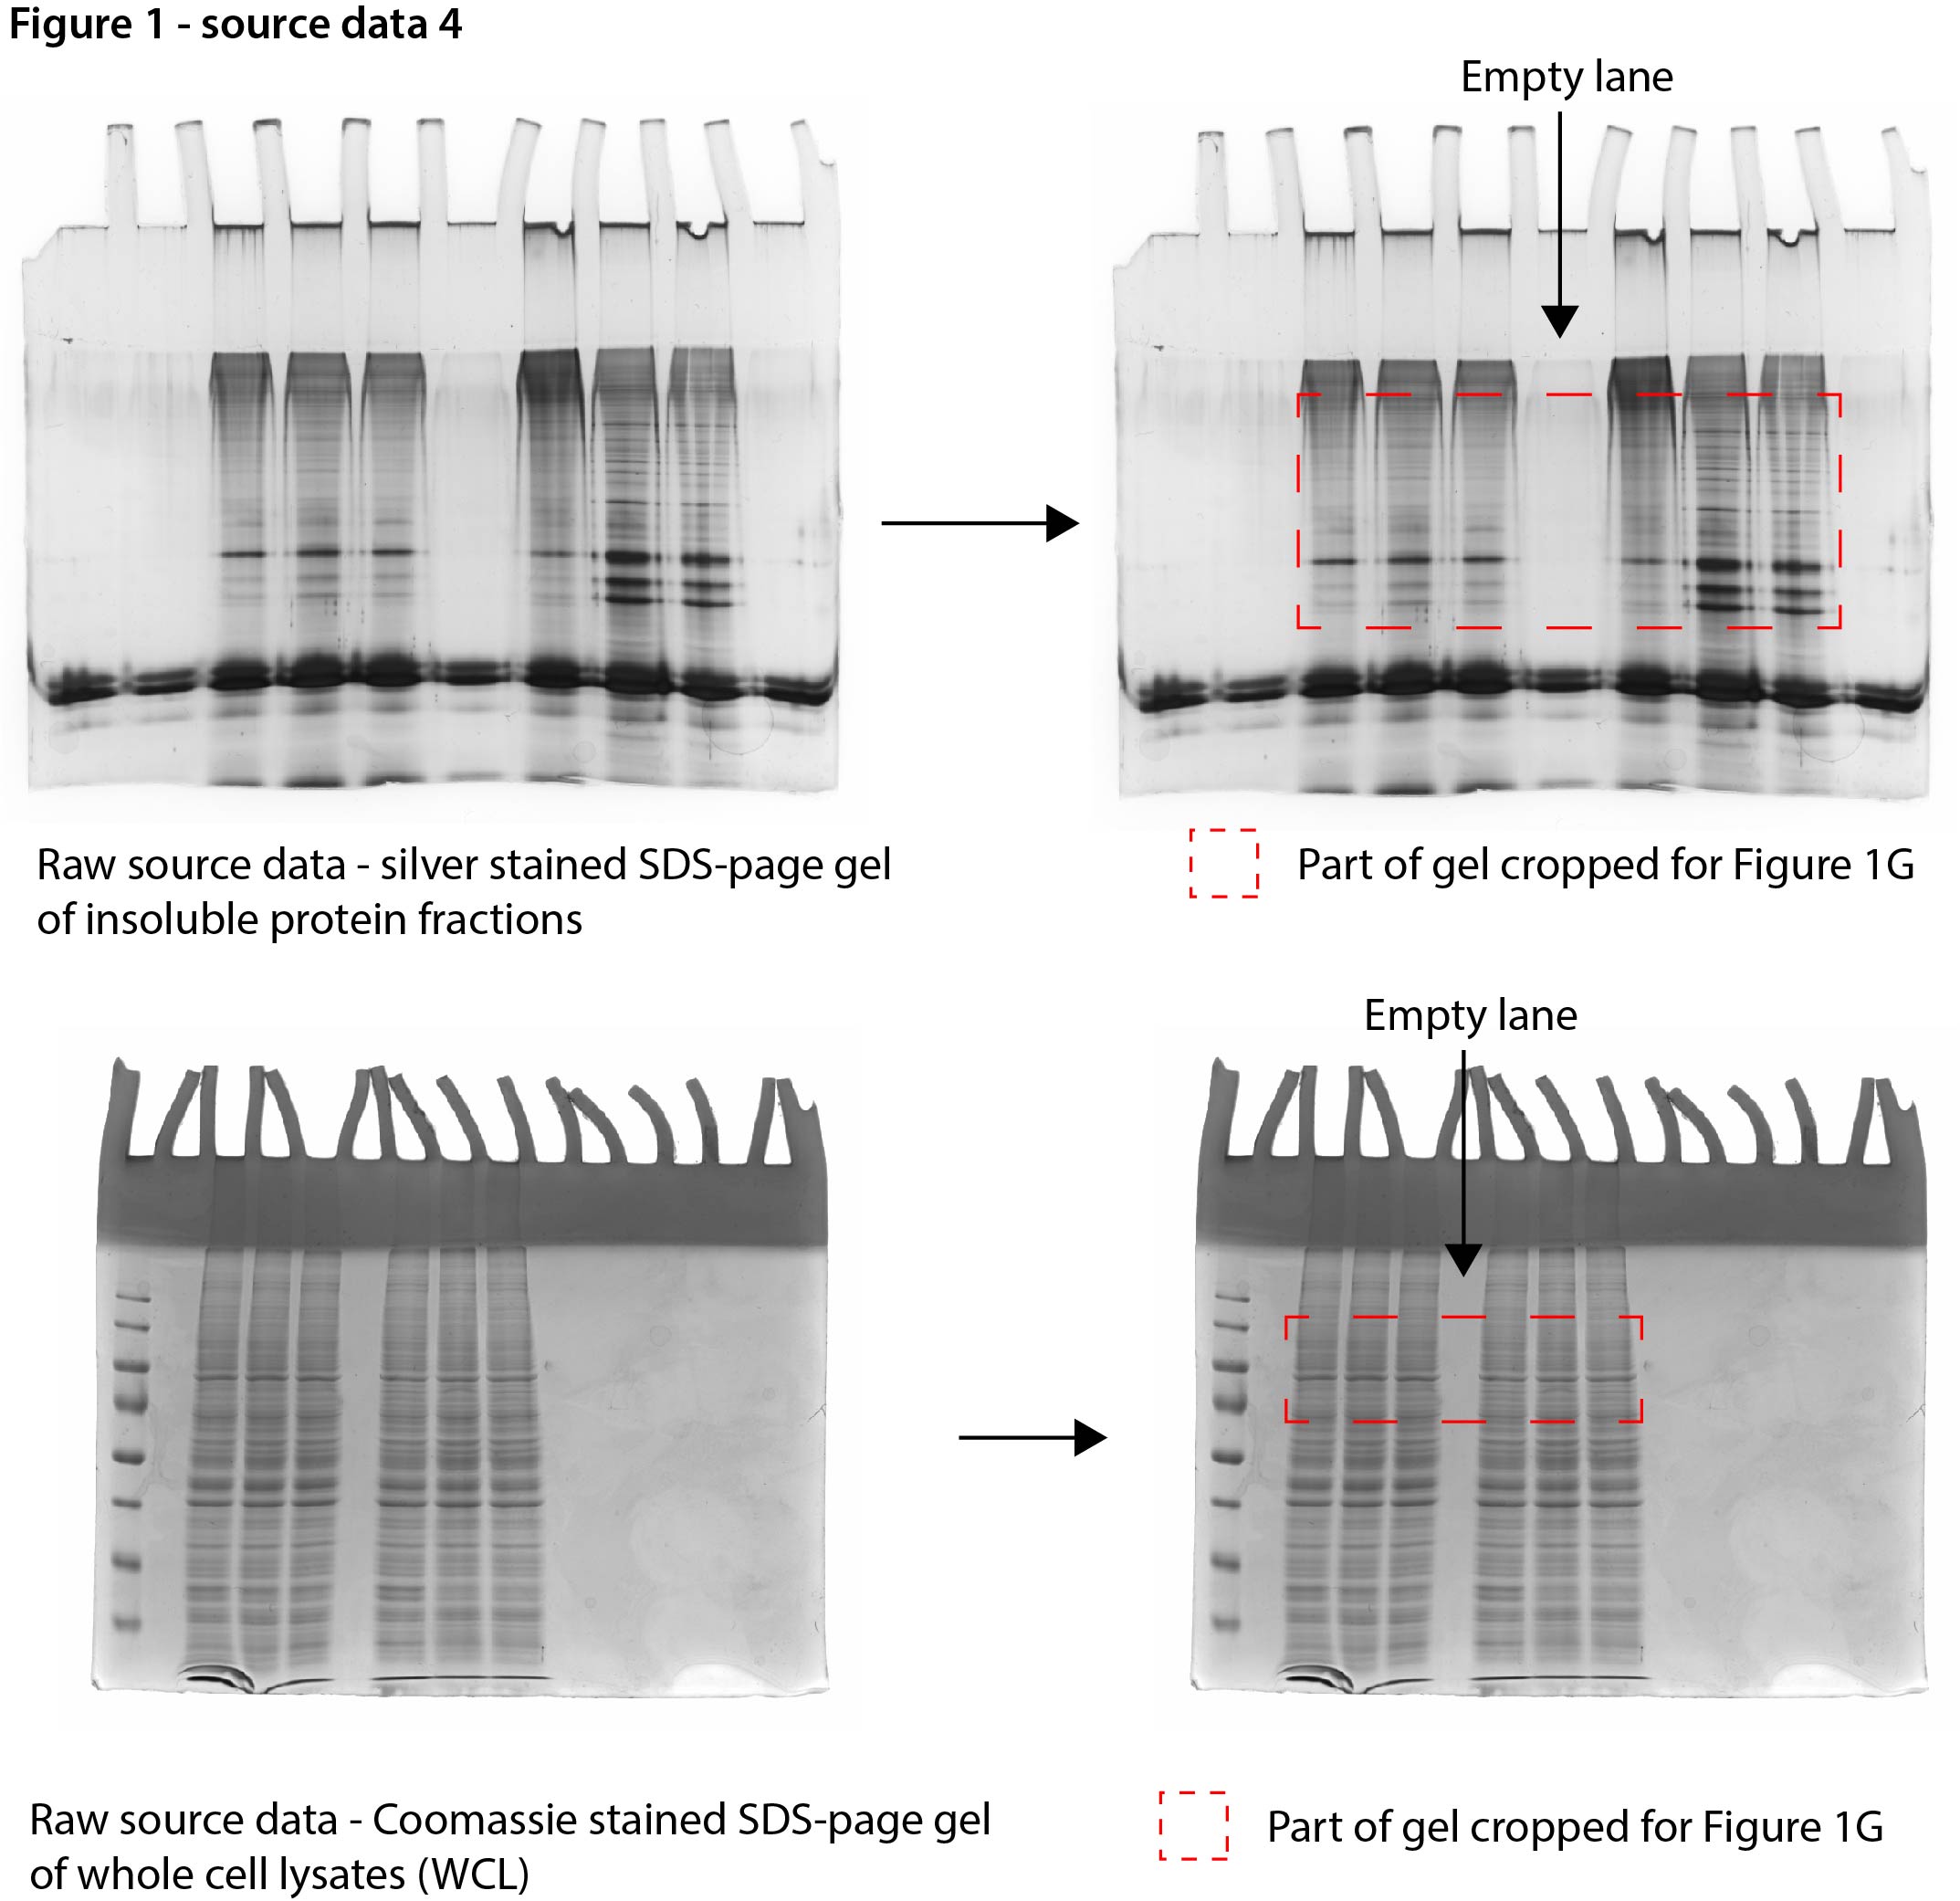
See also Figure 1—figure supplement 1. (A) In-gel Coomassie staining of indicated fractions of cell extracts of WT and ATM KO U2OS cells. The relative amounts of each fraction loaded are indicated. (B) Quantification of (A). Circles depict individual experiments; gray dotted lines depict matched pairs. Wilcoxon matched-pairs signed-rank test. (C) Aggregated (silver stain) and whole-cell lysate (WCL; Coomassie) fractions of HEK293T cells treated transiently with chemical agents targeting the indicating proteins (see Table 1 for drugs and doses used; for etoposide [Etop]: 3 μM; for camptothecin [CPT]: 100 nM). See also Figure 1—figure supplement 1D. (D) Quantification of (C). Circles depict individual experiments. Two-tailed Student’s t-test with Bonferroni correction. (E) Protein fractions of HEK293T cells treated transiently with increasing amounts of CPT (20–100 nM) or Etop (0.6–3 μM). (F) Quantification of (E). Two-tailed Student’s t-test with Bonferroni correction. (G) Protein fractions of HEK293T cells treated transiently with CPT (40 nM) or Etop (1.5 μM), targeting TOP1 or TOP2, respectively, 24 hr or 72 hr after treatment. (H) Quantification of (G). Two-tailed Student’s t-test with Bonferroni correction. In (B), (D), (F), and (H), the red line indicates the mean.
-
Figure 1—source data 1
Data from Figure 1A.
Raw Coomassie-stained SDS-PAGE gel with cropped parts indicated in red.
- https://cdn.elifesciences.org/articles/70726/elife-70726-fig1-data1-v2.jpg
-
Figure 1—source data 2
Data from Figure 1C.
Raw Coomassie- and silver-stained SDS-PAGE gels with cropped parts indicated in red.
- https://cdn.elifesciences.org/articles/70726/elife-70726-fig1-data2-v2.jpg
-
Figure 1—source data 3
Data from Figure 1E.
Raw Coomassie- and silver-stained SDS-PAGE gels with cropped parts indicated in red.
- https://cdn.elifesciences.org/articles/70726/elife-70726-fig1-data3-v2.jpg
-
Figure 1—source data 4
Data from Figure 1G.
Raw Coomassie- and silver-stained SDS-PAGE gels with cropped parts indicated in red.
- https://cdn.elifesciences.org/articles/70726/elife-70726-fig1-data4-v2.jpg
Figure 1—figure supplement 1
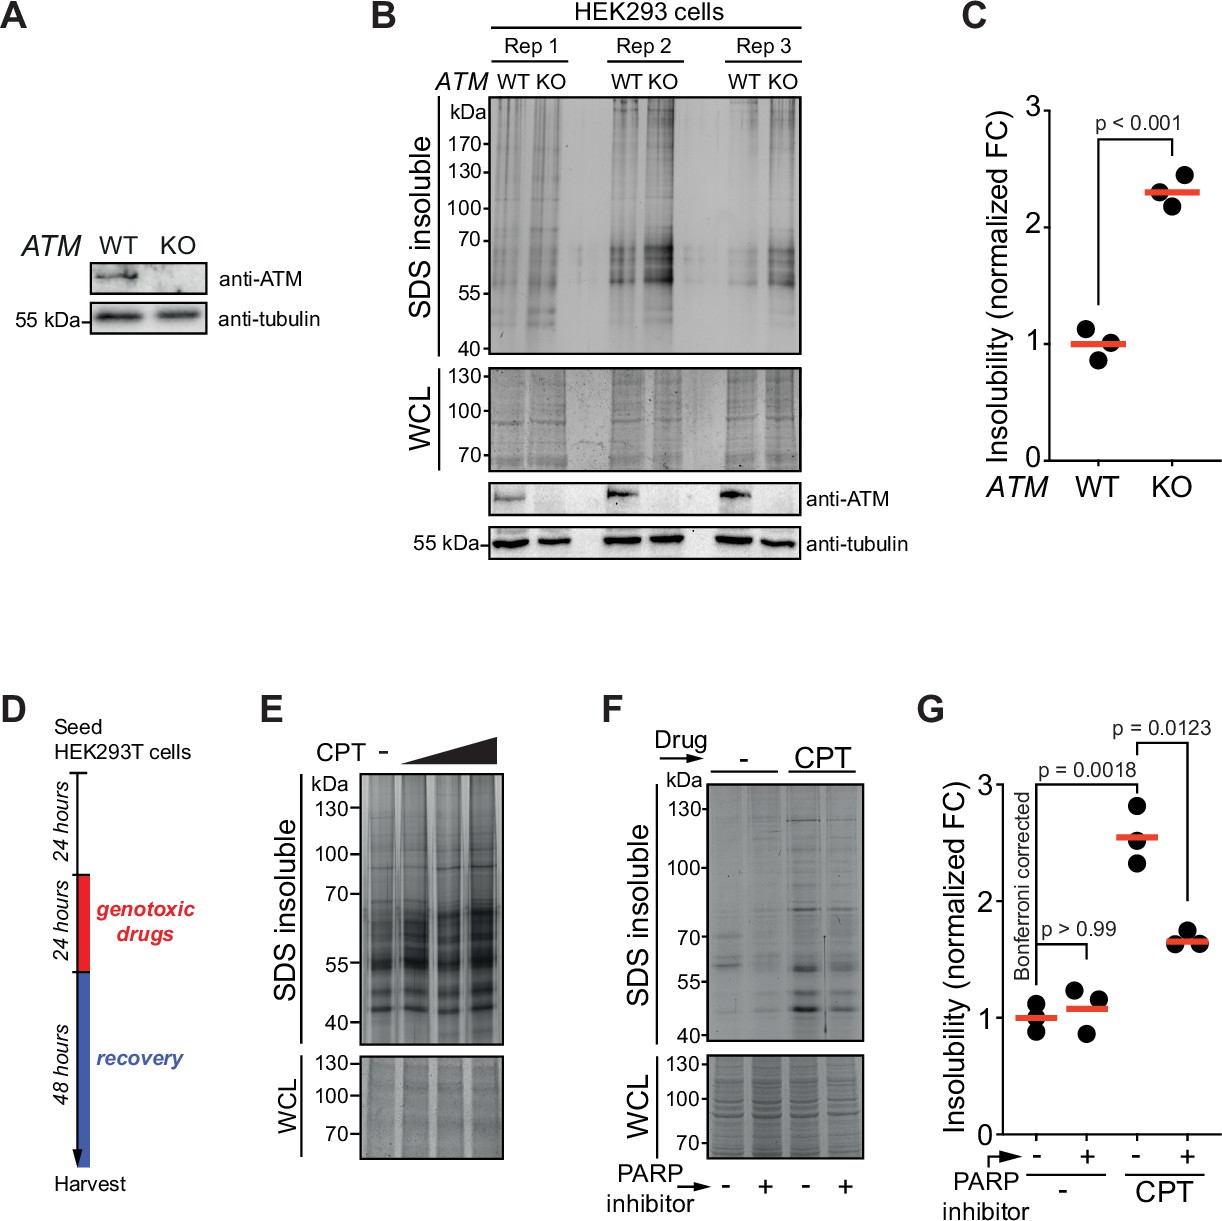
Aggregation is increased in cells lacking ataxia telangiectasia mutated (ATM).
Western blot of U2OS wild-type and ATM KO cells, probed using the indicated antibodies. (B) Aggregated (silver stain) and whole-cell lysate (WCL; Coomassie) fractions of HEK293 wild-type and ATM KO cells. Three independent biological repeats were loaded on one gel and stained in-gel. WCL fractions were also subjected to Western blotting and probed using the indicated antibodies. (C) Quantification of (A). Circles depict individual experiments. Two-tailed Student’s t-test. (D) Experimental outline of Figure 1C and E. (E) Aggregated (silver stain) and WCL (Coomassie) fractions of U2OS cells treated with increasing doses of camptothecin (CPT) (0.2, 0.4, 0.6 μM). n = 2. (F) Aggregated (silver stain) and WCL (Coomassie) fractions of HEK293T cells treated transiently with CPT (40 nM) following the same experimental set-up as in (D). PARP inhibitor (4 μM, see also Materials and methods) was added during the recovery period. (G) Quantification of (F). Circles depict individual experiments. Two-tailed Student’s t-test with Bonferroni correction. In (C) and (G), red lines indicate the mean.
-
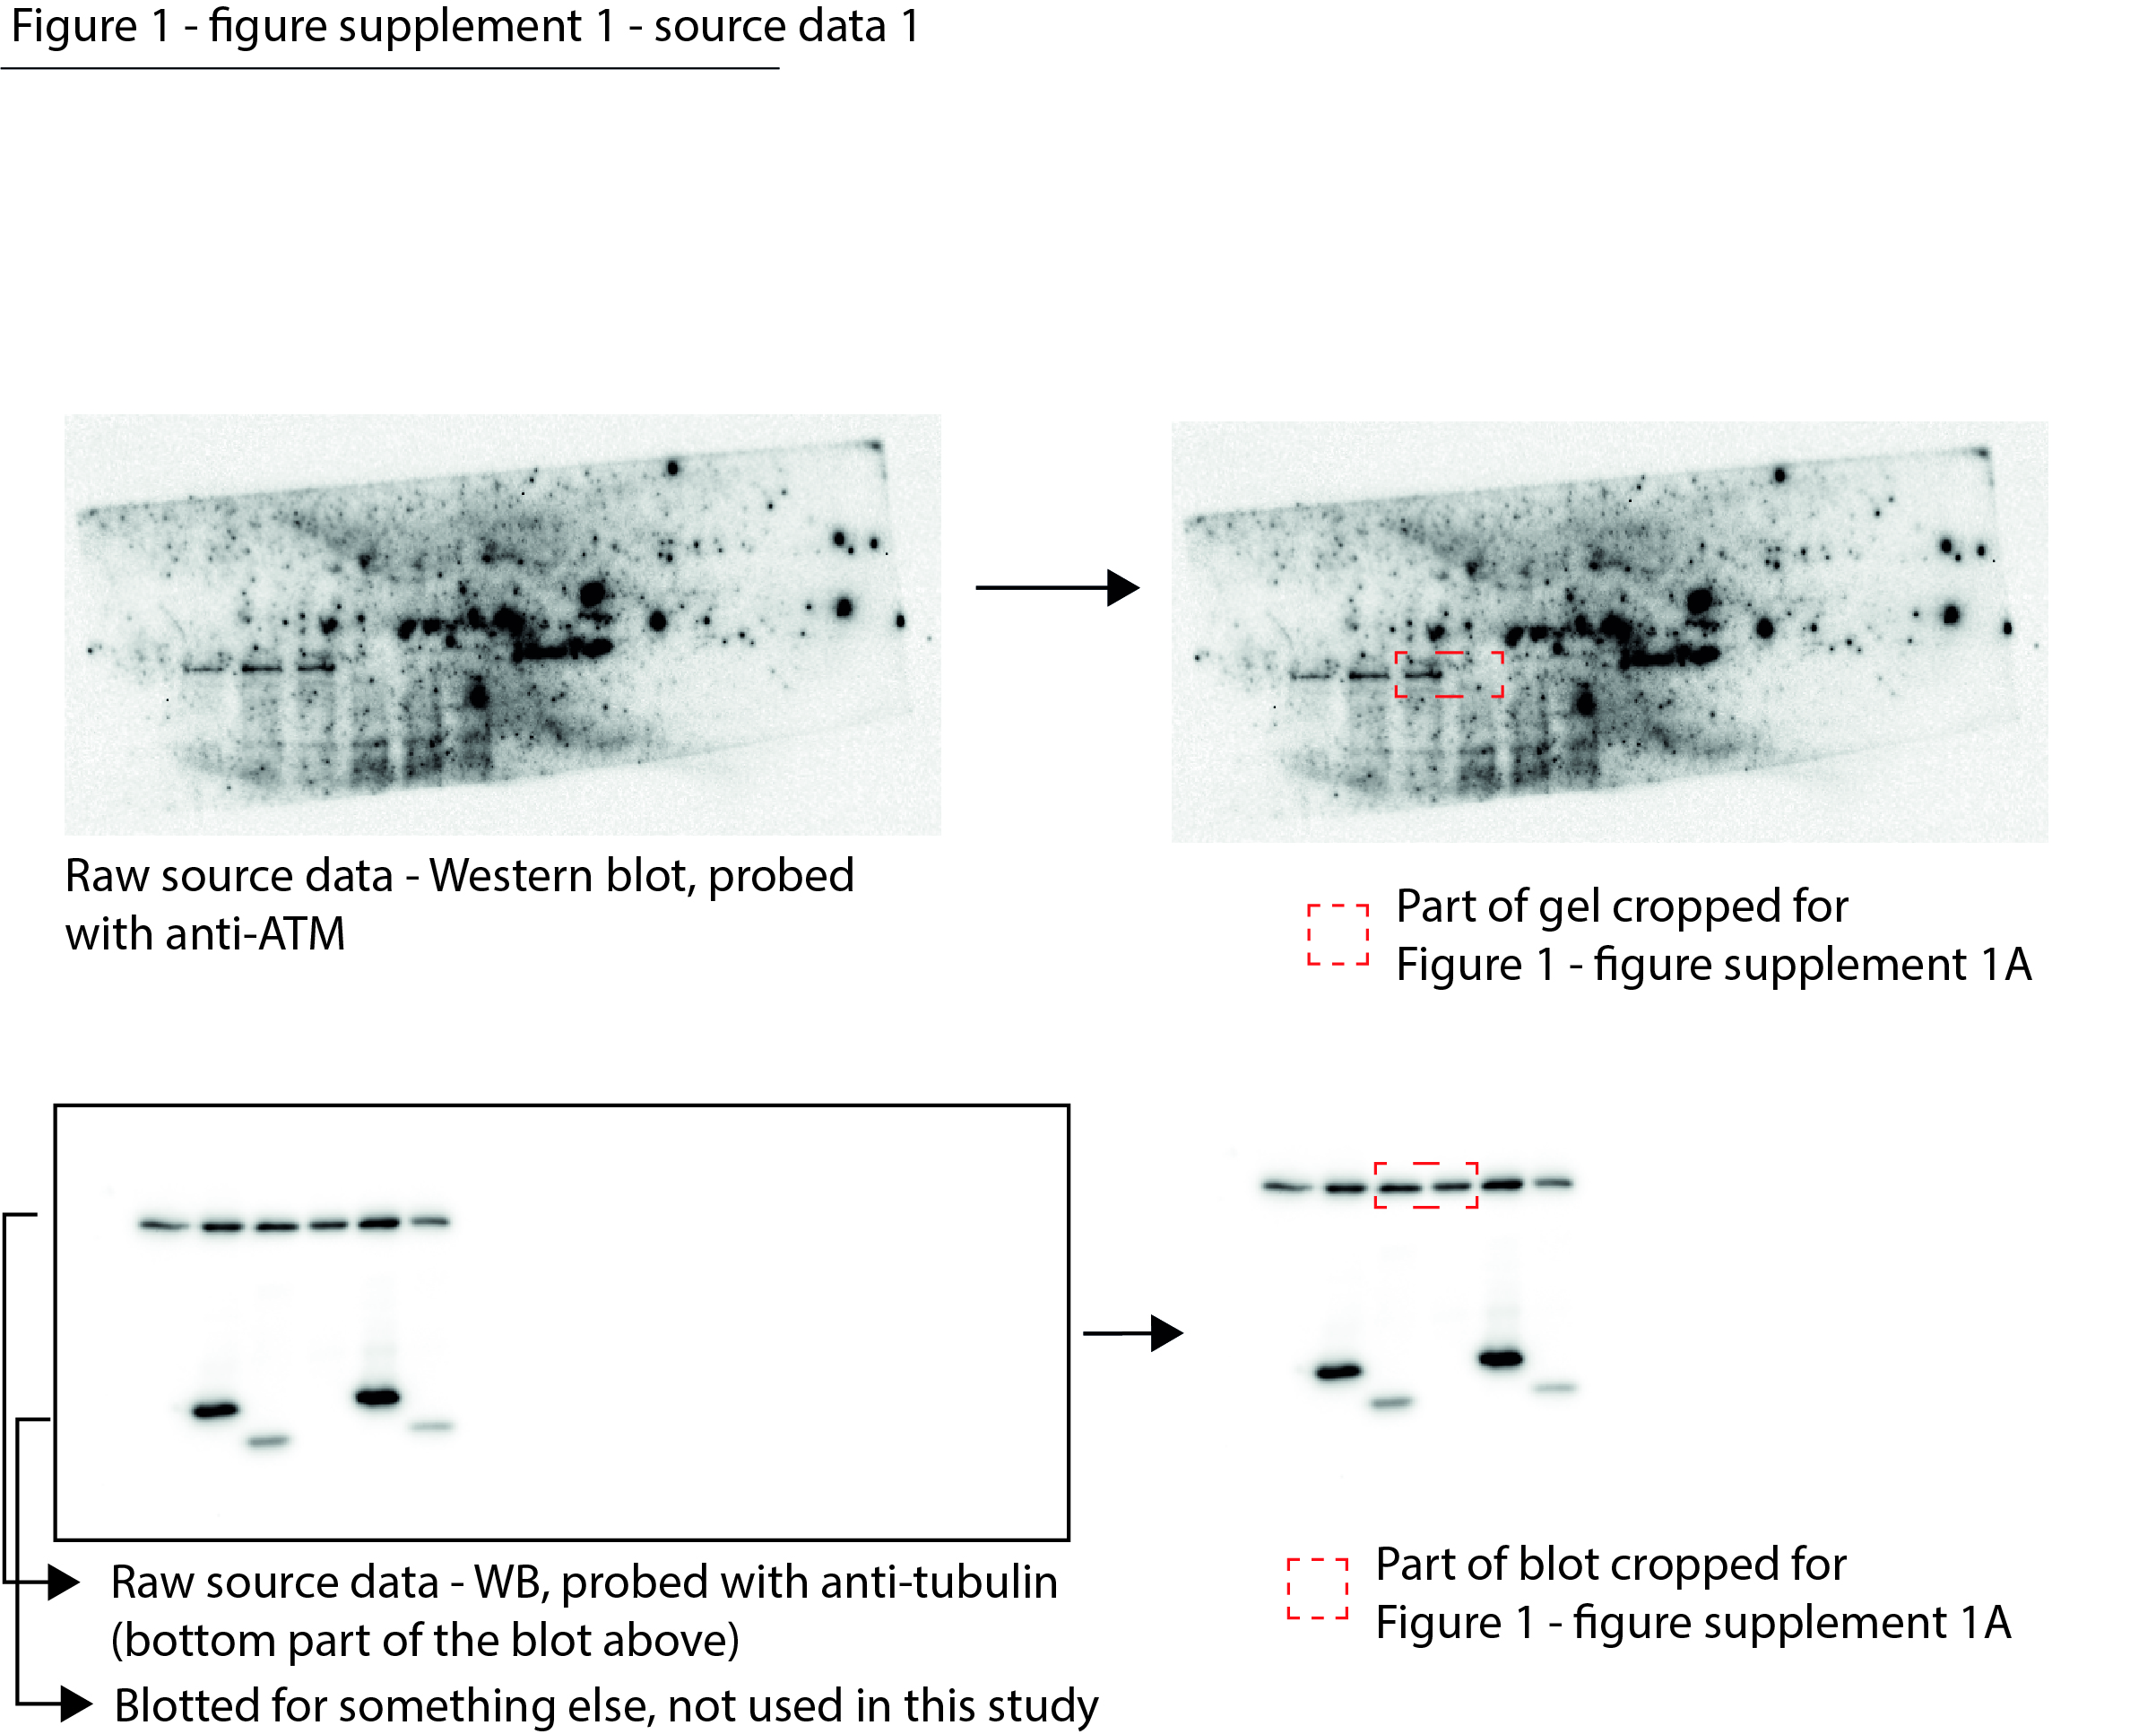
Figure 1—figure supplement 1—source data 1
Data from Figure 1—figure supplement 1A.
Raw Western blot images with antibodies annotated and cropped parts indicated in red.
- https://cdn.elifesciences.org/articles/70726/elife-70726-fig1-figsupp1-data1-v2.jpg
-
Figure 1—figure supplement 1—source data 2
Data from Figure 1—figure supplement 1B.
Raw Coomassie- and silver-stained SDS-PAGE gels and Western blot images with antibodies annotated and cropped parts indicated in red.
- https://cdn.elifesciences.org/articles/70726/elife-70726-fig1-figsupp1-data2-v2.jpg
-
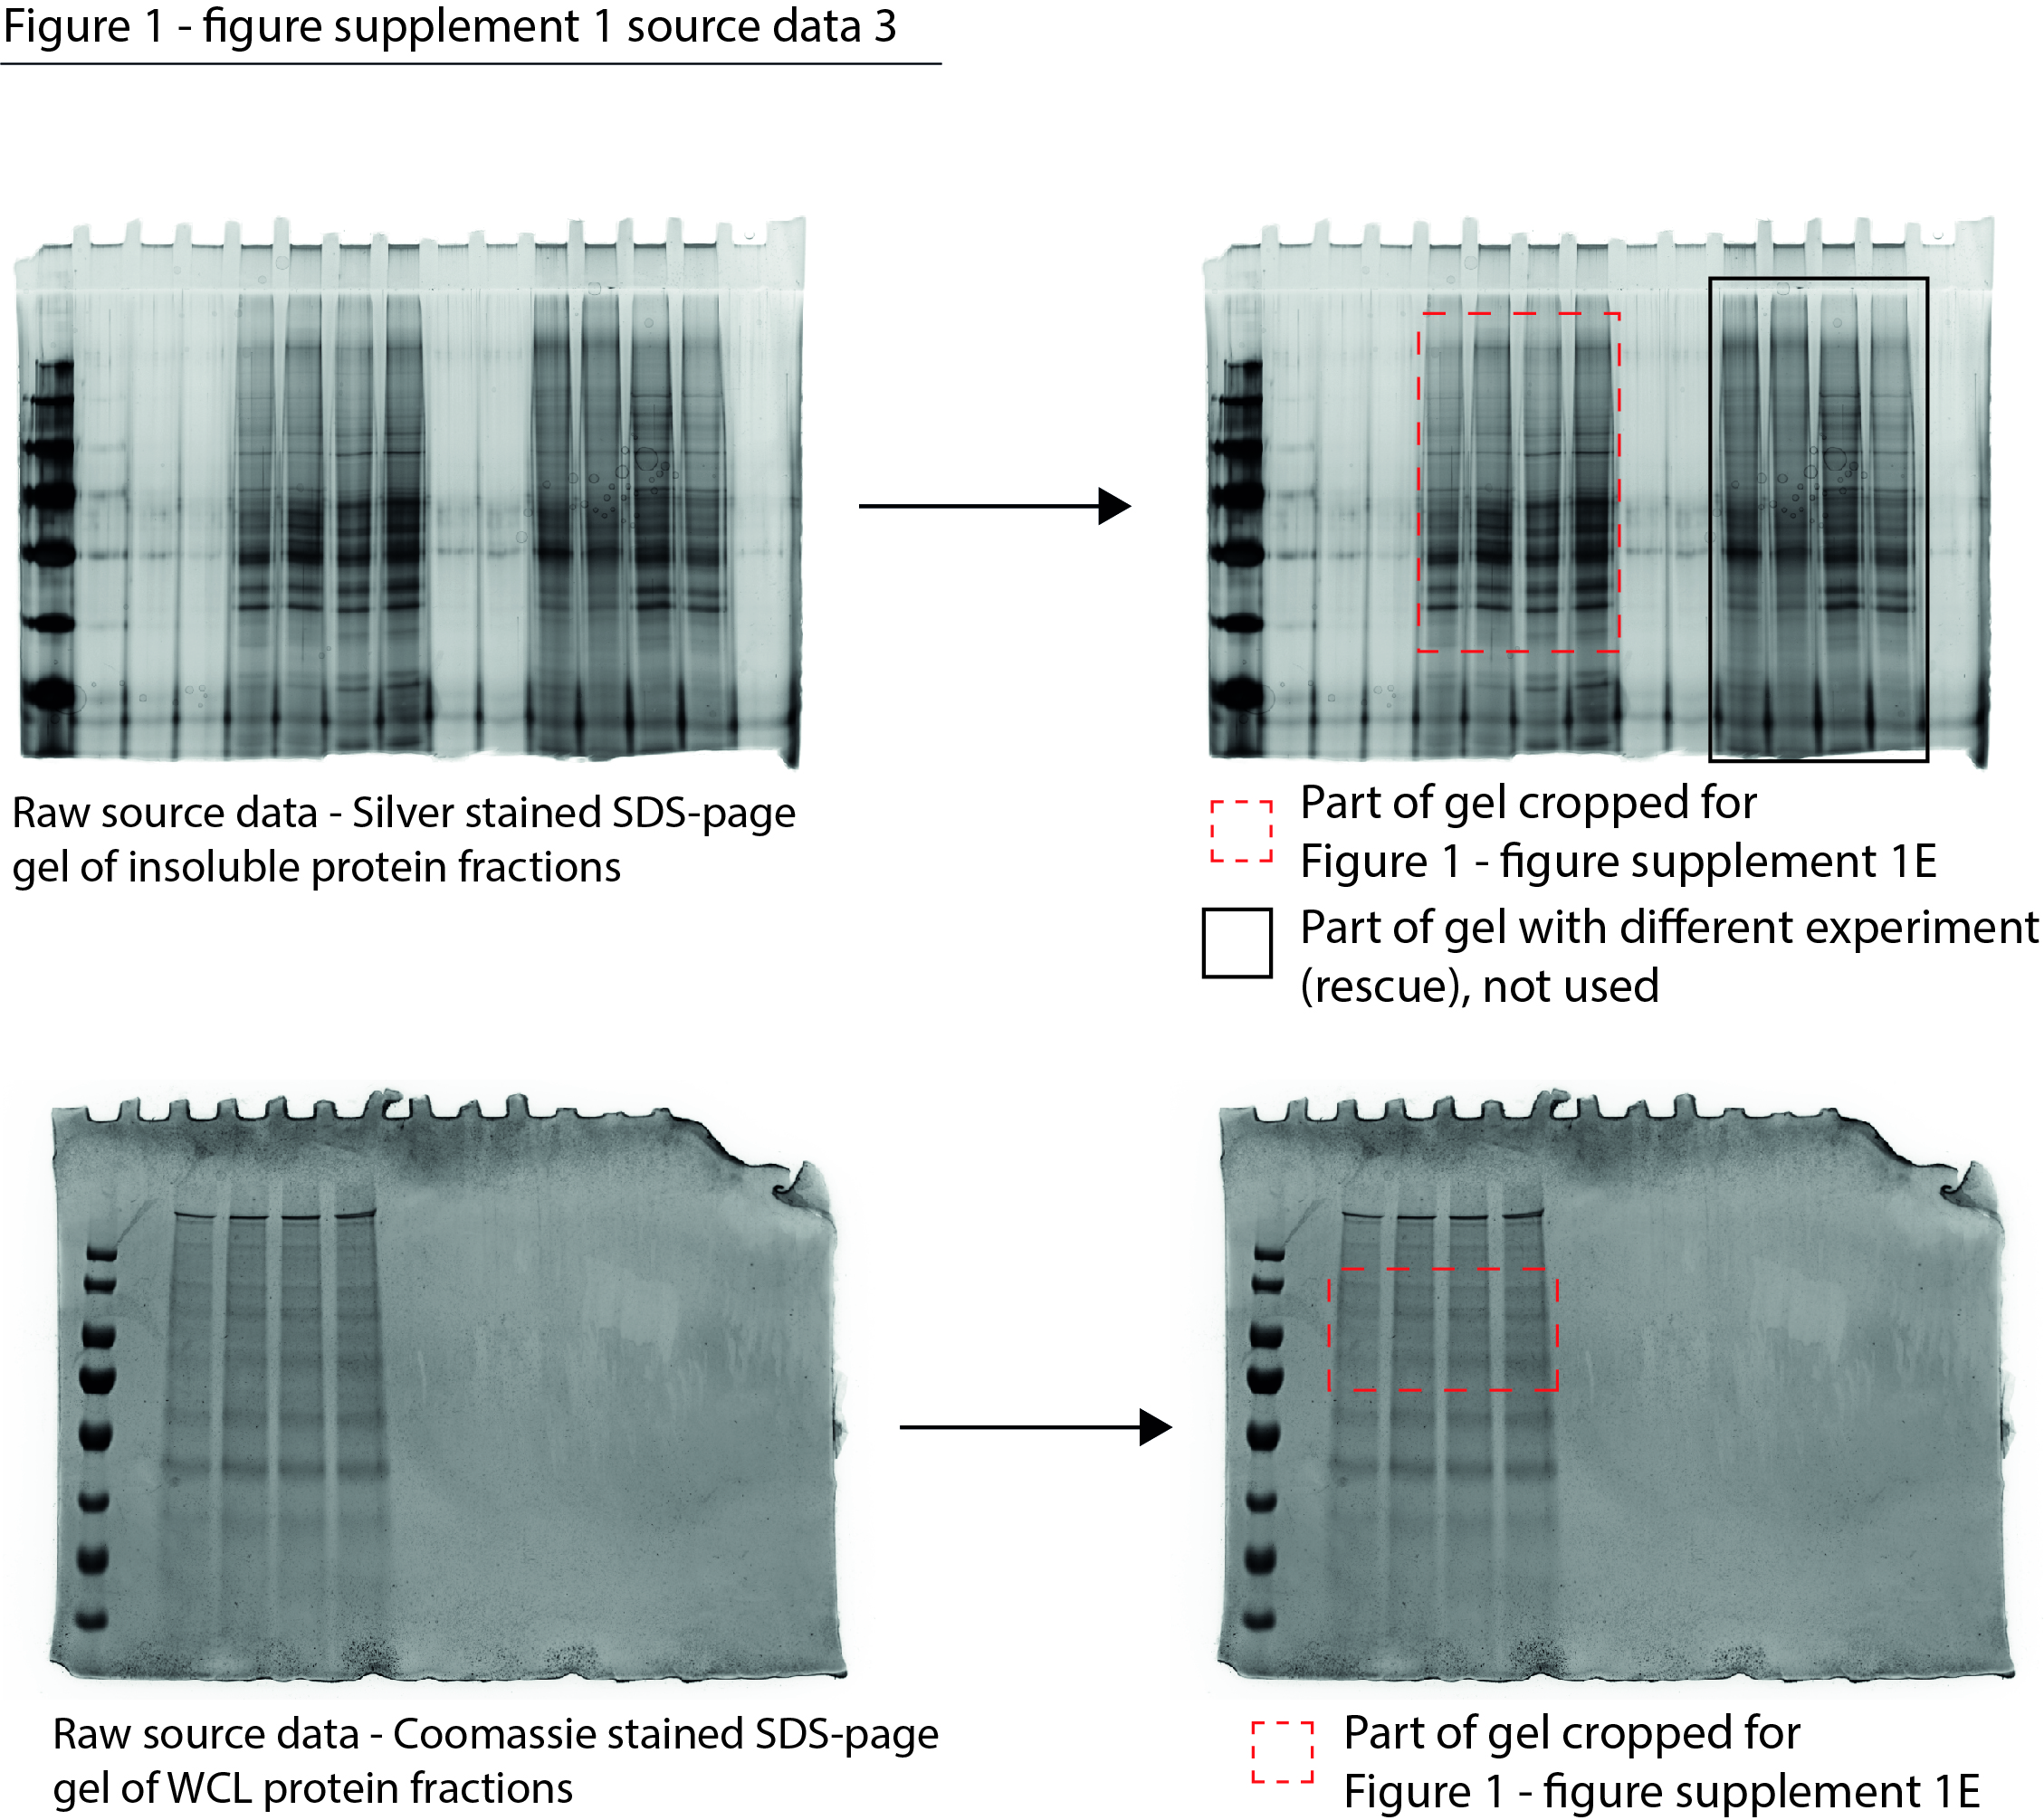
Figure 1—figure supplement 1—source data 3
Data from Figure 1—figure supplement 1E.
Raw Coomassie- and silver-stained SDS-PAGE gels with cropped parts indicated in red.
- https://cdn.elifesciences.org/articles/70726/elife-70726-fig1-figsupp1-data3-v2.jpg
-
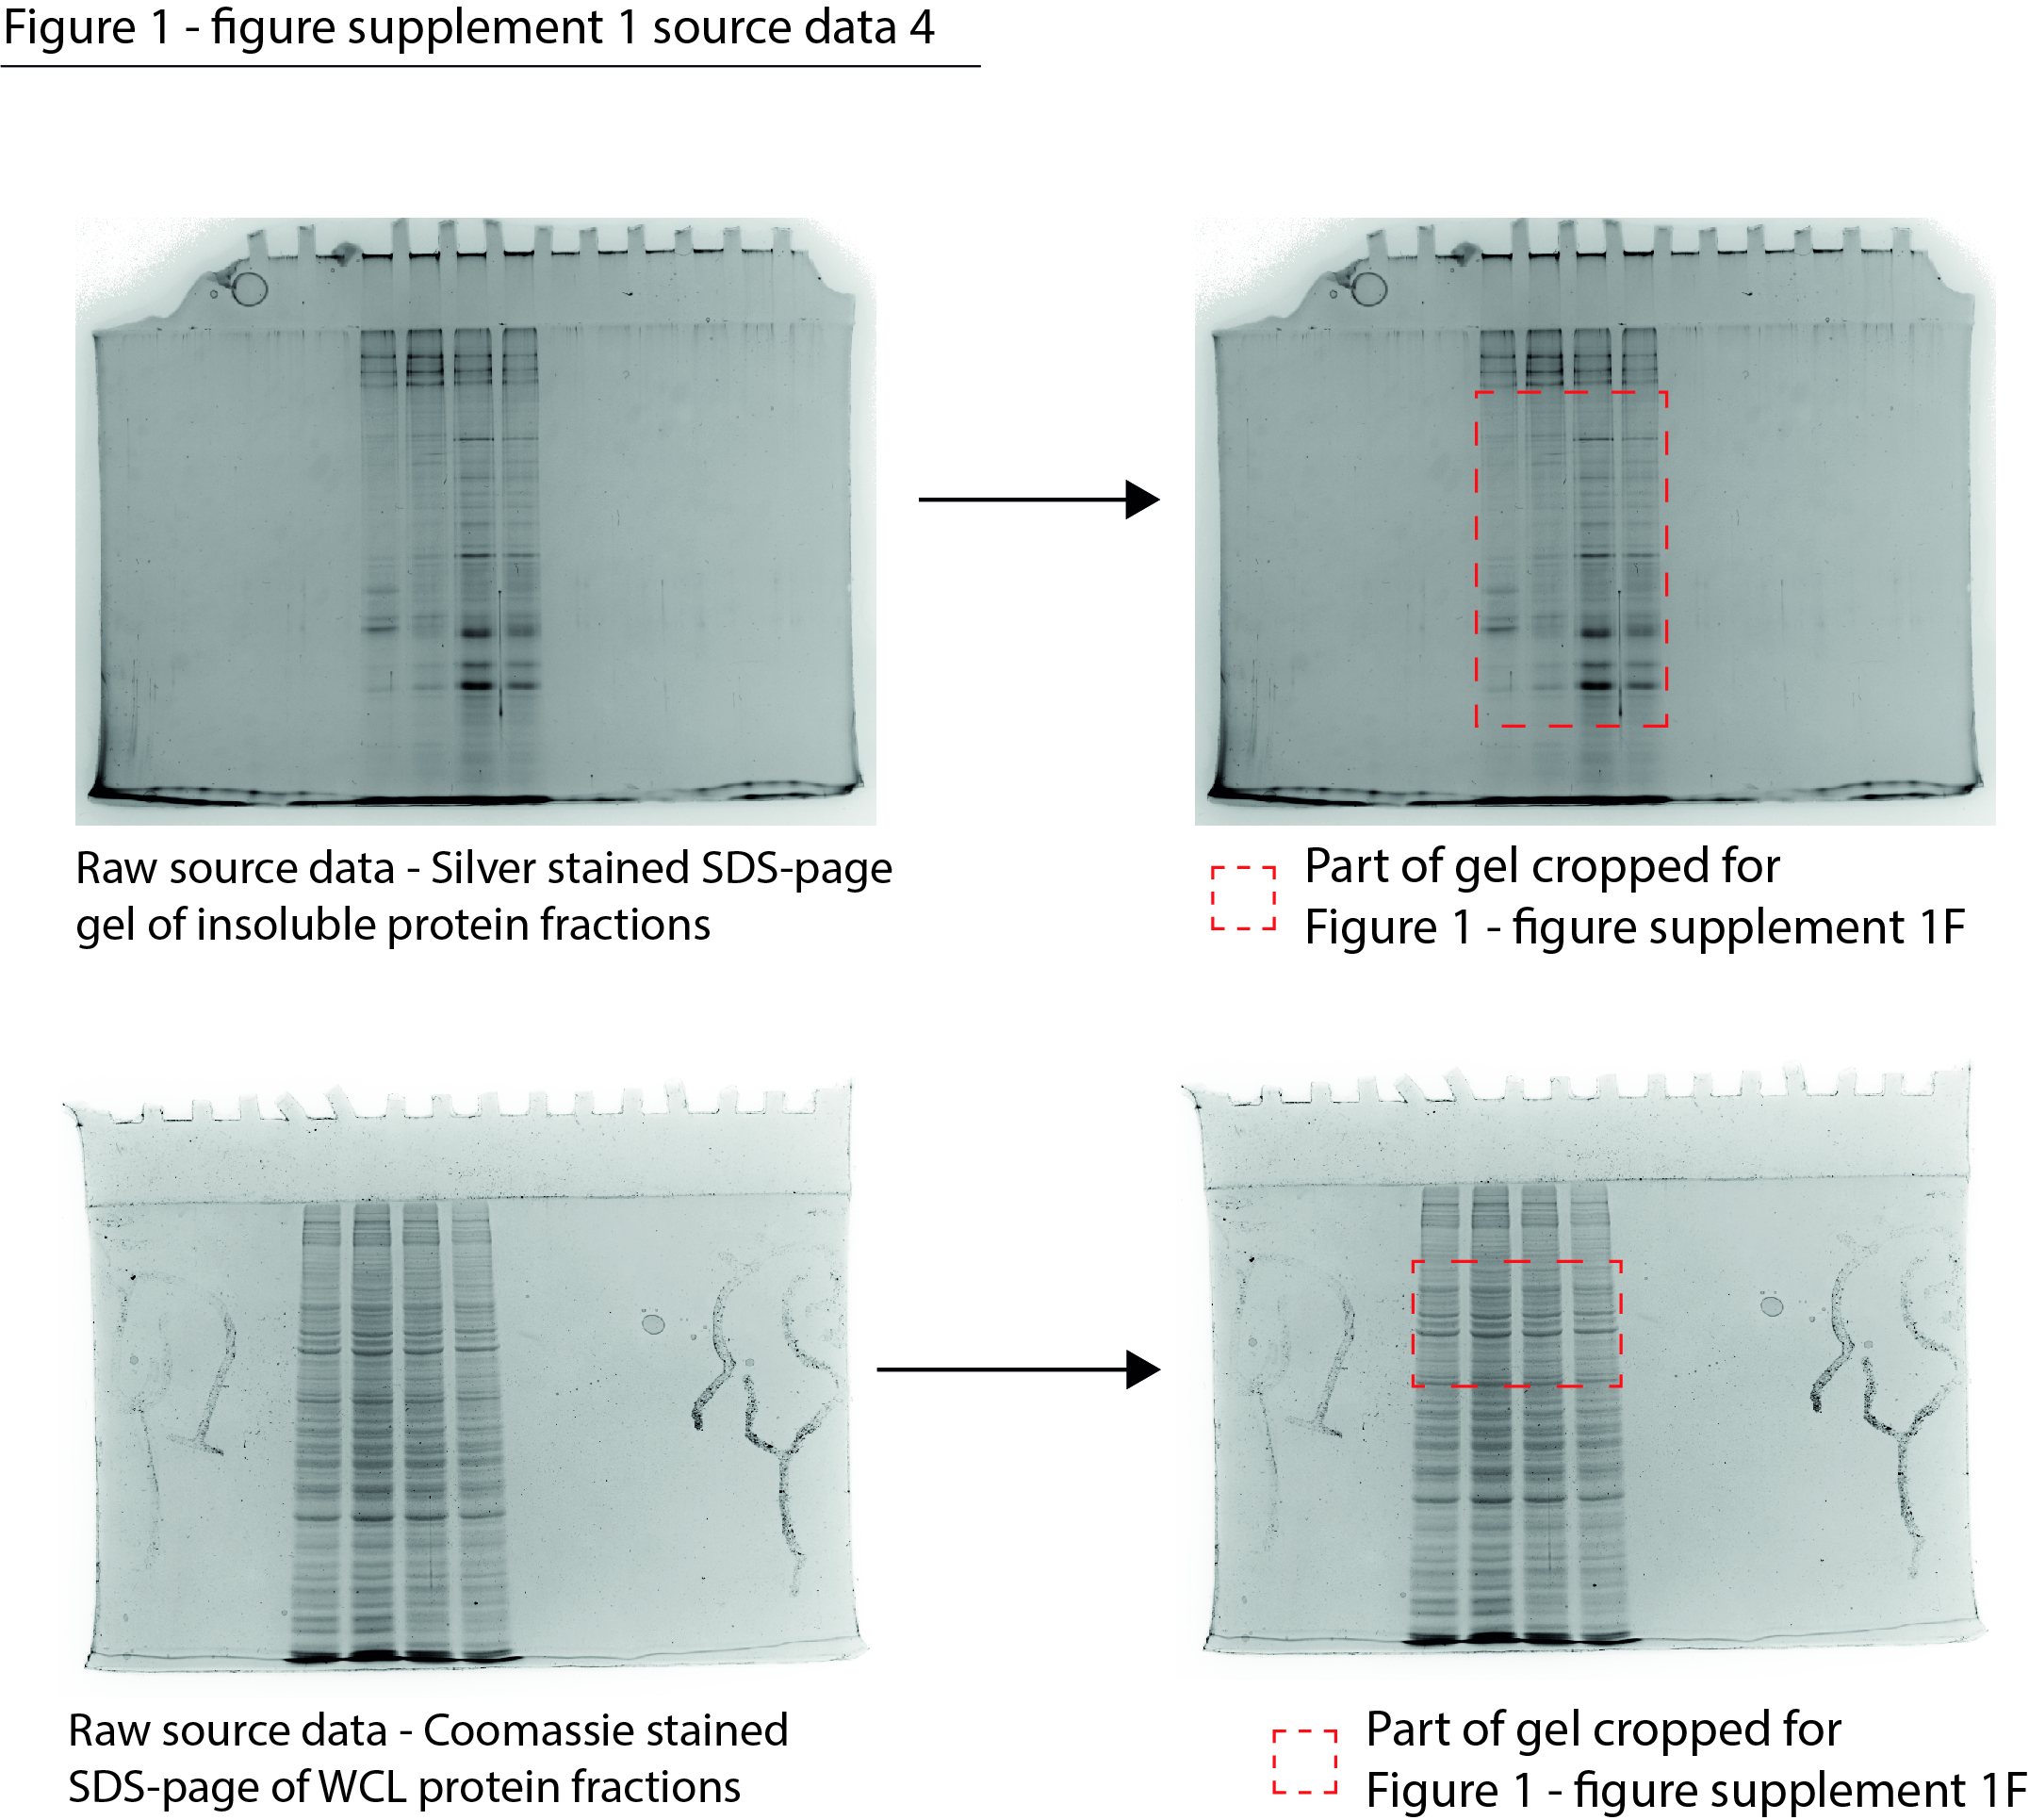
Figure 1—figure supplement 1—source data 4
Data from Figure 1—figure supplement 1F.
Raw Coomassie- and silver-stained SDS-PAGE gels with cropped parts indicated in red.
- https://cdn.elifesciences.org/articles/70726/elife-70726-fig1-figsupp1-data4-v2.jpg
Figure 2 with 1 supplement
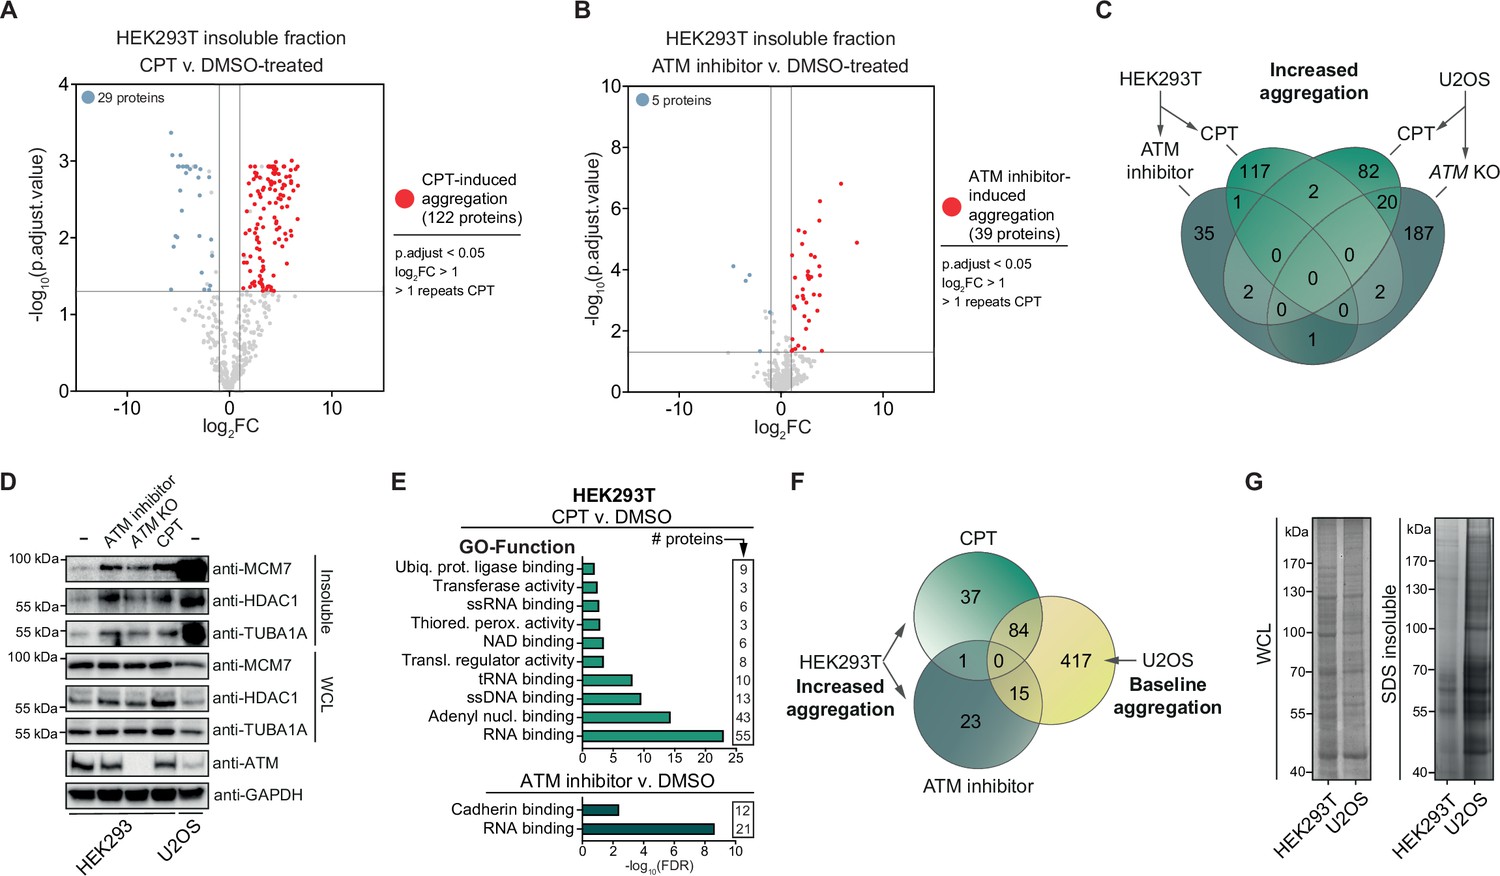
Camptothecin (CPT) and ataxia telangiectasia mutated (ATM) loss drives aggregation in a cell-type-dependent manner.
See also Figure 2—figure supplement 1. (A) Volcano plot of label-free quantification (LFQ) MS/MS analysis of the aggregated fractions of DMSO and CPT-treated HEK293T cells. n = 4. Only proteins identified in >1 repeats of either case or control are shown. (B) Volcano plot of LFQ MS/MS analysis of the aggregated fractions of DMSO and ATM inhibitor-treated HEK293T cells. n = 4. Only proteins identified in >1 repeats of either case or control are shown. (C) Venn diagram showing overlap between U2OS and HEK293T increased aggregation, after the indicated treatments. (D) Western blot using the indicated antibodies on the aggregated and whole-cell lysate (WCL) fractions of drug-treated and ATM KO HEK293 cells, and wild-type U2OS cells. n = 2. (E) GO term analysis (Function) of the increased aggregation in CPT- or ATM-inhibitor-treated HEK293T cells. (F) Venn diagram showing overlap between increased aggregation after the indicated treatments in HEK293T cells and baseline aggregation in U2OS cells. (G) Aggregated (silver stain) and WCL (Coomassie) fractions of untreated HEK293T and U2OS cells. n = 2.
-
Figure 2—source data 1
Data from Figure 2D.
Raw Western blot images with each antibody annotated and cropped parts indicated in red.
- https://cdn.elifesciences.org/articles/70726/elife-70726-fig2-data1-v2.jpg
-
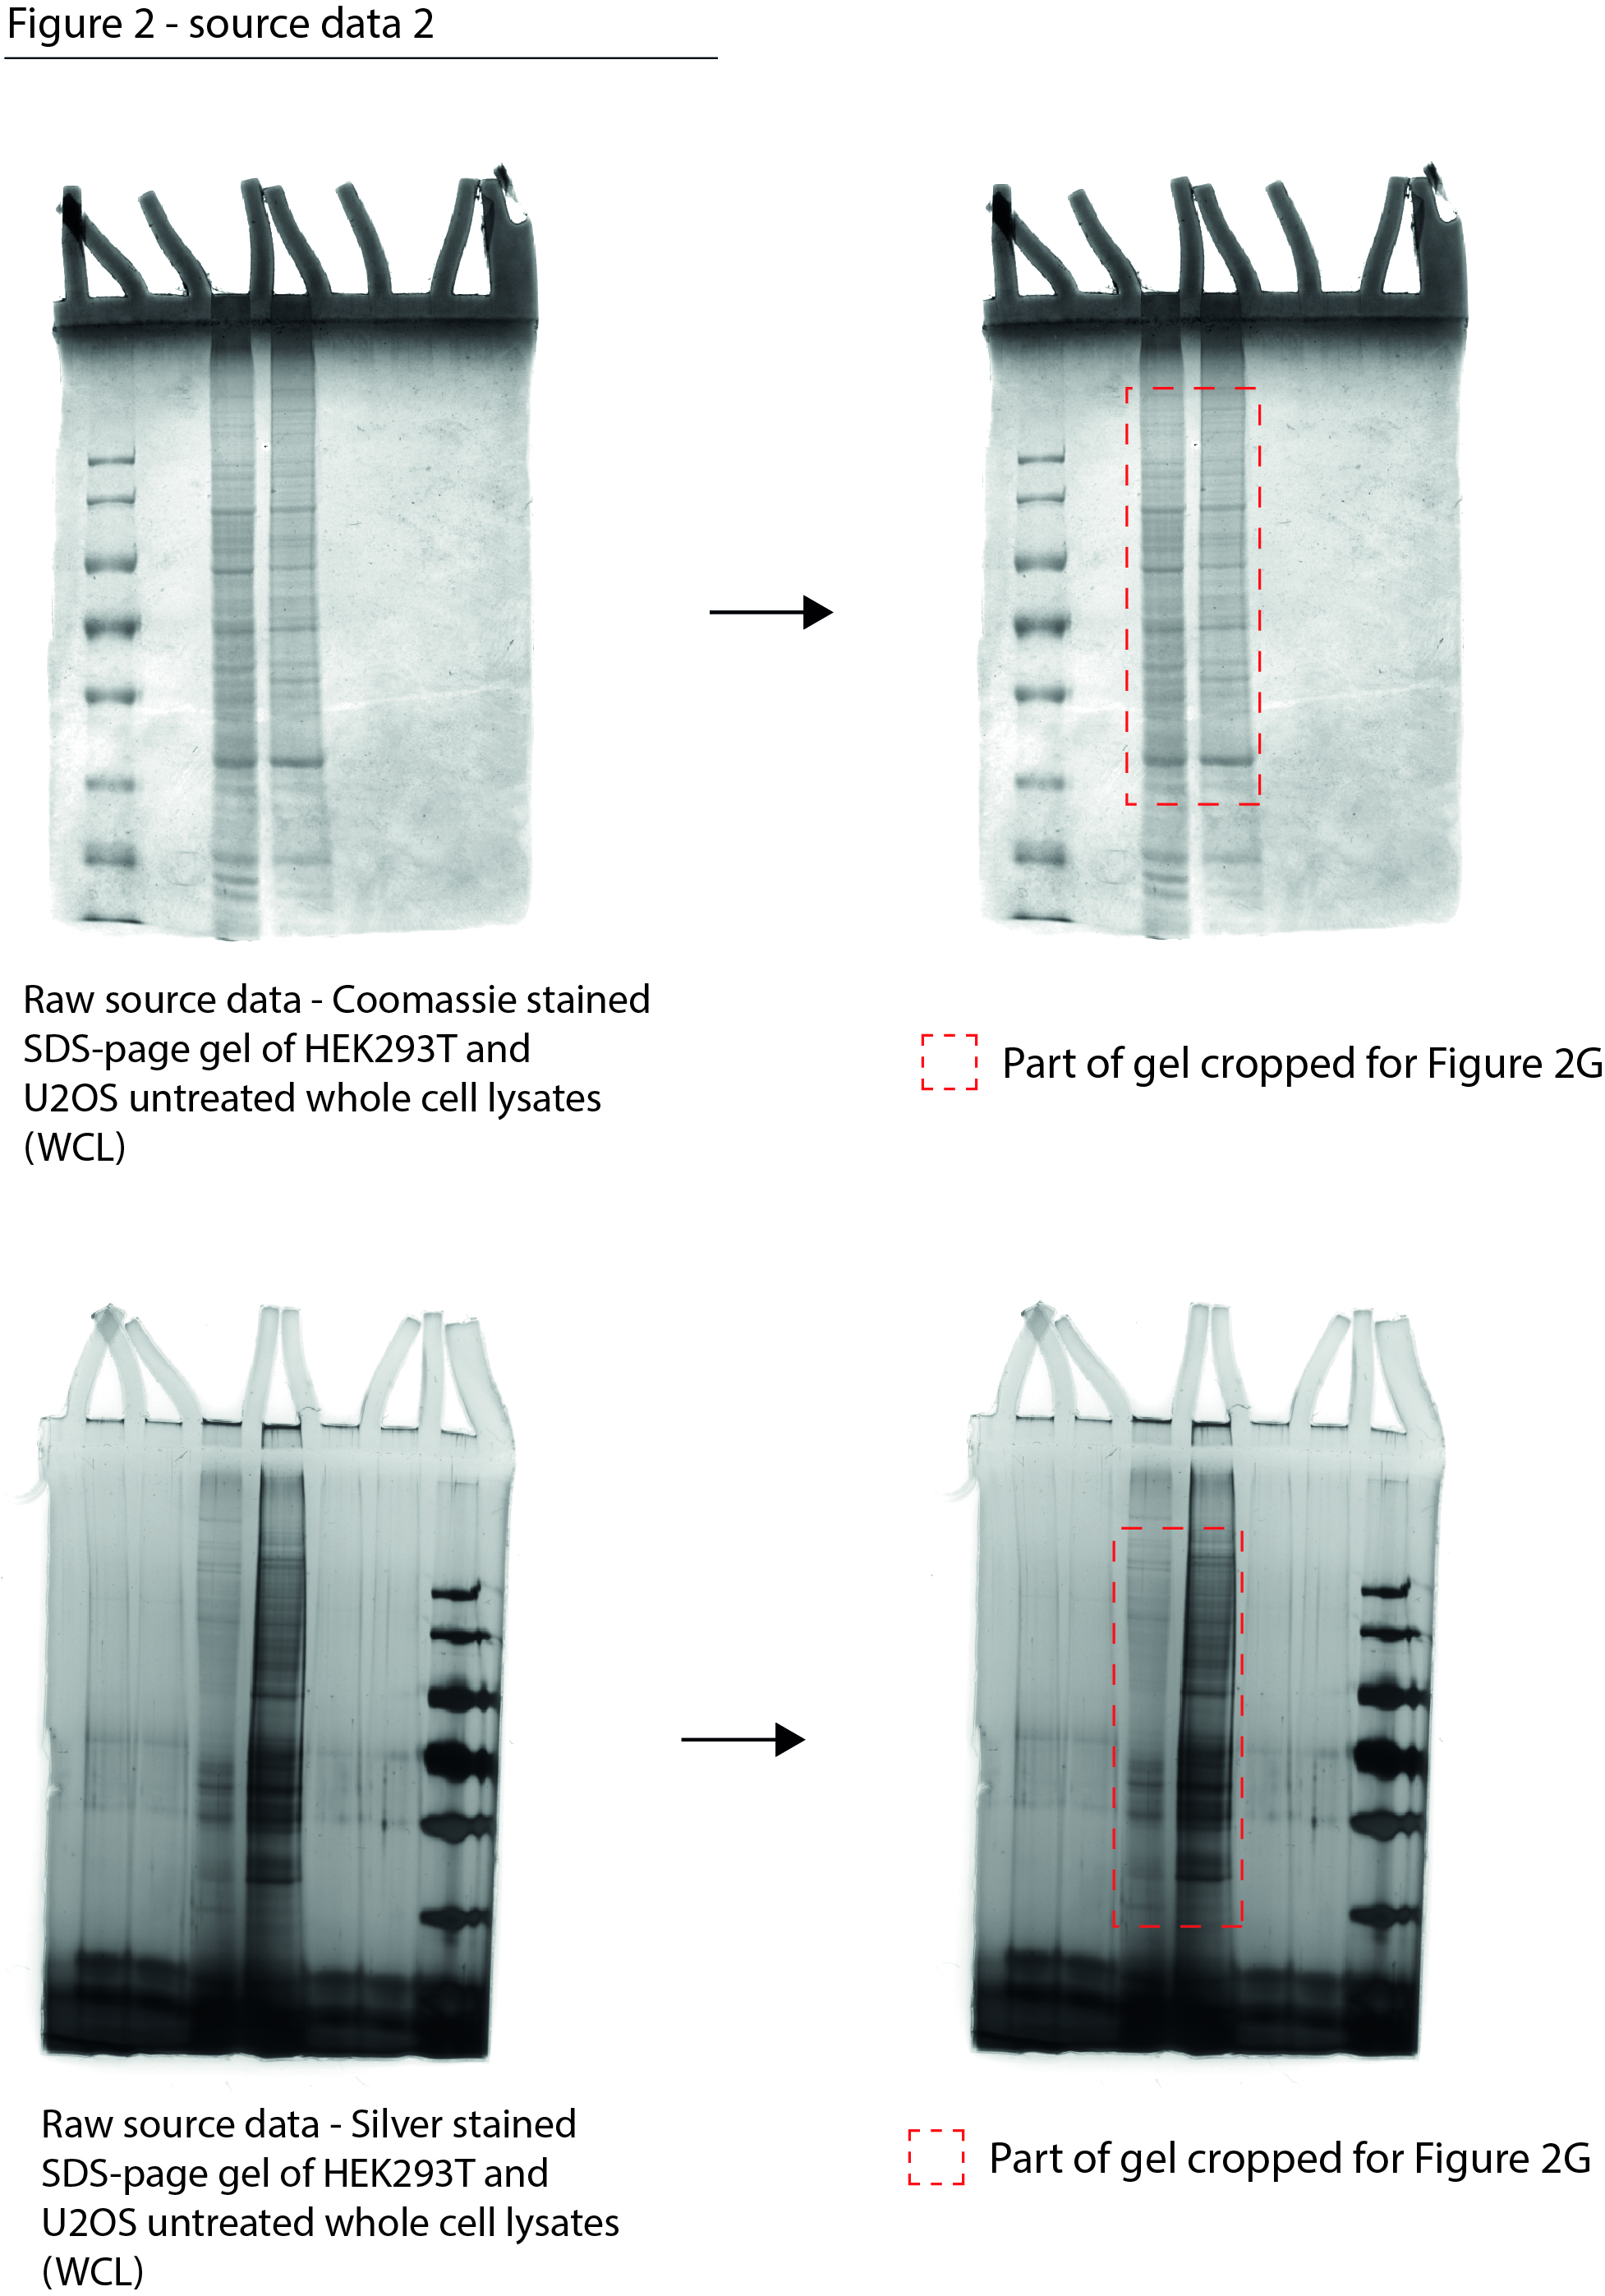
Figure 2—source data 2
Data from Figure 2G.
Raw Coomassie- and silver-stained SDS-PAGE gels with cropped parts indicated in red.
- https://cdn.elifesciences.org/articles/70726/elife-70726-fig2-data2-v2.jpg
Figure 2—figure supplement 1
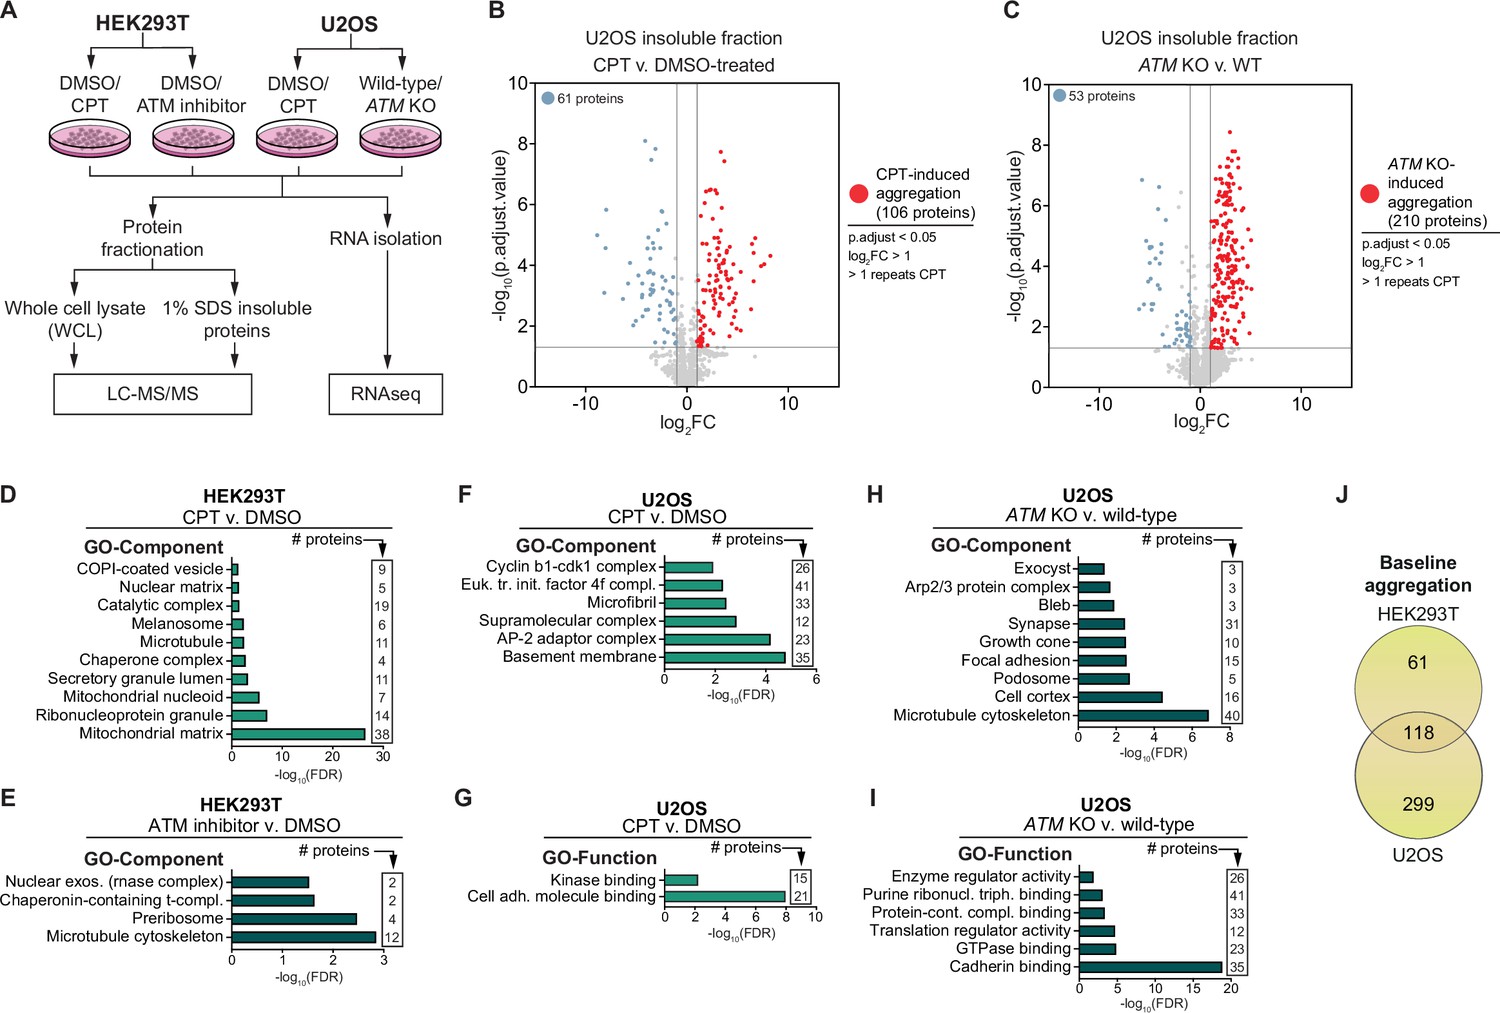
GO term analyses of the aggregation triggered by camptothecin (CPT) and ataxia telangiectasia mutated (ATM) loss.
(A) Experimental outline. All samples (whole-cell lysate [WCL], 1% SDS insoluble proteins, and RNA) were generated in parallel from the same cells in four independent repeats for each experiment. (B) Volcano plot of label-free quantification (LFQ) MS/MS analysis of U2OS wild-type and ATM KO cells. n = 4. Only proteins identified in >1 repeats of either case or control are shown. (C) Volcano plot of LFQ MS/MS analysis of U2OS cells DMSO or CPT treated. n = 4. Only proteins identified in >1 repeats of either case or control are shown. (D–I) GO term analysis (Component and Function) of the increased aggregation after the indicated treatment in the indicated cell line. GO terms with <2000 background genes (max 10 terms) are shown. (J) Venn diagram showing overlap between U2OS and HEK293T baseline aggregation.
Figure 3 with 2 supplements
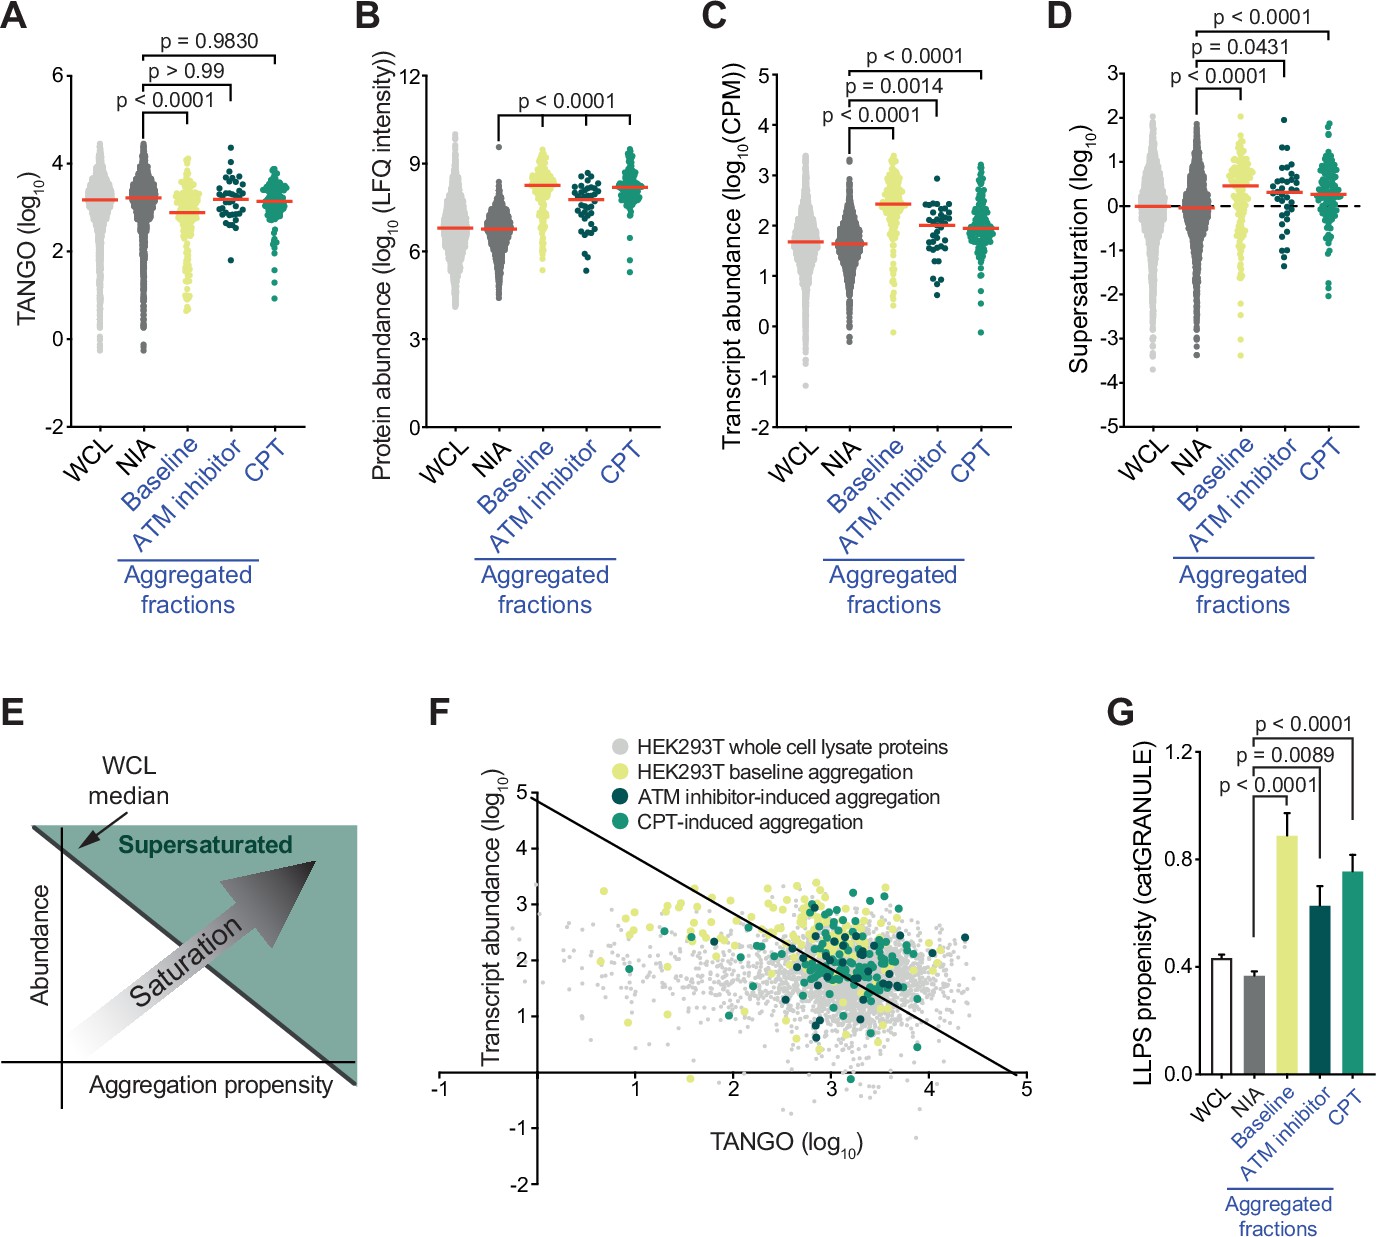
Proteins that aggregate after topoisomerase I poisoning are supersaturated and prone to engage in liquid-liquid phase separation (LLPS).
See also Figure 3—figure supplements 1 and 2. (A) TANGO scores of HEK293T whole-cell lysate (WCL), nonaggregated proteins (NIA), and aggregated fractions. (B) Protein abundance of HEK293T WCL, nonaggregated proteins (NIA), and aggregated fractions as measured by label-free quantification (LFQ) intensities. (C) Transcript abundances of HEK293T WCL, nonaggregated proteins (NIA), and aggregated fractions (as measured by RNAseq). (D) Supersaturation scores of HEK293T WCL, nonaggregated proteins (NIA), and aggregated fractions. (E) Clarification of (F). (F) Transcript abundances (as measured by RNAseq) plotted against TANGO scores for the complete HEK293T MS/MS analysis. Proteins above the diagonal (=HEK293T median saturation score, calculated using the HEK293T WCL dataset) are relatively supersaturated. (G) catGRANULE scores for the indicated protein fractions in HEK293T cells. In all graphs, individual proteins and median values (red lines) are shown. p-Values are obtained by Kruskal–Wallis tests followed by Dunn’s correction for multiple comparisons.
Figure 3—figure supplement 1
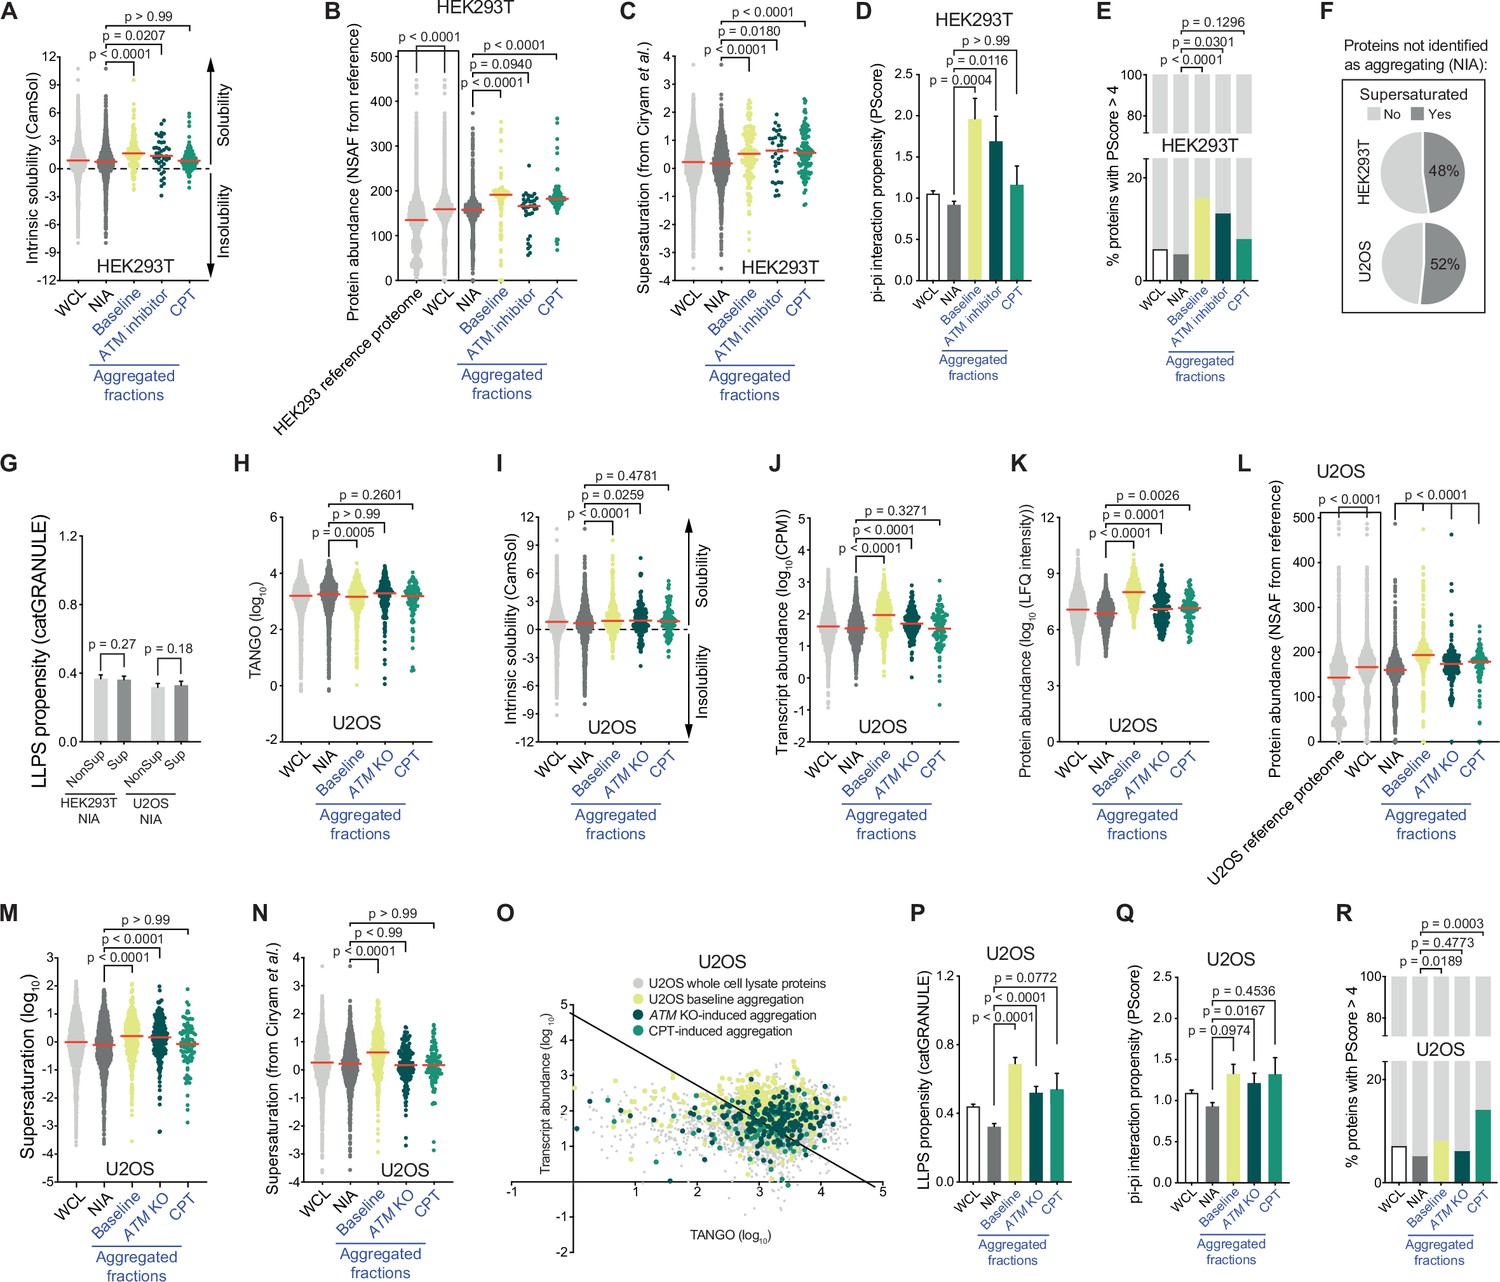
Proteins that aggregate after camptothecin treatment and ataxia telangiectasia mutated (ATM) loss represent a vulnerable subfraction of the proteome.
(A) CamSol-intrinsic (in)solubility scores of complete whole-cell lysate (WCL), nonaggregated proteins (NIA), and aggregated fractions in HEK293T cells. Dotted line indicates the theoretical threshold of relative intrinsic (in)solubility. See text for reference. (B) Protein abundances of HEK293T WCL and aggregated fractions obtained by cross-referencing with a HEK293 NSAF (normalized spectral abundance factor) reference proteome, as well as the protein abundances of the entire HEK293 reference proteome itself (see text for reference). (C) Supersaturation scores obtained by cross-referencing with the human composite supersaturation database generated by Ciryam et al. (see text for reference) for HEK293T cells. (D) PScores of complete WCL, nonaggregated proteins (NIA), and aggregated fractions in HEK293T. (E) Presence of proteins with a high PScore (> 4) in the indicated fractions in HEK293T. See also text. (F) Distribution of supersaturated (Sup) and non-supersaturated (NonSup) proteins in the HEK293T and U2OS NIA fractions. (G). catGRANULE scores of supersaturated (Sup) and non-supersaturated (NonSup) proteins in HEK293T and U2OS NIA fractions. (H) TANGO scores of complete WCL, nonaggregated proteins (NIA), and aggregated fractions in U2OS cells. (I) CamSol-intrinsic (in)solubility scores of complete WCL, nonaggregated proteins (NIA), and aggregated fractions in U2OS cells. Dotted line indicates the theoretical threshold of relative intrinsic (in)solubility. (J) Transcript abundances (as measured by RNAseq) of the indicated fractions in U2OS cells. (K) Protein abundance as measured by label-free quantification (LFQ) intensities of the indicated fractions in U2OS cells. (L) Protein abundances of U2OS WCL and aggregated fractions obtained by cross-referencing with a U2OS normalized spectral abundance factor (NSAF) reference proteome, as well as the protein abundances of the entire U2OS reference proteome itself (see text for reference). (M) Supersaturation scores for the indicated protein fractions in U2OS cells. (N) Supersaturation scores obtained by cross-referencing with the supersaturation database generated by Ciryam et al. (see text for reference) for U2OS cells. (O) Transcript abundances (as measured by RNAseq) plotted against TANGO scores for the complete U2OS MS analysis. All proteins above the diagonal (=U2 OS median saturation score, calculated using the U2OS WCL dataset) are relatively supersaturated. See also Figure 3E and F. (P) catGRANULE scores for the indicated protein fractions in U2OS cells. (Q) PScores of complete WCL, nonaggregated proteins (NIA), and aggregated fractions in U2OS. (R) Presence of proteins with a high PScore (>4) in the indicated fractions in U2OS. For all bar graphs, bars represent mean ± SEM. For all other graphs, circles represent individual proteins, red lines indicate the median value. p-Values are obtained by Kruskal–Wallis tests followed by Dunn’s correction for multiple comparisons, except in N, where two-tailed Mann–Whitney tests were used.
Figure 3—figure supplement 2
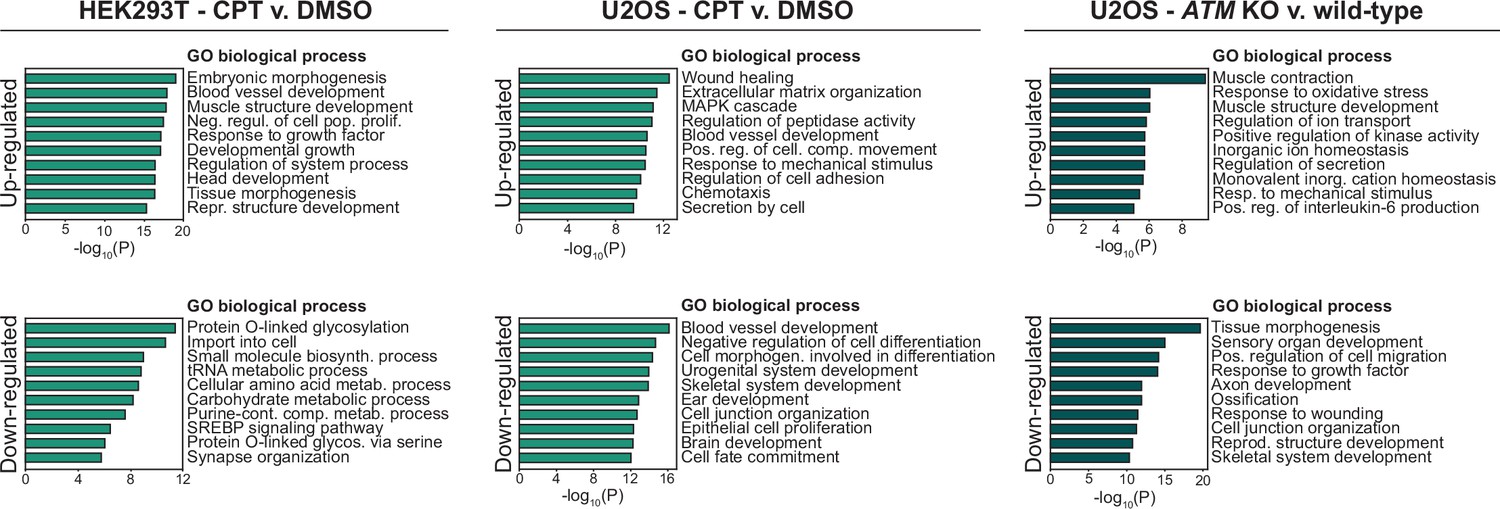
GO term analyses of RNAseq data.
GO term analysis of the differentially expressed genes (–1 > log2FC > 1) RNAseq data of the indicated cell line after the indicated treatment. Upper panels: upregulated processes are shown. Lower panels: downregulated processes are shown. Note that HEK293T cells treated with ataxia telangiectasia mutated (ATM) inhibitor are not included as only two genes were differentially expressed (see also Supplementary file 2).
Figure 4 with 2 supplements
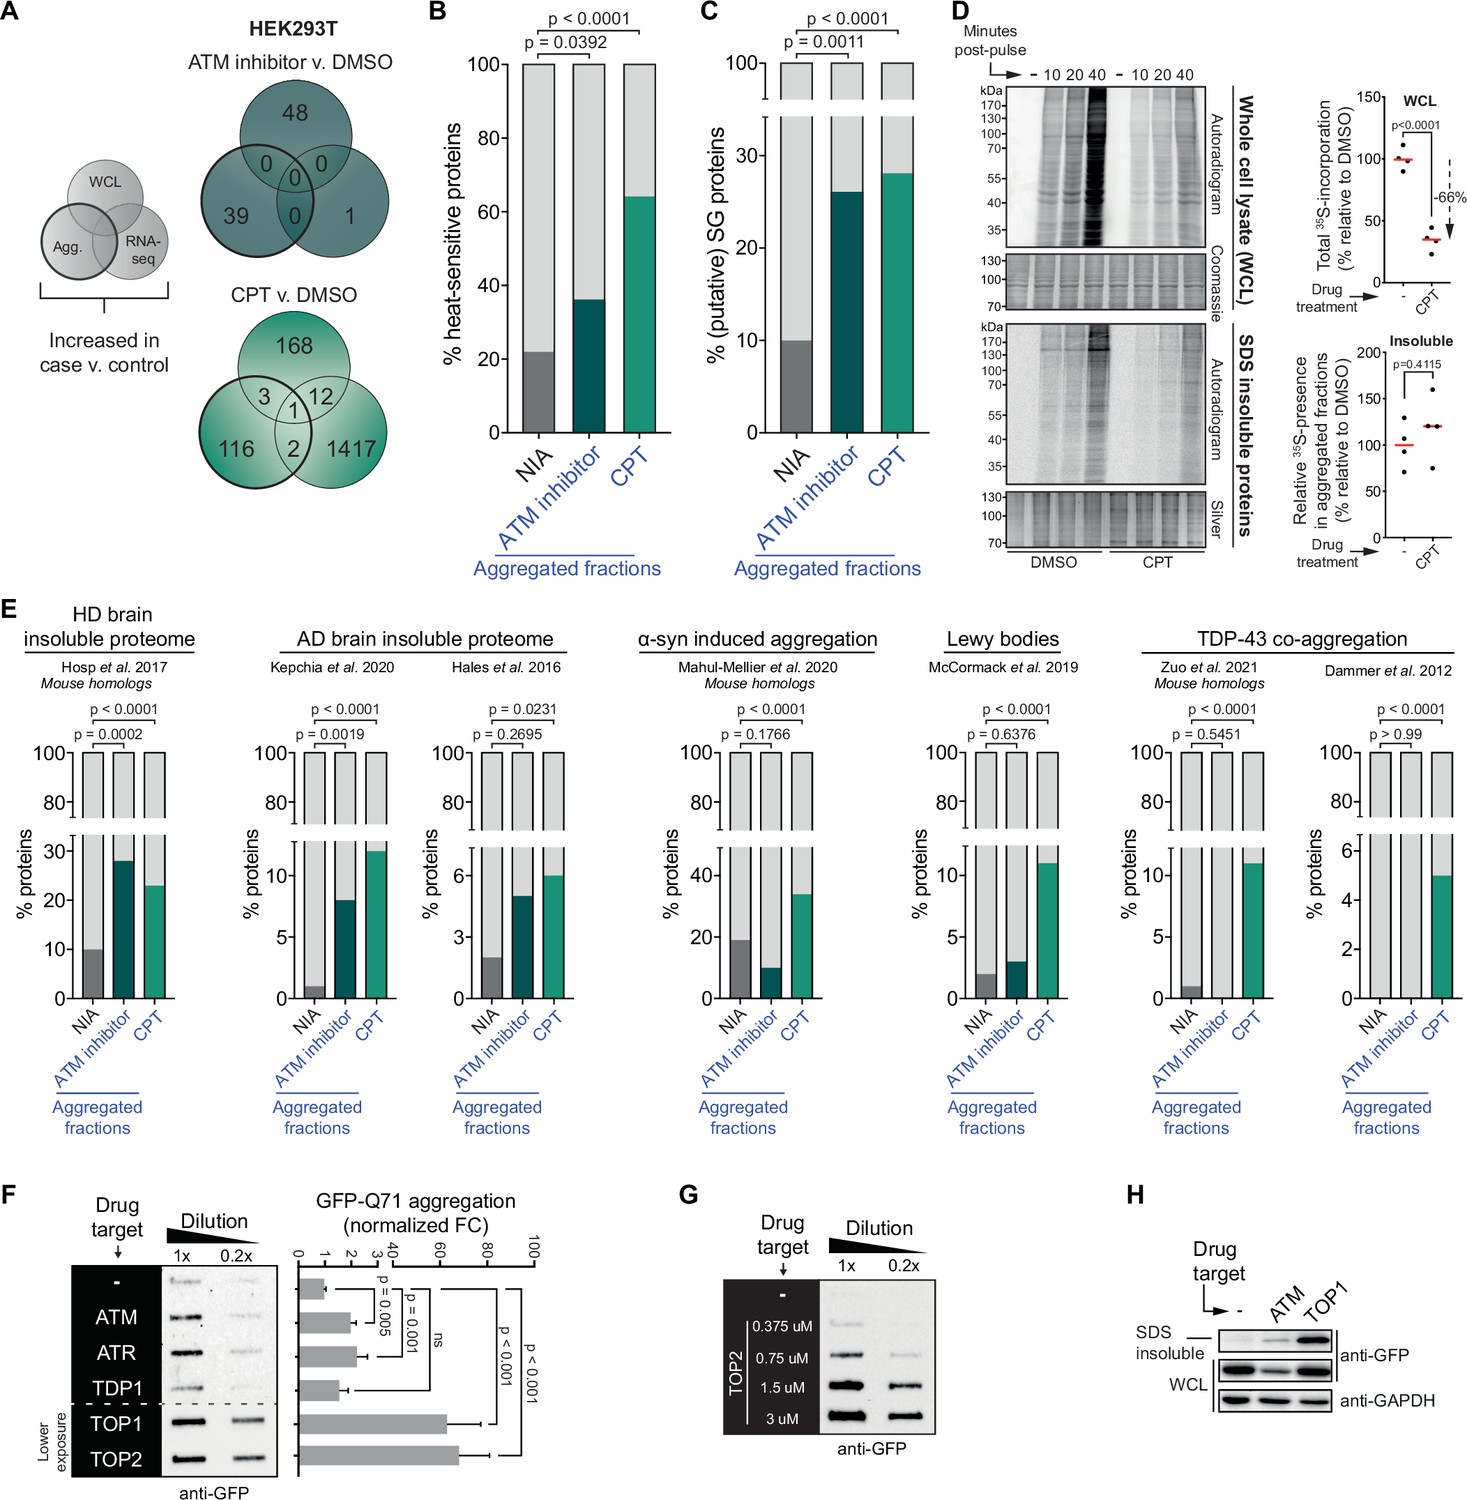
The cell-intrinsic aggregation threshold is lowered upon targeting ataxia telangiectasia mutated (ATM), ataxia telangiectasia and Rad3-related (ATR), or DNA topoisomerases.
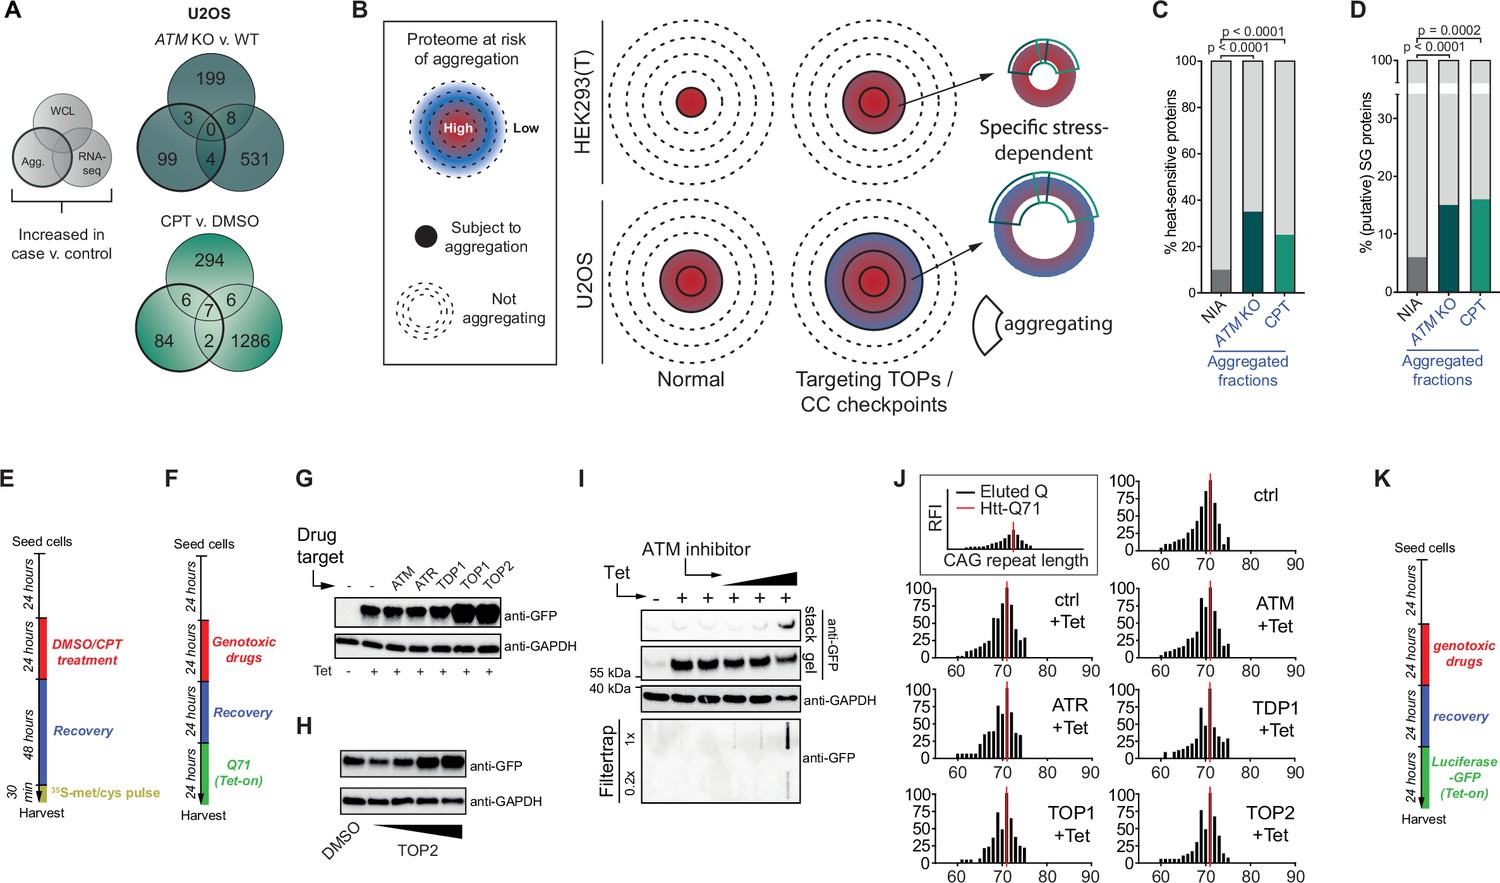
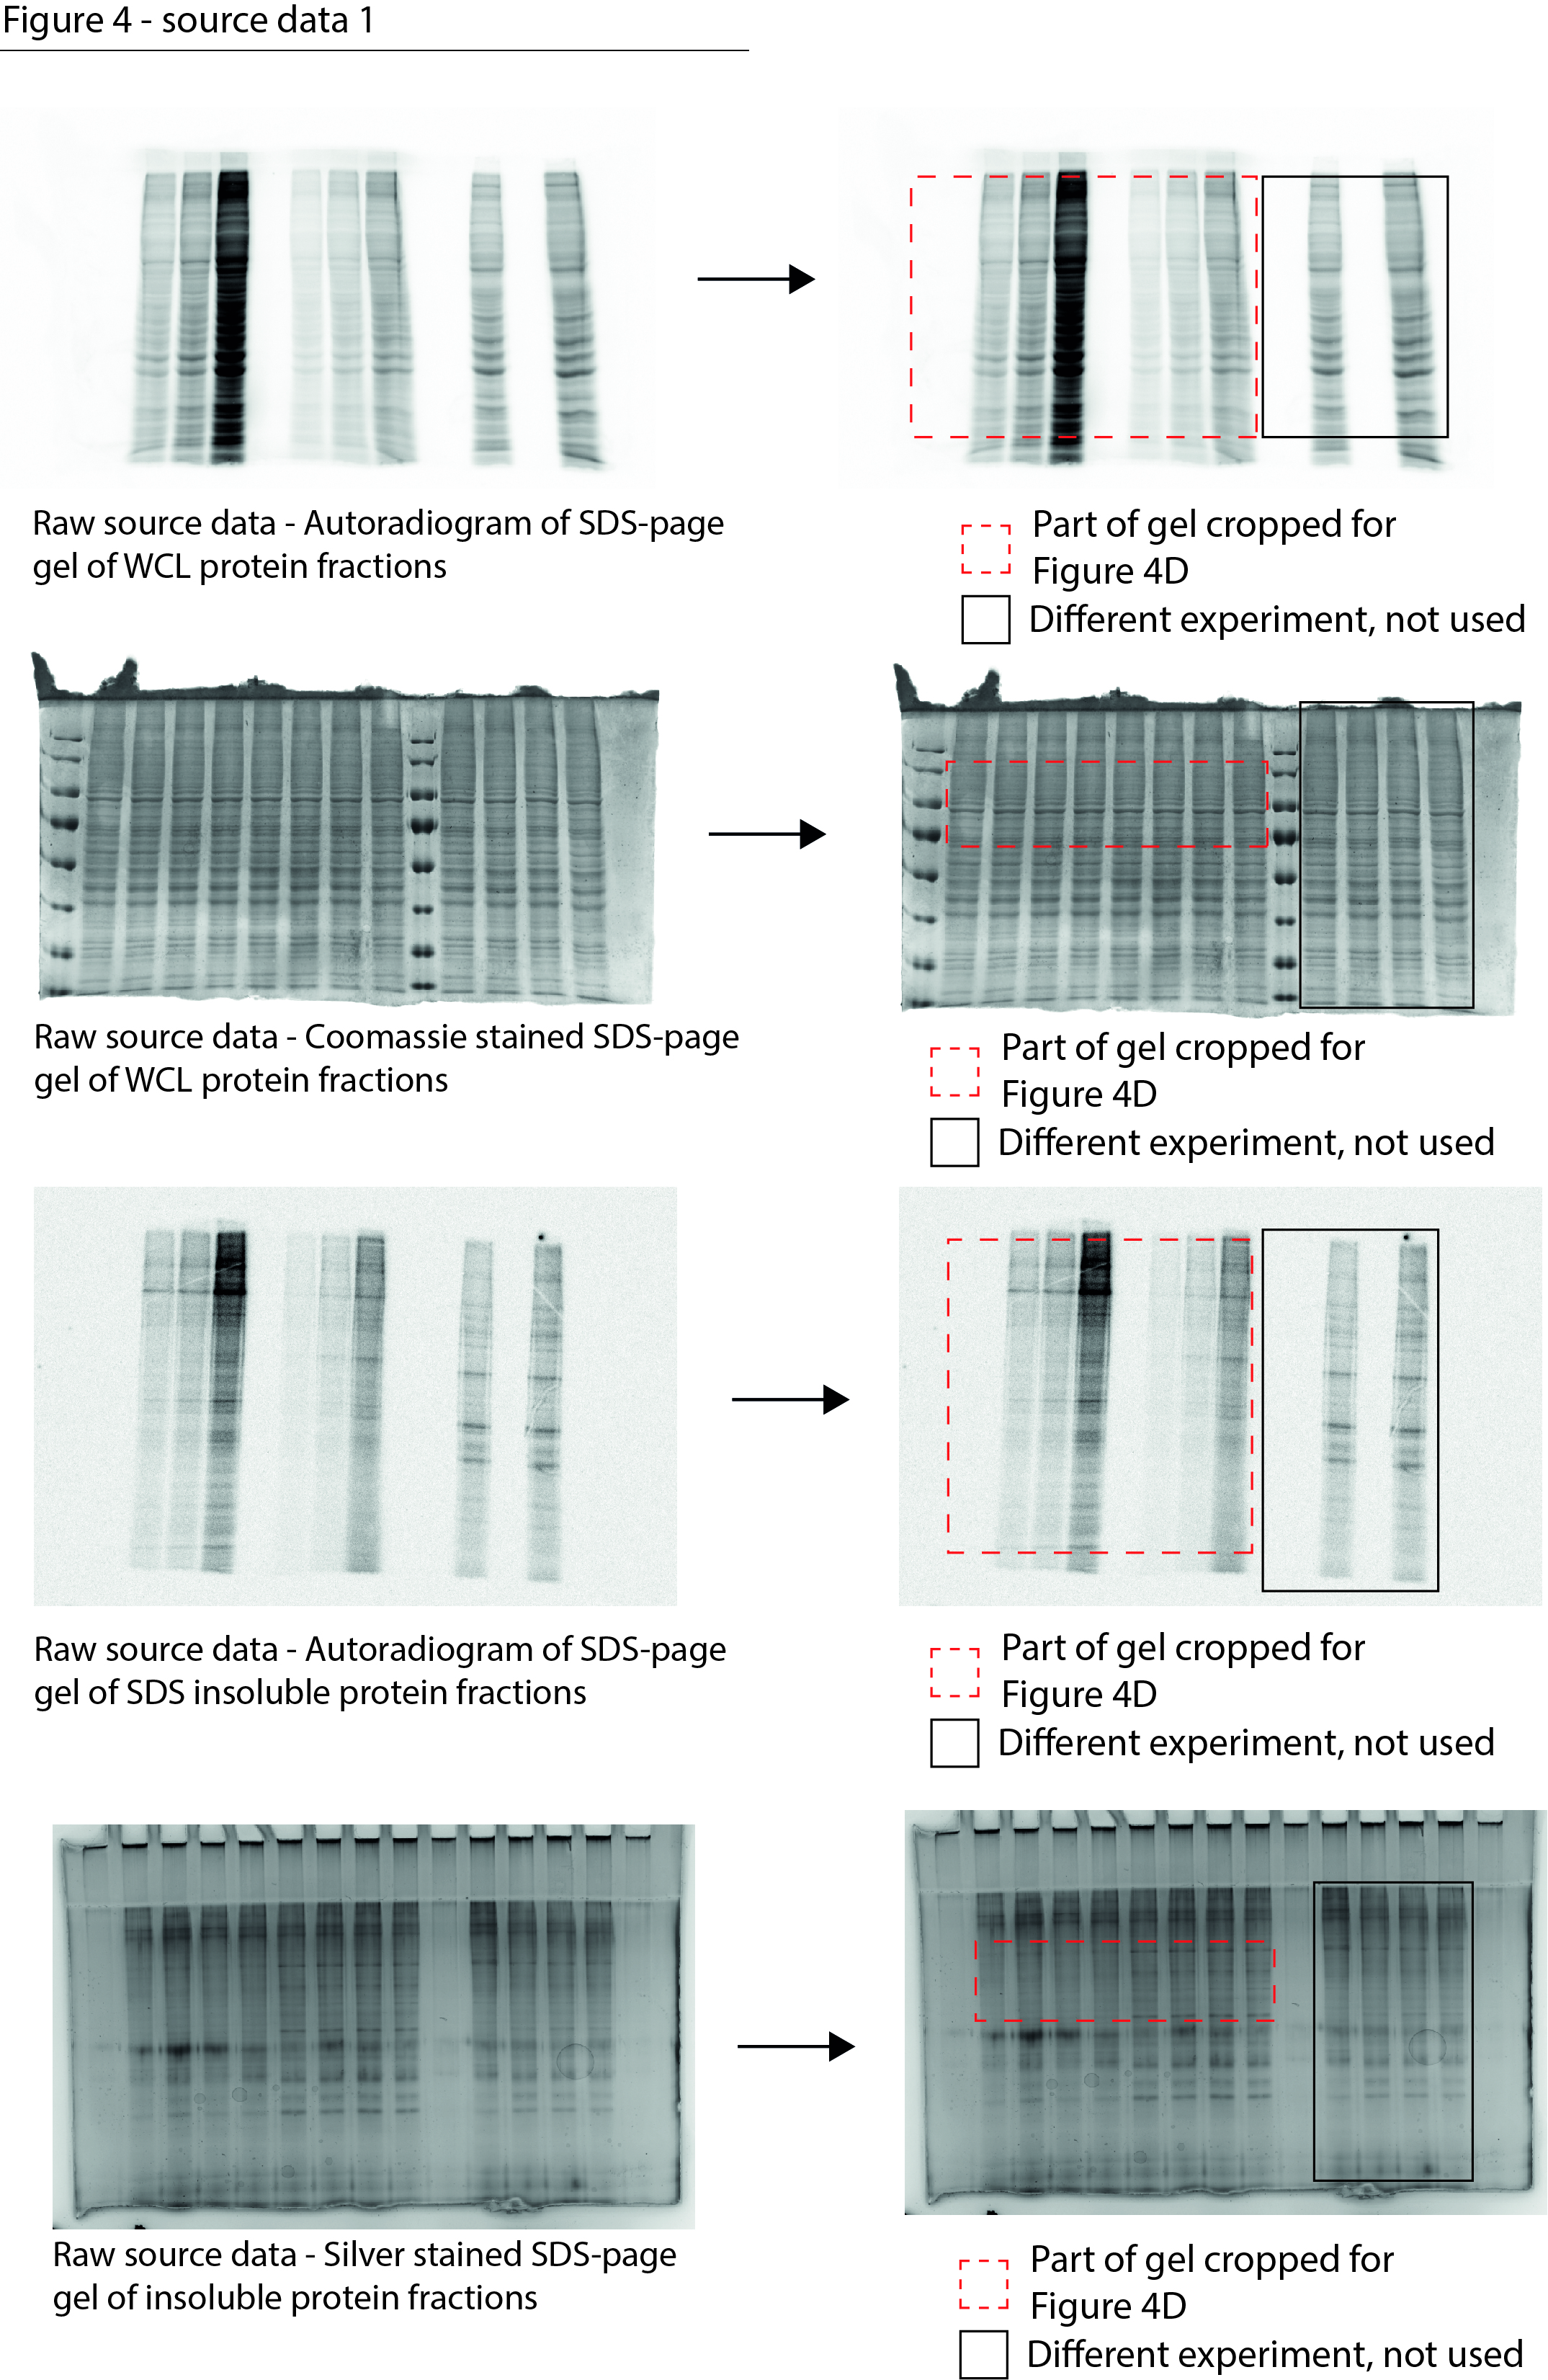
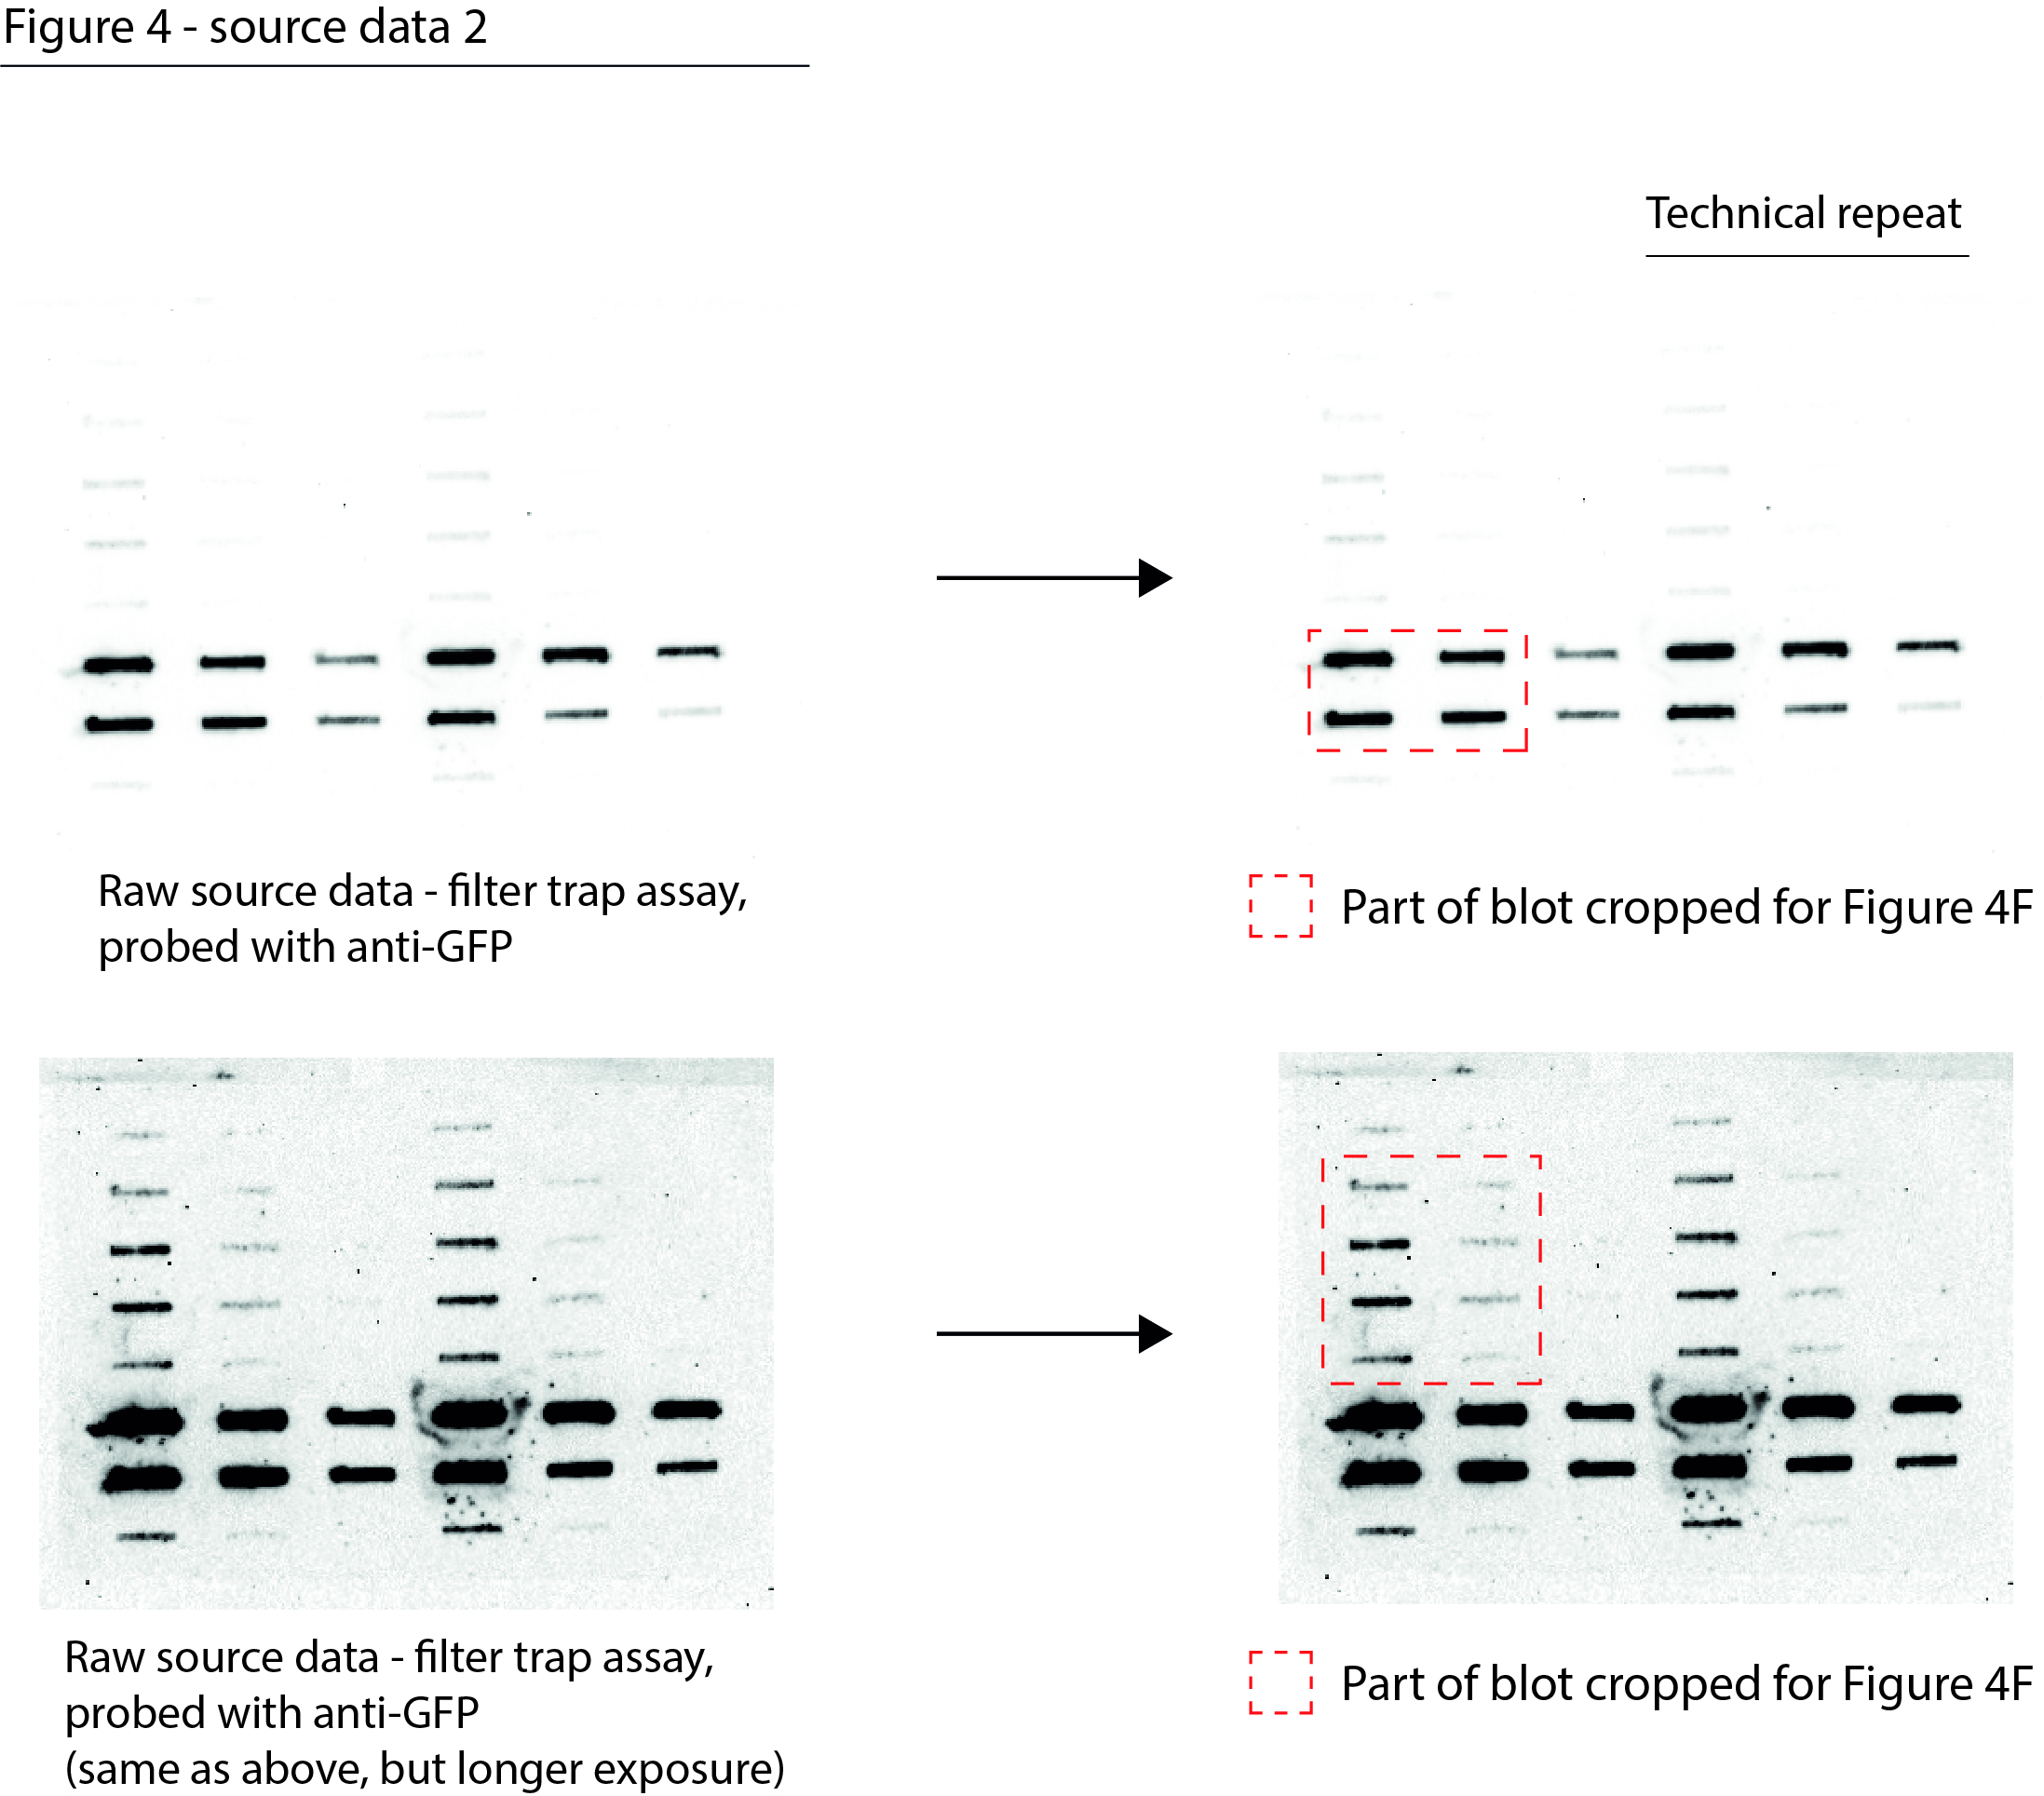
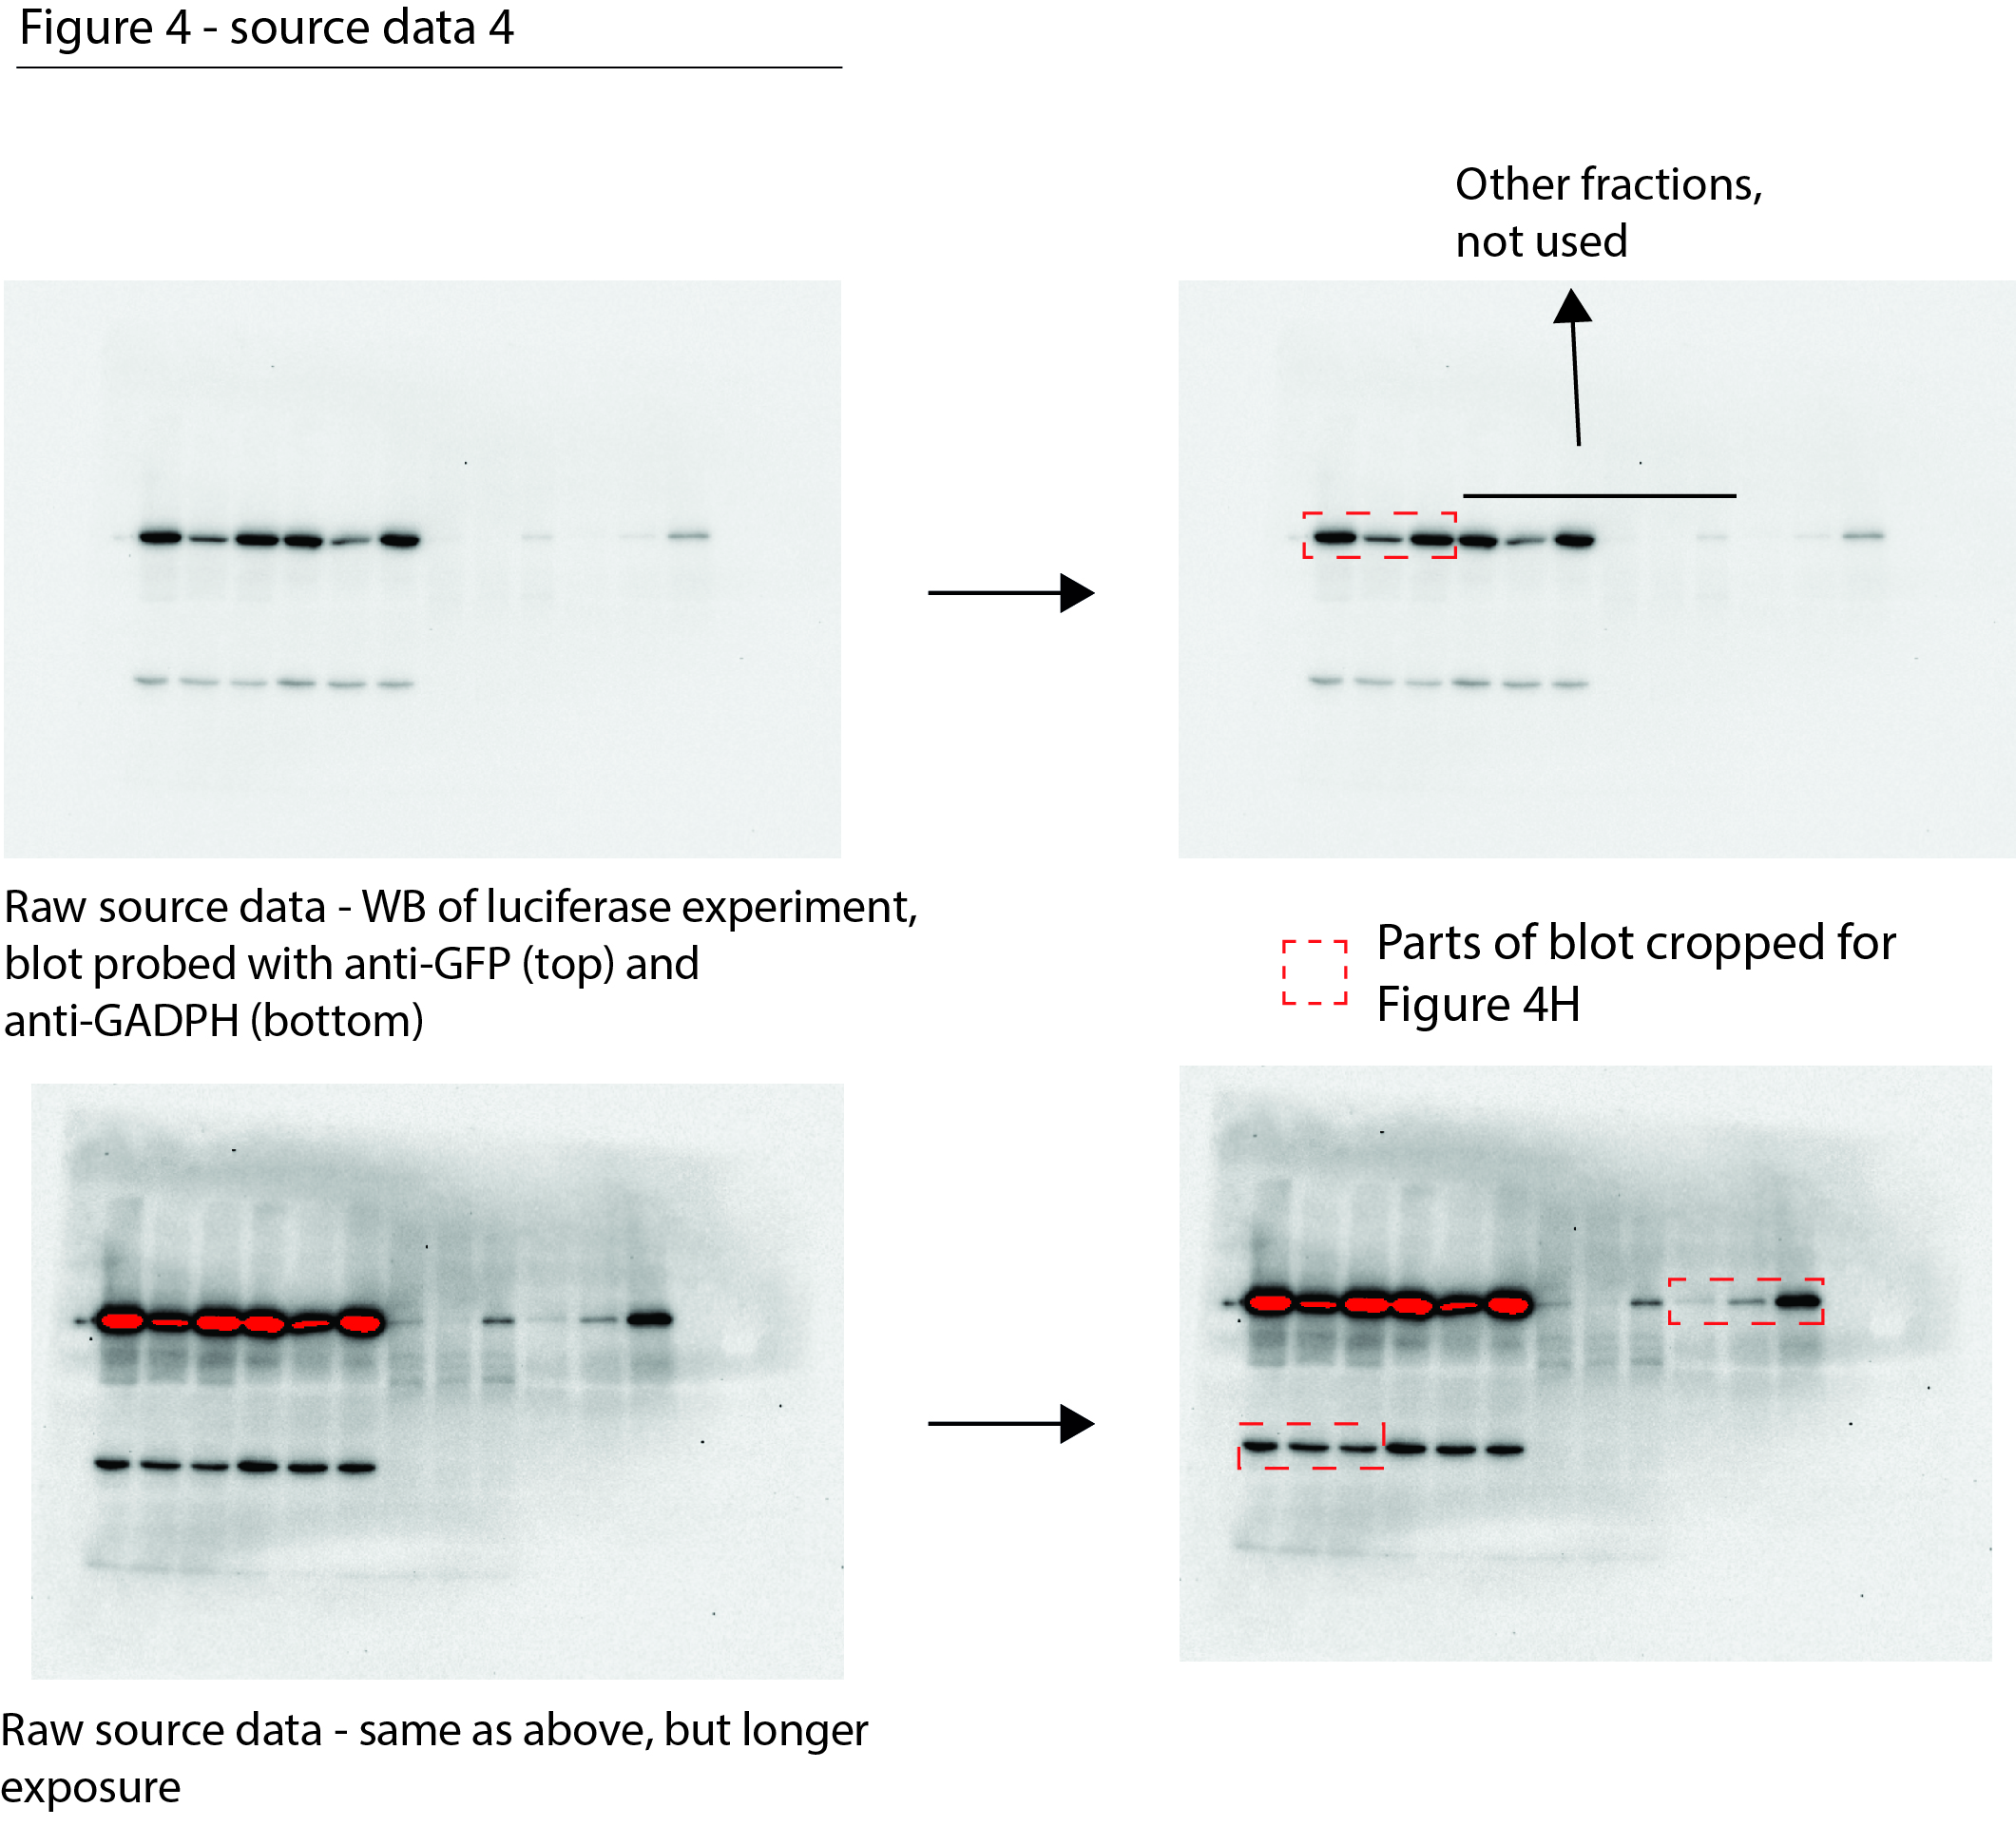
See also Figure 4—figure supplements 1 and 2. (A) Overlap between RNA-sequencing analysis and label-free quantification (LFQ) MS/MS analysis for whole-cell lysate (WCL) and aggregated (Agg.) protein fractions. Only significant increases are taken into account. (B) Relative occurrences in the indicated fractions in HEK293T cells of proteins that have been shown to aggregate upon heat stress. See text for reference. (C) Relative occurrences in the indicated fractions in HEK293T cells of proteins that have been found to be associated with stress granules. See text for reference. (D) Pulse label experiment. See also Figure 4—figure supplement 1E. HEK293T cells were treated with DMSO or camptothecin (CPT) (0,02 μM) and pulsed with radioactive 35S-labeled cysteine and methionine for 30 min. Cells were then harvested at the indicated timepoints (10, 20, or 40 min post pulse). Left upper panel: WCLs were run on SDS-PAGE and exposed (autoradiogram) or stained (Coomassie). Left lower panel: aggregated fractions were run on SDS-PAGE and exposed (autoradiogram) or stained (silver stain). Right upper panel: quantification of the incorporated 35S of the indicated treatment in the whole-cell extract. Right lower panel: quantification of the incorporated 35S of the indicated treatment in pellet fractions, normalized for total aggregation levels (as measured in the silver stains) and total 35S incorporation (as measured in the WCL fractions). n = 4. (E) Relative occurrences of proteins identified in various disease (model) datasets in the indicated fractions in HEK293T cells, obtained from the indicated studies. See also Figure 4—figure supplement 2. (F) Left panel: filter trap assay of HEK293 cells expressing inducible Q71-GFP that received the indicated treatment, probed with GFP antibody. n = 3. For doses, see Table 1. Right panel: quantification, using Student’s two-tailed t-test followed by a Bonferroni correction for multiple comparisons. See also Figure 4—figure supplement 1F. (G) Filter trap assay of HEK293 cells expressing inducible Q71-GFP that were treated with the indicated doses of etoposide (Etop), probed with GFP antibody. n = 2. (H) Western blot of WCL and aggregated proteins isolated from HEK293 cells expressing inducible luciferase-GFP, treated with ATM inhibitor or CPT, probed with the indicated antibodies. n = 2. See also Figure 4—figure supplement 1K. In (B), (C), and (E), chi-square testing was used to evaluate the statistical significance of differences in distributions. In (D), two-tailed Student’s t-tests were used.
-
Figure 4—source data 1
Data from Figure 4D.
Raw autoradiograms and Coomassie- and silver-stained SDS-PAGE gels with cropped parts indicated in red.
- https://cdn.elifesciences.org/articles/70726/elife-70726-fig4-data1-v2.jpg
-
Figure 4—source data 2
Data from Figure 4F.
Raw filter trap images with the cropped parts indicated in red.
- https://cdn.elifesciences.org/articles/70726/elife-70726-fig4-data2-v2.jpg
-
Figure 4—source data 3
Data from Figure 4G.
Raw filter trap image with the cropped parts indicated in red.
- https://cdn.elifesciences.org/articles/70726/elife-70726-fig4-data3-v2.jpg
-
Figure 4—source data 4
Data from Figure 4H.
Raw Western blot images with each antibody annotated and cropped parts indicated in red.
- https://cdn.elifesciences.org/articles/70726/elife-70726-fig4-data4-v2.jpg
Figure 4—figure supplement 1
Increased aggregation triggered by camptothecin treatment and ataxia telangiectasia mutated (ATM) loss overlaps with that occurring in various proteinopathies.
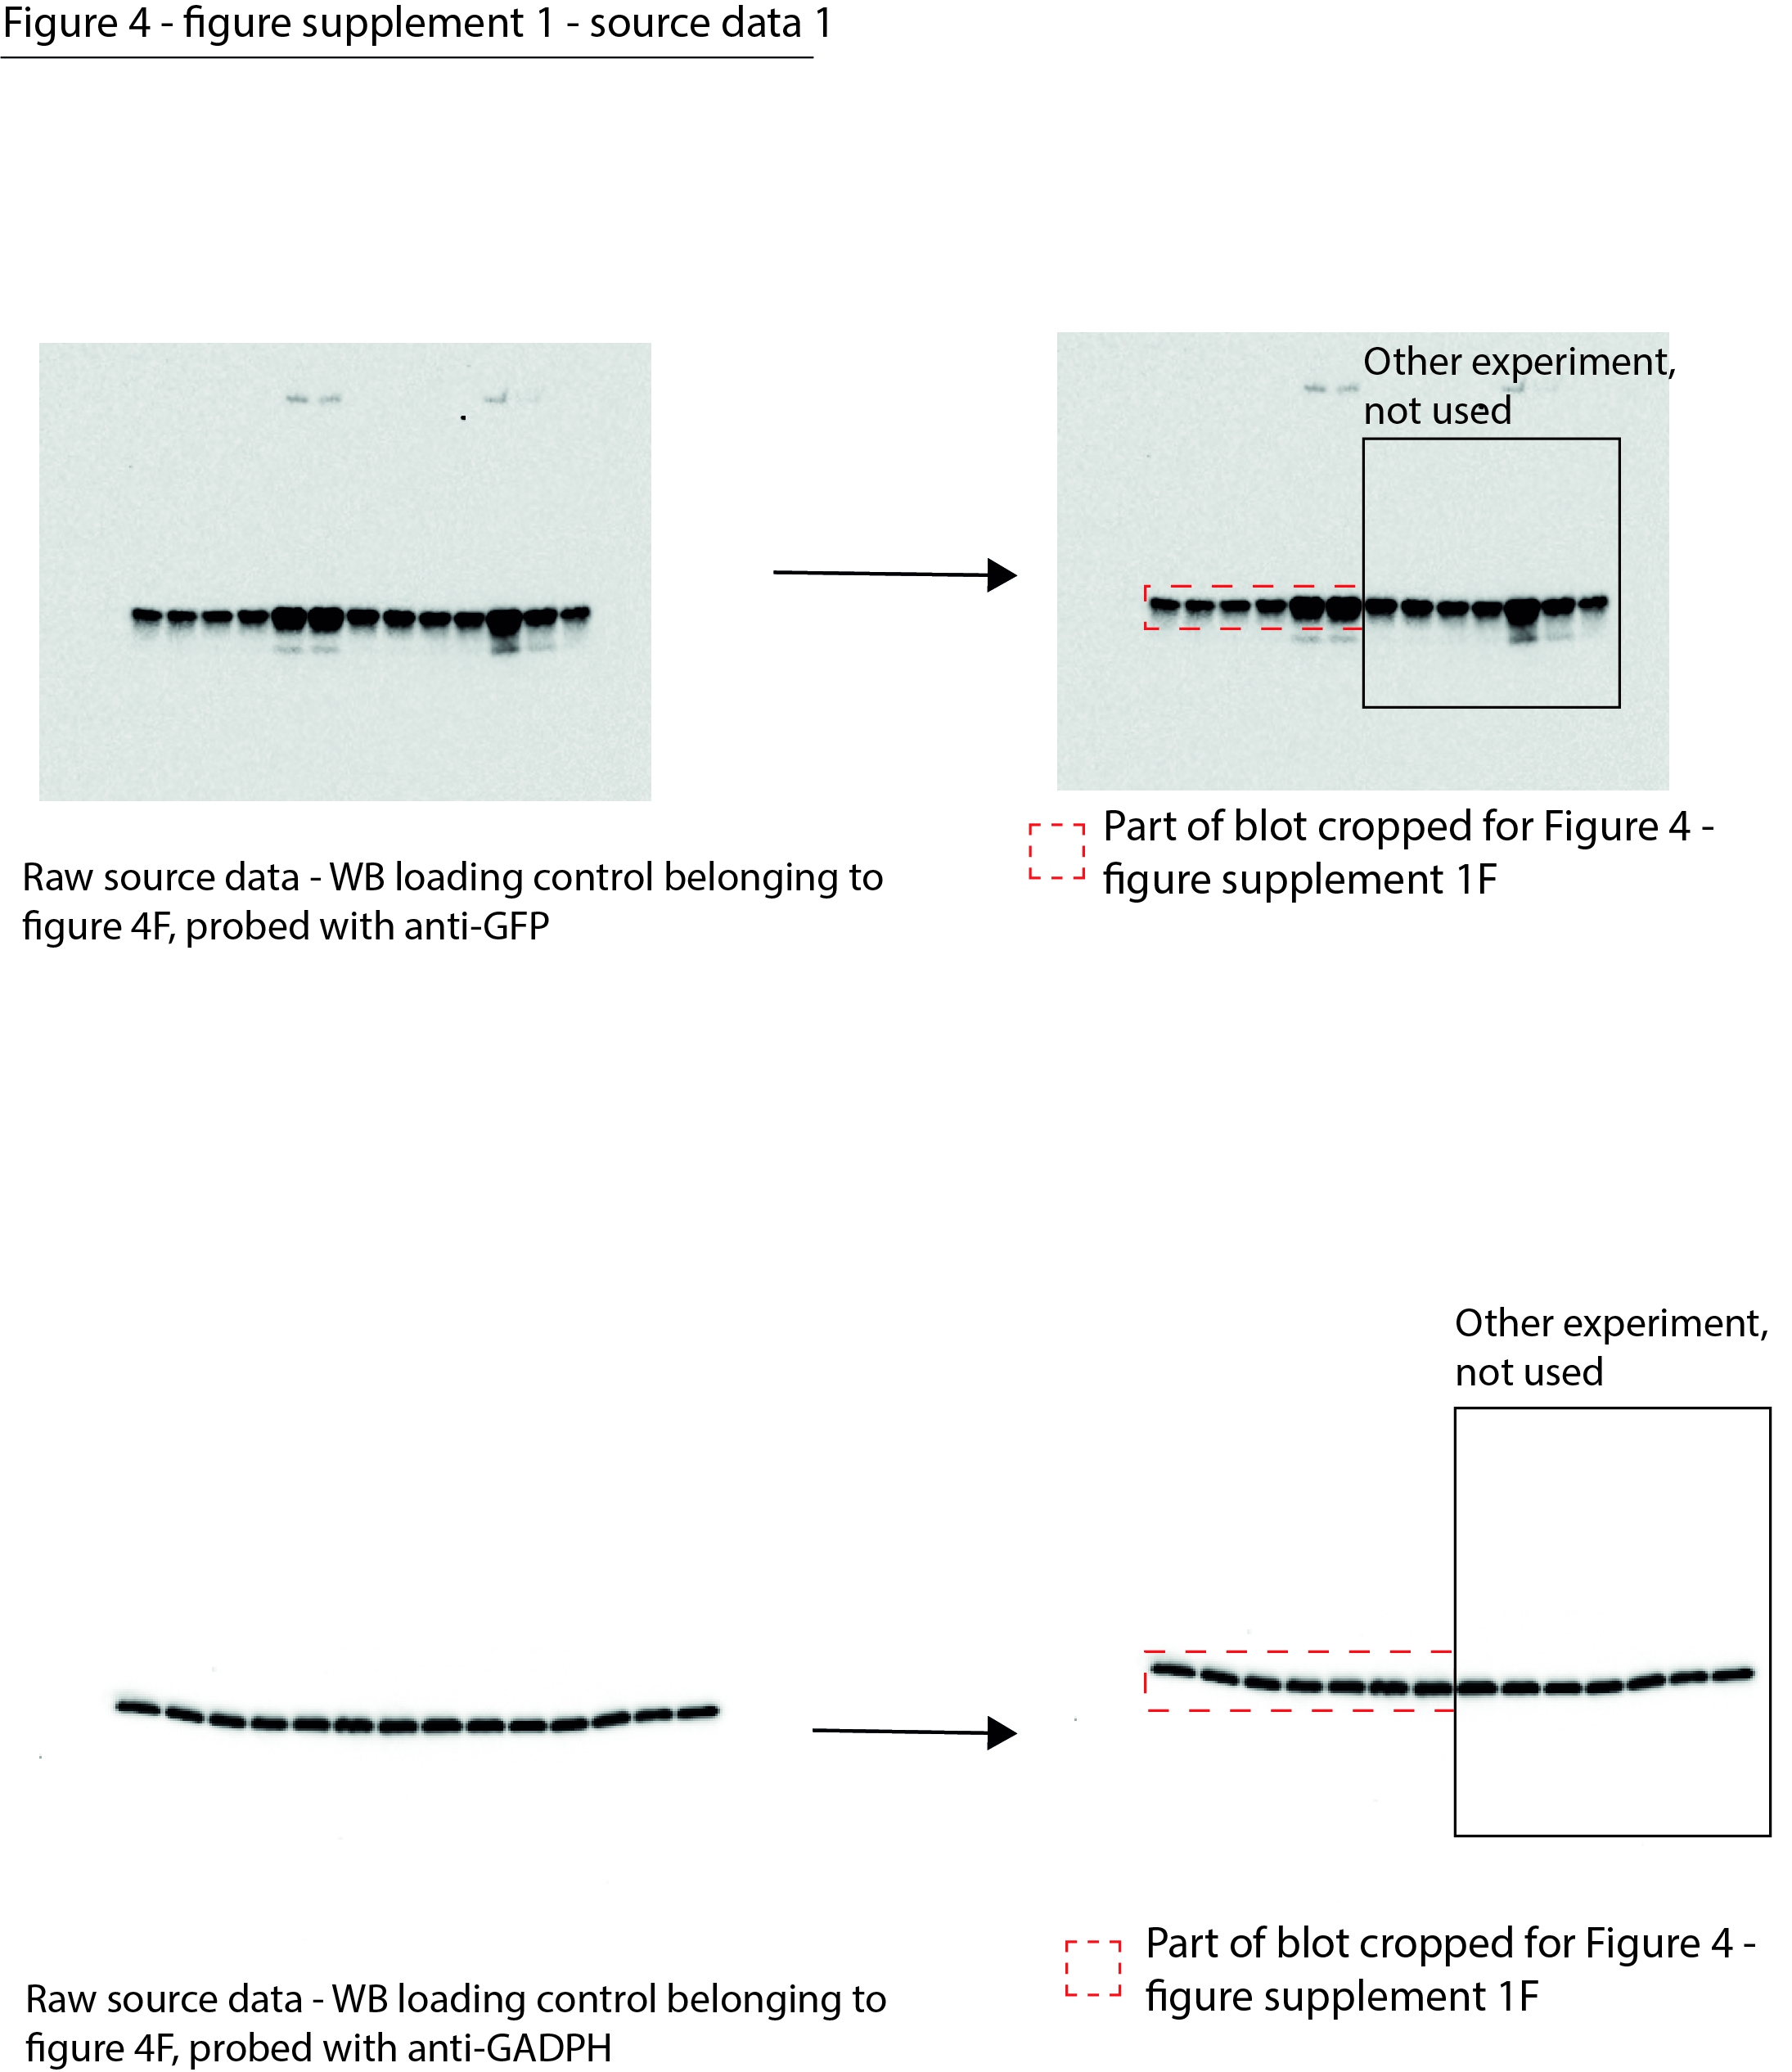
(A) Overlap between RNA-sequencing analysis and label-free quantification (LFQ) MS/MS analysis for whole-cell lysate (WCL) and aggregated (Agg.) protein fractions in U2OS cells. Only significant increases are taken into account. (B) Conceptual overview of aggregation in HEK293T and U2OS cells. U2OS cells have an inherently lower aggregation threshold, causing more proteins to be affected by aggregation already in the background. (C) Relative occurrences in the indicated fractions in U2OS cells of proteins that have been shown to aggregate upon heat stress. See text for reference. (D) Relative occurrences in the indicated fractions in U2OS cells of proteins that have been found to associate with stress granules. See text for reference. (E) Experimental outline of Figure 4D. (F) Experimental outline of Figure 4G and H, and of (G-J). (G, H) Western blot loading controls of Figure 4F and G using the indicated antibodies. (I) Western blot and filter trap assay of HEK293 cells expressing inducible Q71-GFP, treated with incremental doses of ATM inhibitor, using the indicated antibodies. n = 2. (J). Histograms showing the distribution of CAG repeat length of HEK293 GFP-Q71 cells treated as in (F). n = 3. (K) Experimental outline of Figure 4H.
-
Figure 4—figure supplement 1—source data 1
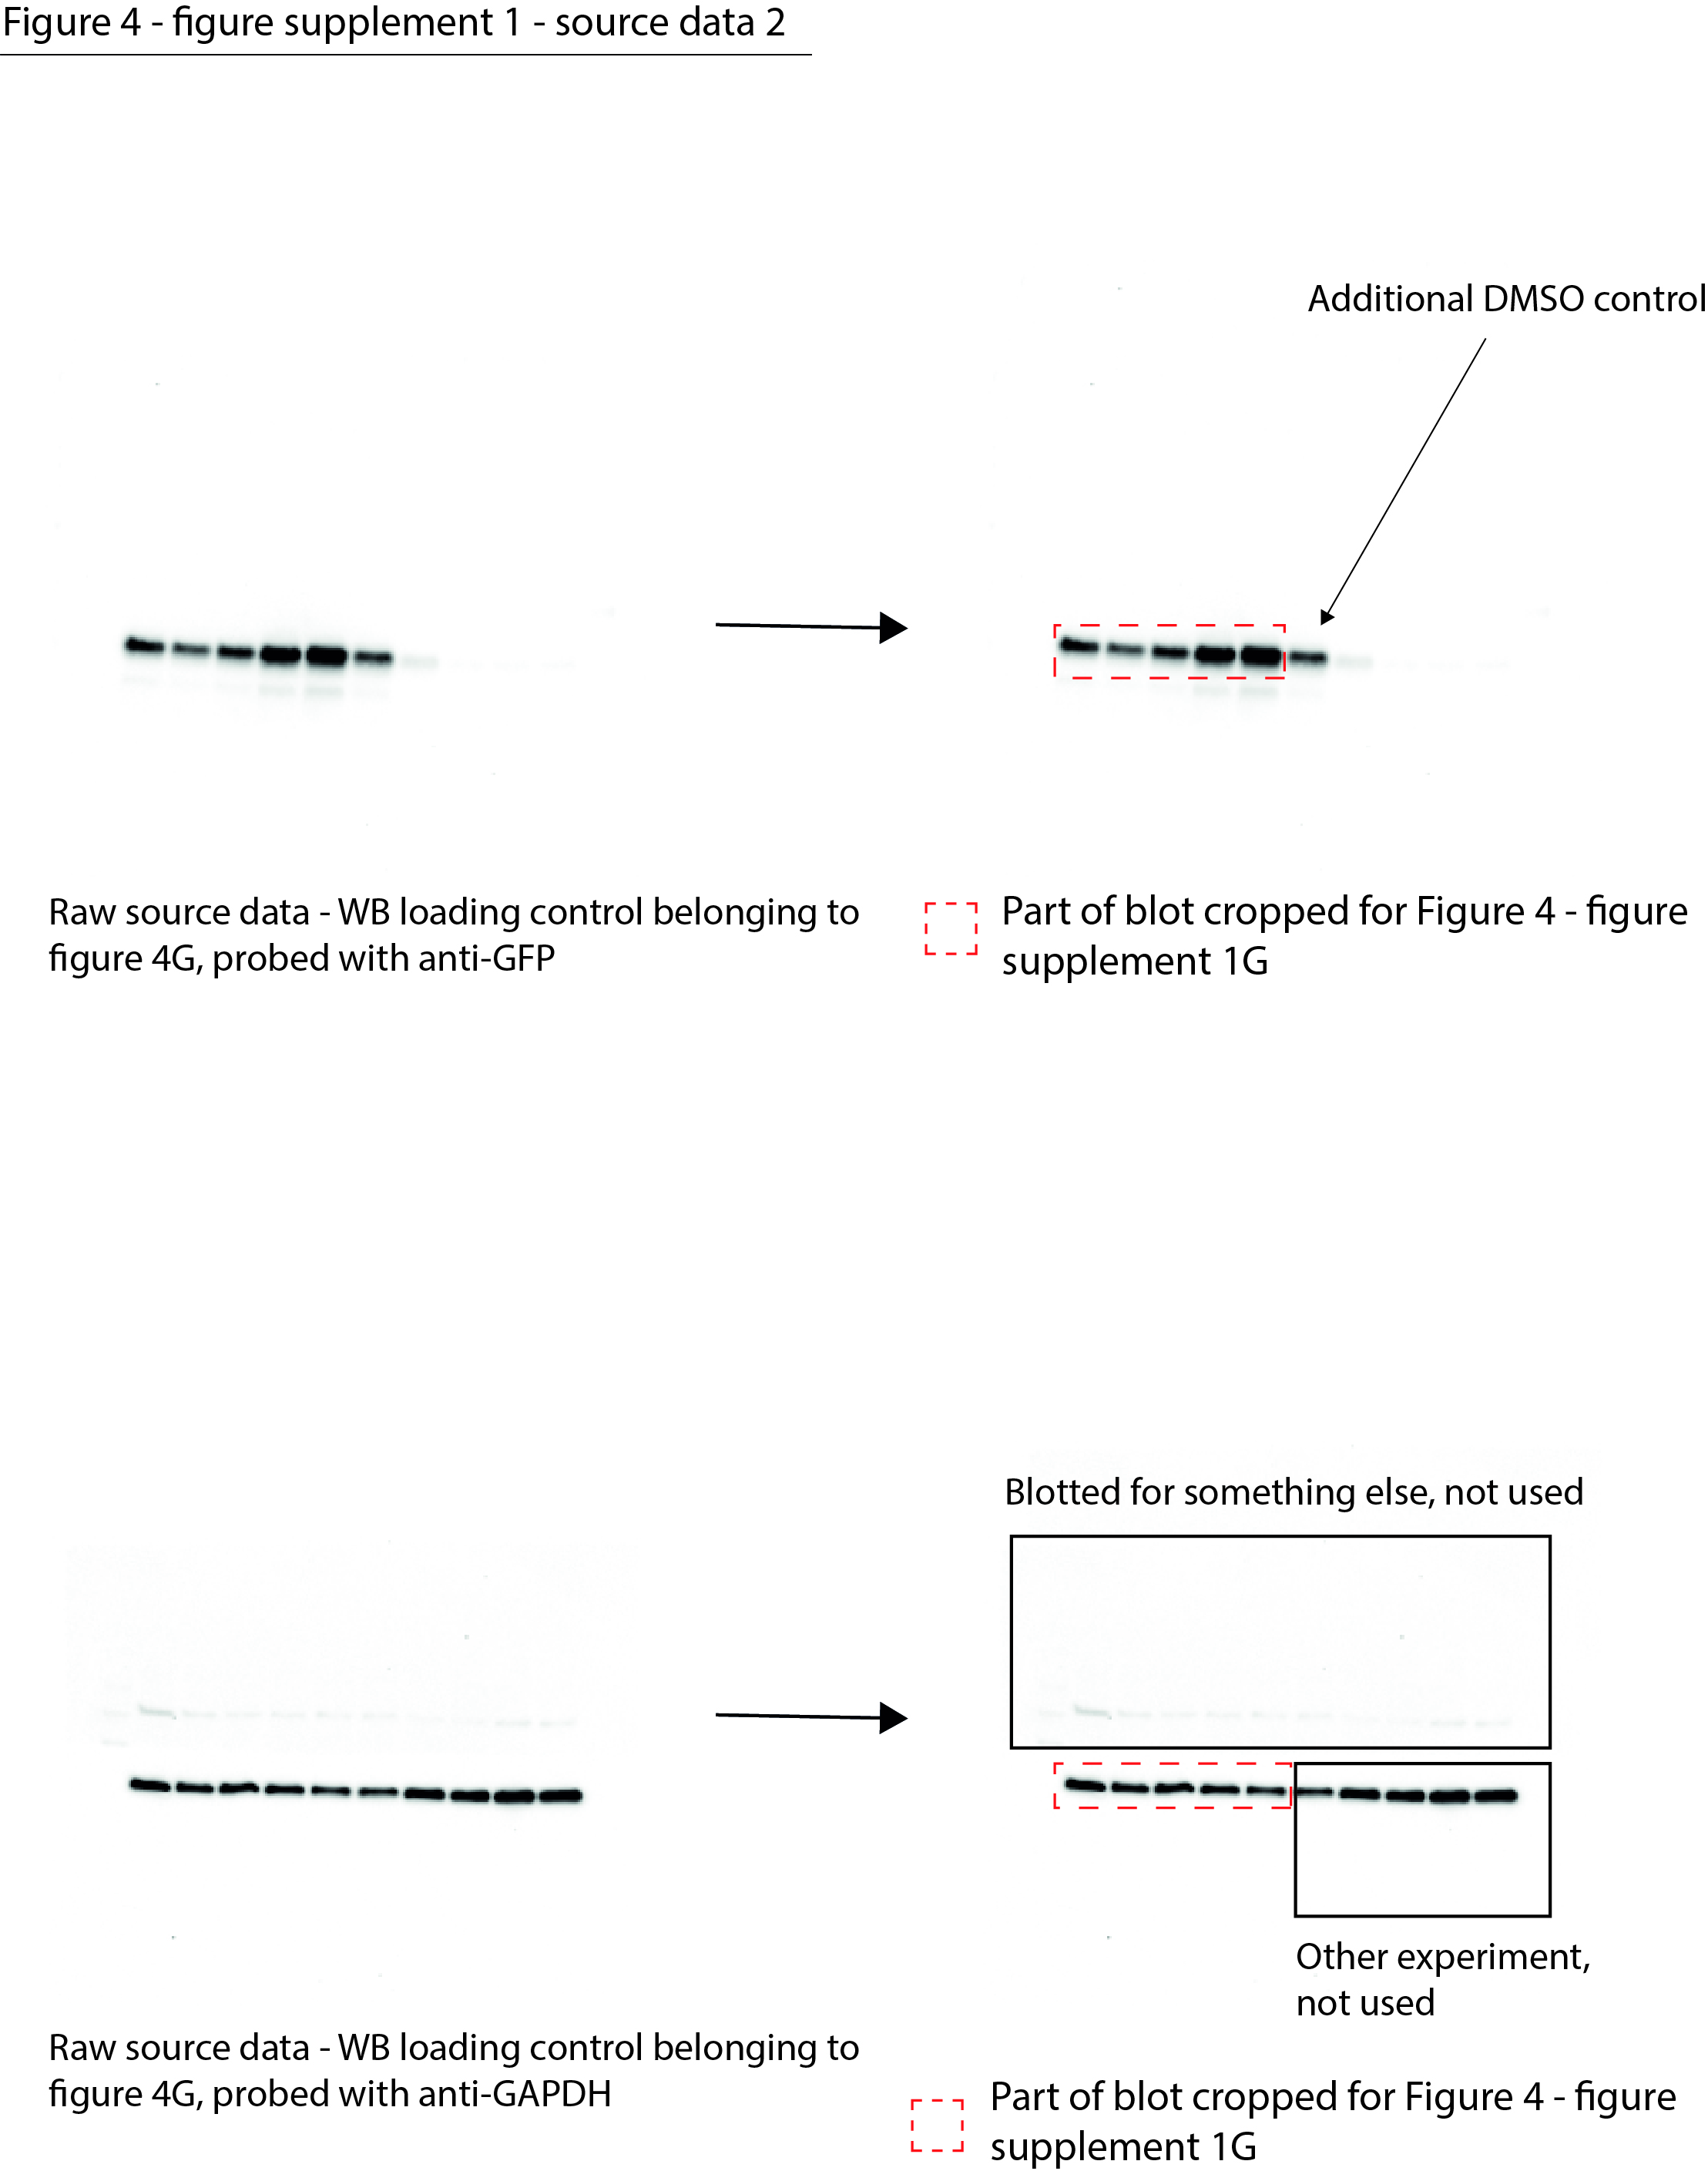
Data from Figure 4—figure supplement 1F.
Raw Western blot images with the antibodies annotated and the cropped parts indicated in red.
- https://cdn.elifesciences.org/articles/70726/elife-70726-fig4-figsupp1-data1-v2.jpg
-
Figure 4—figure supplement 1—source data 2
Data from Figure 4—figure supplement 1G.
Raw Western blot images with the antibodies annotated and the cropped parts indicated in red.
- https://cdn.elifesciences.org/articles/70726/elife-70726-fig4-figsupp1-data2-v2.jpg
-
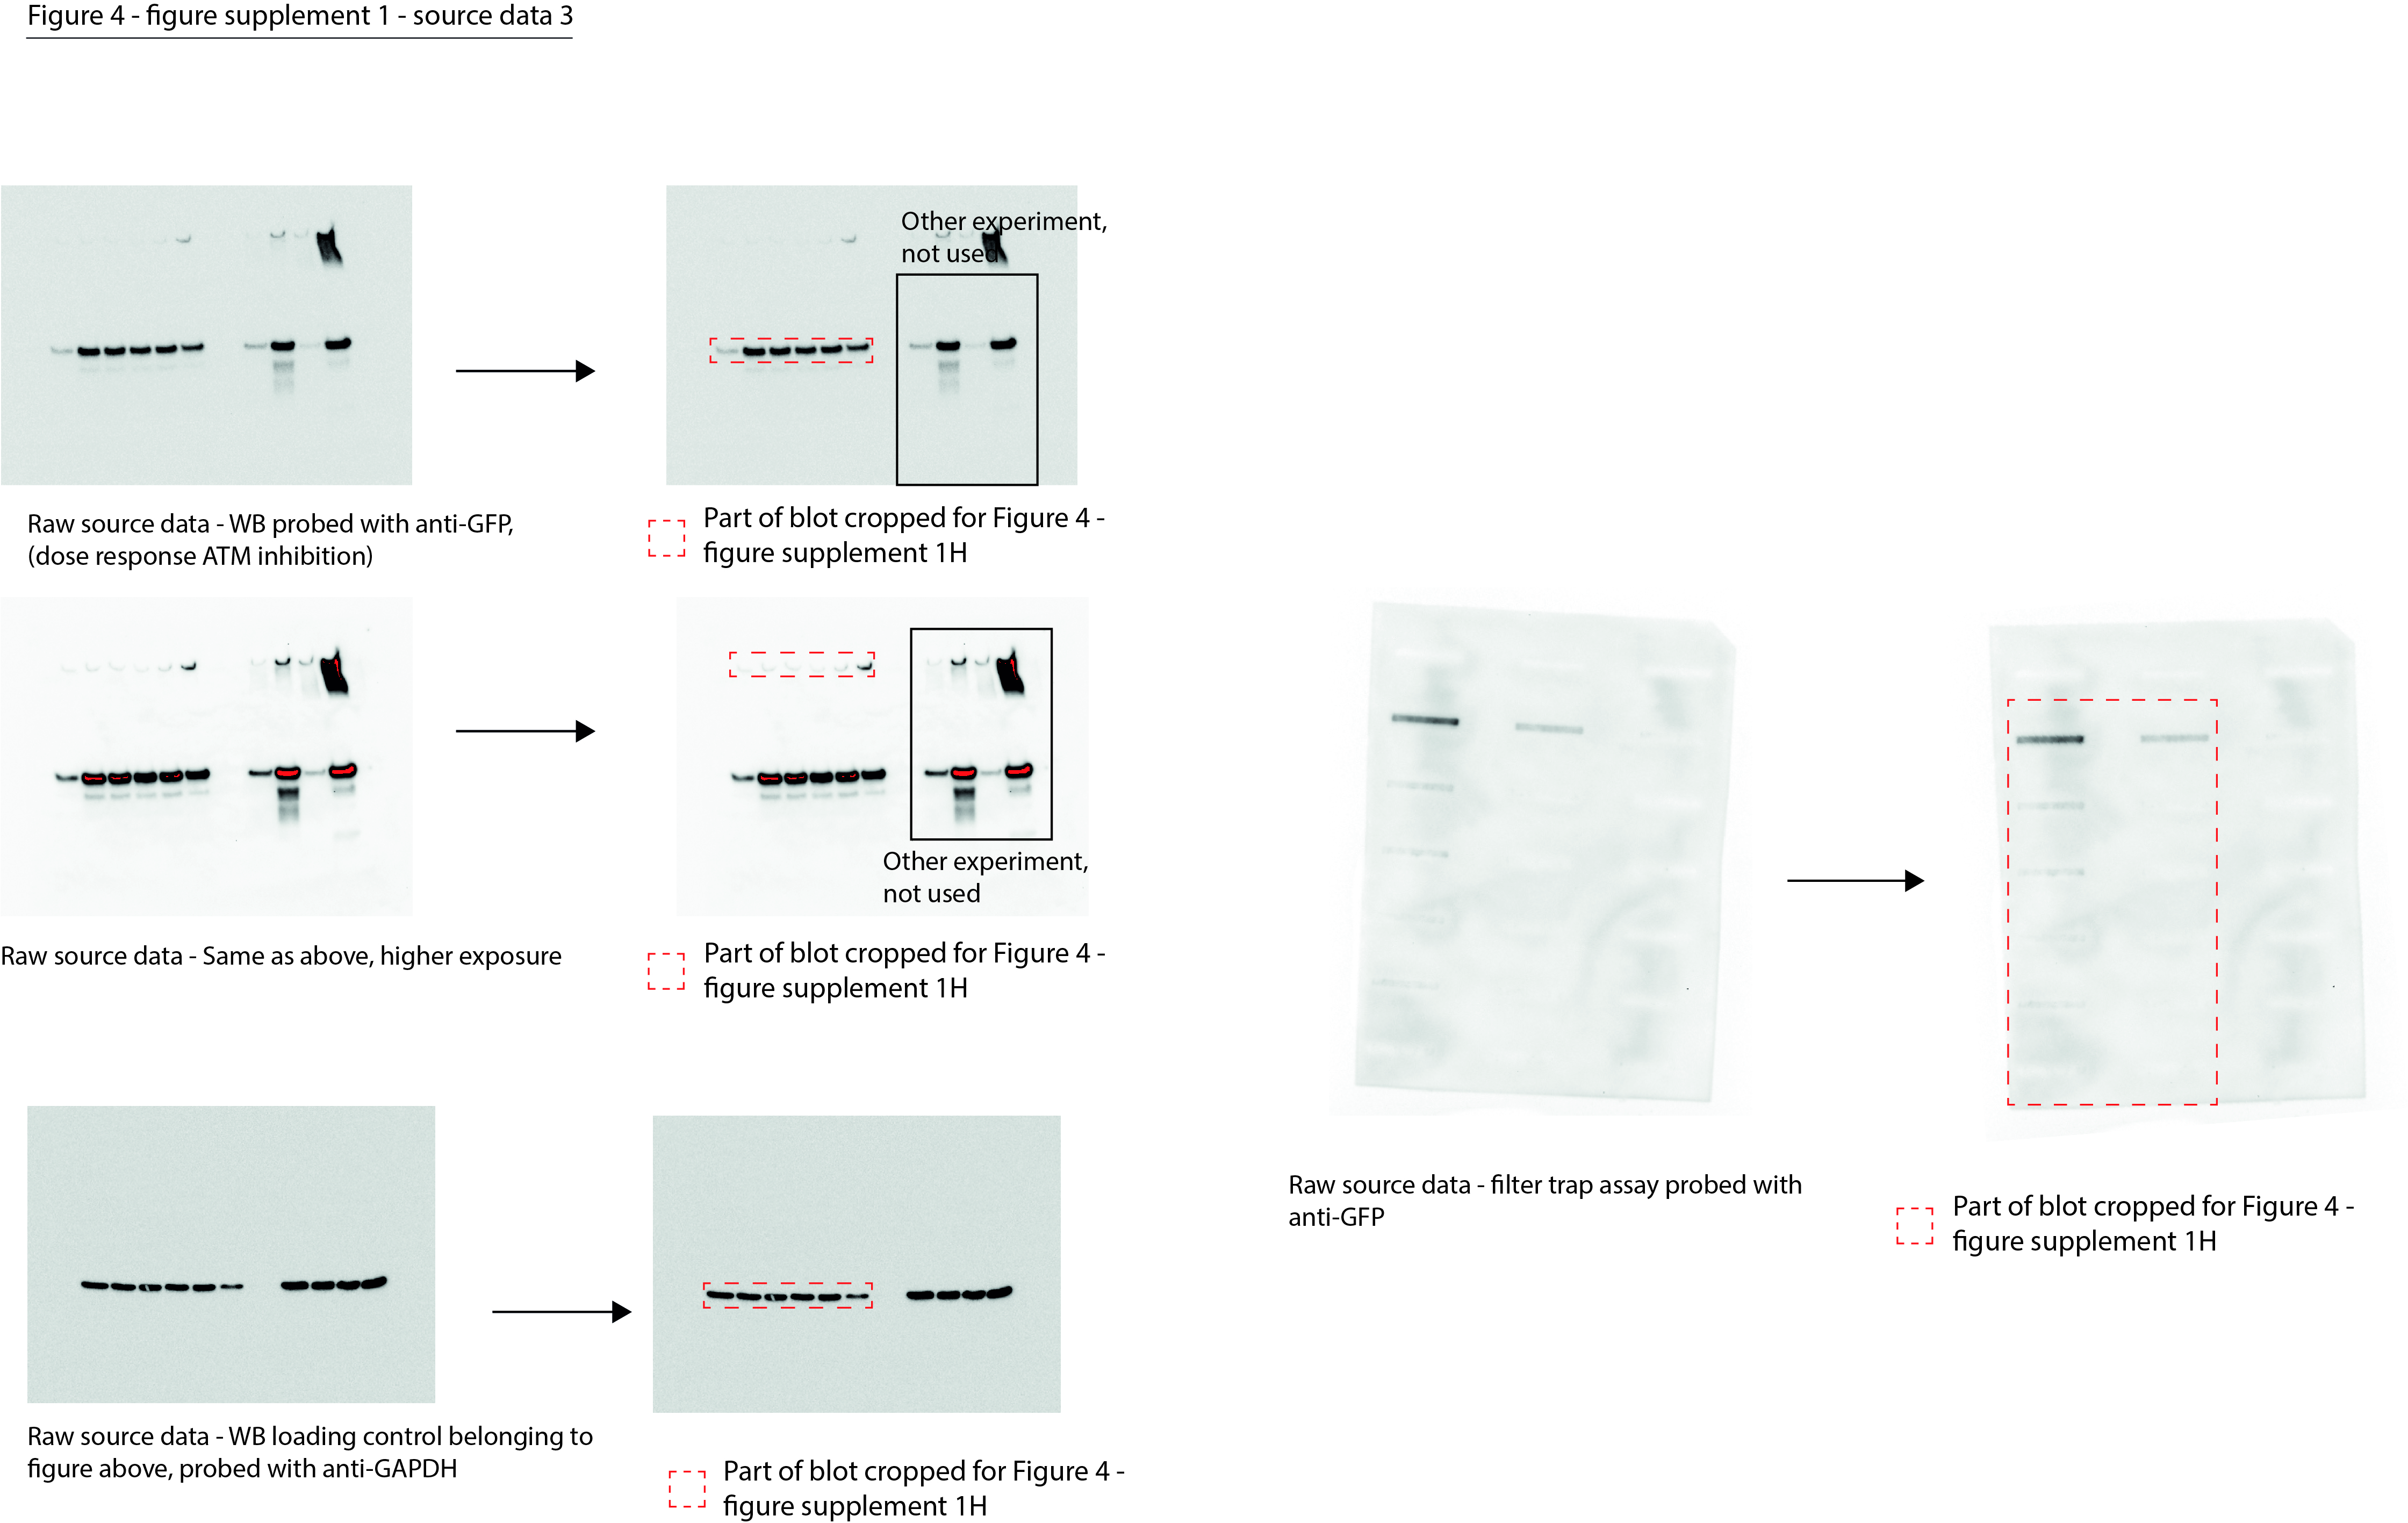
Figure 4—figure supplement 1—source data 3
Data from Figure 4—figure supplement 1H.
Raw Western blot images with the antibodies annotated and the cropped parts indicated in red.
- https://cdn.elifesciences.org/articles/70726/elife-70726-fig4-figsupp1-data3-v2.jpg
Figure 4—figure supplement 2
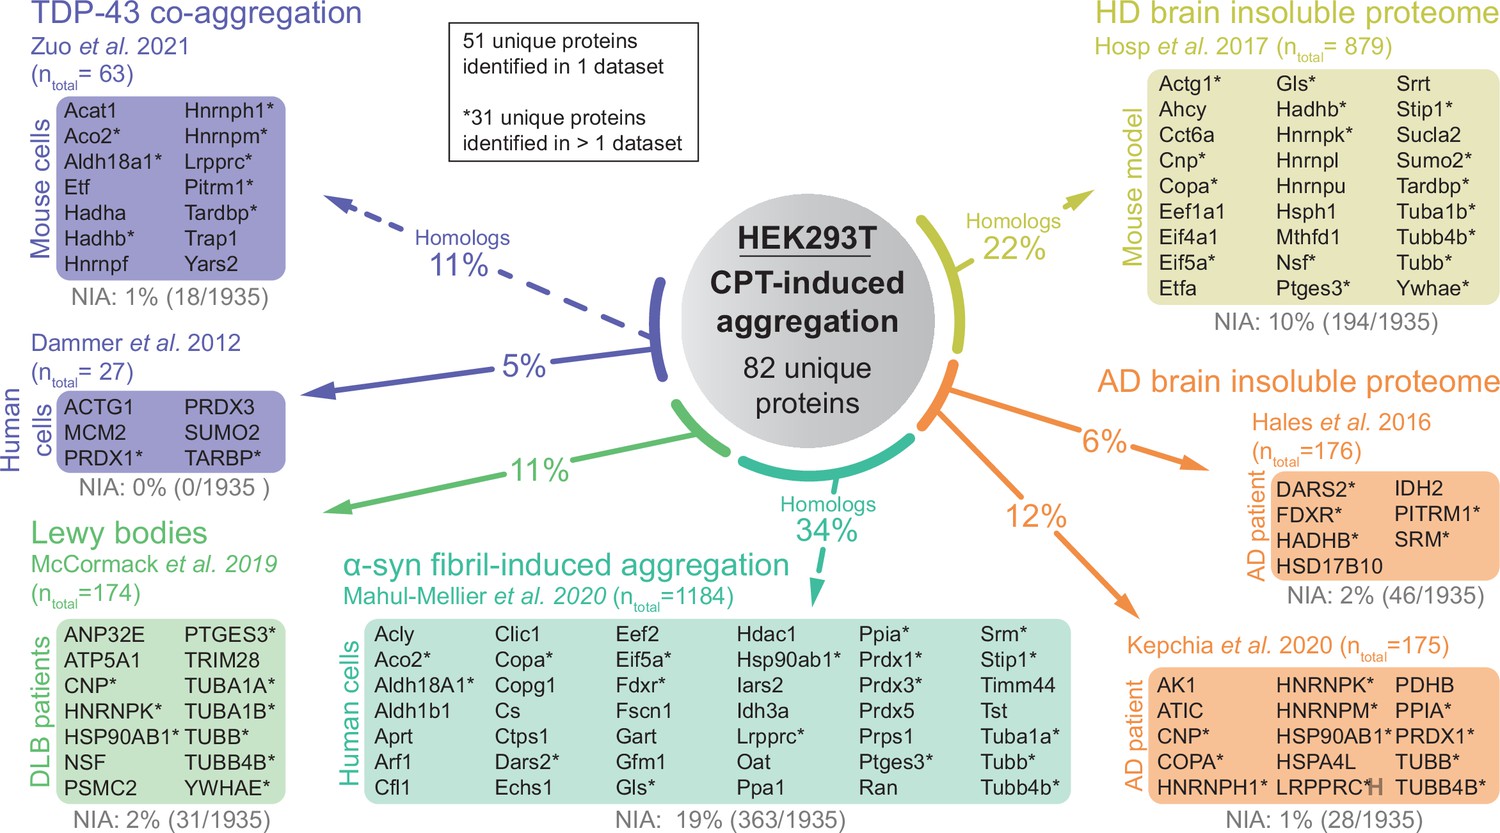
Proteins that aggregate in HEK293T treated with camptothecin (CPT) are linked to various proteinopathies.
Relative occurrences of proteins identified as aggregating in various proteinopathy (model) datasets in the HEK293T NIA and CPT-induced aggregation fractions. See also Figure 4E. Proteins marked with an * indicate proteins that overlap with more than one disease dataset.
Figure 5 with 2 supplements
The lowered aggregation threshold caused by topoisomerase poisoning or a loss of ataxia telangiectasia mutated (ATM) is accompanied by a rewiring and aggregation of known interacting (co)chaperones.
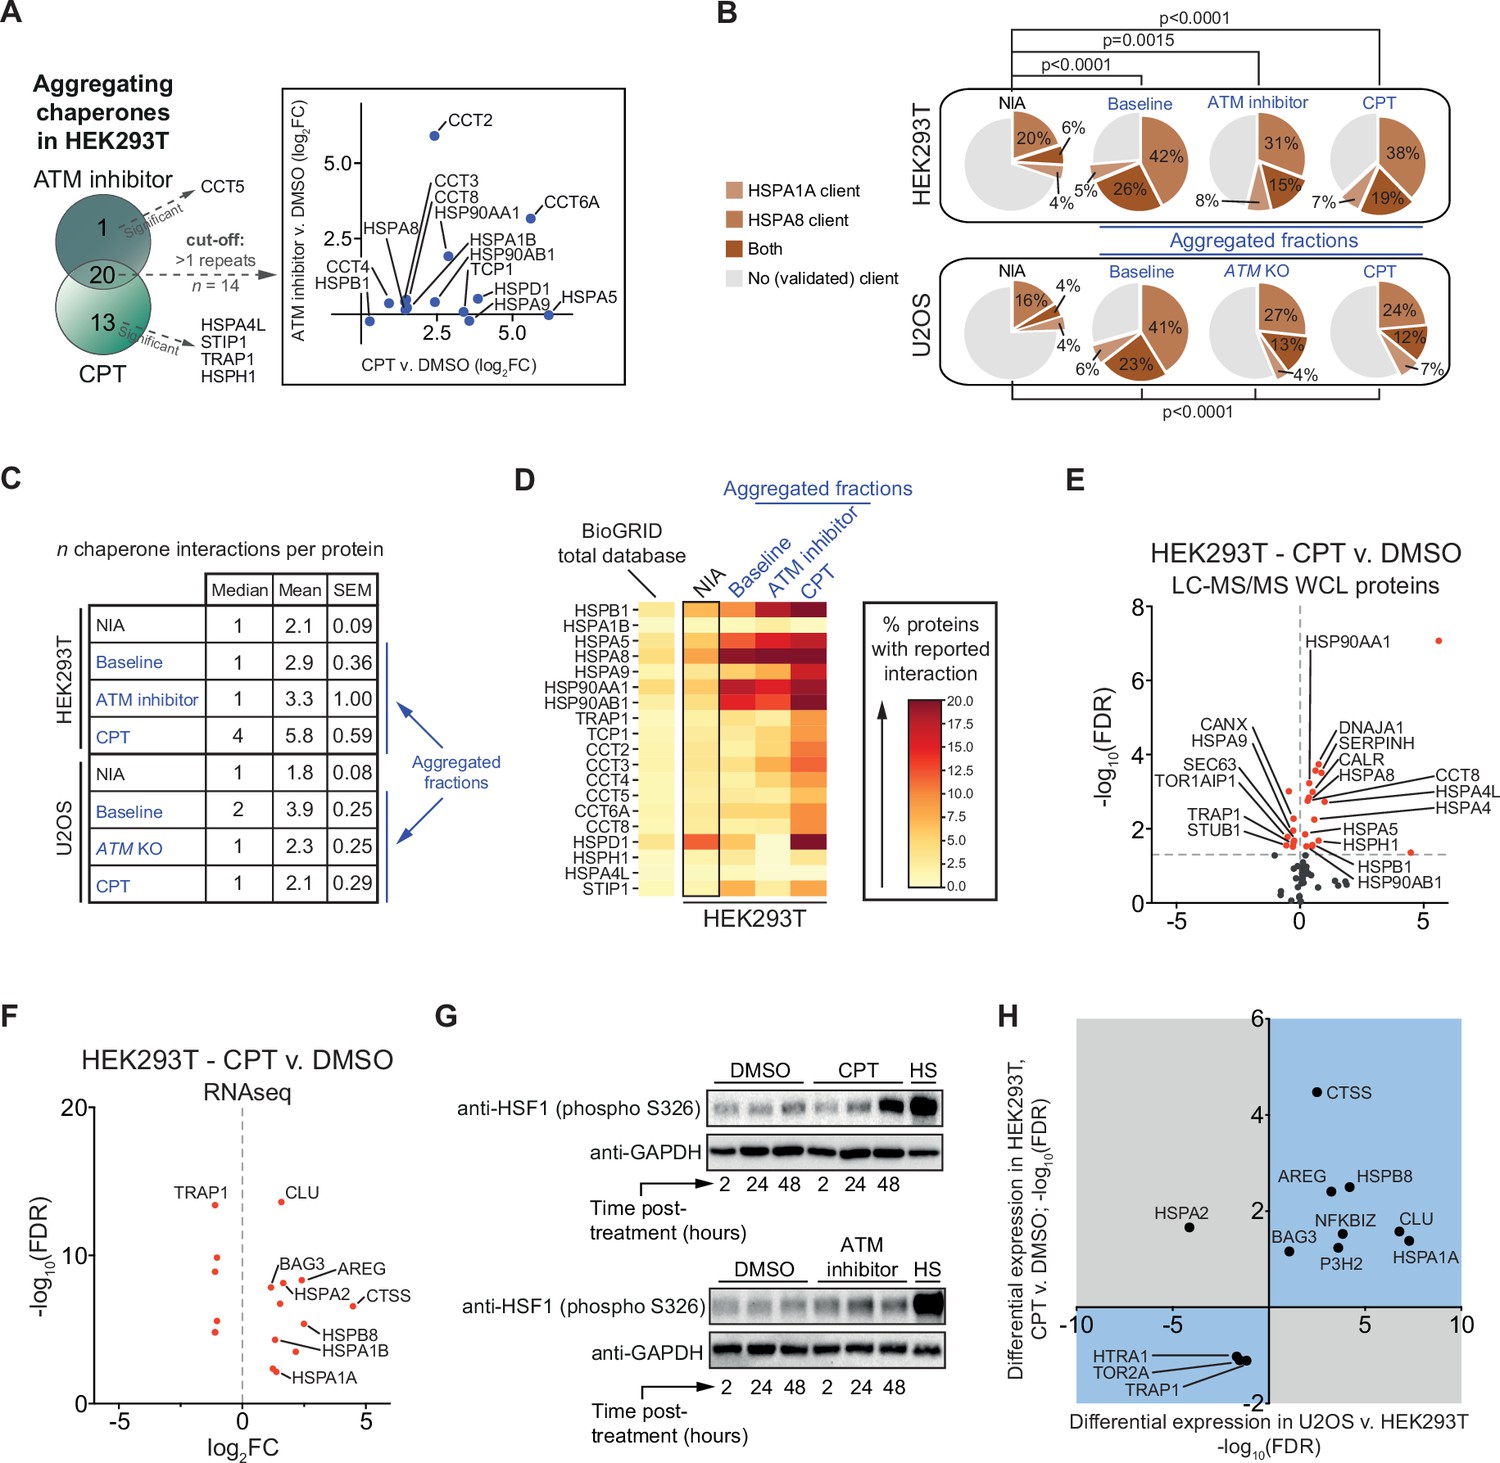
See also Figure 5—figure supplements 1 and 2. (A) Presence of (co)chaperones in the aggregated protein fractions in HEK293T cells. Left panel: Venn diagram showing the overlap in aggregating chaperones. Right panel: graph depicting the overlap in aggregating chaperones in detail. (B) Pie charts showing the presence of HSPA1A and HSPA8 clients in aggregated protein fractions compared to clients present in both NIA fractions. See text for reference; only clients identified in at least two out of three repeats in Lee et al. were taken into account here. (C) Table showing the number of (co)chaperones logged in BioGRID as interacting with NIA and aggregating protein fractions. (D) See also (A): only (co)chaperones aggregating in both HEK293T experimental set-ups or significantly more in one of them are shown here. BioGRID (co)chaperone interactions with the aggregated proteins identified in this study, per (co)chaperone. Darker colors represent a higher percentage of proteins with a reported binding to that (co)chaperone. See Figure 5—figure supplement 2 for a complete overview. (E) Volcano plot showing protein levels of (co)chaperones in camptothecin (CPT)-treated HEK293T cells compared to DMSO-treated cells. (F) Differentially expressed (co)chaperones in CPT-treated HEK293T cells compared to DMSO-treated cells based on RNAseq data. (G) Western blot analysis using the indicated antibodies on the whole-cell lysate (WCL) fractions of HEK293T cells after the indicated time and treatment. HS, heat shock (2 hr at 43°C incubator). n = 2. (H) Graph showing (co)chaperones whose genes show a differential expression in both CPT-treated HEK293T cells compared to DMSO-treated HEK293T cells and in untreated U2OS compared to untreated HEK293T cells.
-
Figure 5—source data 1
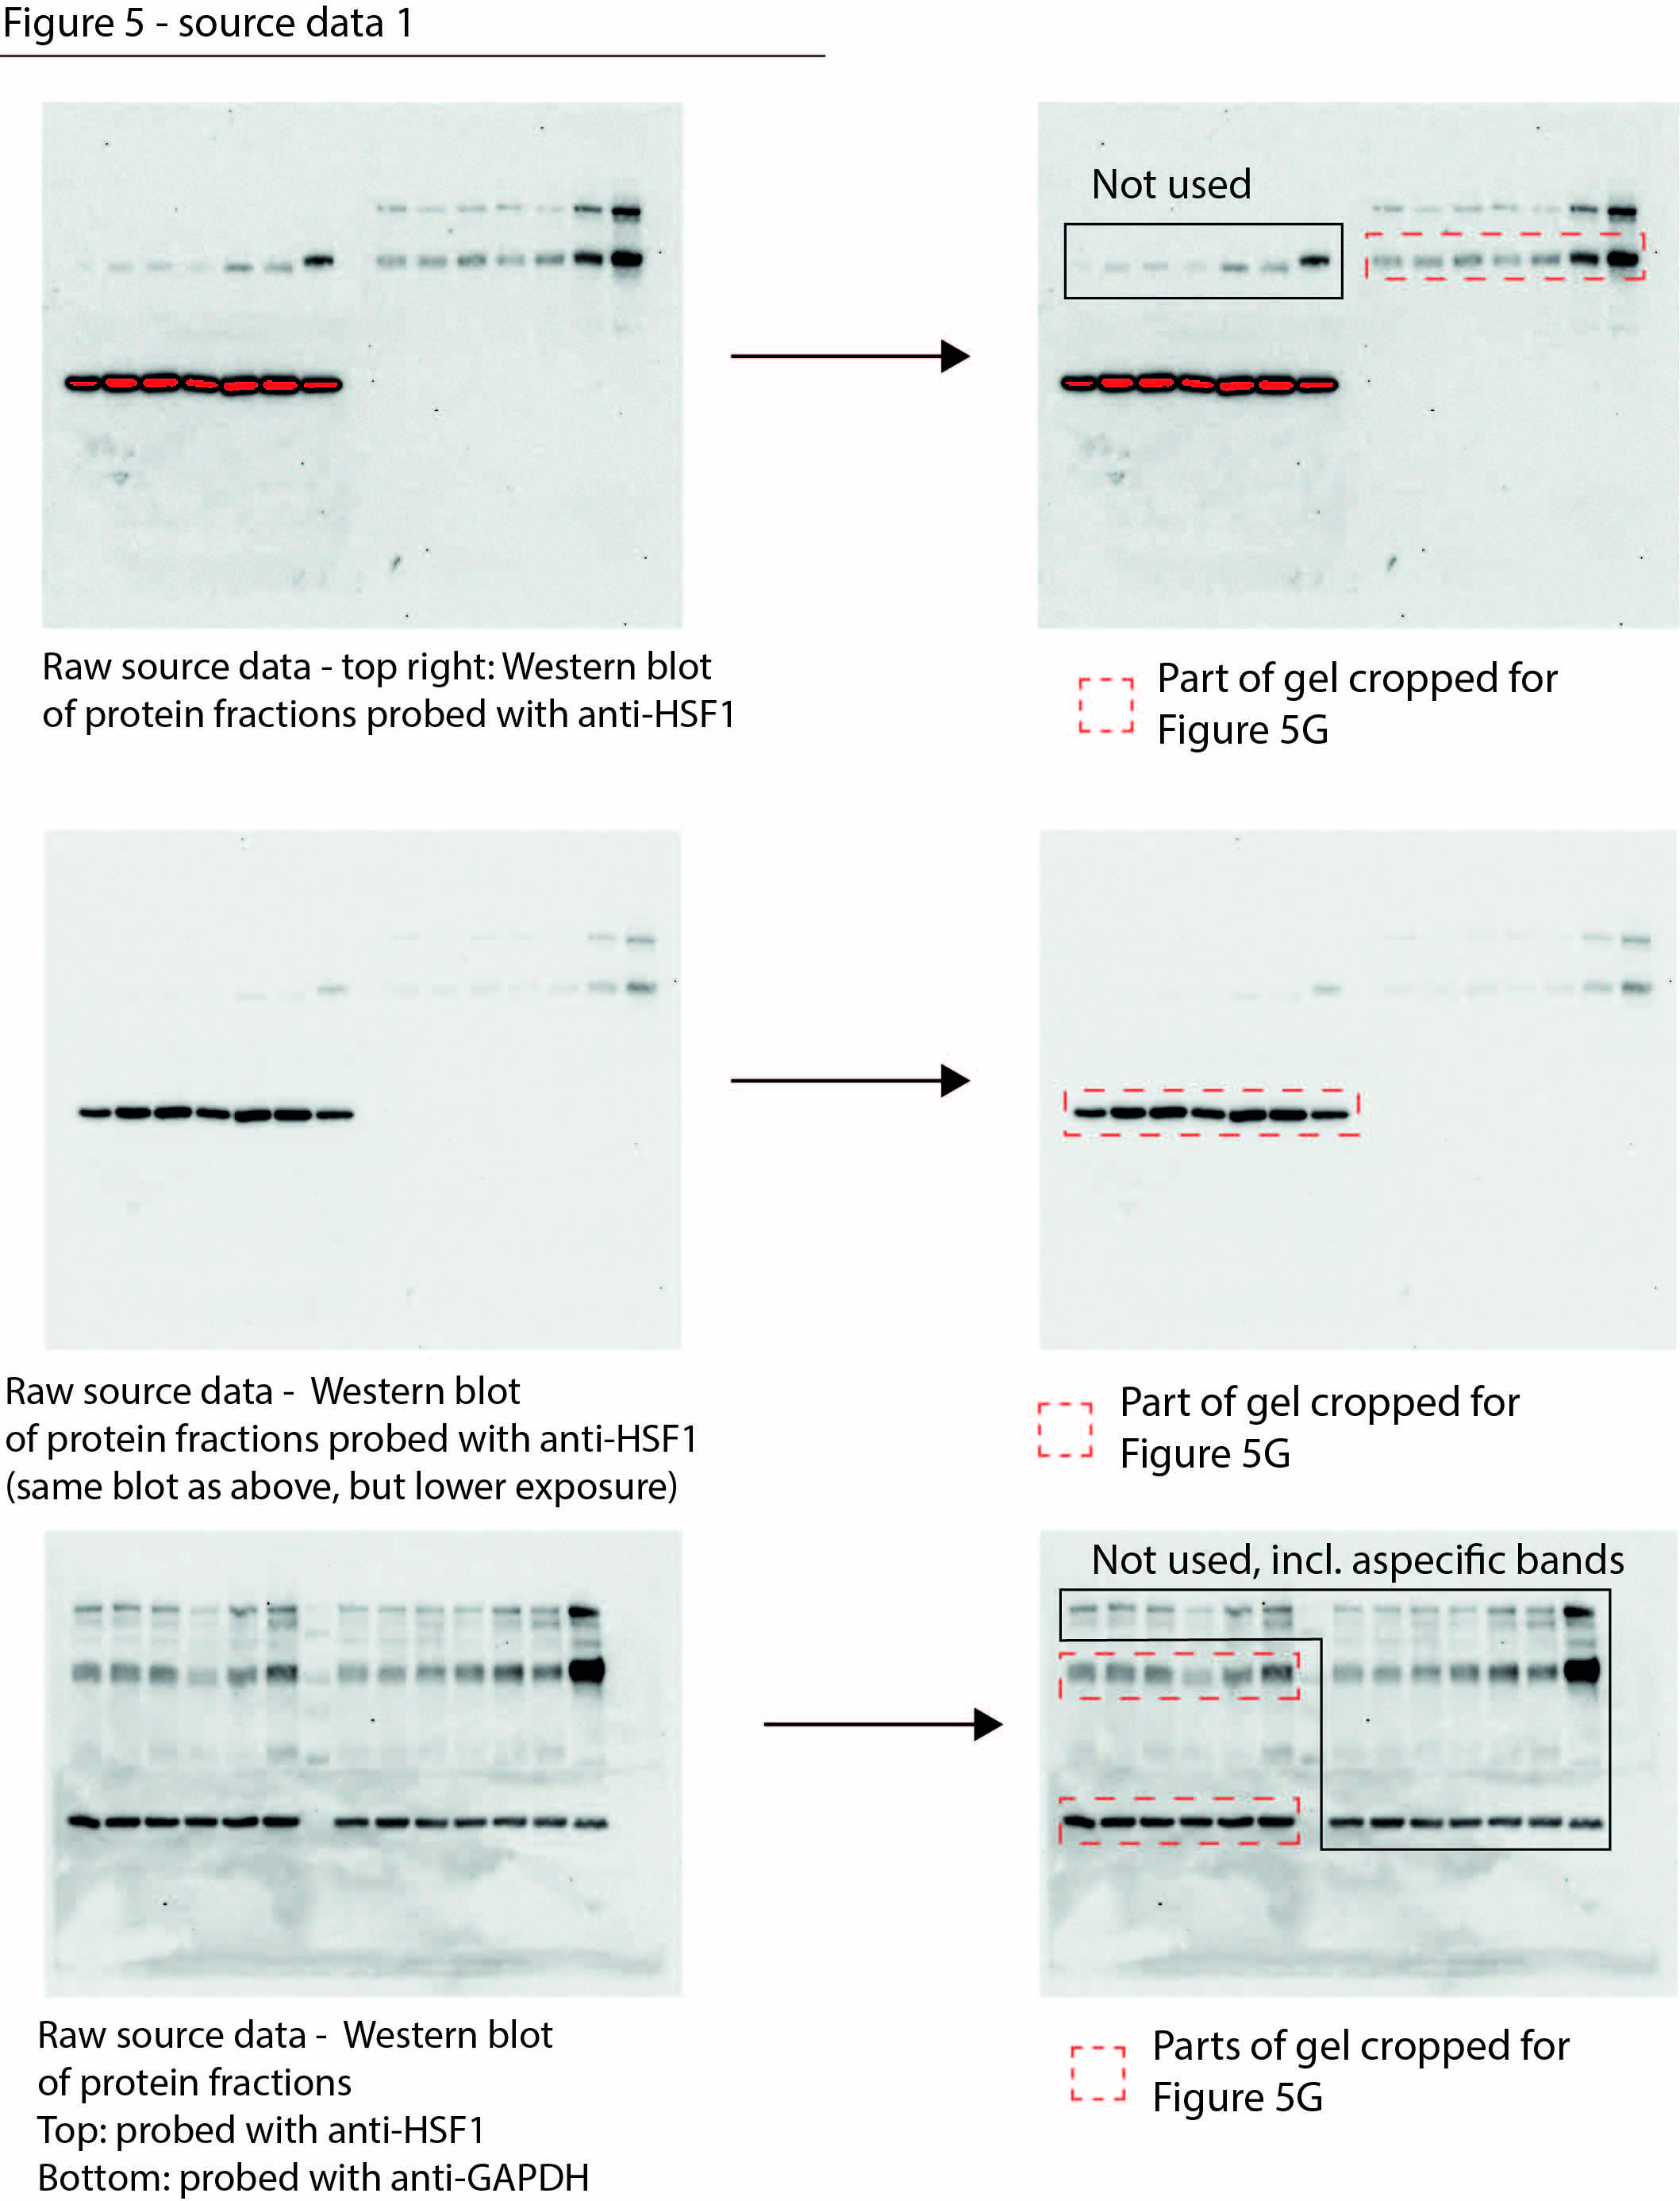
Data from Figure 5G.
Raw Western blot images with each antibody annotated and cropped parts indicated in red.
- https://cdn.elifesciences.org/articles/70726/elife-70726-fig5-data1-v2.jpg
Figure 5—figure supplement 1
Chaperone systems are rewired in line with the presence of chaperone clients in aggregates induced by camptothecin or ataxia telangiectasia mutated (ATM) loss.
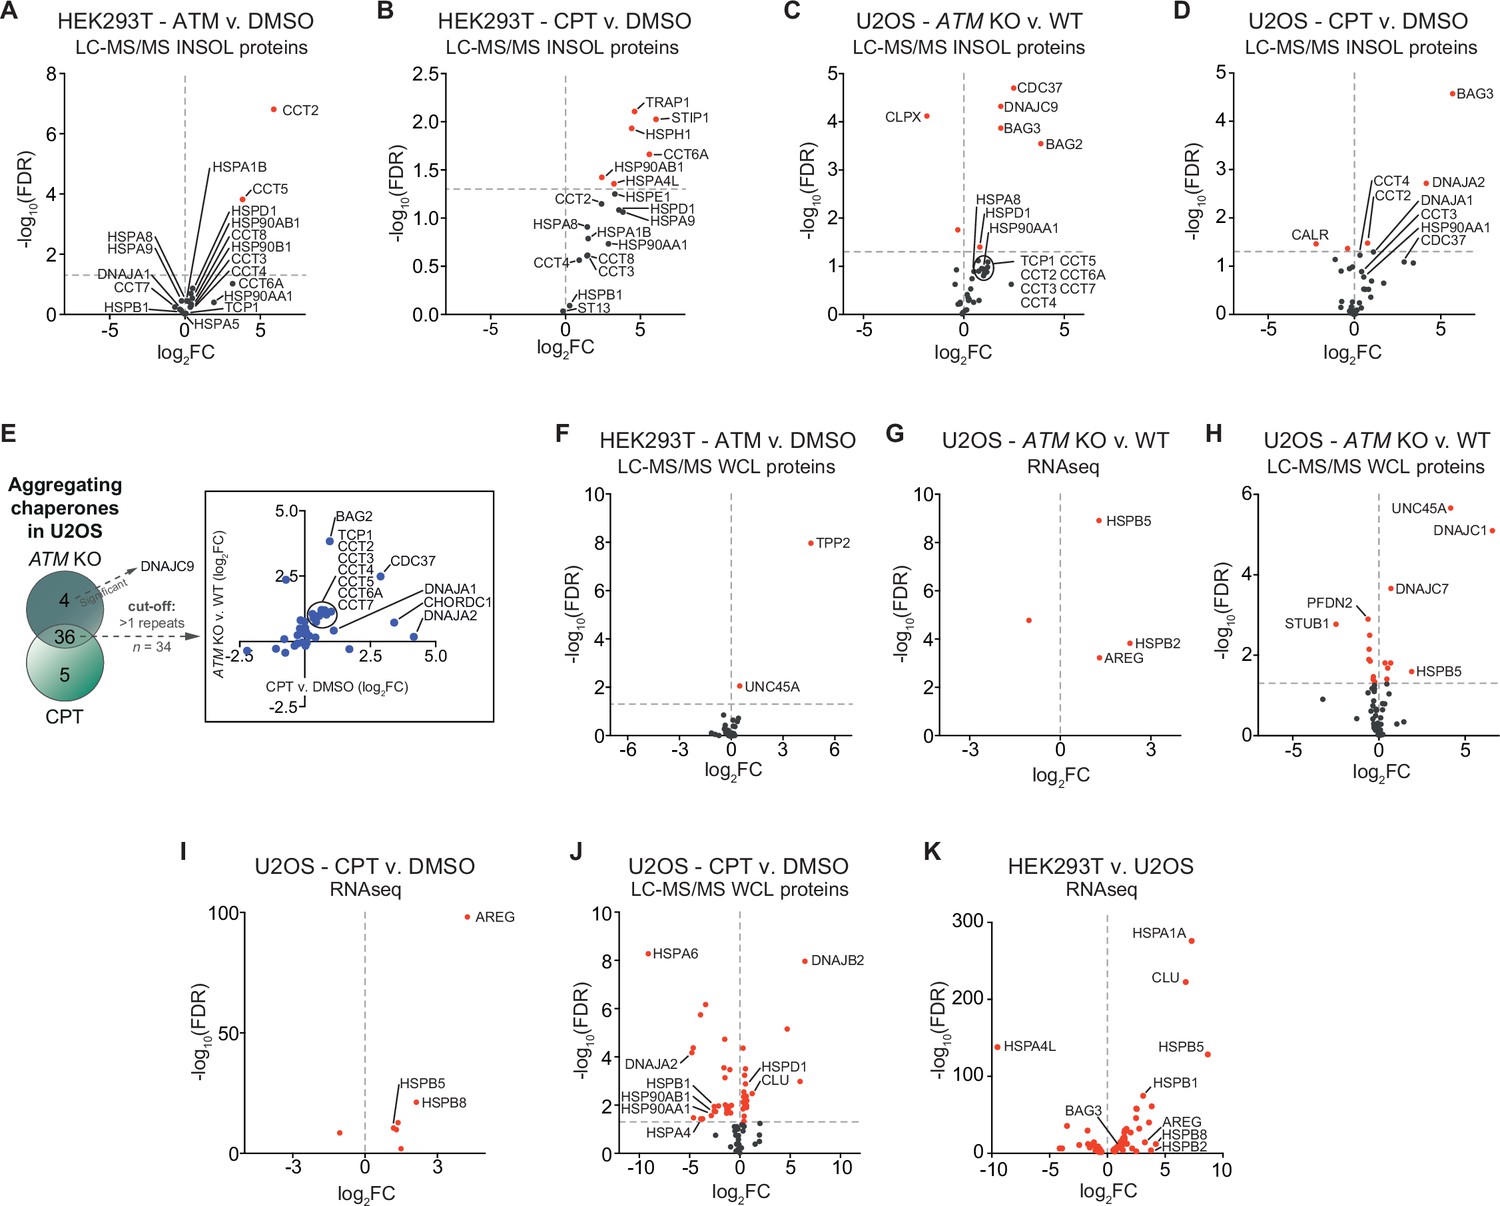
(A–D) Volcano plots showing the presence of (co)chaperones in SDS-insoluble fractions as identified via MS/MS analysis for HEK293T ATM vs. DMSO, HEK293T camptothecin (CPT) vs. DMSO, U2OS ATM KO vs. wild-type, and U2OS CPT vs. DMSO, respectively. Red circles depict (co)chaperones with a statistically significant log2FC. (E) Presence of (co)chaperones in the aggregated protein fractions in U2OS cells. Left panel: Venn diagram showing the overlap in aggregating chaperones for the increased aggregating fractions. Right panel: graph depicting the overlap in aggregating chaperones in detail. (F, H, J) Differential expression of (co)chaperones as identified via MS/MS analysis for HEK293T ATM inhibitor vs. DMSO, U2OS ATM KO vs. wild-type, and U2OS CPT vs. DMSO, respectively. (G, J) Differential expression of (co)chaperones as determined via RNAseq for U2OS ATM KO vs. wild-type and U2OS CPT vs. DMSO, respectively. (K) Differentially expressed (co)chaperones in U2OS cells compared to HEK293T cells, as determined via RNAseq.
Figure 5—figure supplement 2
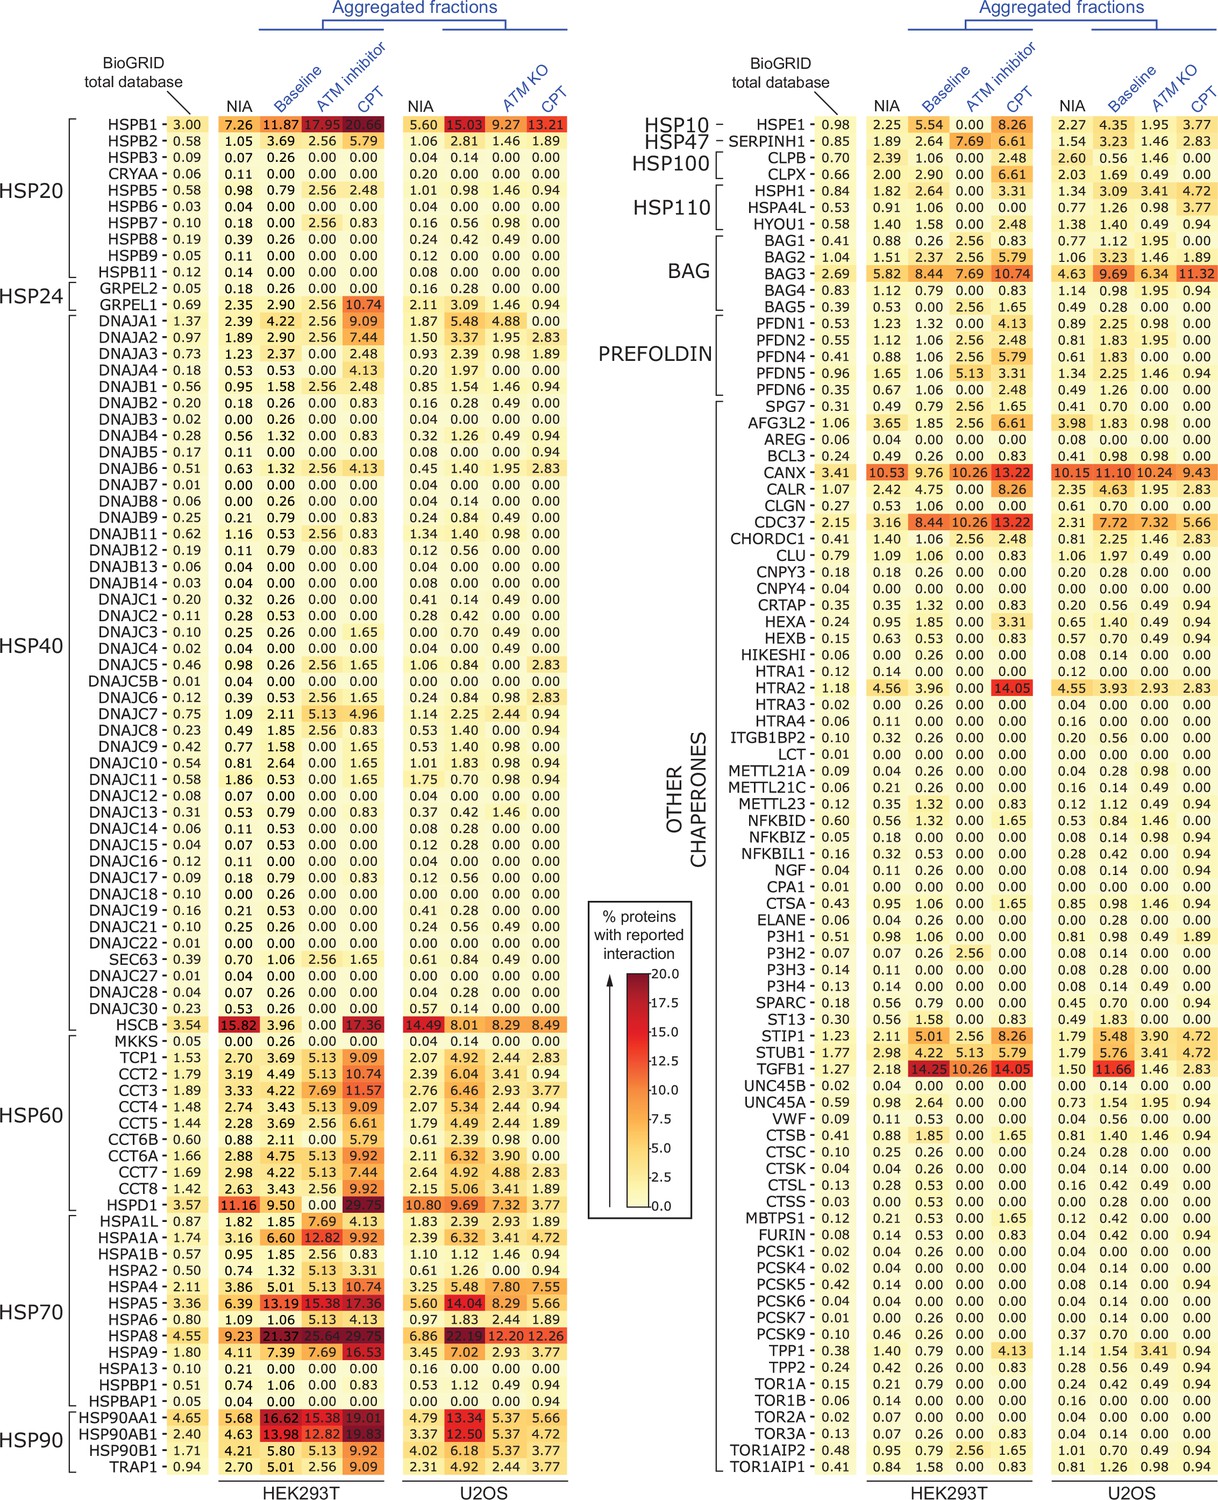
Heatmaps of chaperone interactions of aggregating fractions.
Complete overview of (co)chaperone interactions with the indicated fractions identified in this study as logged in BioGRID, per (co)chaperone. Darker colors represent a higher percentage of proteins with a reported binding to that (co)chaperone.
Figure 6 with 2 supplements
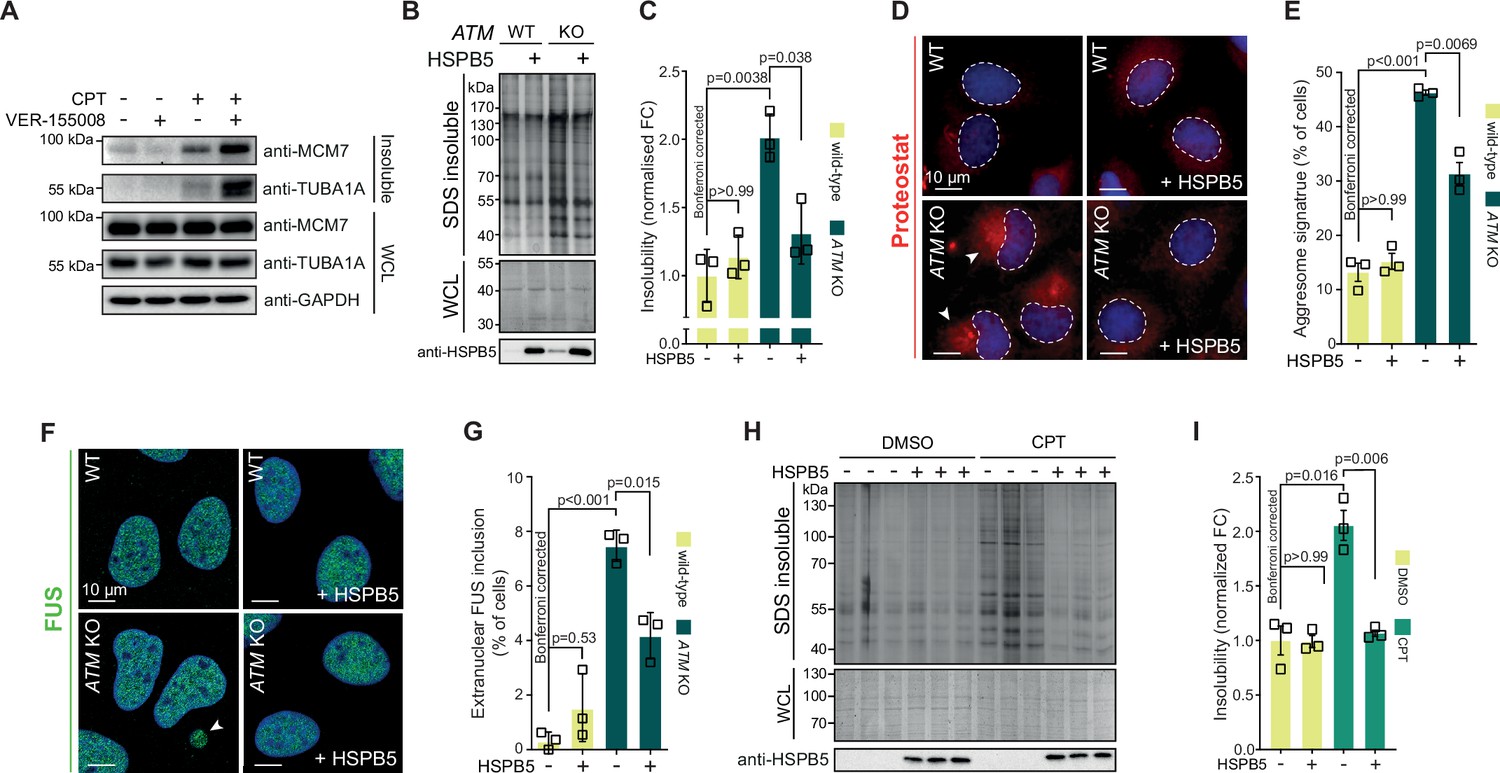
Protein aggregation triggered by genotoxic stress is amenable to modulation by chaperones.
See also Figure 6—figure supplements 1 and 2. (A) Western blot of whole-cell lysate (WCL) and aggregated proteins isolated from HEK293T cells treated transiently with DMSO or camptothecin (CPT), followed by treatment with the VER-155008 HSP70 inhibitor (10 μM), probed with the indicated antibodies. n = 3. (B) Aggregated (silver stain) and WCL (Coomassie) fractions of U2OS wild-type and ATM KO cells, with or without overexpression of HSPB5. (C) Quantification of (B). (D) Representative immunofluorescence pictures of U2OS wild-type and ATM KO cells stably overexpressing HSPB5 or not, stained with ProteoStat (red) and Hoechst (blue). (E) Quantification of aggresome signatures in (D). (F). Representative immunofluorescence pictures of U2OS wild-type and ATM KO cells stably overexpressing HSPB5 or not, stained with anti-FUS (green) and Hoechst (blue). (G) Quantification of extranuclear FUS inclusions in (F). (H) Aggregated (silver stain) and WCL (Coomassie) fractions of HEK293 cells stably overexpressing HSPB5 or not, treated transiently with DMSO or CPT. Three technical repeats are shown here. (I) Quantification of three independent biological repeats of (H). In (C), (E), (G), and (I), squares represent independent biological repeats, bars represent mean ± SEM. p-Values are obtained by two-tailed Student’s t-tests followed by a Bonferroni correction for multiple comparisons.
-
Figure 6—source data 1
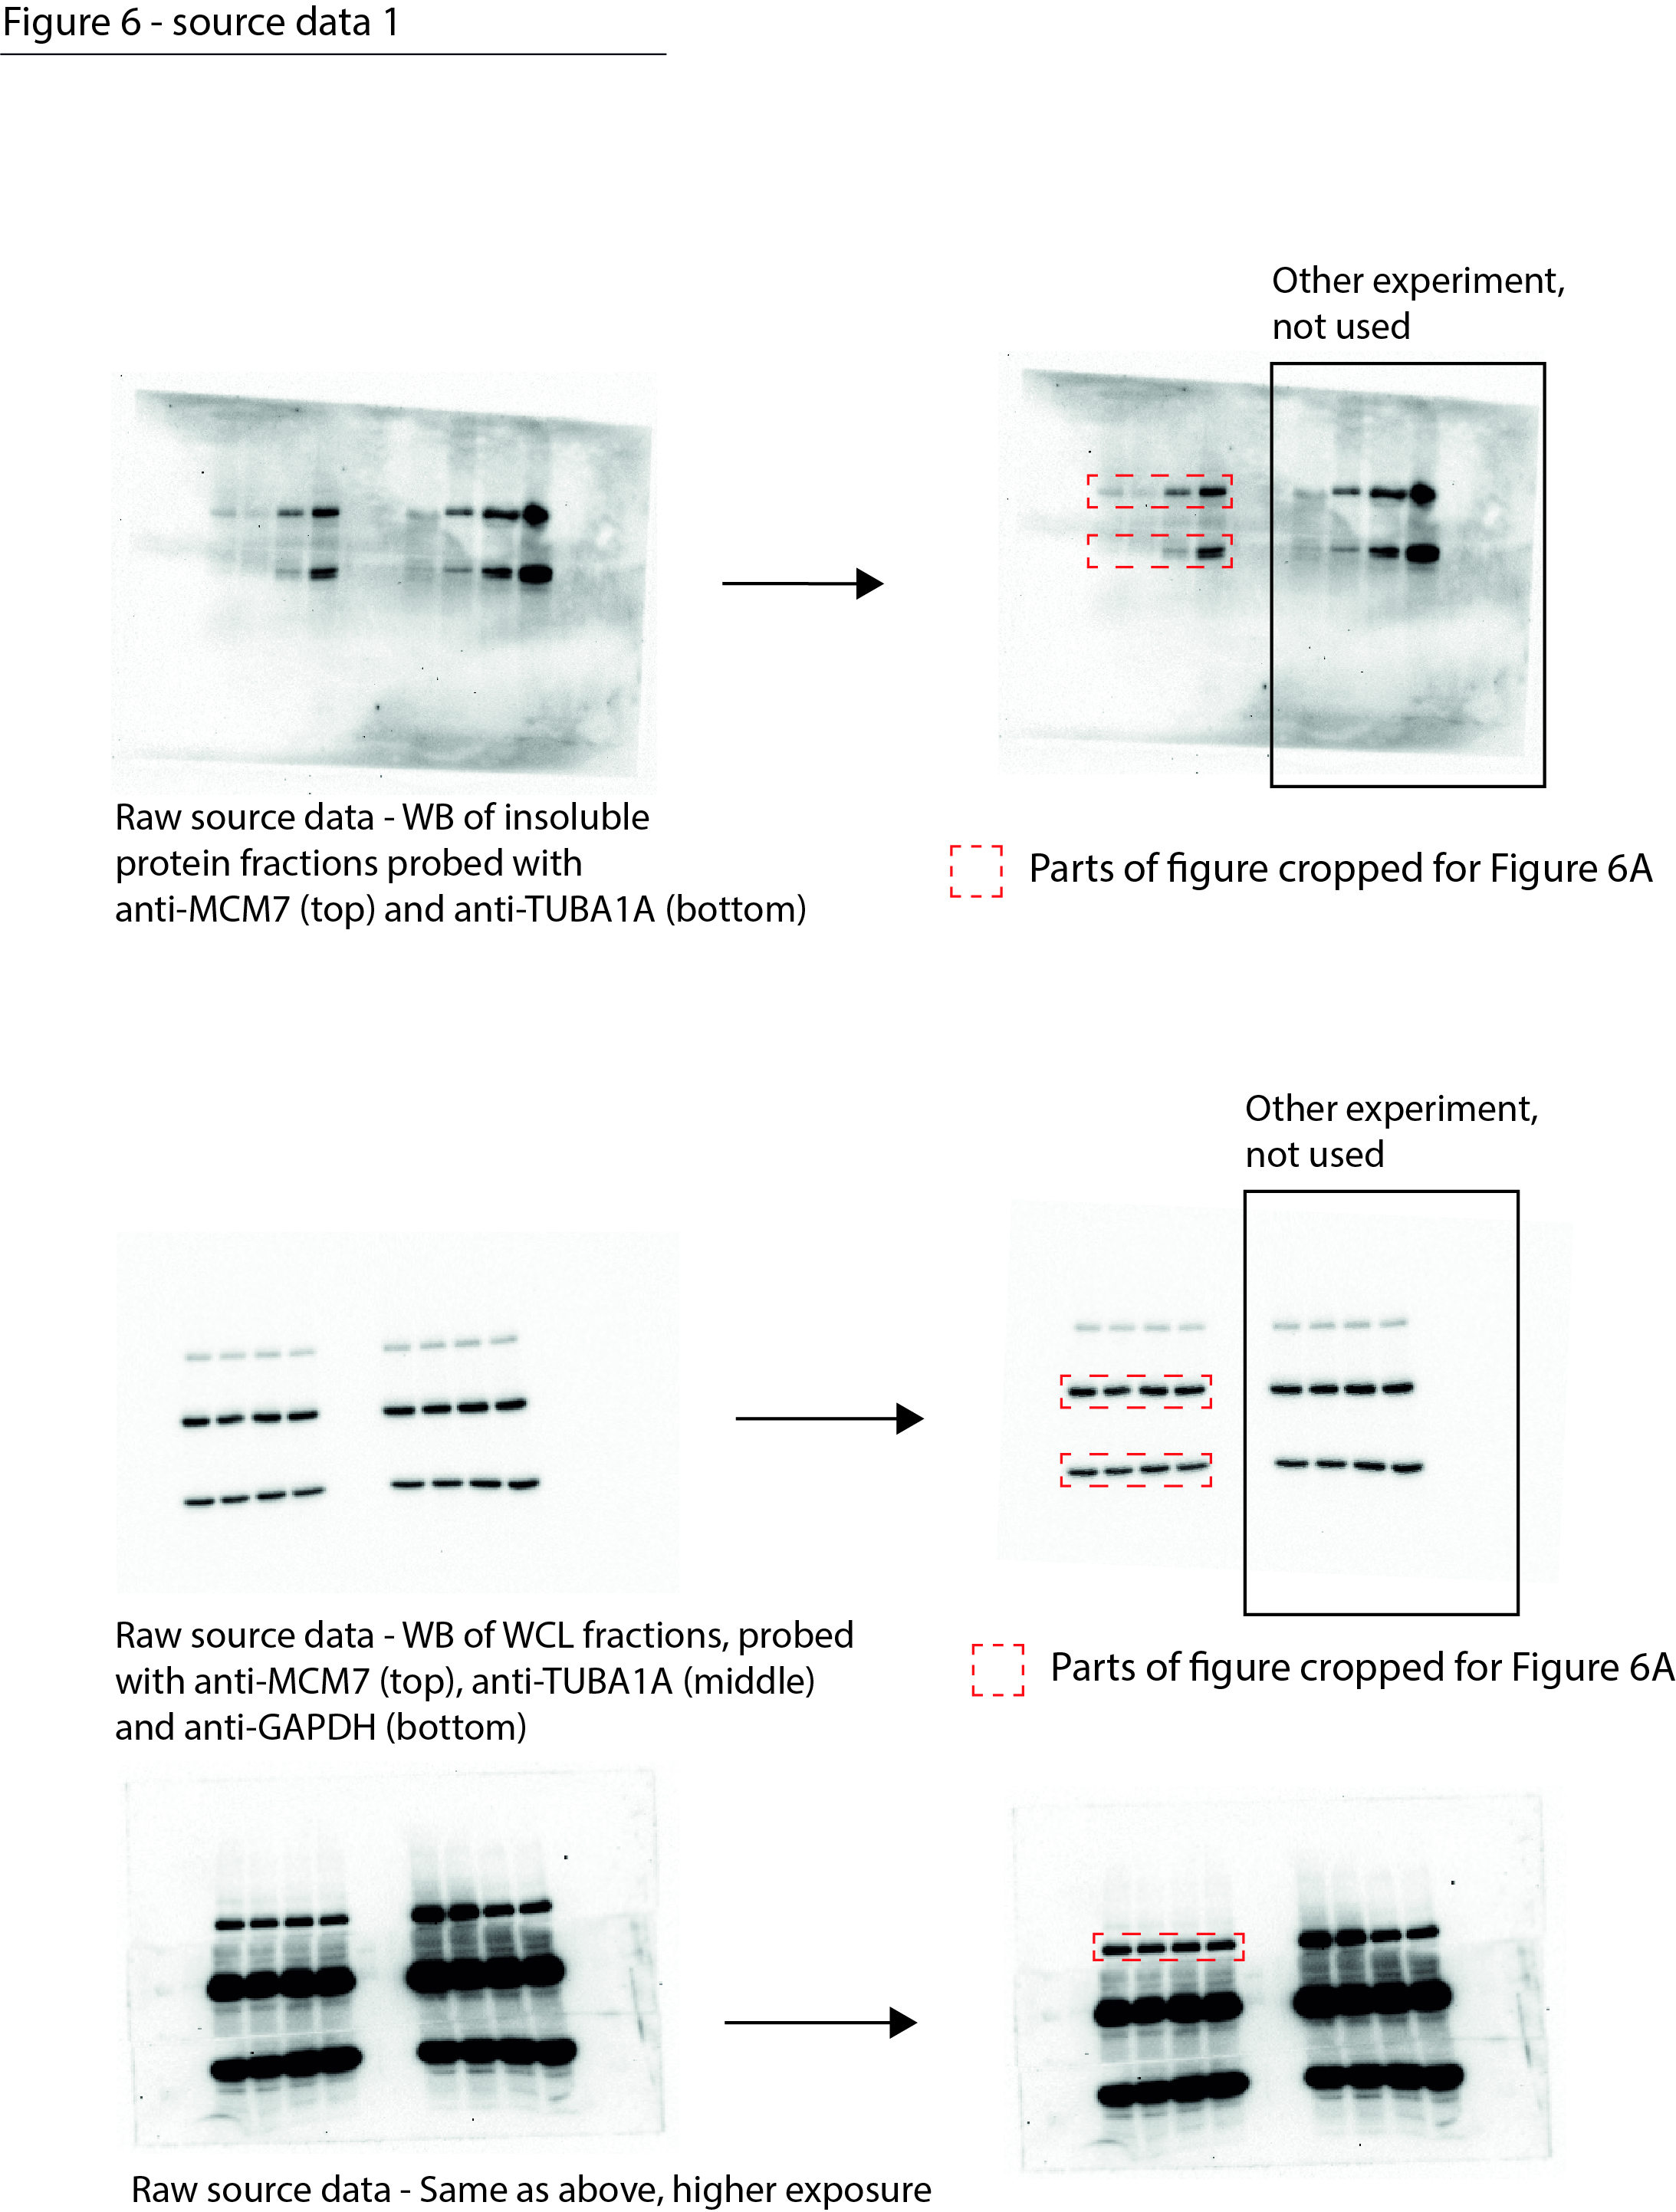
Data from Figure 6A.
Raw Western blot images with each antibody annotated and cropped parts indicated in red.
- https://cdn.elifesciences.org/articles/70726/elife-70726-fig6-data1-v2.jpg
-
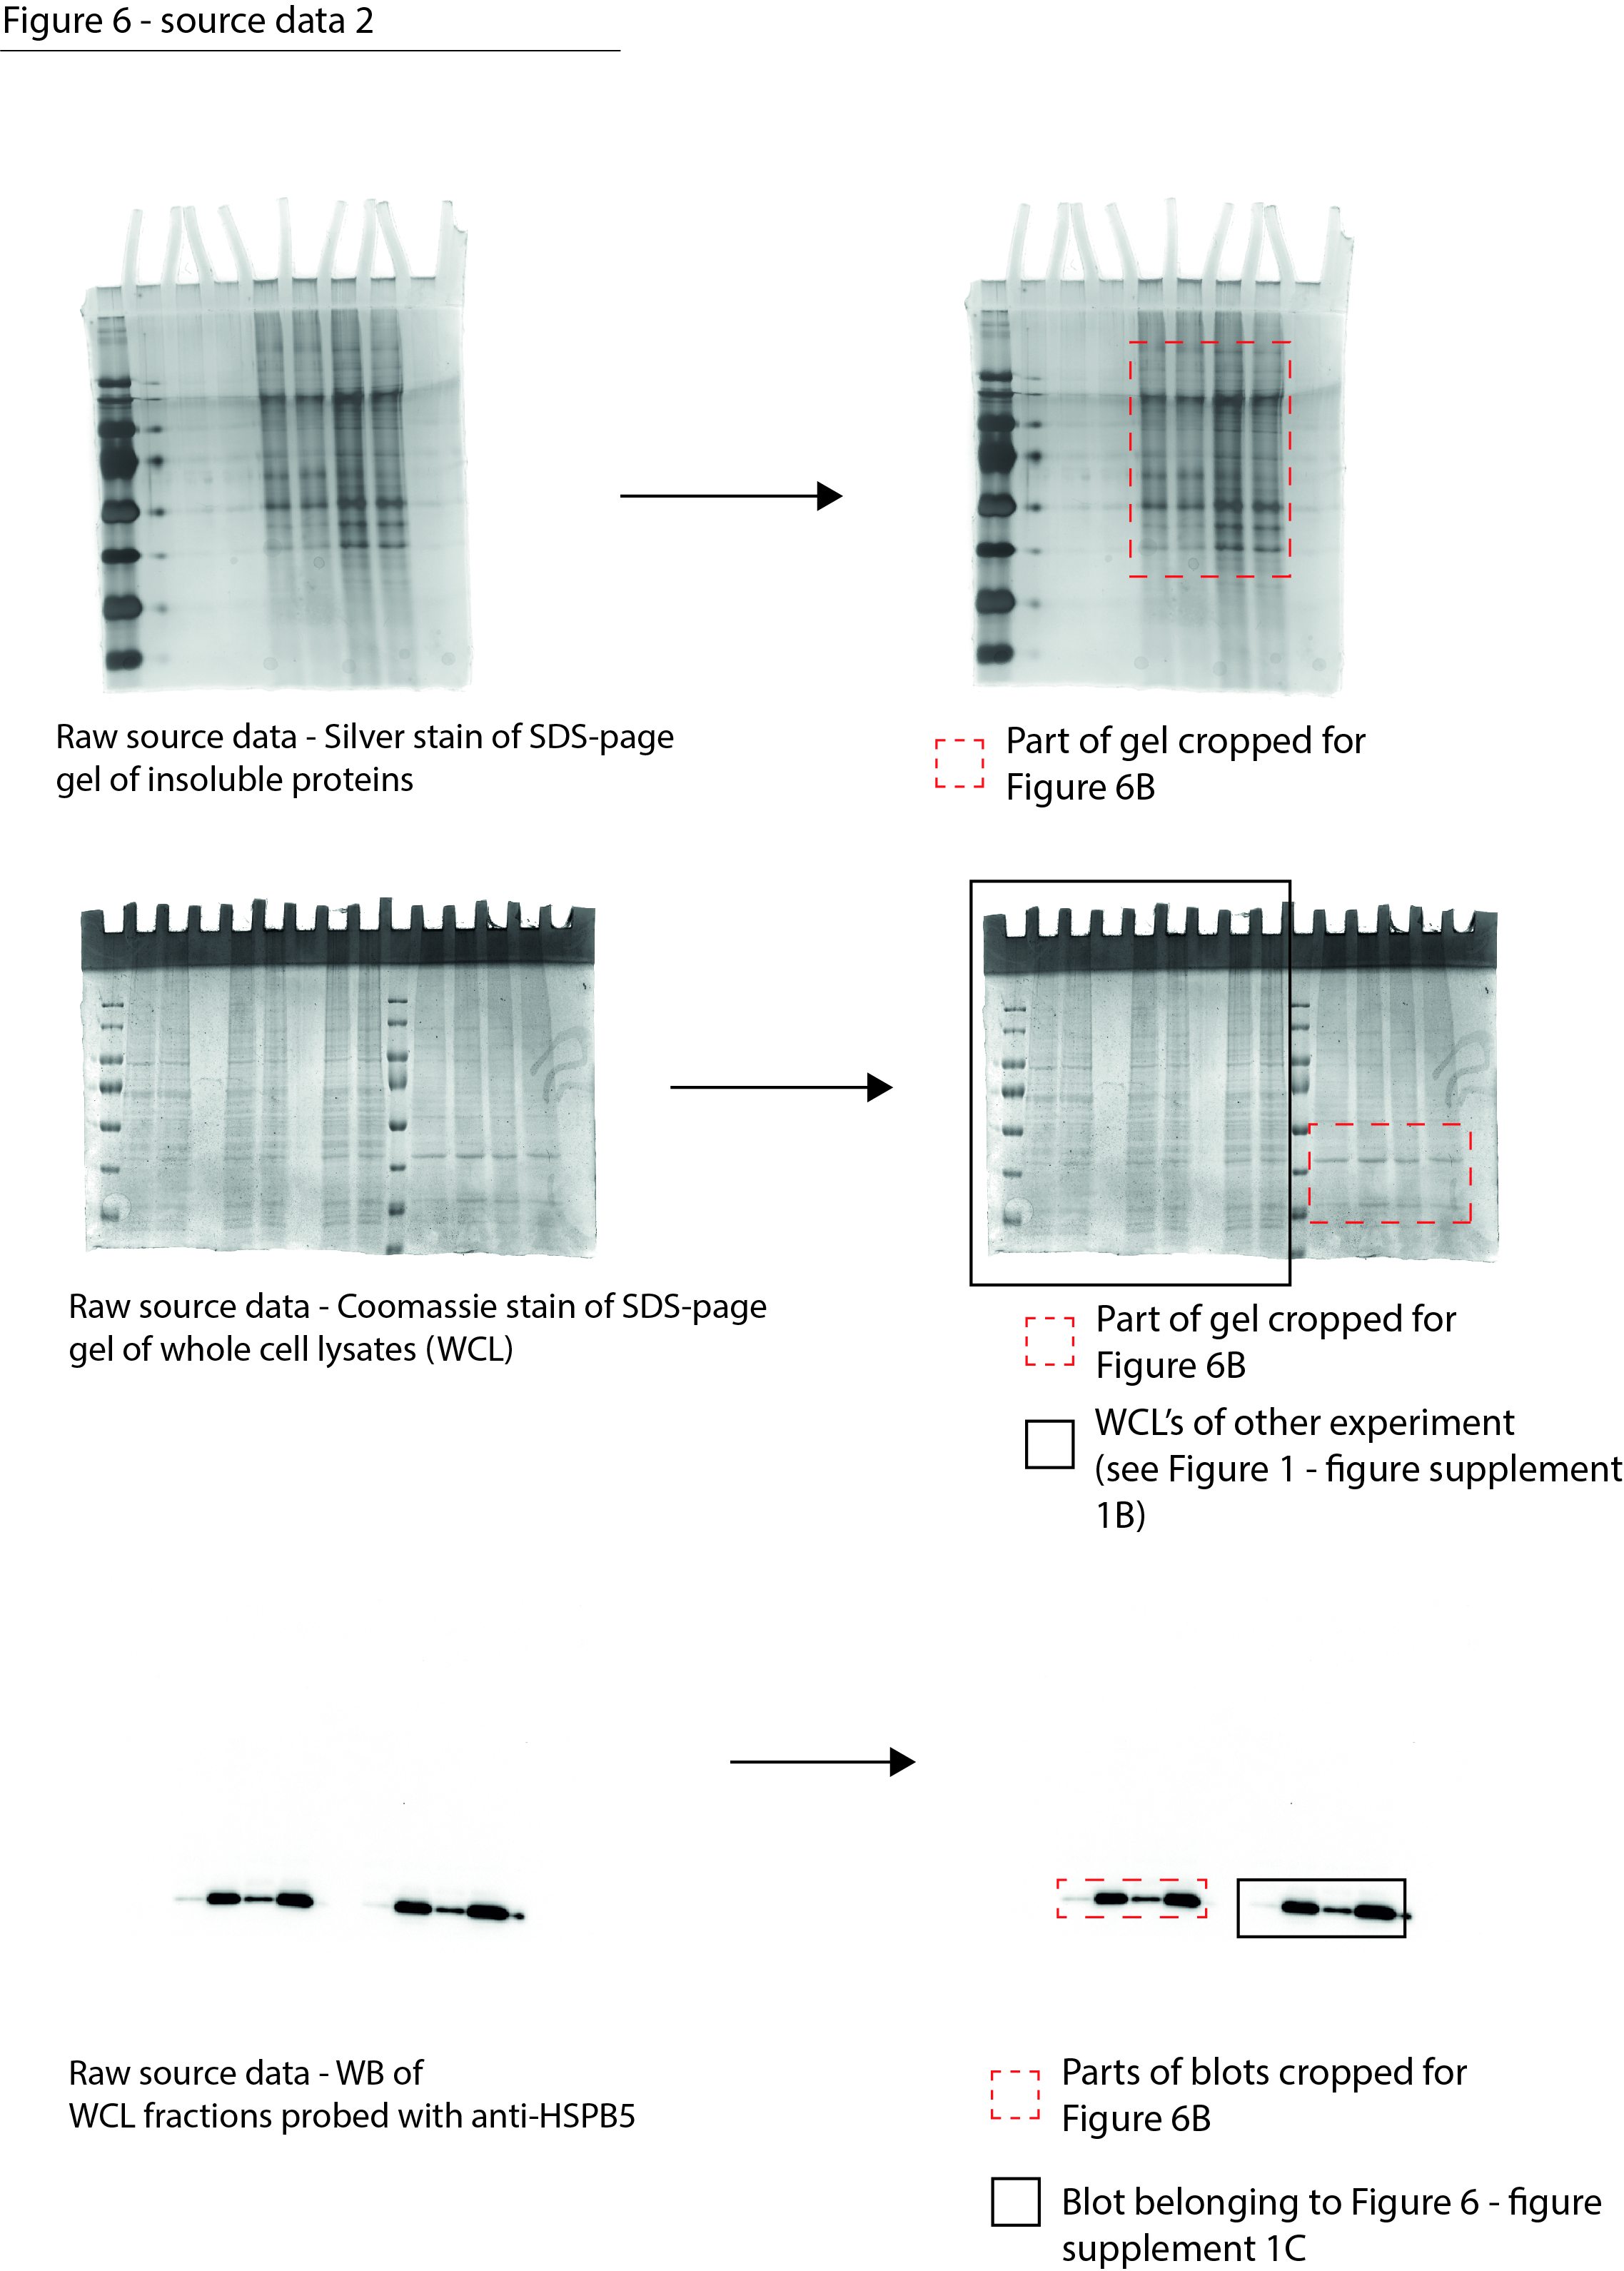
Figure 6—source data 2
Data from Figure 6B.
Raw Coomassie- and silver-stained SDS-PAGE gels and Western blot images with cropped parts indicated in red.
- https://cdn.elifesciences.org/articles/70726/elife-70726-fig6-data2-v2.jpg
-
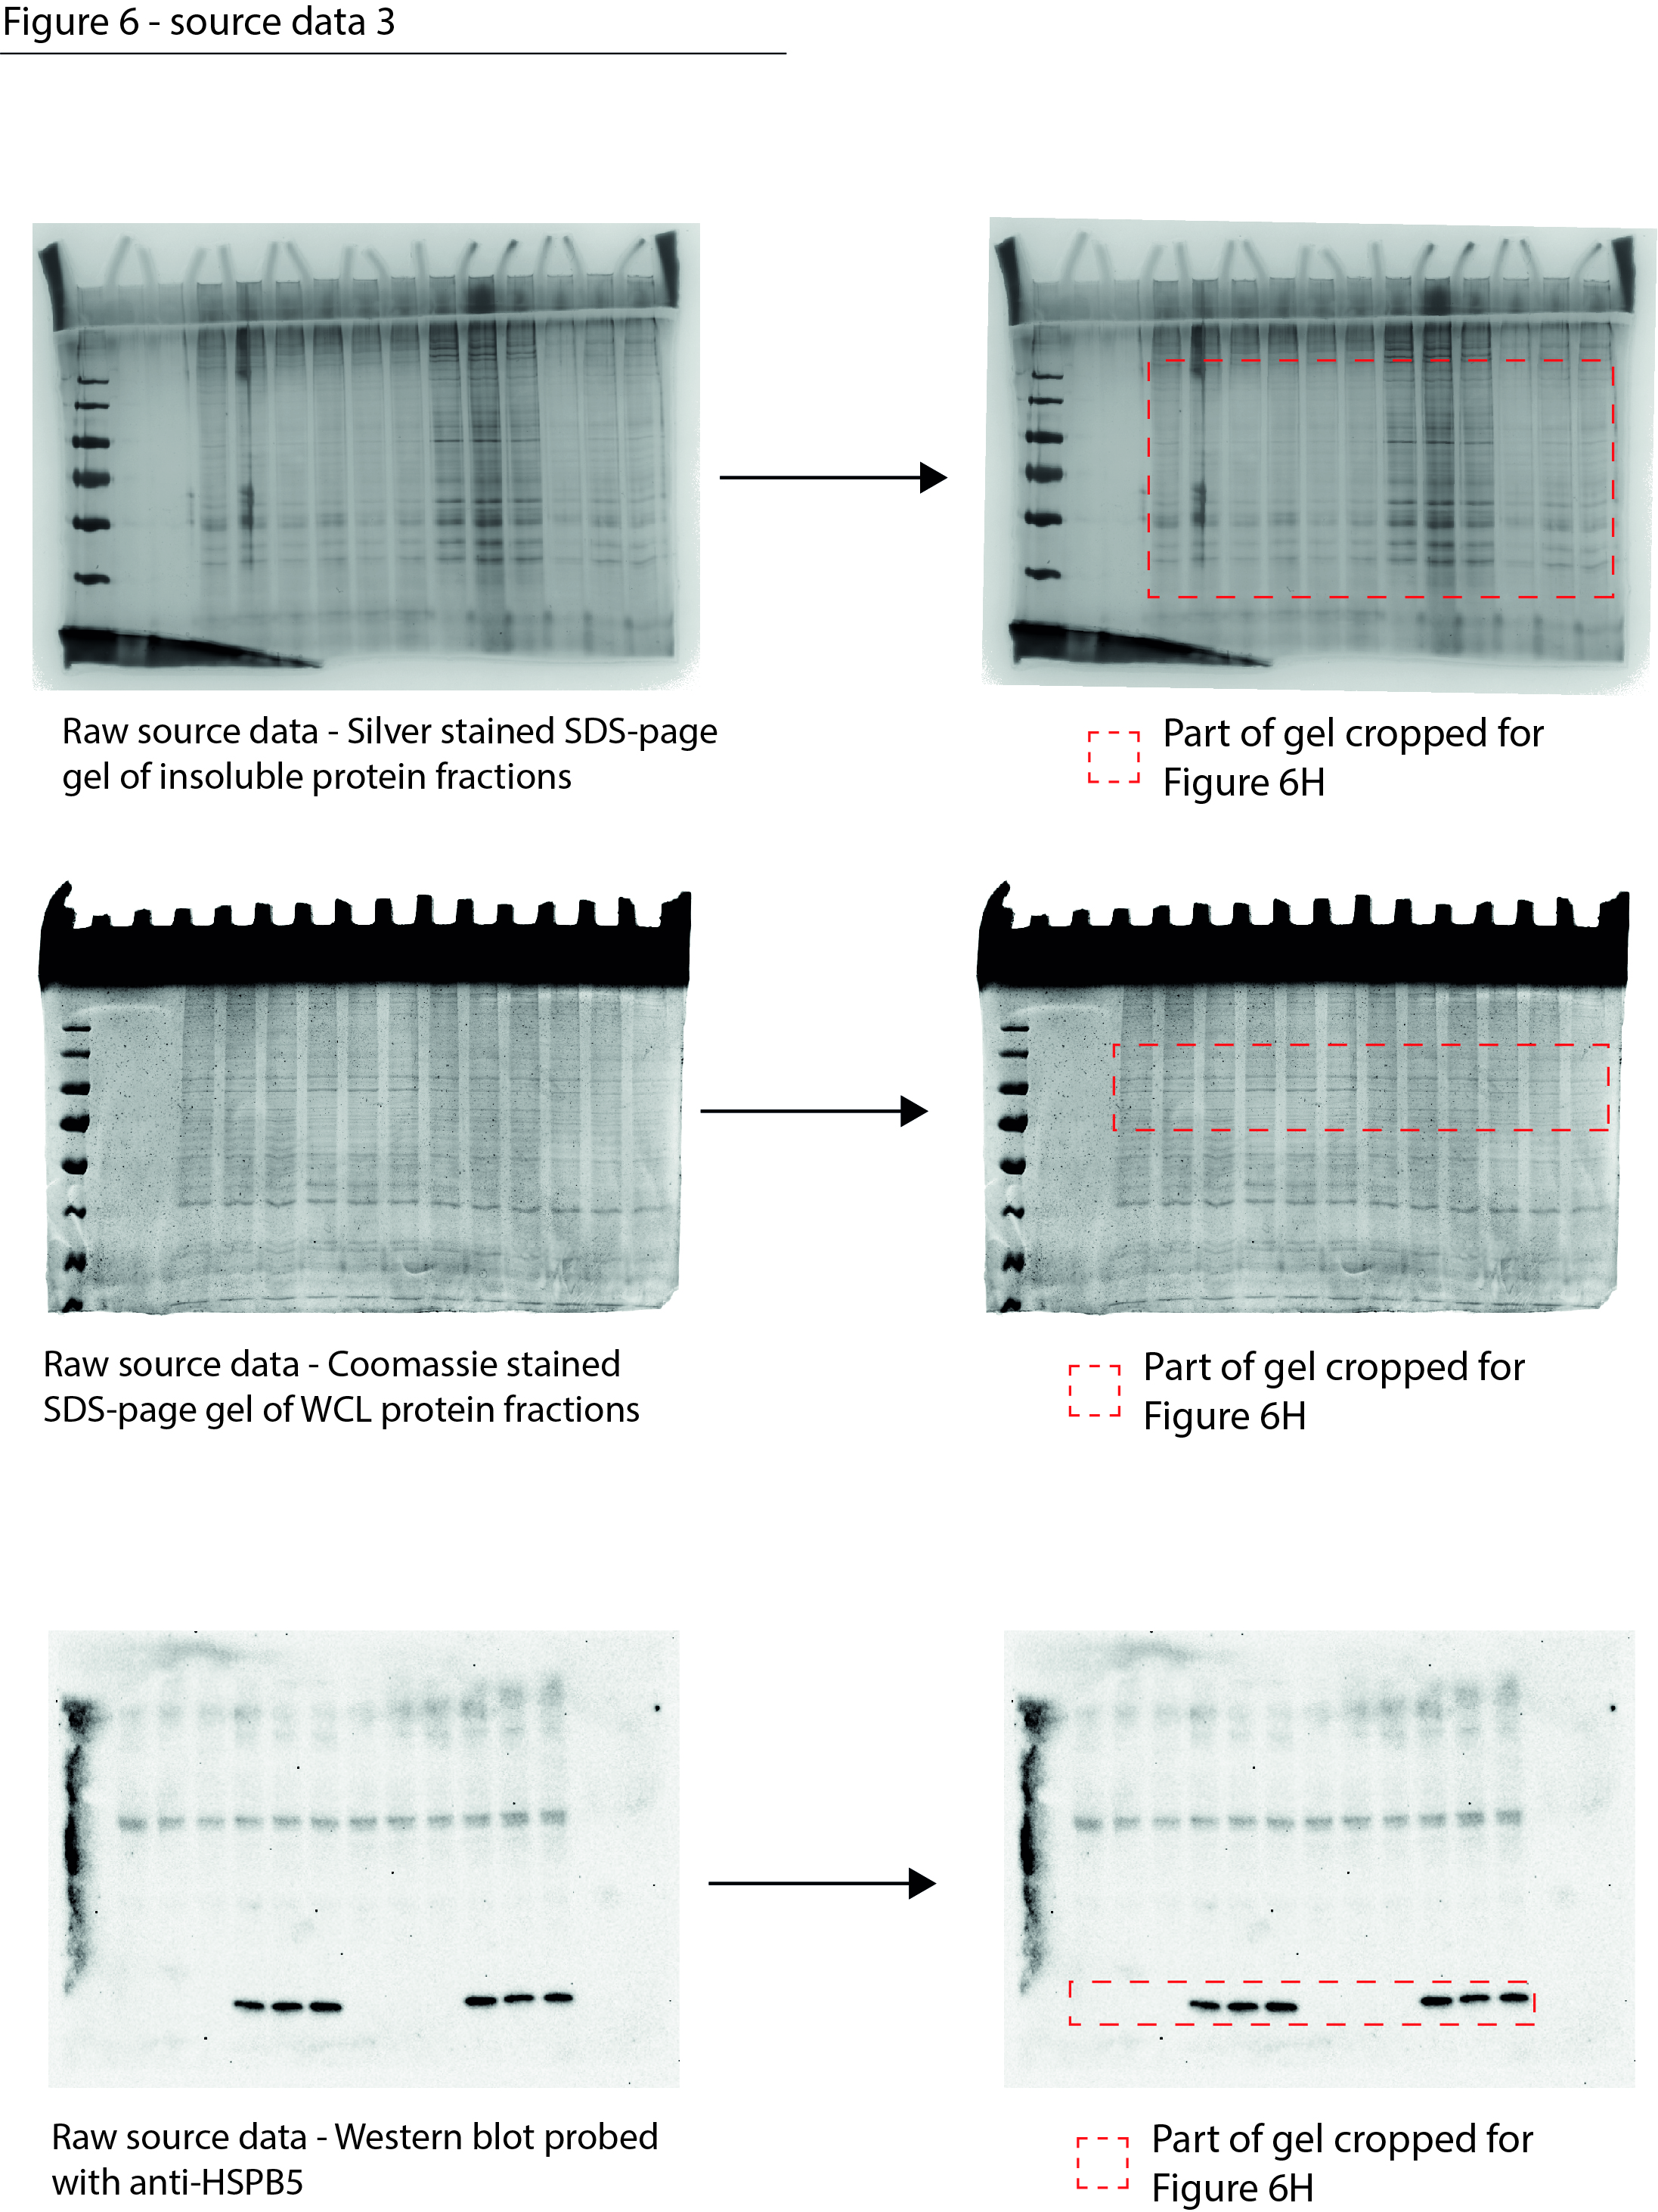
Figure 6—source data 3
Data from Figure 6H.
Raw Coomassie- and silver-stained SDS-PAGE gels and Western blot images with cropped parts indicated in red.
- https://cdn.elifesciences.org/articles/70726/elife-70726-fig6-data3-v2.jpg
Figure 6—figure supplement 1
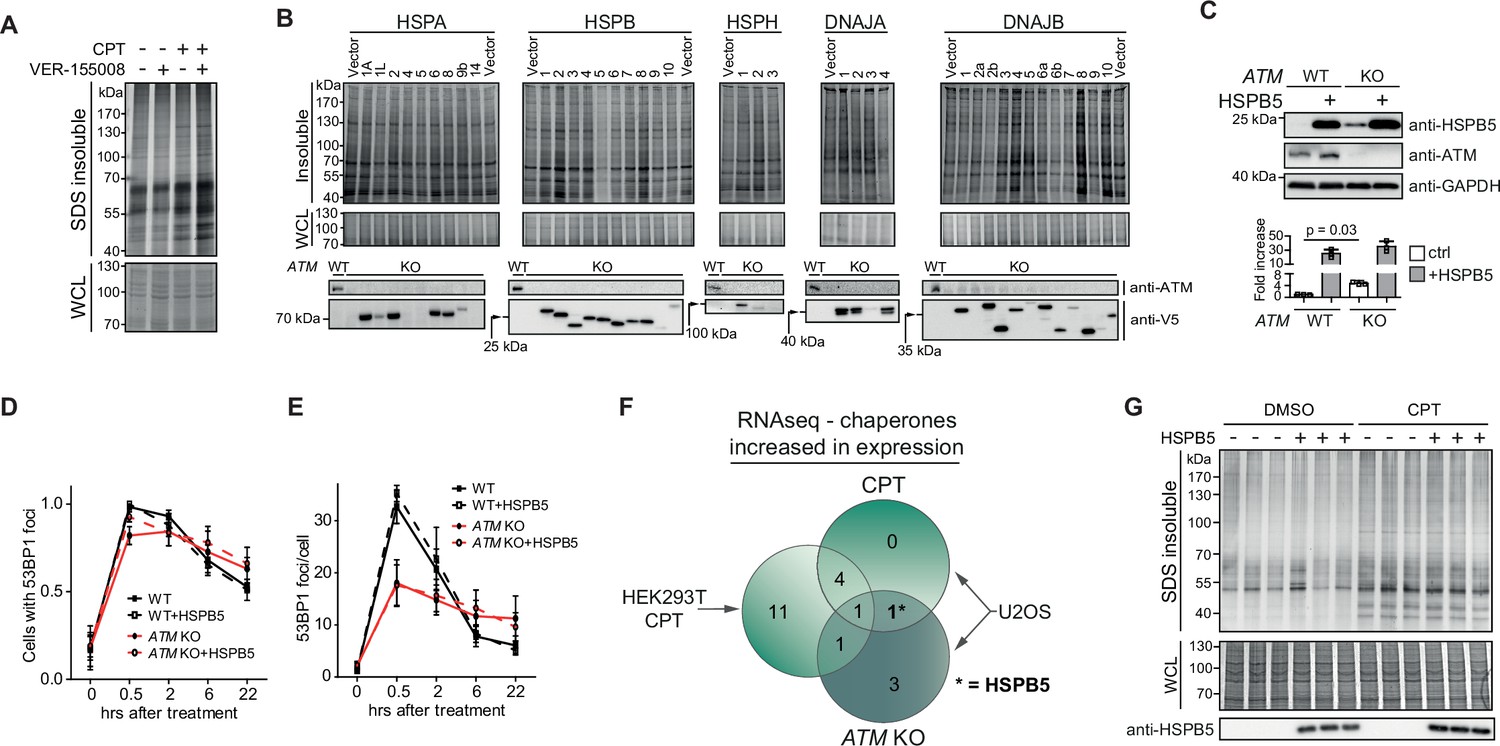
HSPB5 alleviates protein aggregation triggered by a loss of ataxia telangiectasia mutated (ATM) in U2OS cells independent of overt DNA repair capacity changes.
(A) Aggregated (silver stain) and whole-cell lysate (WCL; Coomassie) fractions of HEK293T cells treated transiently with DMSO or camptothecin (CPT), followed by treatment with the VER-155008 HSP70 inhibitor (10 μM). n = 2. (B) Screen for chaperones that can alleviate the increase in aggregated proteins in U2OS ATM KO cells. Indicated V5-tagged chaperones were expressed for 48 hr. Cells were fractionated and analyzed. SDS-insoluble and WCL fractions were separated by SDS-PAGE and stained by Coomassie. Underneath a Western blot analysis confirming the overexpression of the indicated chaperones, using the indicated antibodies. Note that not all chaperones were equally well overexpressed. (C) See also Figure 6B and C. Upper panel: Western blot analysis of U2OS wild-type and ATM KO cells stably overexpressing HSPB5 (cell lines generated using retroviral infection, see Materials and methods) or not, probed using the indicated antibodies. Lower panel: quantification of the upper panel. Mean ± SEM, squares indicate independent experiments. Two-tailed Student’s t-test. n = 3. (D) Plot showing the number of U2OS wild-type and ATM KO cells stably overexpressing HSPB5 or not in which 53BP1 foci were present, after 2 Gy of γ-irradiation, at the indicated timepoints post irradiation. (E) Plot showing the number of 53BP1 (antibody: sc-22760) foci per cell in (D). In (D) and (E), bars represent mean ± SD of at least three independent biological repeats. (F) Venn diagram depicting the overlap in upregulated (co)chaperone levels in the indicated cell line and treatment, as determined via RNAseq. Note that only HSPB5 is transcriptionally upregulated under both conditions in U2OS cells, but not CPT-treated HEK293T cells. (G) Aggregated (silver stain) and WCL (Coomassie) fractions of HEK293 cells stably overexpressing HSPB5 or not, treated transiently with DMSO or CPT. Three technical repeats are shown. n = 2 (independent biological repeats).
-
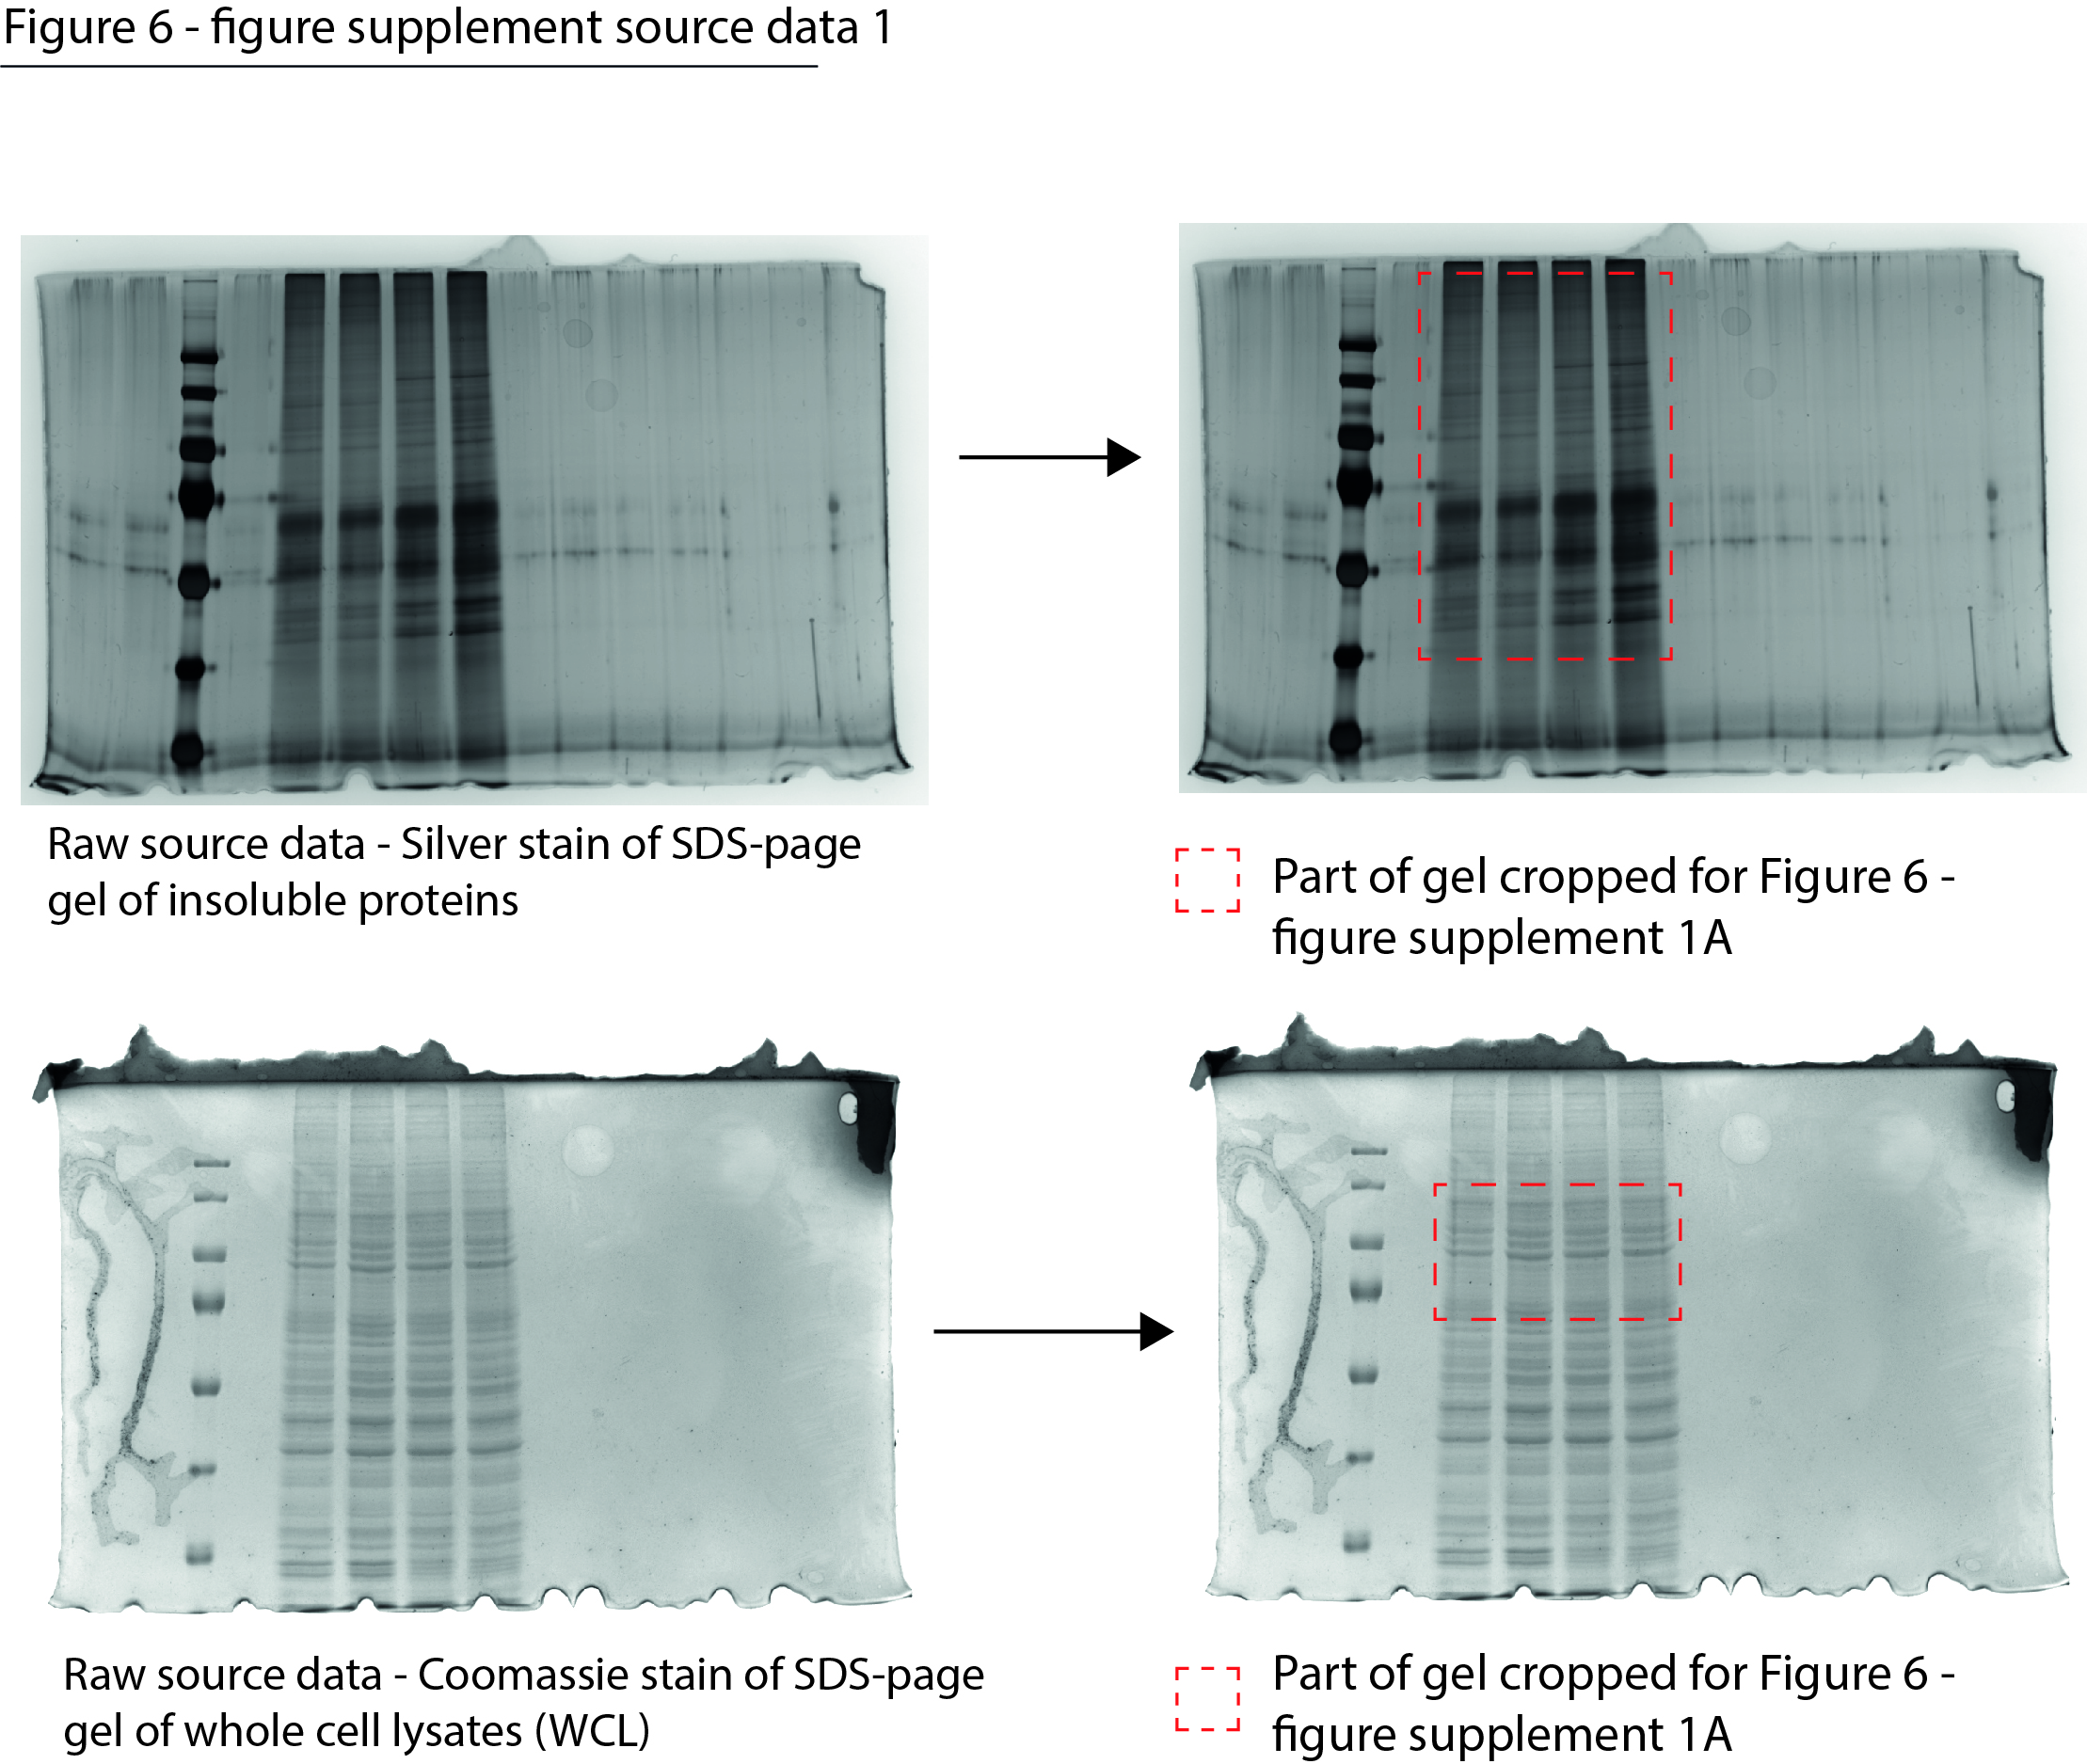
Figure 6—figure supplement 1—source data 1
Data from Figure 6—figure supplement 1A.
Raw Coomassie- and silver-stained SDS-PAGE gels with the cropped parts indicated in red.
- https://cdn.elifesciences.org/articles/70726/elife-70726-fig6-figsupp1-data1-v2.jpg
-
Figure 6—figure supplement 1—source data 2
Data from Figure 6—figure supplement 1B.
Raw Coomassie-stained SDS-PAGE gels with the cropped parts indicated in red. Raw Western blot images with the antibodies annotated and the cropped parts indicated in red.
- https://cdn.elifesciences.org/articles/70726/elife-70726-fig6-figsupp1-data2-v2.zip
-
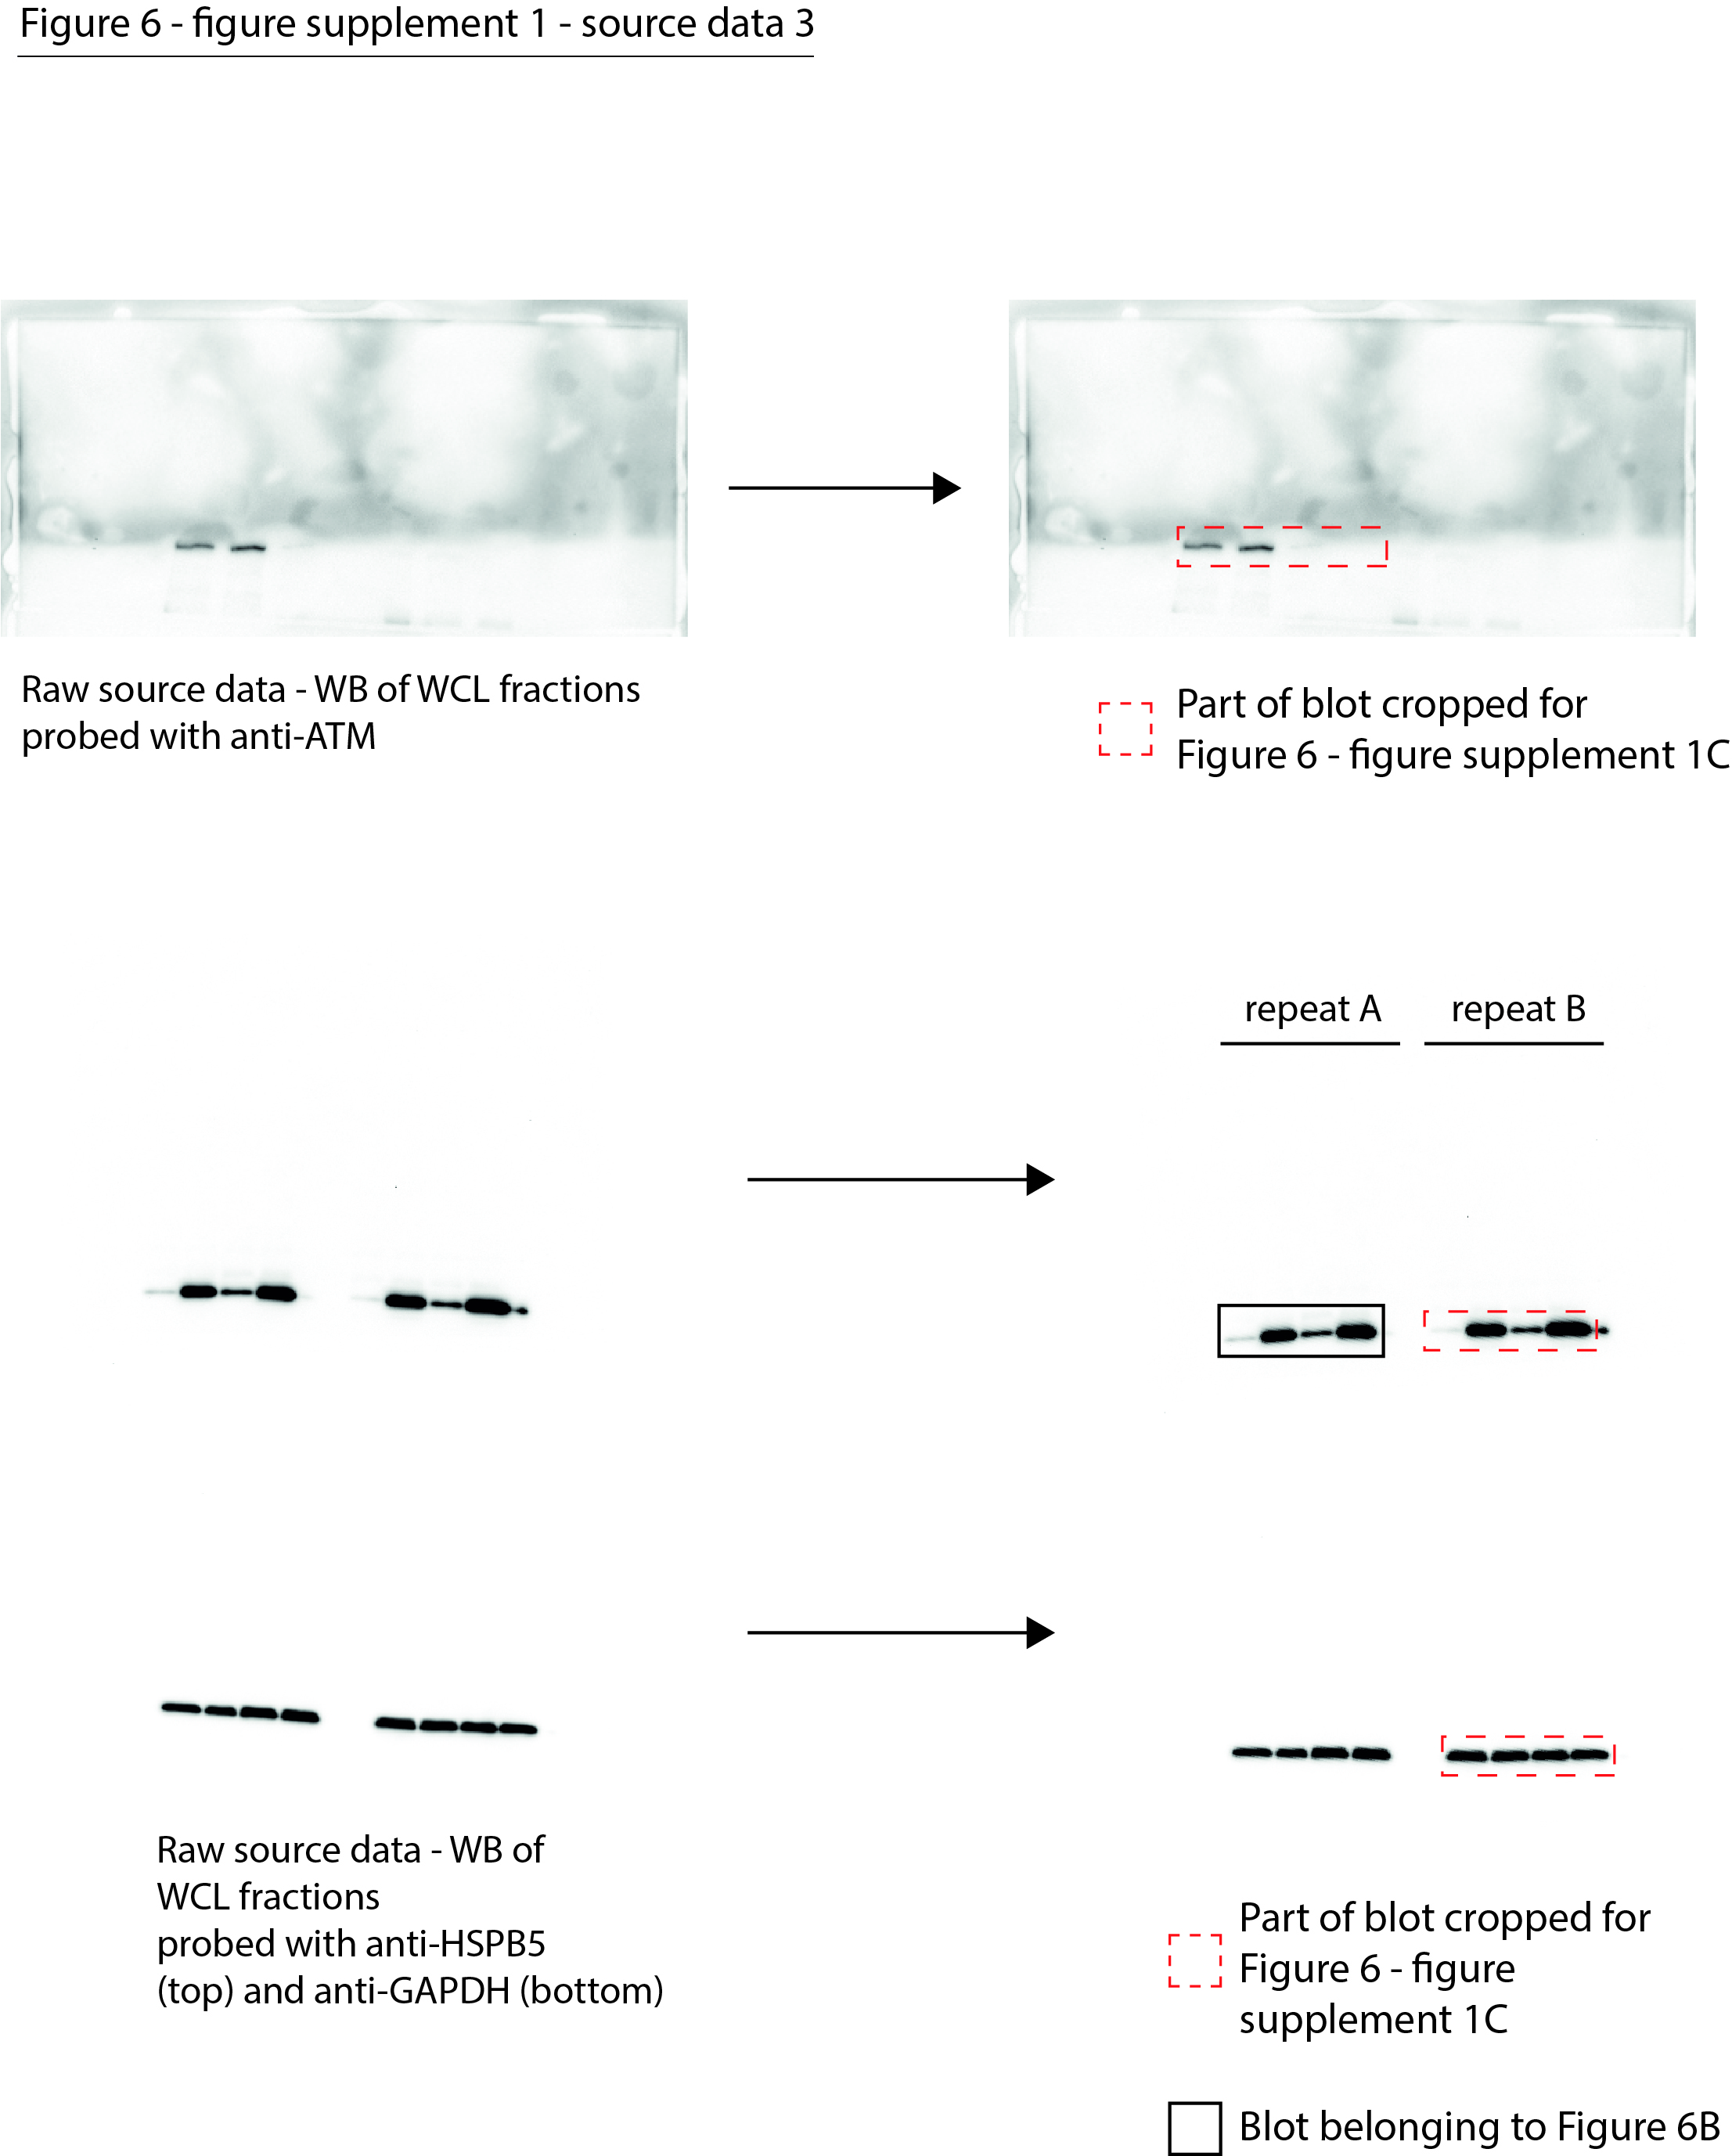
Figure 6—figure supplement 1—source data 3
Data from Figure 6—figure supplement 1C.
Raw Western blot images with the antibodies annotated and the cropped parts indicated in red.
- https://cdn.elifesciences.org/articles/70726/elife-70726-fig6-figsupp1-data3-v2.jpg
-
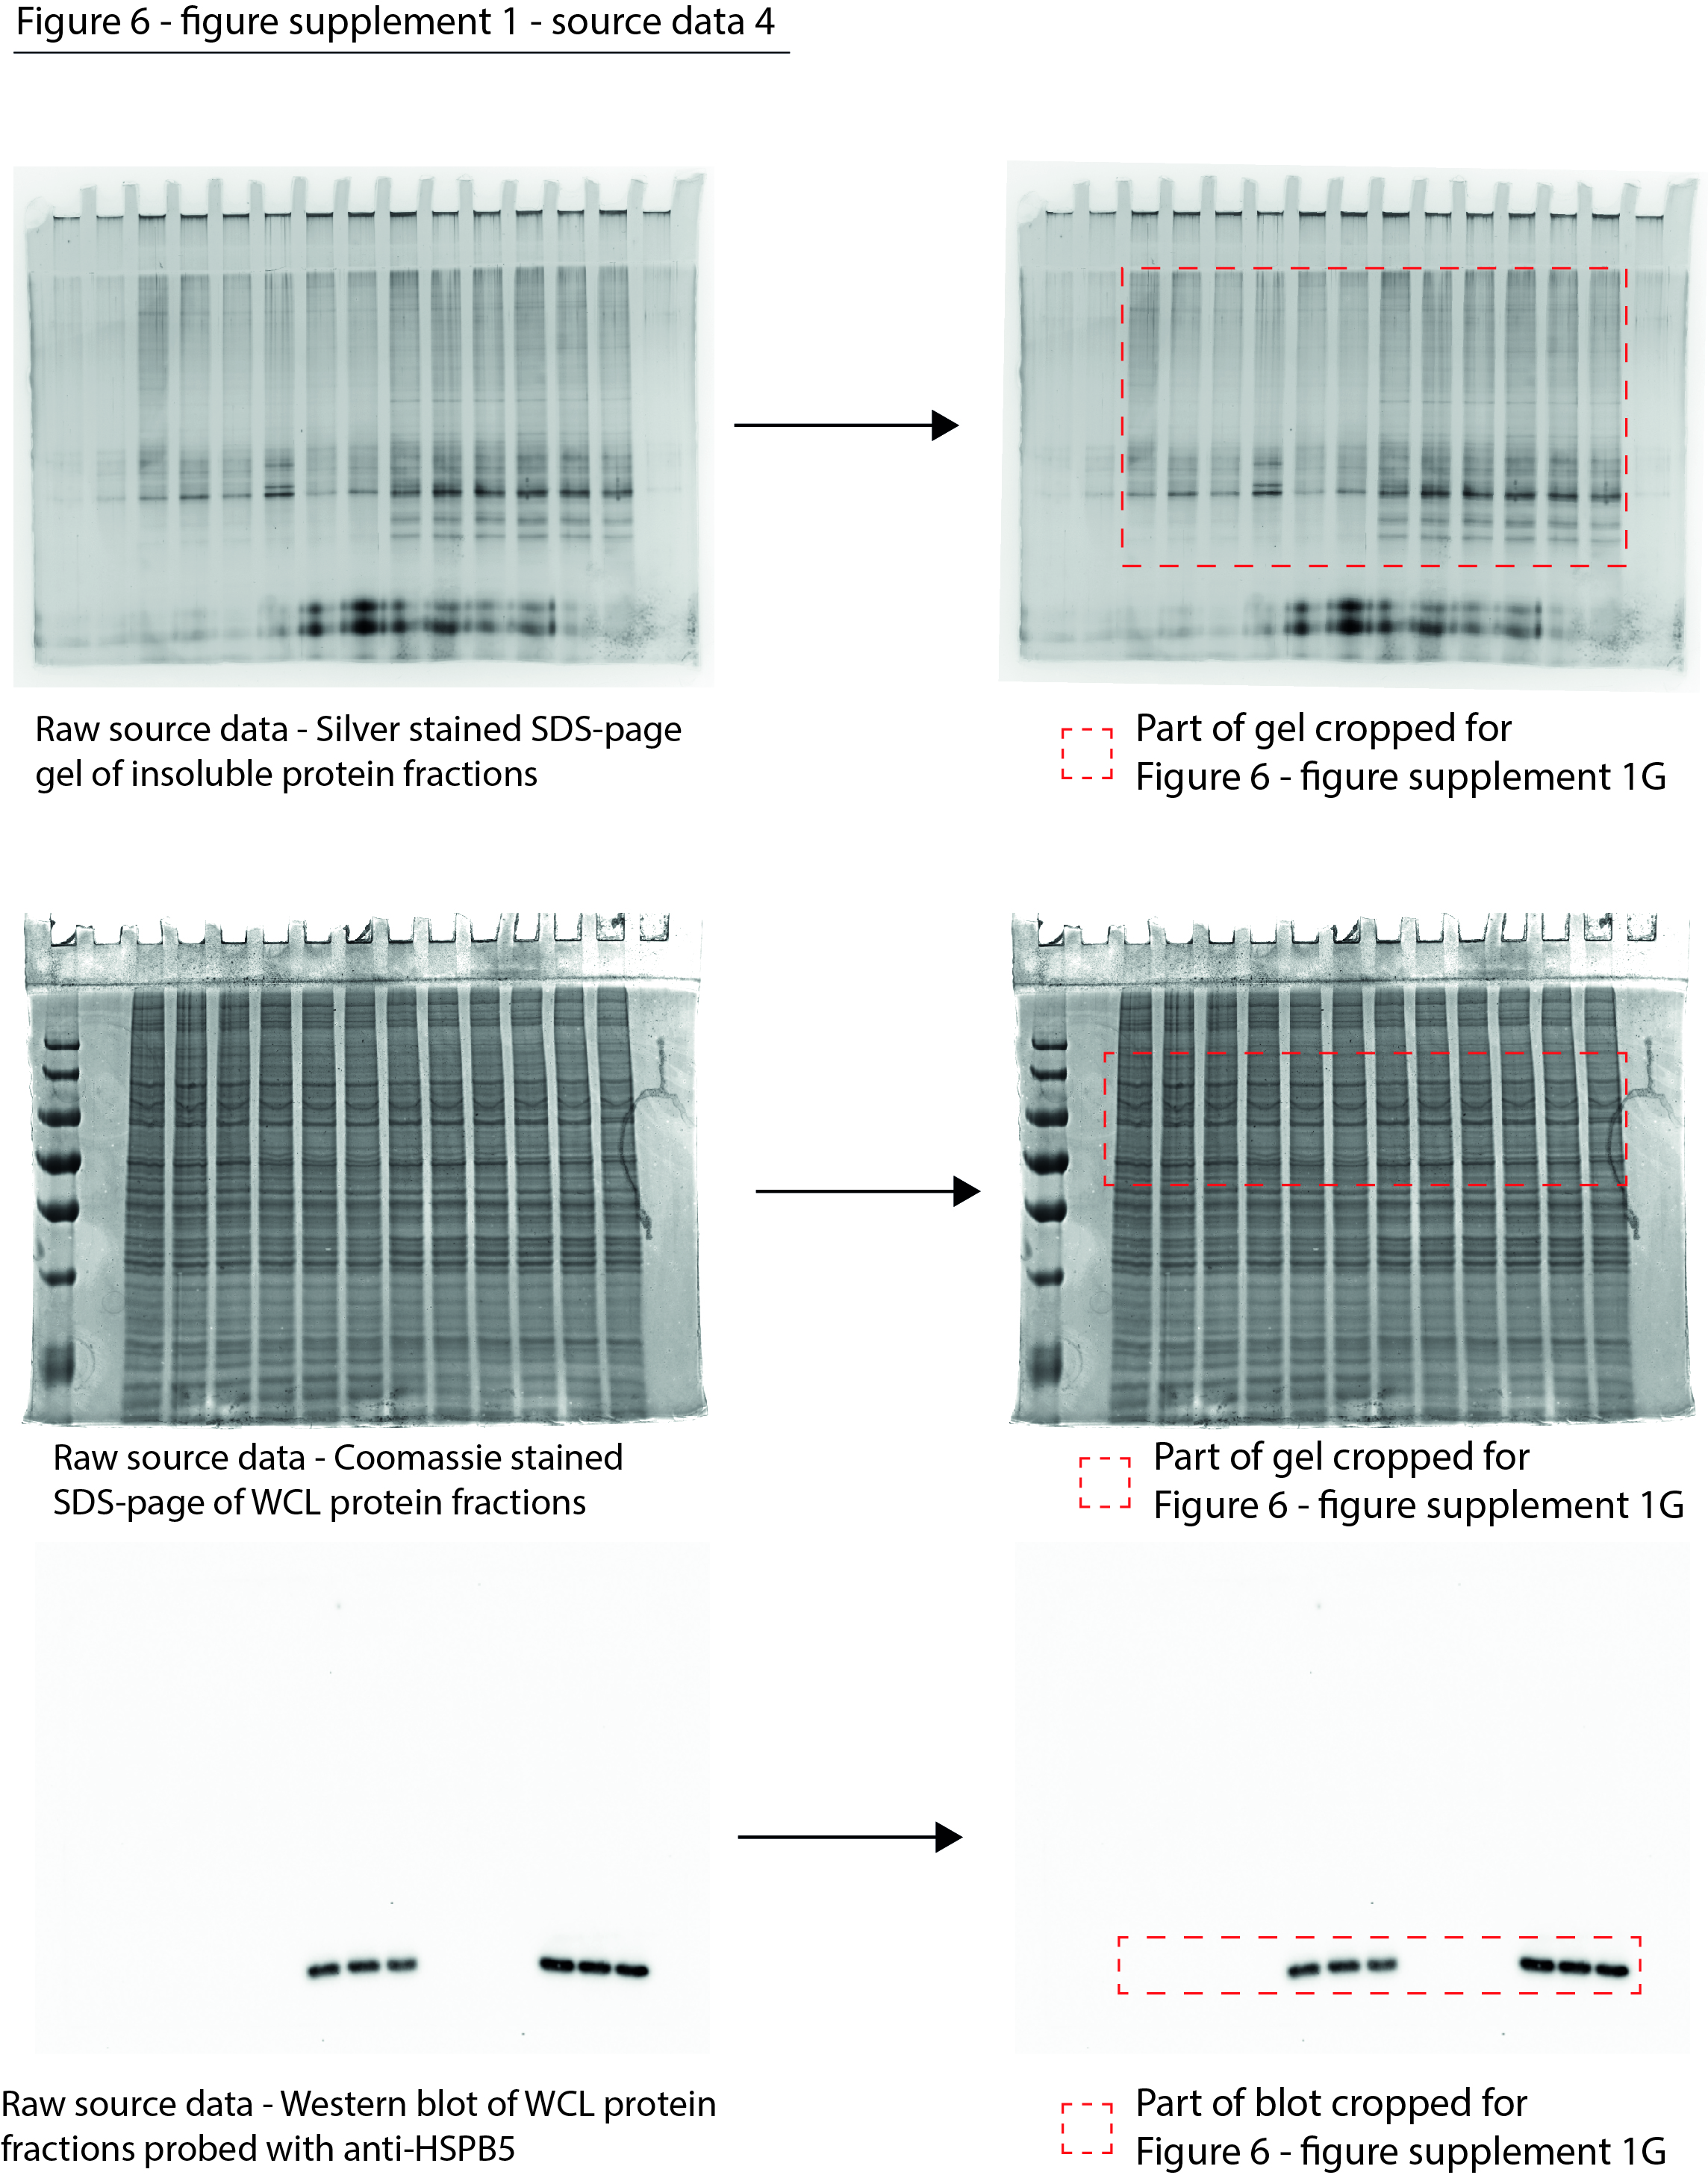
Figure 6—figure supplement 1—source data 4
Data from Figure 6—figure supplement 1G.
Raw Coomassie- and silver-stained SDS-PAGE gels and Western blot images with the antibodies annotated and the cropped parts indicated in red.
- https://cdn.elifesciences.org/articles/70726/elife-70726-fig6-figsupp1-data4-v2.jpg
Figure 6—figure supplement 2
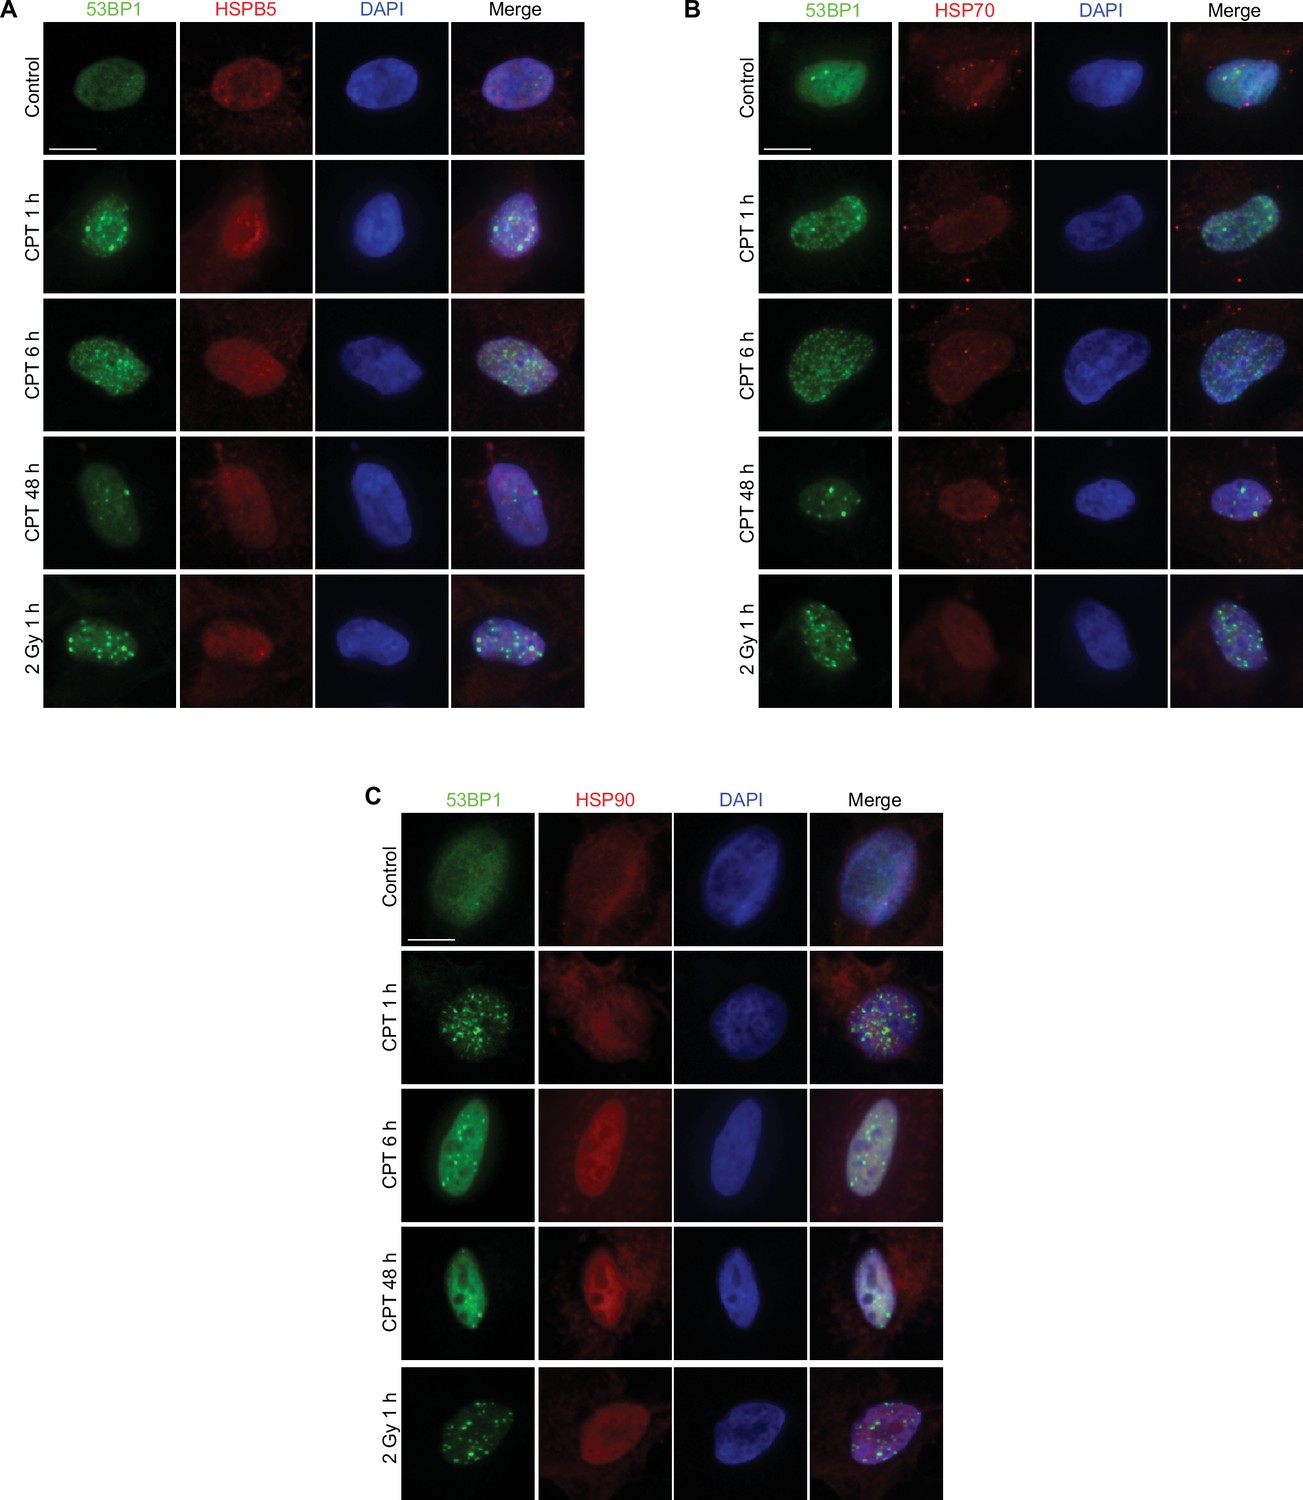
HSPB5, HSP70, and HSP90 do not (re-)localize to DNA damage sites.
(A–C) Representative immunofluorescence pictures of U2OS cells treated with camptothecin (CPT) or gamma-irradiation, stained with anti-HSPB5, anti-HSP70, or anti-HSP90, respectively (in red), anti-53BP1 (antibody: A300-272A; in green) and DAPI (in blue).
Tables
Key resources table
| Reagent type (species) or resource | Designation | Source or reference | Identifiers | Additional information |
|---|---|---|---|---|
| Cell line (human) | HEK293T | ATCC | CRL-3216 | |
| Cell line (human) | HEK293 | ATCC | CRL-1573 | |
| Cell line (human) | HEK293 ATM KO | This study | See ‘Mammalian cell culture’ | |
| Cell line (human) | HEK293 HTT Q71-GFP | PMID:20159555 | See ‘Mammalian cell culture’ | |
| Cell line (human) | HEK293 luciferase-GFP | PMID:21231916 | See ‘Mammalian cell culture’ | |
| Cell line (human) | HEK293+ HSPB5 | This study | See ‘Mammalian cell culture’ | |
| Cell line (human) | U2OS | ATCC | HTB-96 | |
| Cell line (human) | U2OS ATM KO | This study | See ‘Mammalian cell culture’ | |
| Cell line (human) | U2OS + HSPB5 | This study | See ‘Mammalian cell culture’ | |
| Cell line (human) | U2OS ATM KO + HSPB5 | This study | See ‘Mammalian cell culture’ | |
| Cell line (human) | Phoenix-Ampho | ATCC | RRID:CVCL_H716 | Retrovirus packaging cell line |
| Antibody | GFP (mouse, monoclonal) | Takara Bio Clontech | 632380 | WB (1:5000) |
| Antibody | ATM (mouse, monoclonal) | Santa Cruz | Sc-23921 | WB (1:200) |
| Antibody | HSPB5 (mouse, monoclonal) | StressMarq | SMC-159 | WB (1:2000) |
| Antibody | HSPB5 (mouse, monoclonal) | StressMarq | SMC-165 | IF (1:200) |
| Antibody | GAPDH (mouse, monoclonal) | Fitzgerald | 10R-G109a | WB (1:10,000) |
| Antibody | TUB (mouse, monoclonal) | Sigma-Aldrich | T5138 | WB (1:4000) |
| Antibody | HDAC1 (mouse, monoclonal) | DSHB | PCPR-HDAC1-2E12 | WB (0.5 μg/ml) |
| Antibody | MCM7 (Mmouse, monoclonal) | Santa Cruz | 47DC141 | WB (1:100) |
| Antibody | TUBA1A (mouse, monoclonal) | Sigma-Aldrich | T5168 | WB (1:2000) |
| Antibody | FUS (mouse, monoclonal) | Santa Cruz | Sc-47711 | IF (1:200) |
| Antibody | 53BP1 (rabbit, monoclonal) | Santa Cruz | Sc-22760 | IF (1:150) |
| Antibody | 53BP1 (rabbit, monoclonal) | Bethyl | A300-272A | IF (1:500) |
| Antibody | HSP70 (mouse, monoclonal) | StressMarq | SMC-104A | IF (1:100) |
| Antibody | HSP90 (mouse, monoclonal) | StressMarq | SMC-149 | IF (1:100) |
| Recombinant DNA reagent | pQCXIN–HSPB5 (plasmid) | PMID:20843828 | ||
| Recombinant DNA reagent | ATM CRISPR/Cas9 KO (plasmid) | Santa Cruz | sc-400192 | |
| Recombinant DNA reagent | ATM HDR (plasmid) | Santa Cruz | sc-400192-HDR | |
| Sequence-based reagent | HEK293Q71F(forward primer) | This study | PCR primer | GAGTCCCTCAAGTCCTTCC |
| Sequence-based reagent | HEK293Q71R(reverse primer) | This study | PCR primer | AAACGGGCCCTCTAGACTC |
| Commercial assay or kit | Silver stain kit | Pierce (Thermo Scientific) | 24612 | |
| Commercial assay or kit | Allprep DNA/RNA isolation mini kit | QIAGEN | 80004 | |
| Commercial assay or kit | S-trap micro | Protifi | K02-micro-10 | |
| Commercial assay or kit | Masterpure Complete DNA and RNA purificiation kit | Epicentre (supplied through Lucigen) | MC85200 | |
| Commercial assay or kit | QuantSeq 3’ mRNA-Seq library prep kit (FWD) | Lexogen | 015.96 | |
| Chemical compound, drug | Camptothecin | Selleckchem | S1288 | See Table 1 |
| Chemical compound, drug | Etoposide | Sigma-Aldrich | E1383 | See Table 1 |
| Chemical compound, drug | TDP1 inhibitor | Merck | 532177 | See Table 1 |
| Chemical compound, drug | KU-55933 (ATM inhibitor) | Selleckchem | S1092 | See Table 1 |
| Chemical compound, drug | KU 0058948 (PARP inhibitor) | Axon Medchem | 2001 | See Table 1 |
| Chemical compound, drug | VE-821 | Axon Medchem | 1893 | See Table 1 |
| Chemical compound, drug | VER-155008 | Axon Medchem | 1608 | (10 μM) |
| Chemical compound, drug | [S35]Met/cys | Hartmann Analytic | IS-103 | (10 μCi/ml) |
| Chemical compound, drug | ProteoStat | Enzo Life Sciences | ENZ-51023-KP050 | |
| Chemical compound, drug | AmpliTaq Gold Fast PCR mix | Applied Biosystems (supplied through Thermo Fisher) | 4390937 | |
| Software, algorithm | Prism | GraphPad | ||
| Software, algorithm | Illustrator 2021 | Adobe | ||
| Software, algorithm | TANGO | PMID:15361882 | ||
| Software, algorithm | CamSol Intrinsic | PMID:25451785 | ||
| Software, algorithm | catGRANULE | PMID:23222640 | ||
| Software, algorithm | PScore | PMID:29424691 | ||
| Software, algorithm | MaxQuant | PMID:19029910 | ||
| Software, algorithm | Lexogen QuantSeq 2.3.1 FWD UMI | BlueBee genomics (Illumina) | ||
| Software, algorithm | edgeR | PMID:19910308 | ||
| Software, algorithm | Cytoscape (in Python) | PMID:31477170 | ||
| Software, algorithm | Metascape (webserver) | PMID:30944313 | ||
| Software, algorithm | ImageJ (Fiji) | PMID:22930824 | ||
| Other | DMEM without methionine/cysteine | Gibco (supplied through Thermo Fisher) | 21013024 |
Table 1
Genotoxic drugs used in this study.
| Drug | Target | Concentration |
|---|---|---|
| Camptothecin | TOP1 | 20–600 nM. Figure 1C: 100 nM; Figure 1E: 20–100 nM; Figure 1G: 40 nM; Figure 1—figure supplement 1E: 200–600 nM; Figure 1—figure supplement 1F: 40 nM; MS/MS HEK293T: 100 nM; MS/MS U2OS: 400 nM; Figure 4F: 100 nM; Figures 5G, 6A: 40 nM; Figure 6—figure supplement 1A: 40 nM; Figure 6H: 400 nM; Figure 6—figure supplement 1G: 400 nM; Figure 6—figure supplement 2A–C: 400 nM. |
| CD00509 | TDP1 | 4 µM |
| Etoposide | TOP2 | Figure 1C: 3 µM; Figure 1E: 0.6–3 µM; Figure 4F: 3 µM. |
| Ku-55933 | ATM | Everywhere 9 µM, except in Figure 4—figure supplement 1H: 3, 6, or 9 µM, and in Figure 5G: 13.5 µM |
| Ku-58948 | PARP1-3 | 4 µM |
| VE-821 | ATR | 3 µM |
Table 2
Online databases used.
| Analysis | Tool/database | Source/weblink |
|---|---|---|
| Supersaturation | Supersaturation database | Ciryam et al., 2013 |
| Heat-sensitive proteins | Heat-sensitive protein database | Mymrikov et al., 2017 |
| Stress-granule constituents | RNA granule database | https://rnagranuledb.lunenfeld.ca |
| (Co)chaperone interactions | HSPA1A/HSPA8 client database | Ryu et al., 2020 |
| BioGRID PPI database | https://thebiogrid.org |
Additional files
-
Supplementary file 1
MS/MS datasets of aggregated and whole-cell lysate (WCL) protein fractions.
- https://cdn.elifesciences.org/articles/70726/elife-70726-supp1-v2.xlsx
-
Supplementary file 2
RNA-sequencing differential expression analyses.
- https://cdn.elifesciences.org/articles/70726/elife-70726-supp2-v2.xlsx
-
Transparent reporting form
- https://cdn.elifesciences.org/articles/70726/elife-70726-transrepform1-v2.docx
Download links
A two-part list of links to download the article, or parts of the article, in various formats.
Downloads (link to download the article as PDF)
Open citations (links to open the citations from this article in various online reference manager services)
Cite this article (links to download the citations from this article in formats compatible with various reference manager tools)
Targeting DNA topoisomerases or checkpoint kinases results in an overload of chaperone systems, triggering aggregation of a metastable subproteome
eLife 11:e70726.
https://doi.org/10.7554/eLife.70726


