Volume growth in animal cells is cell cycle dependent and shows additive fluctuations
- Institut Pierre-Gilles de Gennes, PSL Research University, France
- Institut Curie, PSL Research University, CNRS, France
- FIRC Institute of Molecular Oncology (IFOM), Italy
- Physics Department, University of Milan, and INFN, Italy
Figures
Figure 1 with 1 supplement
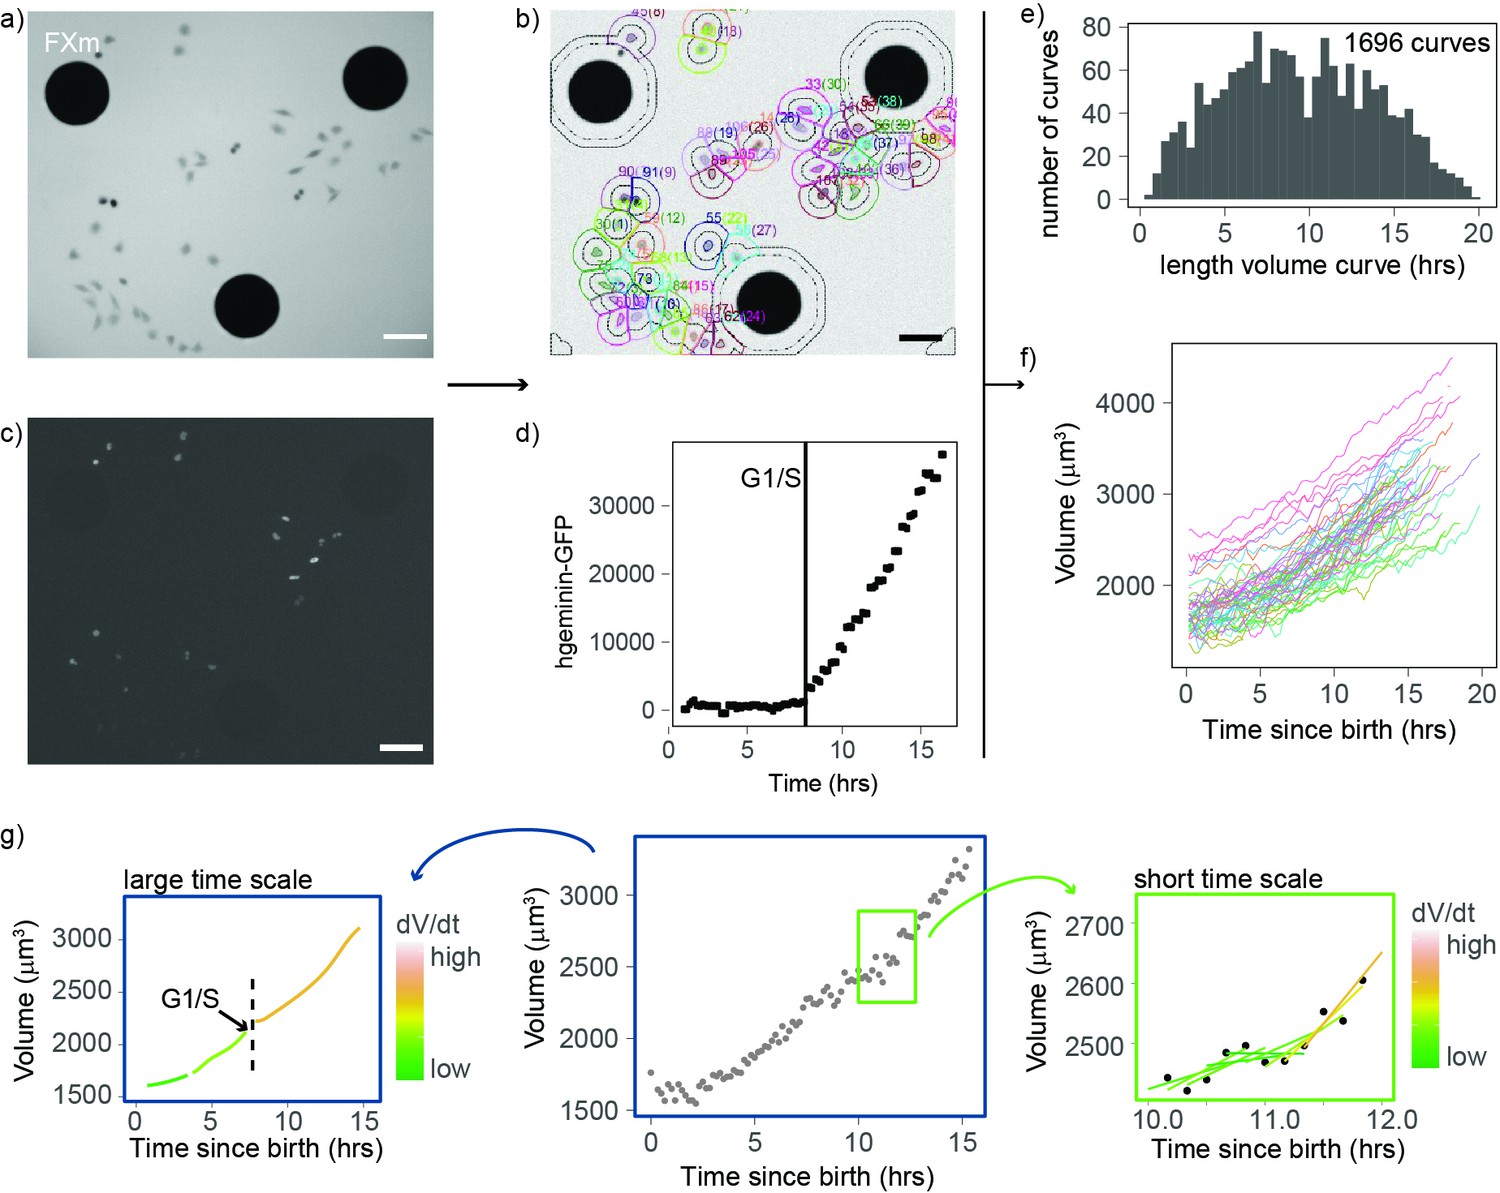
An improved fluorescence exclusion-based measurement (FXm) method produces high-throughput dynamic measurements of single-cell volume curves.
(a) Representative image of a field acquired in an FXm device. The FXm chamber contains a fluorescent dye (Dextran-Alexa-645) that is excluded from the cells and the pillars of the chamber. Hence, the pillars appear in black (large circles), cells are gray, and the background is bright. (b) FXm images are automatically segmented using custom MATLAB software, then volume is calculated for each time point. (c) Same field as in (a) but imaging hgeminin-GFP, a cell cycle marker expressed in the nuclei of the cells. (a–c: scale bar indicates 100 µm). (d) Representative curve of hgeminin-GFP over time in the cell cycle for a single cell. The change of slope in the signal marks the G1/S transition. (e) Histogram of the duration of each single-cell volume curve measured. We obtained a total of 1696 curves. (f) 72 representative single-cell volume curves from birth to mitosis. (g) Representative single-cell volume curve (middle panel) showing trends at timescales of several hours (left panel) and around 1 hr (right panel). Volume growth speed was defined from these plots as the time derivative of volume vs. time.
Figure 1—figure supplement 1

The distributions of growth speed show good agreement between the four experimental replicates.
Experiment 1: mean ± SD = 102 ± 111 µm3·h–1, n = 50,708; experiment 2: mean ± SD = 102 ± 142 µm3·h–1, n = 23,739; experiment 3: mean ± SD = 101 ± 196 µm3·h–1, n = 4570; experiment 4: mean ± SD = 96 ± 138 µm3·h–1, n = 12,494.
Figure 2
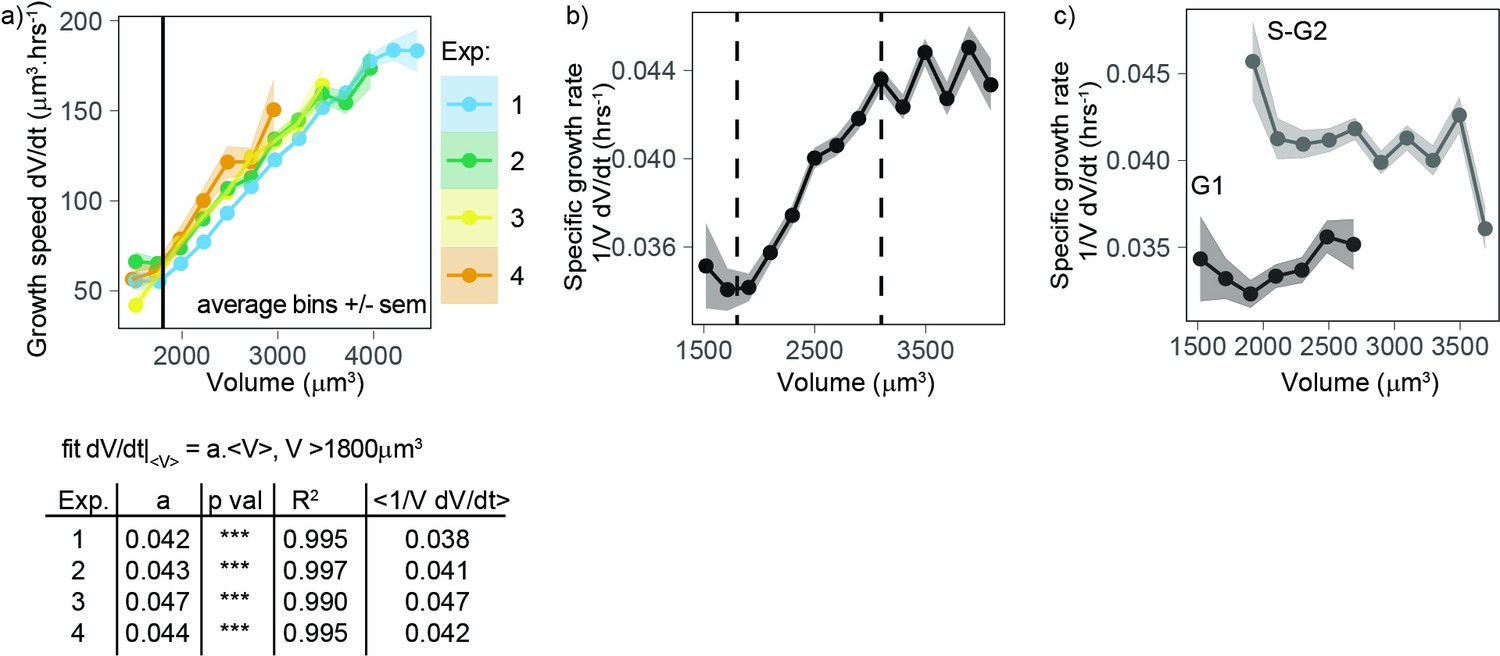
Volume growth is close to exponential on average for a wide range of volumes, with a higher specific rate in S-G2 than in G1.
(a) Top panel: growth speed (in units volume/time) as a function of volume for each experiment (points are average bins of width = 250 µm3, the ribbon represents the standard error on the mean for each bin, N = 4, n > 25 different cells in each bin). Bottom panel: table showing the results of the linear fit of growth speed as a function of volume for each experiment. Derivatives are computed on 50 min windows. (b) Specific volume growth rate, defined as the binned average of at fixed volume , plotted as a function of volume (average bins of width = 200 µm3 ± standard error on the mean). Vertical dashed lines indicate the range where growth rate increases linearly with volume, between 1800 and 3100 µm3. (dots are average bins of width = 200 µm3, the ribbon represents the standard error on the mean for each bin, N = 4, n > 100 different cells per bin). (c) Same as (b) but grouped by cell cycle stage (G1 vs. S-G2).
Figure 3 with 1 supplement
Newborn cells show a different trend in growth speed.
(a) Growth speed (proxied by the discrete derivative taken on 50 min windows) as a function of time from birth (onset of cytokinesis) for the three experiments that yielded more than 80 different cells. The vertical line indicates 1.3 hr after birth. Circles are averages bins containing at least 100 cells (N = 3). (b) Zoom of the first 2 hr of the data shown in panel a with the data pooled by volume at birth (blue, orange, and pink lines correspond, respectively, to sliding averages of the largest 20% birth volume, smallest 20% birth volume, and the rest of the cells, the dashed horizontal line indicates a growth speed equal to 0, the black vertical line indicates 1.3 hr from birth).
Figure 3—figure supplement 1

Growth speed as a function of time from birth shows time periodicity for the largest and smallest cells at birth.
The solid lines represent averages (each bin contains at least 100 cells) and the ribbon the standard error on the mean. Black vertical line indicates 1.3 hr after birth (N = 4).
Figure 4
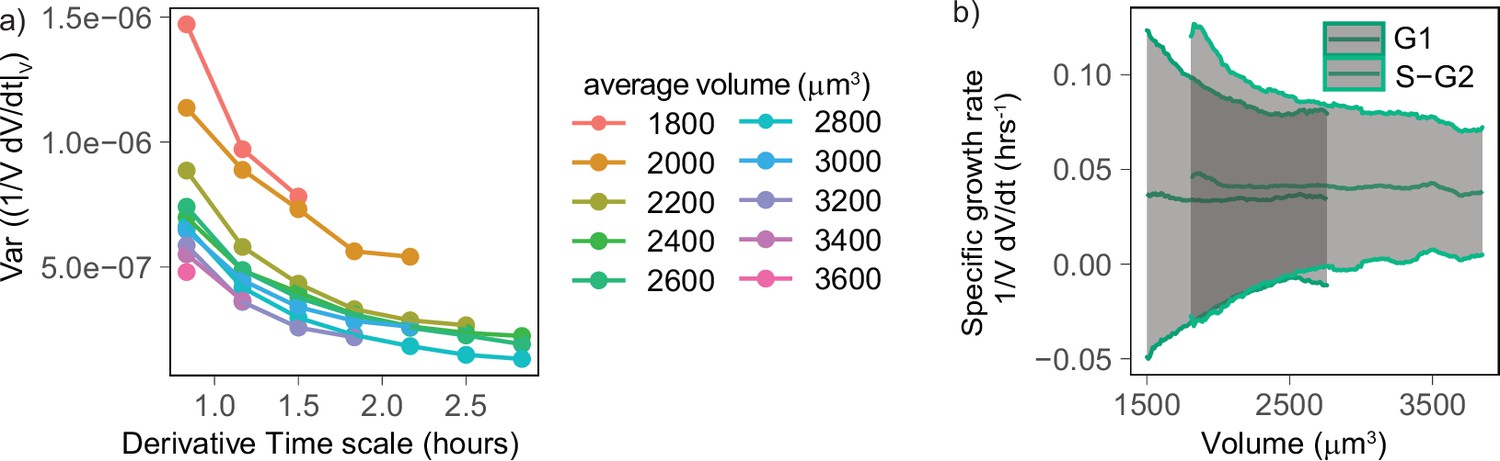
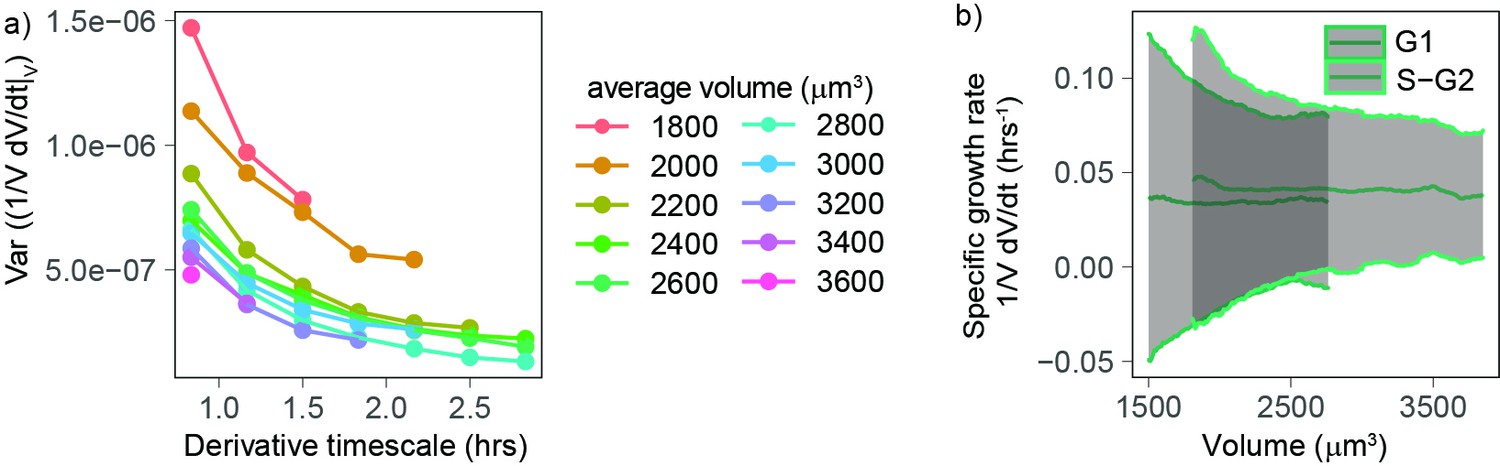
Volume growth rate fluctuations decrease with increasing cell volume.
(a) Variance of specific growth rate quantified by using discrete derivatives of fixed volume bins calculated over increasing time windows (x axis) and for groups cells of increasing volume (colored lines). Circles are averages computed for bins that contain at least 100 different cells, N = 4. (b) Mean (line) and standard deviation (gray ribbon) of growth rate (quantified by using discrete derivatives on fixed volume bins and a timescale of 50 min) plotted as a function of volume and by phase. Values are calculated on sliding windows of 200 µm3, and bins contain at least 100 cells (N = 4).
Figure 5 with 3 supplements
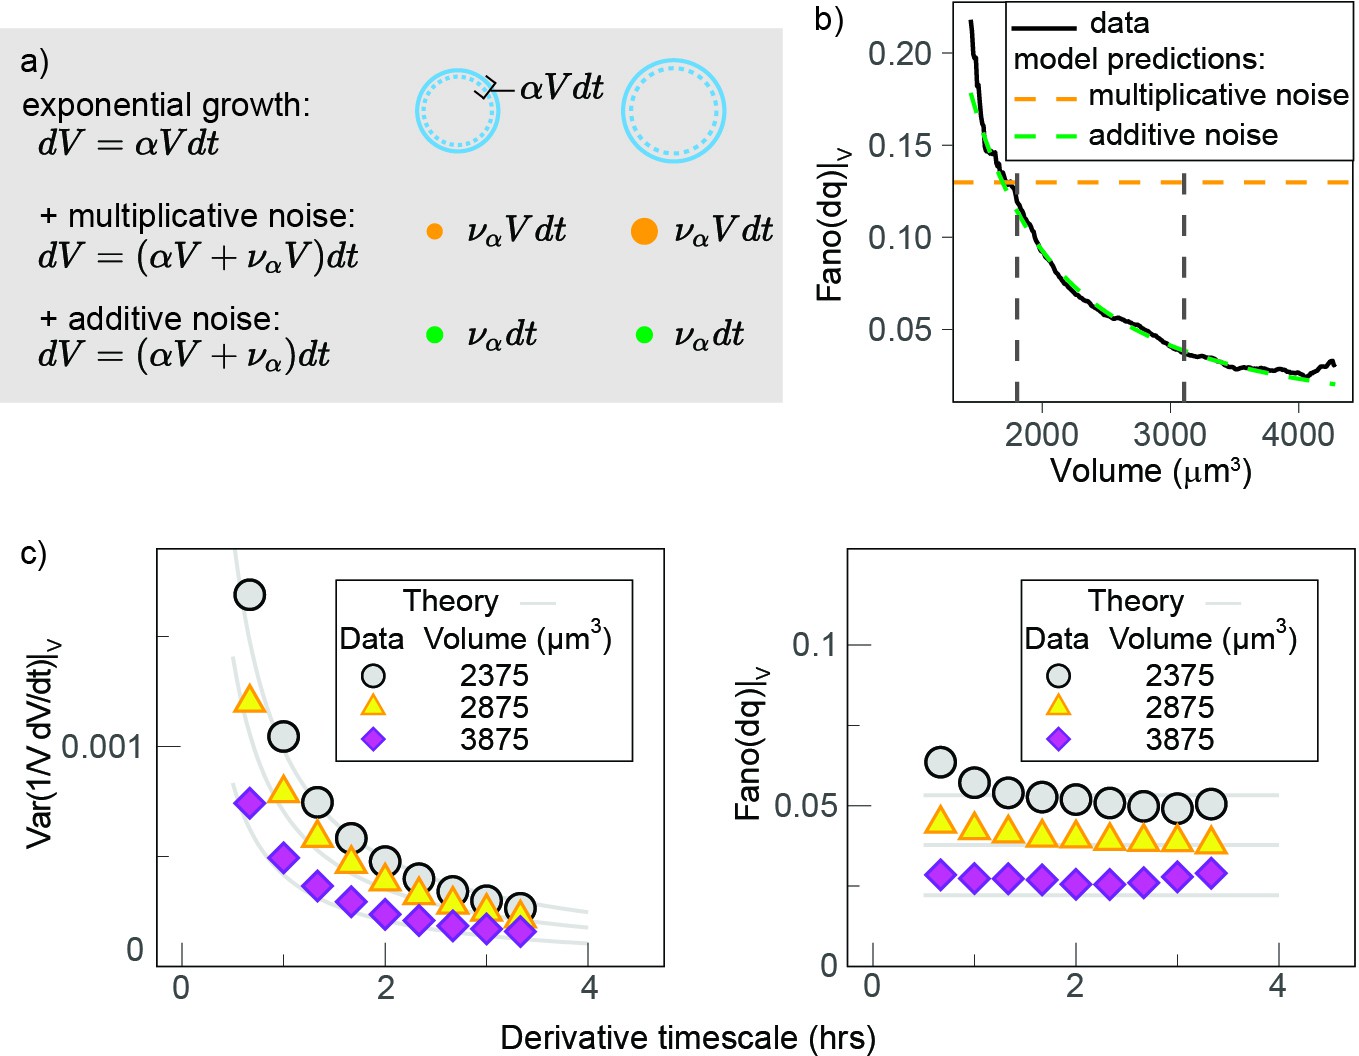
Growth rate fluctuations are best described by a model with additive noise.
(a) Schematic representing the exponential growth of a cell (dashed blue circle) adding volume (solid blue circle) proportionately to its volume at a rate and to timescale . Two limit cases for fluctuations around this baseline exponential growth are a ‘multiplicative noise,’ which is volume-specific, hence increases with volume, or an ‘additive’ noise, whose amplitude is constant. (b) Mean-normalized variance (Fano factor) of the conditional ‘log return’ , computed in sliding volume bins, and plotted as a function of volume. The dashed lines represent the theoretical prediction of the model in the case of pure multiplicative (orange dashed line) or pure additive noise (green dashed line), assuming that the amplitude of the noise is set by the fluctuations in the smallest volume bin (yielding a constant line with an intercept for multiplicative noise, and a power law with the same condition for additive noise). (c) The Fano factor quantifies fluctuations robustly over different timescales. Left panel: comparison of the variance-specific growth rate (quantified by using discrete derivatives on fixed volume) as a function of the timescale of the discrete derivatives in the data (symbols) and the theoretical model predictions (solid gray lines) for different volume bins. Right panel: the Fano factor of the conditional log return defined above (same symbols) is robust to timescale changes, as predicted by the model.
Figure 5—figure supplement 1

Validation of the model.
(a) Theoretical model predictions agree with direct simulations of the stochastic exponential growth model. The plot compares simulations (circles) with the theoretical predictions (lines) for the Fano factor of the conditional log return (the logarithmic size increment at fixed volume) from the same set of parameters. Model parameters were derived from a fit of the pulled experimental data from experiments 1 and 2 in the volume range 1800–4000 µm3: α = 0.038·h–1, σ = 41.5 (µm3)1-γ·h-(1/2), γ = 0.12. (b) Mean-normalized variance (Fano factor) of the conditional ‘log return’ , computed in sliding volume bins, and plotted as a function of volume and phase.
Figure 5—figure supplement 2
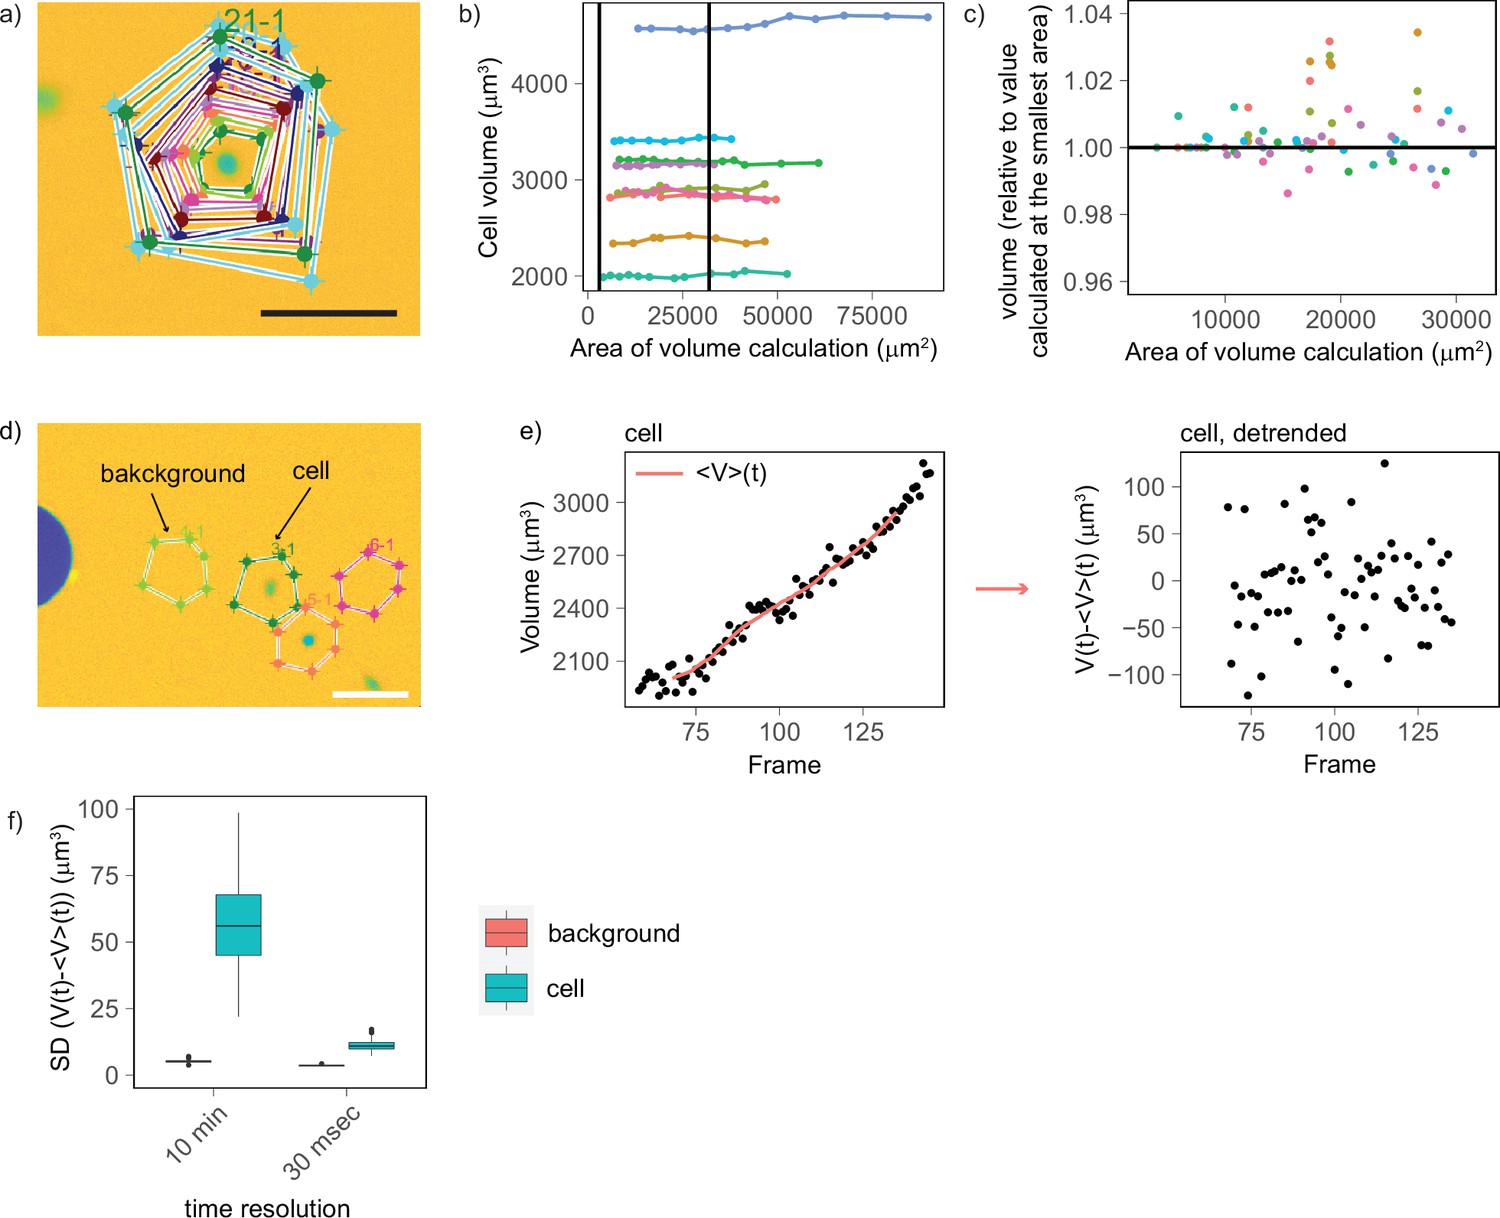
Experimental controls shows that cell volume fluctuations have biological origin, with a minimal contribution from technical noise.
(a) Example of segmentation areas of increasing dimensions drawn around a cell to calculate its volume. (b) Calculated cell volume plotted as a function of the segmentation area (each color corresponds to a different cell, vertical lines indicate the range of areas used by the automated segmentation algorithm to calculate volume). (c) Zoom of plot (b) for the range of areas used by the segmentation algorithm to calculate cell volume. The plot shows that there is no trend between calculated volume and the segmentation area (provided that this is larger than the cell) and that the errors are within ±2%. (d) Representative image illustrating the control used to compare volume and background fluctuations. This experiment compares background areas with areas of the same size containing a cell (scale bar: 100 µm). (e) Representative plot showing the approach used to detrend the curves. Left: for each cell and background area, volume was calculated over time, and an average volume trend computed over sliding windows of eight frames (80 min) was calculated (solid red line). Right: the average volume trend was subtracted from the volume curve to obtain a detrended volume curve. (f) On cells that do not grow (measured for 9 s every 30 ms), volume fluctuations (mean [SD] = 11.2 µm3, n cells = 97) are very close to those of the background (mean [SD] = 3.60 µm3, n background areas = 60) and much smaller to volume fluctuations of cells that grow and are measured every 10 min (mean [SD] = 59.5 µm3, n cells = 143).
Figure 5—figure supplement 3
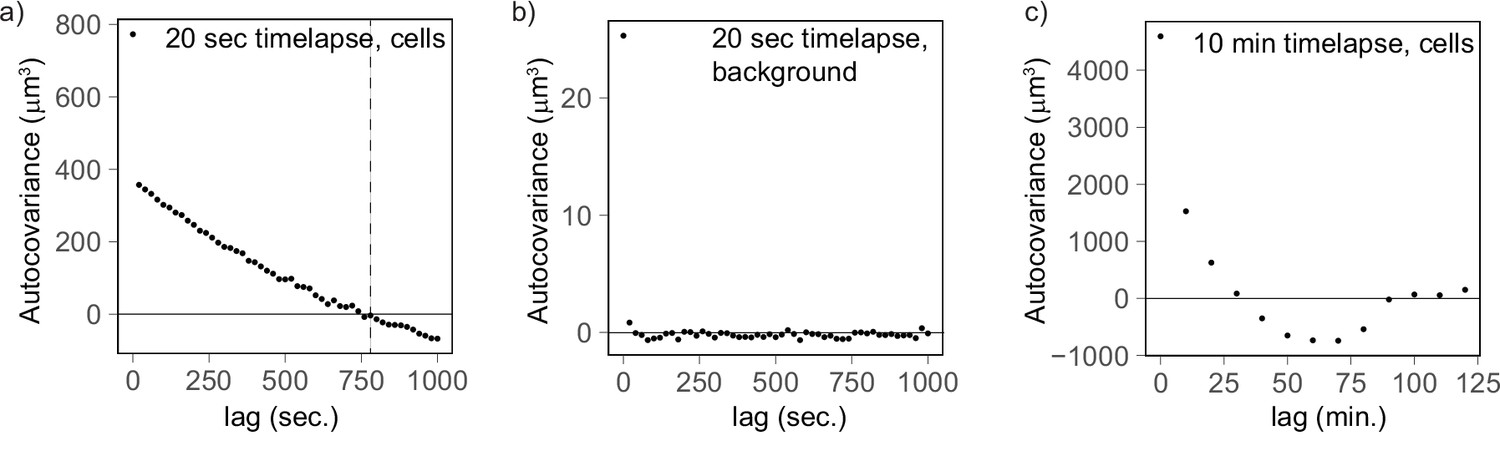
Autocovariance analysis shows that the timescale of volume fluctuation is around 760 s.
(a) Cells measured every 20 s (n = 177) and linearly detrended reach a covariance of 0 at a lag of 760 s. (b) As a control, the background fluctuations are not autocorrelated (20 s, n = 92), providing further evidence that cell volume fluctuations likely have biological origin. (c) The autocovariance analysis for cells measured every 10 min confirms that fluctuations covary for a lag of 10–20 min.
Author response image 1
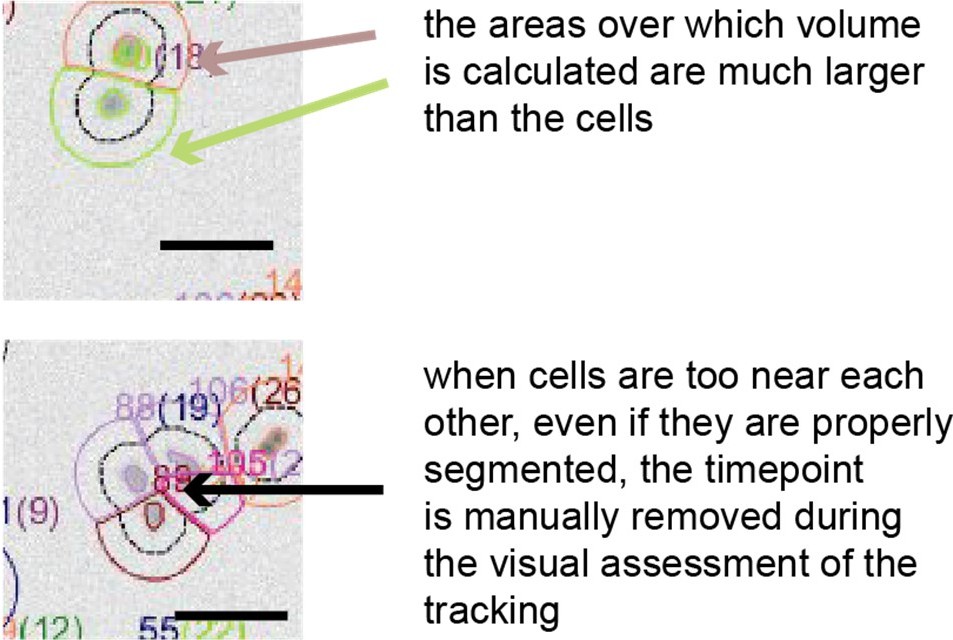
The masks around the cells used for volume calculation are always larger than the cells.
Author response image 2
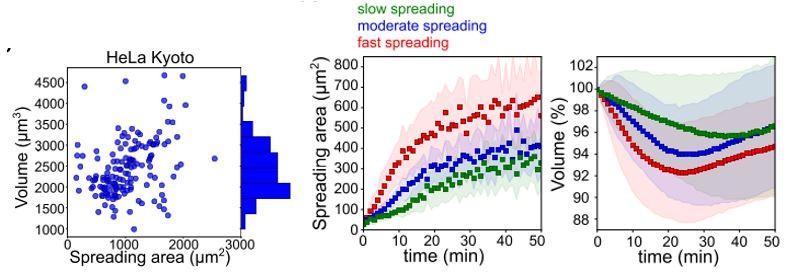
Figure B.
Figure adapted from figures 1H and S1B of Venkova et al., bioRxiv 2021. Left: At steady state, volume shows a poor correlation with cell spreading area. For cells that are in suspension and begin spreading, the comparison of the speed of spreading area (middle) and corresponding volume curve (right) for HeLa cells shows that cells that spread fast loose more volume than cells that spread slowly. Volume is measured with the FXm, using a protocol and set up very similar to the one used in this present manuscript.
Author response image 3
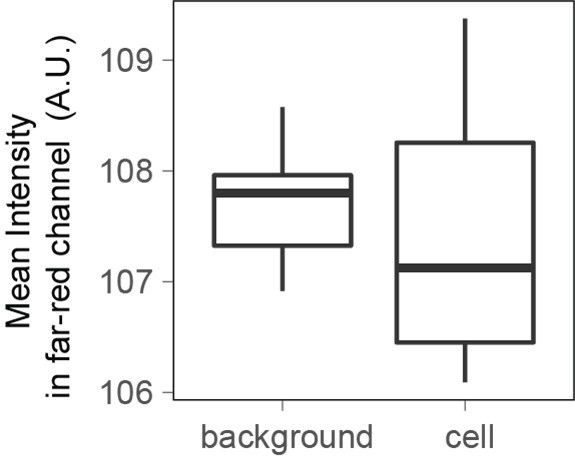
When imaging cells in the far-red channel with the same illumination power and time as the one used to measure Dextran-Alexa645 intensity for FXm, the fluorescence intensity measured is the same for cells and for the background.
Author response image 4
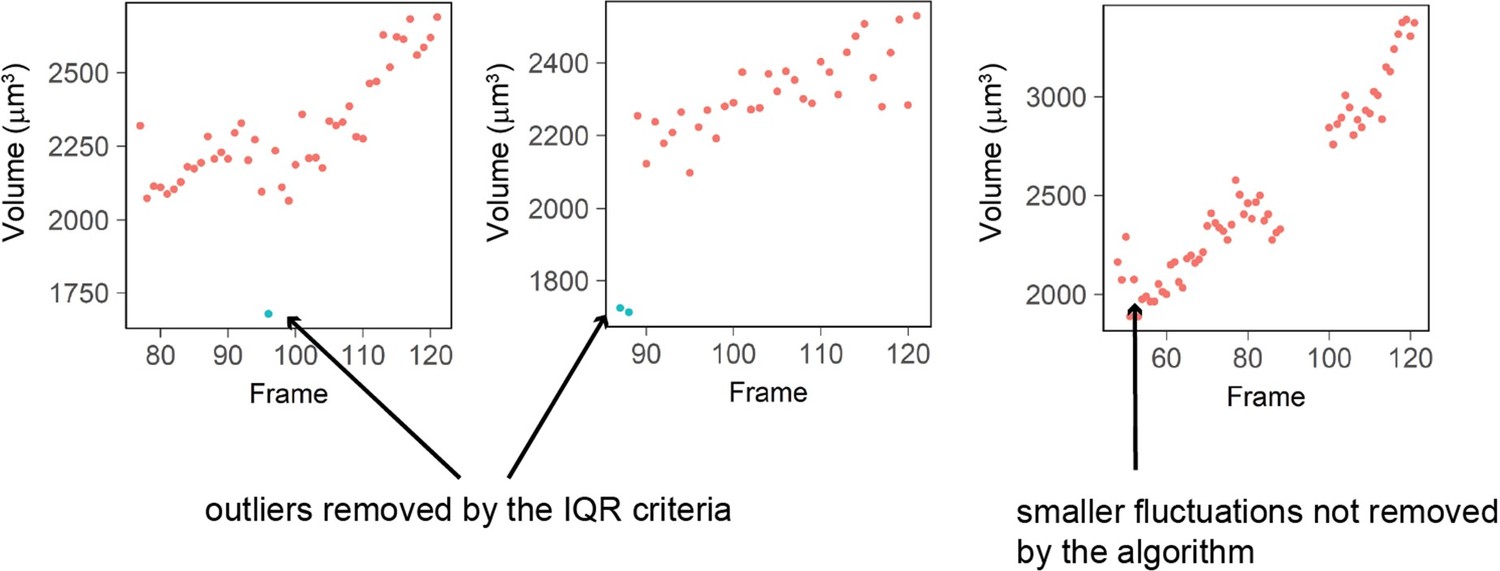
Three examples of single cell trajectories with raw volume measurement (red dots) and points removed with the IQR filtering (blue dots).
The IQR criteria is very stringent and removes only the very large ‘bumps’ in cell volume measured (2 left plots) while it keeps fluctuations of smaller amplitude (right plot).
Tables
Key resources table
| Reagent type (species) or resource | Designation | Source or reference | Identifiers | Additional information |
|---|---|---|---|---|
| Cell line (Homo sapiens) | HeLa hgeminin-GFP | Gift form Buzz Baum lab | ||
| Chemical compound, drug | DMEM, high glucose, GlutaMAX Supplement | Thermo Fisher | 61965026 | |
| Chemical compound, drug | DMEM, high glucose, no glutamine, no phenol red | Thermo Fisher | 31053044 | |
| Chemical compound, drug | GlutaMAX | Thermo Fisher | 35050061 | |
| Chemical compound, drug | Fetal bovine serum | Biowest | S1810-500 | Use at 10% |
| Chemical compound, drug | Penicillin/streptomycin | Thermo Fisher | 15070063 | Use at 1% final |
| Chemical compound, drug | Dextran, Alexa Fluor 647; 10,000 MW, Anionic, Fixable | Sigma-Aldrich | D22914 | Stock at 10 mg/mL in PBS |
| Chemical compound, drug | Fibronectin | Sigma-Aldrich | F1141-1MG | 50 µg/mL in PBS |
| Software, algorithm | Software for FXm image analysis and volume calculation | Available upon request to the authors | RRID:SCR_001622 |
Additional files
Download links
A two-part list of links to download the article, or parts of the article, in various formats.
Downloads (link to download the article as PDF)
Open citations (links to open the citations from this article in various online reference manager services)
Cite this article (links to download the citations from this article in formats compatible with various reference manager tools)
Volume growth in animal cells is cell cycle dependent and shows additive fluctuations
eLife 11:e70816.
https://doi.org/10.7554/eLife.70816


