Reporting and misreporting of sex differences in the biological sciences
- Graduate Program in Neuroscience, Emory University, United States
- Department of Psychology, Emory University, United States
Figures
Figure 1 with 1 supplement
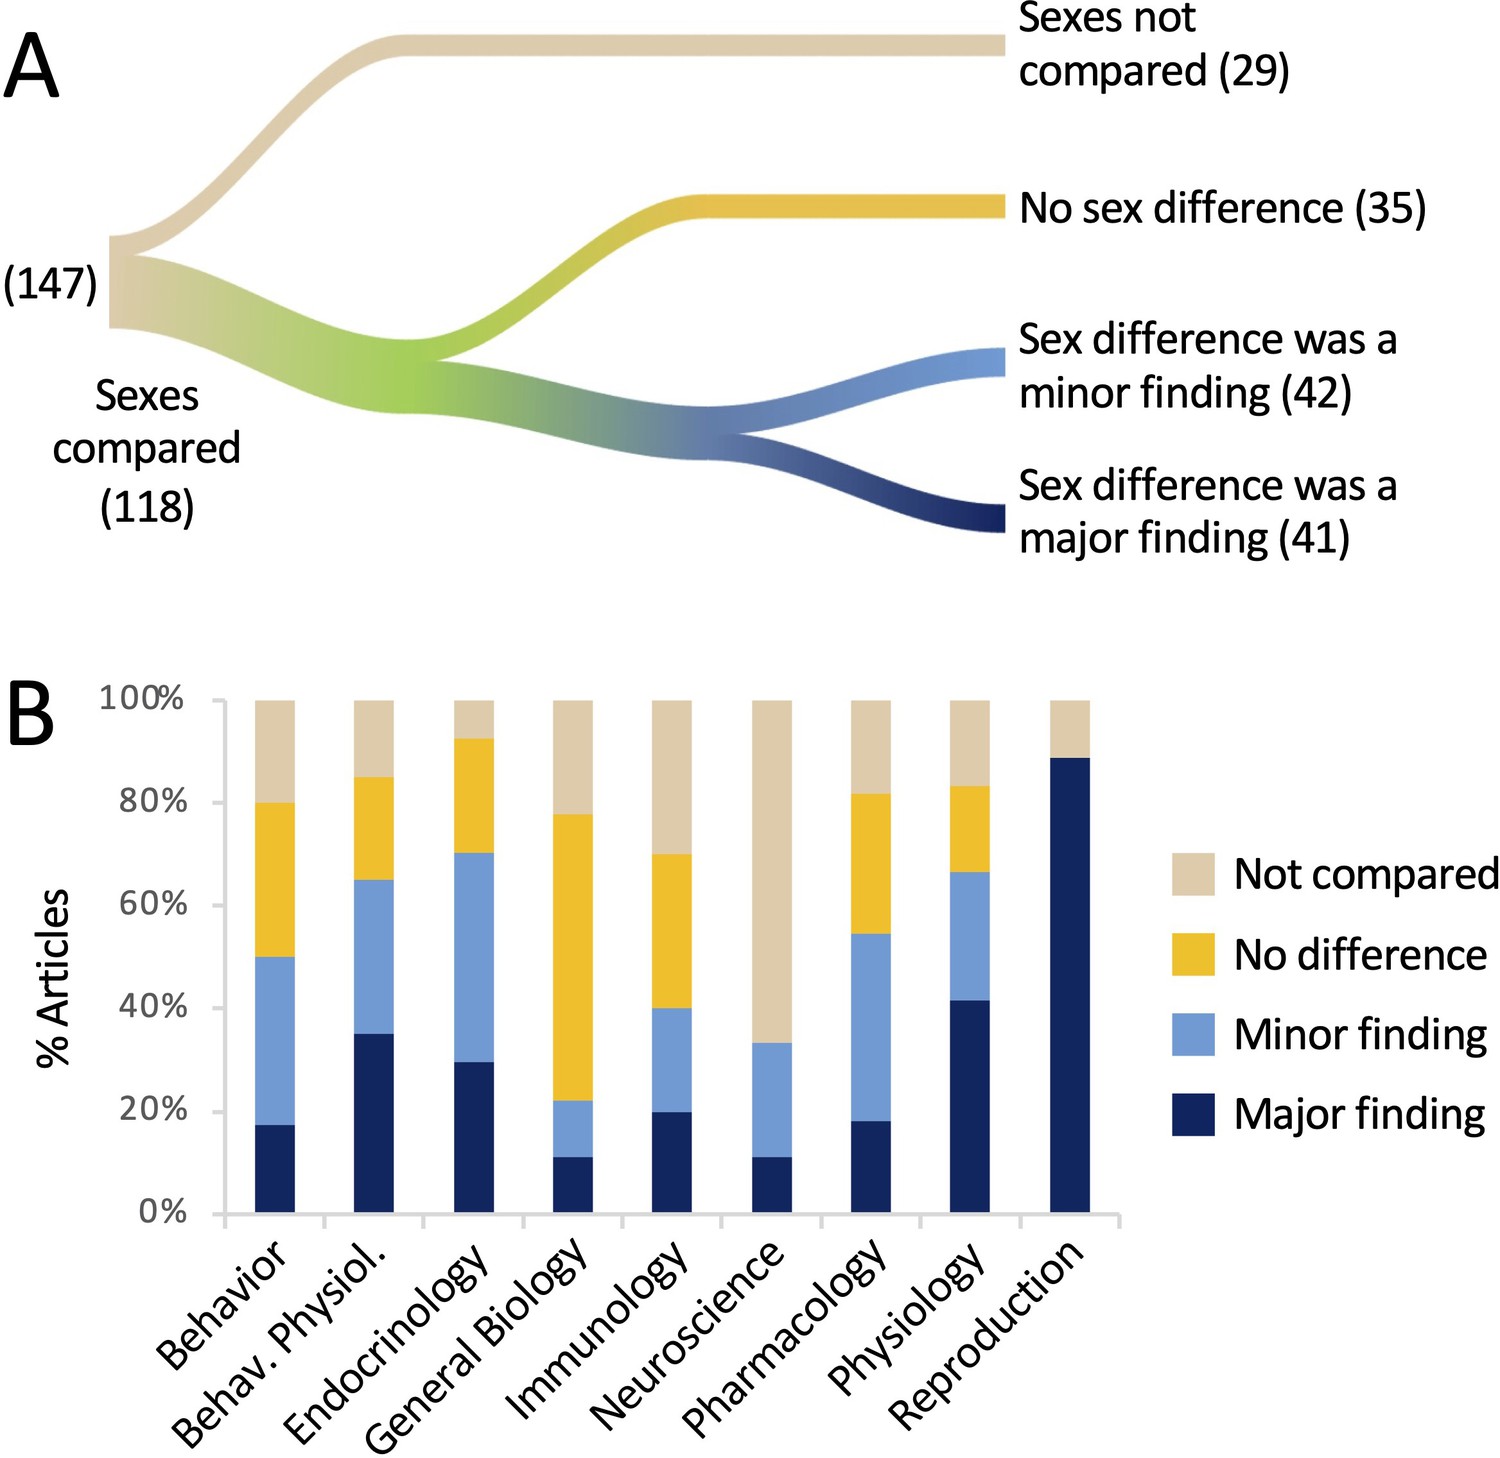
The sexes were compared in the majority of the articles analyzed.
(A) The river plot shows the proportions of articles comparing the sexes, either statistically or qualitatively, and the outcomes of those comparisons. The width of each stream is proportional to the number of articles represented in that stream. The numbers of articles are given in parentheses. If a sex difference was mentioned in the title or abstract, the article was coded as ‘major finding’. For a river plot showing how (A) fits into the larger context of the study by Woitowich et al., 2020, please see Figure 1—figure supplement 1. (B) The percentage of articles in which sexes were compared is plotted for each discipline. All data are shown in Supplementary file 1 and Figure 1—source data 1.
-
Figure 1—source data 1
Data depicted in Figure 1.
All raw data are in Supplementary file 1b and are tabulated in Supplementary file 1c.
- https://cdn.elifesciences.org/articles/70817/elife-70817-fig1-data1-v1.xlsx
Figure 1—figure supplement 1
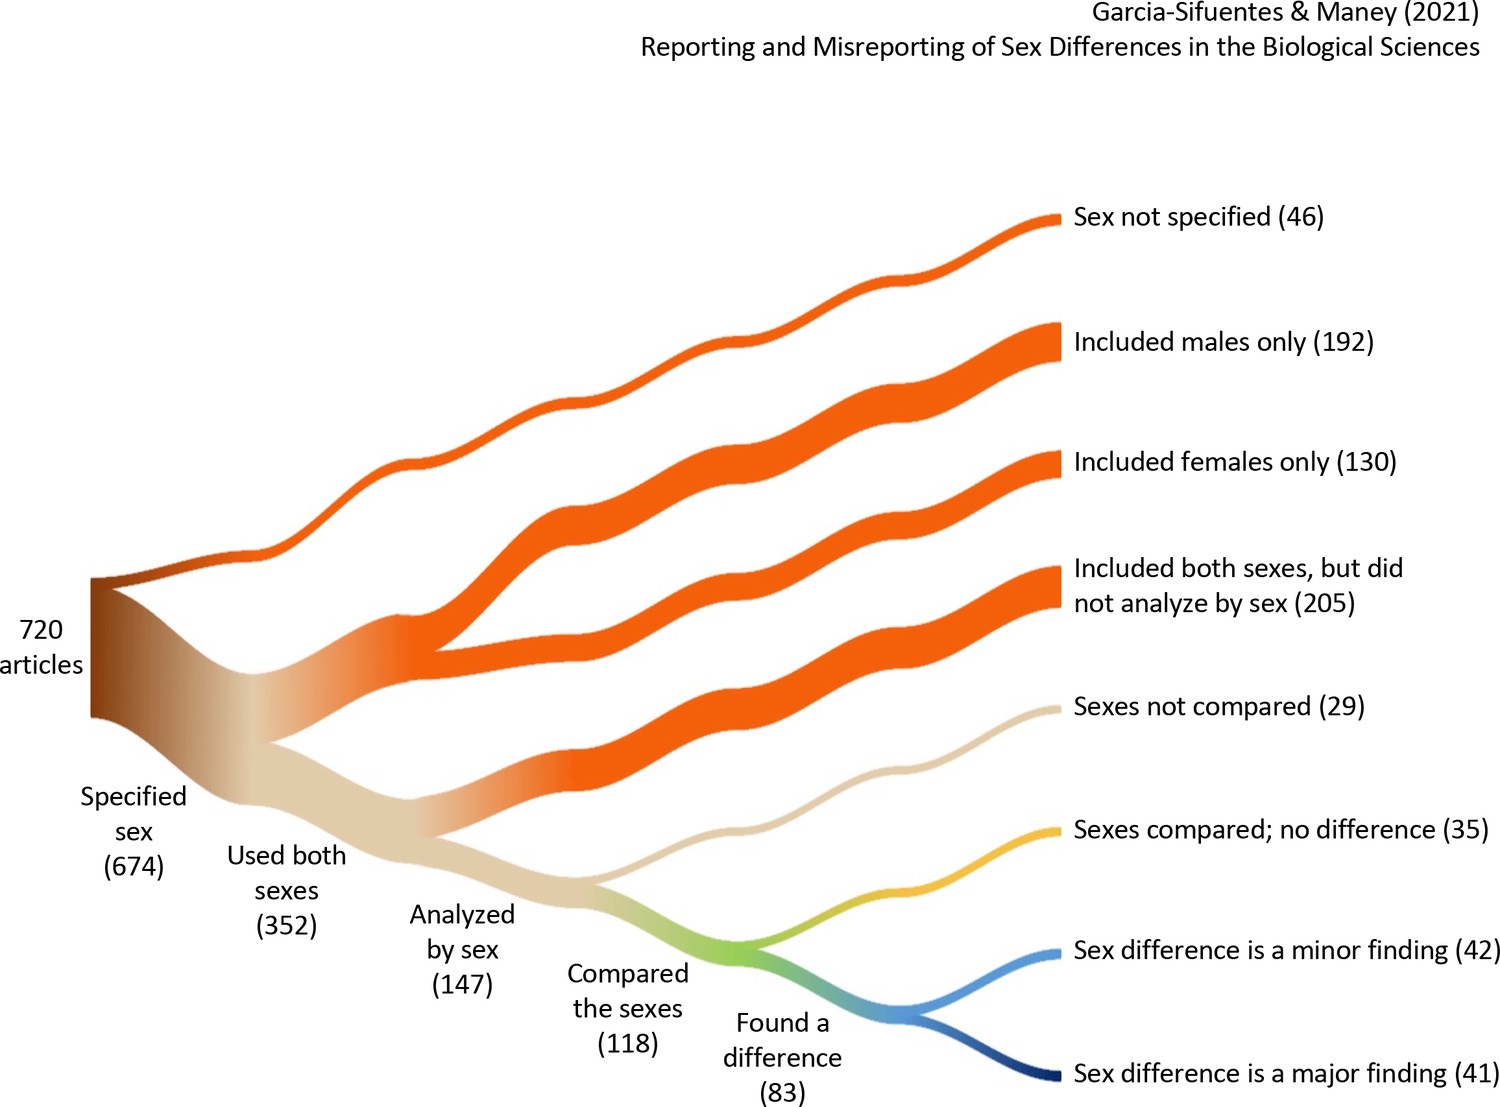
River plot showing our findings in the larger context of the study by Woitowich et al., 2020.
The width of each stream is proportional to the number of articles represented in that stream. Starting with 720 articles, Woitowich et al. asked whether sex was specified, whether only one or both sexes were included, and whether the data were analyzed by sex. In this study, we began with the 147 articles in which data were analyzed by sex and asked further whether the sexes were compared and what was found (lower four branches; see main text Figure 1A).
Figure 2
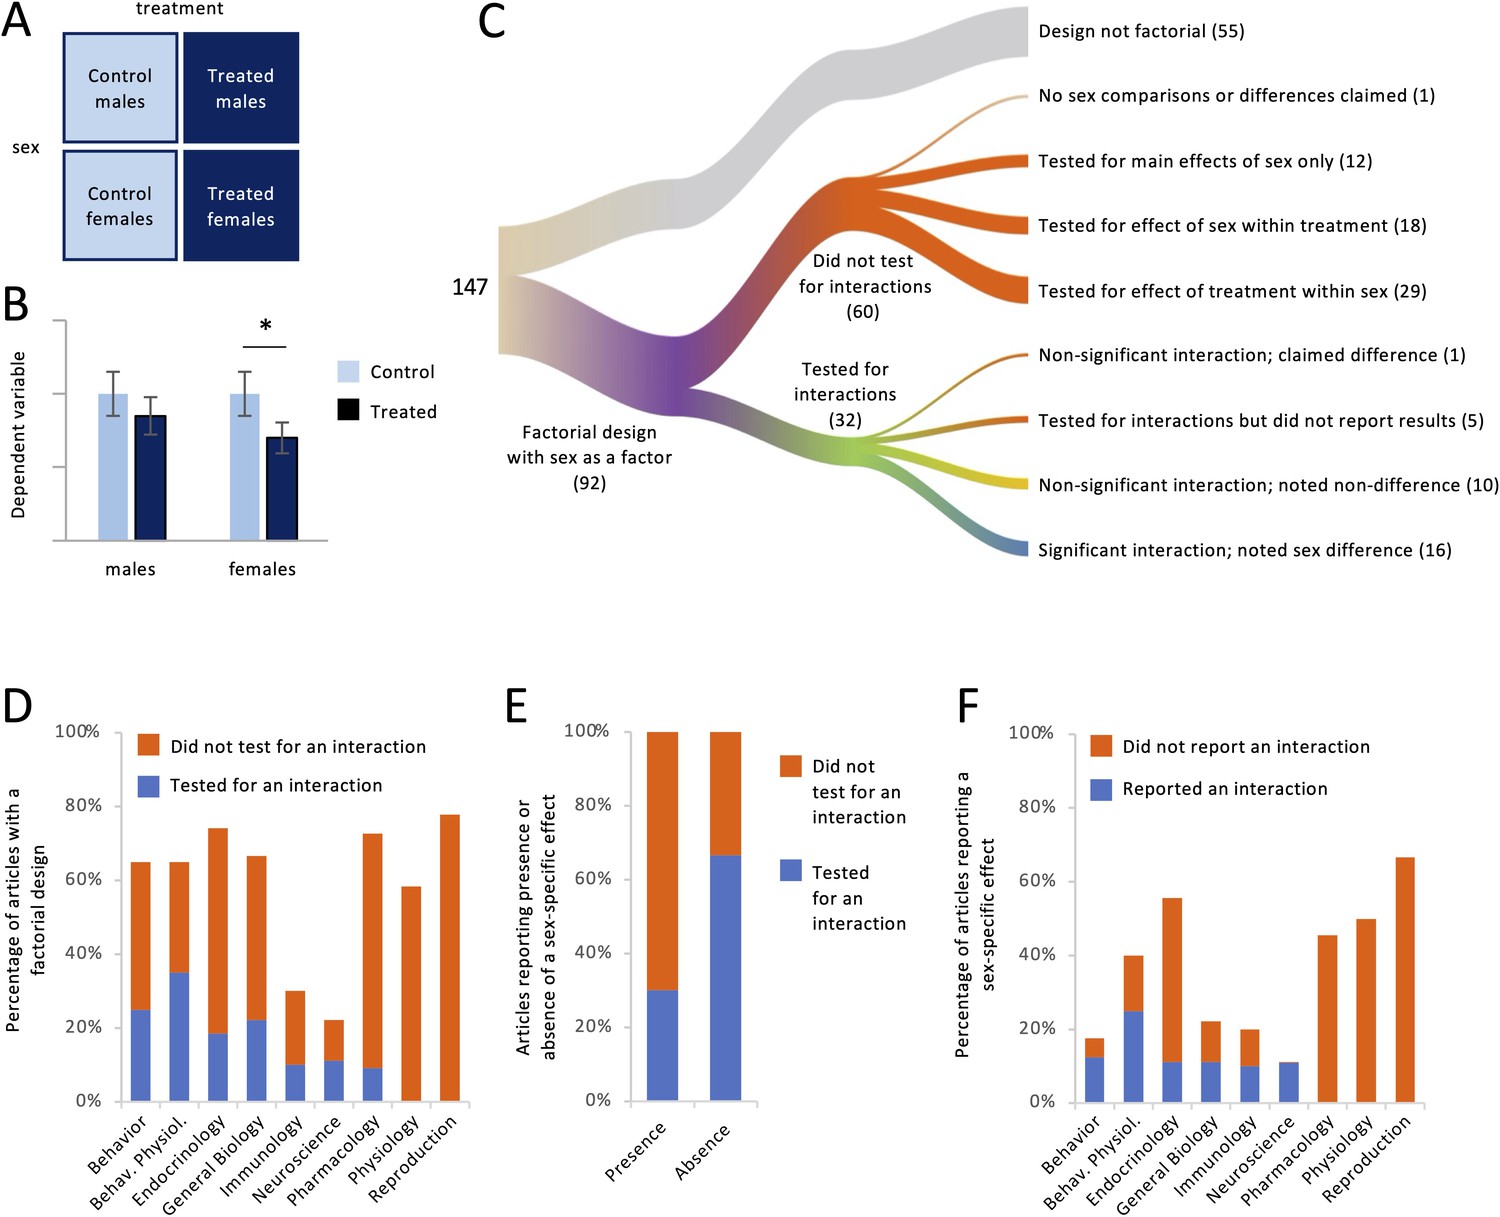
Factorial designs and sex-specific effects.
For each article, we noted whether it contained a study with a factorial design with sex as a factor (A), for example, males and females nested inside treated and control groups. (B) In this hypothetical dataset, there was a significant effect of treatment only in females. Some authors would claim that the treatment had a ‘sex-specific’ effect without testing statistically whether the response to treatment depended on sex. In this example, it does not (see Maney, 2016; Nieuwenhuis et al., 2011). (C) The river plot shows the proportion of articles with a factorial design and the analysis strategy for those. The width of each stream is proportional to the number of articles represented in that stream. The numbers of articles are given in parentheses. (D) The percentage of articles with a factorial design (see A) is plotted for each discipline. Only a minority tested for an interaction between sex and other factors. (E) Testing for an interaction was less common in articles claiming the presence of a sex-specific effect, meaning a sex difference in the degree to which a second variable affected the outcome variable, than in articles claiming the absence of such an effect. (F) The percentage of articles claiming a sex-specific effect is plotted for each discipline. Only a minority reported a significant interaction.
-
Figure 2—source data 1
Data depicted in Figure 2.
All raw data are in Supplementary file 1b and are tabulated in Supplementary file 1c.
- https://cdn.elifesciences.org/articles/70817/elife-70817-fig2-data1-v1.xlsx
Figure 3
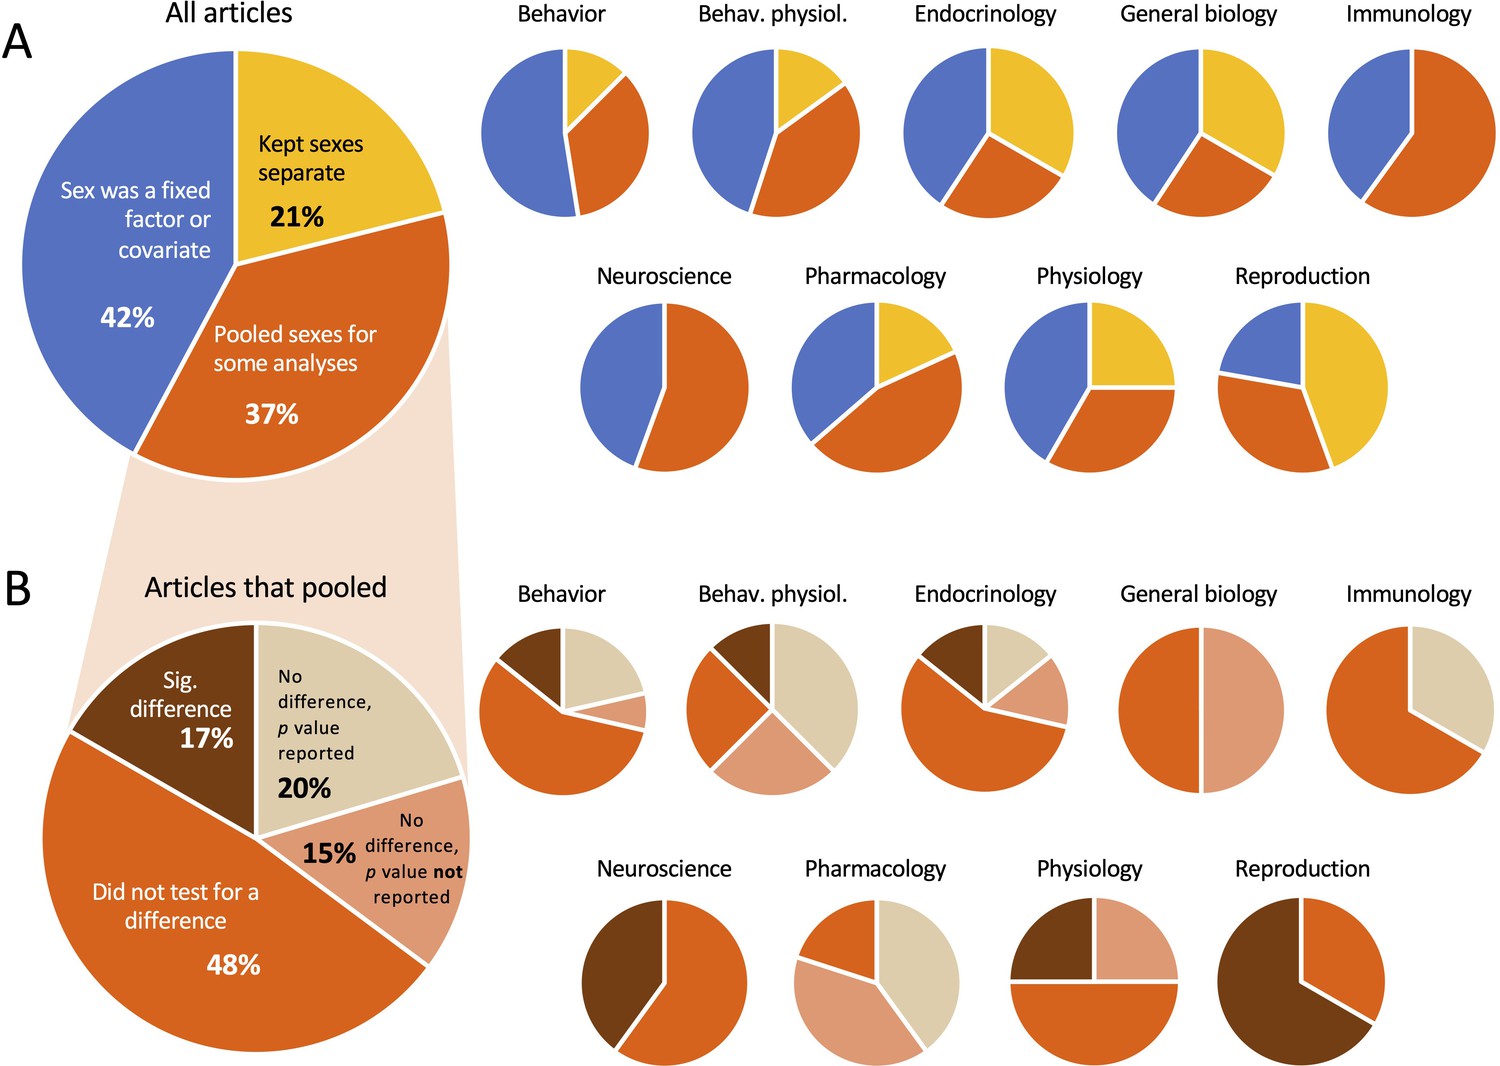
Proportion of articles in which the sexes were pooled.
(A) In our sample, roughly one-third of the articles pooled the sexes for at least some analyses. (B) Among the articles that pooled, more than half did not test for a sex difference before pooling. In both (A) and (B), the smaller pie charts show the proportions within discipline. For the data used to make the charts, see Supplementary file 1c and Figure 3—source data 1.
-
Figure 3—source data 1
Data depicted in Figure 3.
All raw data are in Supplementary file 1b and are tabulated in Supplementary file 1c.
- https://cdn.elifesciences.org/articles/70817/elife-70817-fig3-data1-v1.xlsx
Figure 4
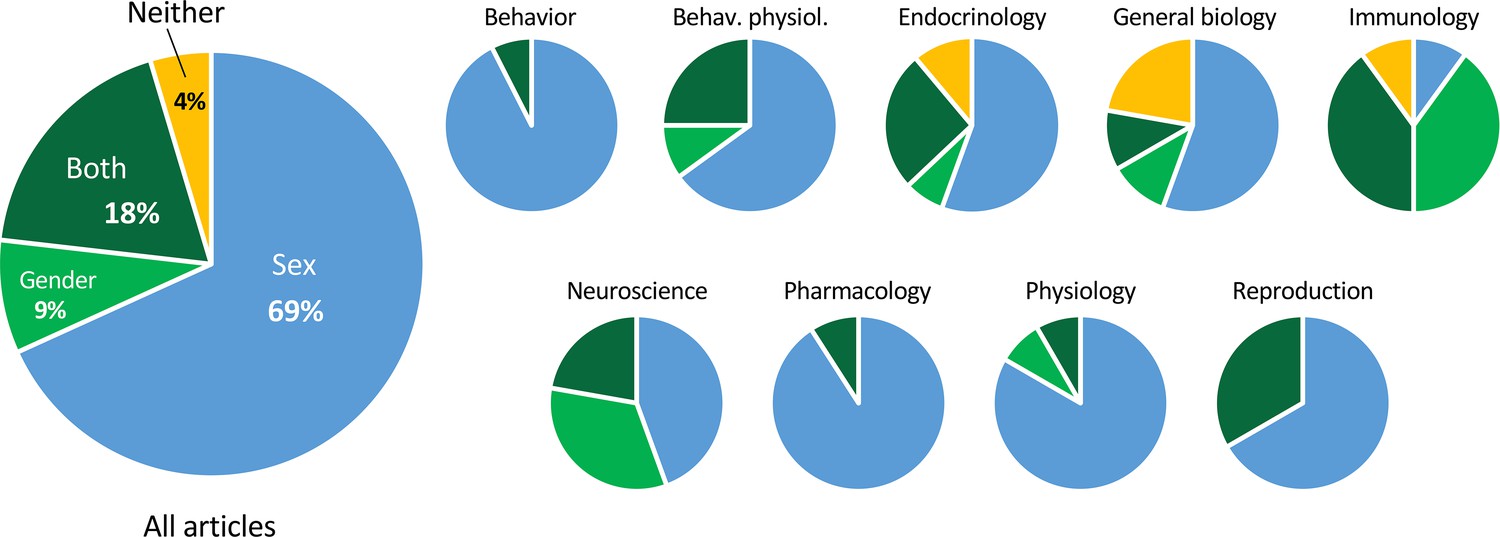
Proportions of articles using the terms ‘sex’ and ‘gender’.
The smaller pie charts show the proportions within discipline. The charts include all articles analyzed, on both humans and non-humans. For the data used to make the charts, see Supplementary file 1C and Figure 4—source data 1.
-
Figure 4—source data 1
Data depicted in Figure 4.
All raw data are in Supplementary file 1b and are tabulated in Supplementary file 1c.
- https://cdn.elifesciences.org/articles/70817/elife-70817-fig4-data1-v1.xlsx
Tables
Table 1
Journals surveyed by discipline.
The categorization of journals into disciplines was as defined by Beery and Zucker, 2011, and Woitowich et al., 2020.
| Discipline | Journal 1 | Journal 2 | Journal 3 | Journal 4 | No.articles |
|---|---|---|---|---|---|
| Behavior | Behavioral Ecology and Sociobiology | Animal Behavior | Animal Cognition | Behavioral Ecology | 40 |
| Behavioral Physiology | Journal of Comparative Psychology | BehavioralNeuroscience | Physiology and Behavior | Hormones and Behavior | 20 |
| Endocrinology | European Journal of Endocrinology | Journal of Neuroendocrinology | Endocrinology | American Journal of Physiology – Endocrinology and Metabolism | 27 |
| General Biology | PLoS Biology | Proceedings of theRoyal Society B: Biological Sciences | Nature | Science | 9 |
| Immunology | Journal of Immunology | Infection andImmunity | Immunity | Vaccine | 10 |
| Neuroscience | Journal of Neuroscience | Neuroscience | Journal of Comparative Neurology | Nature Neuroscience | 9 |
| Pharmacology | Neuropsychopharmacology | Journal of Psychopharmacology | Journal of Pharmacology and Experimental Therapeutics | British Journal of Pharmacology | 11 |
| Physiology | Journal of Physiology (London) | American Journal of Physiology – Renal Physiology | American Journal of Physiology – Gastrointestinal and Liver Physiology | American Journal of Physiology – Heart and Circulatory Physiology | 12 |
| Reproduction | Biology of Reproduction | Reproduction | 9 |
Additional files
-
Supplementary file 1
Codes and data for the bibliometric analysis.
(1a) Articles were coded into the categories shown for each of four questions. (1b) Codes for all articles are indicated in the ‘Question’ columns. See (a) for the explanations of the codes. All codes marked with an asterisk are explained in the ‘notes’ column. Columns D and E show the title and date of publication for each article, which was also shown in Woitowich et al., 2020. (1c) Numbers of articles coded into each category. Column A shows the total number of articles; columns D-L show them broken down by discipline.
- https://cdn.elifesciences.org/articles/70817/elife-70817-supp1-v1.xlsx
-
Transparent reporting form
- https://cdn.elifesciences.org/articles/70817/elife-70817-transrepform1-v1.pdf
Download links
A two-part list of links to download the article, or parts of the article, in various formats.
Downloads (link to download the article as PDF)
Open citations (links to open the citations from this article in various online reference manager services)
Cite this article (links to download the citations from this article in formats compatible with various reference manager tools)
Reporting and misreporting of sex differences in the biological sciences
eLife 10:e70817.
https://doi.org/10.7554/eLife.70817


