Astrocyte GluN2C NMDA receptors control basal synaptic strengths of hippocampal CA1 pyramidal neurons in the stratum radiatum
- RIKEN Center for Brain Science, Japan
- Neural Coding and Brain Computing Unit, Okinawa Institute of Science and Technology Graduate University, Japan
- Department of Animal Model Development, Brain Research Institute, Niigata University, Japan
Figures
Figure 1 with 5 supplements
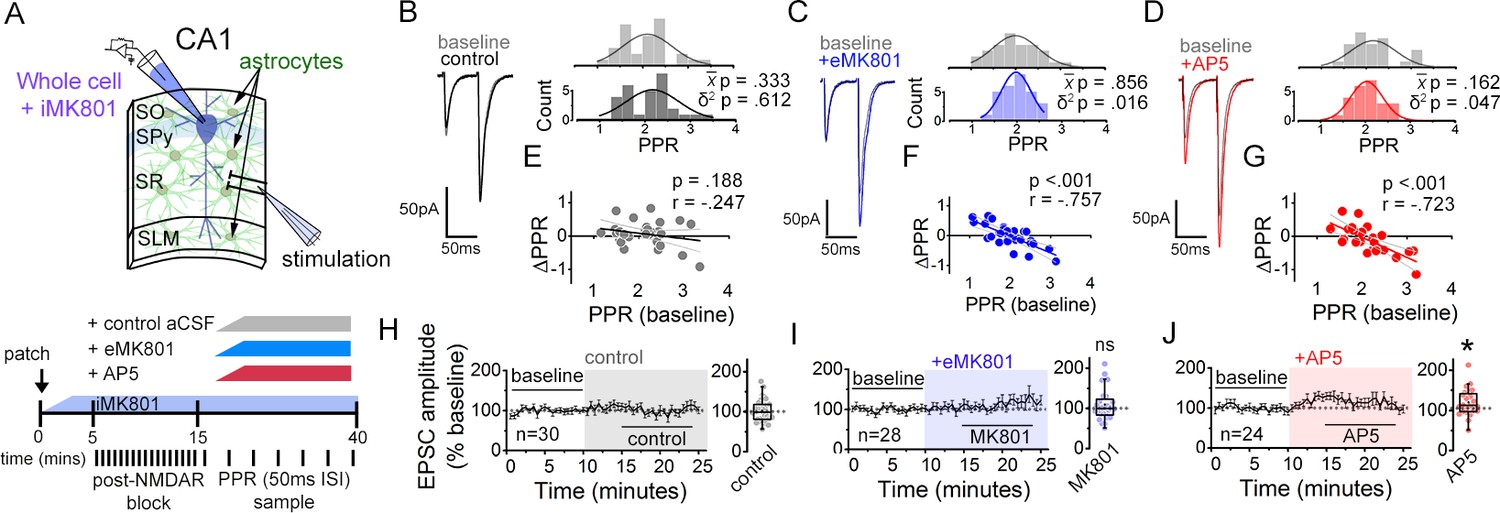
NMDARs contribute to synaptic strength diversity of Schaffer collateral synapses.
(A) Experimental scheme to assess the role of non-postsynaptic NMDARs. MK801 was perfused through the patch pipette (iMK801) to the CA1 pyramidal neuron for 10–15 min, and pairs of stimuli (Δt = 50 ms) were applied at least 45 times at 0.1 Hz to pre-block postsynaptic NMDARs prior to bath applying NMDAR antagonists (bottom). (B–D) Left: representative EPSC traces (average of 20 sweeps) to pairs of pulses (Δt = 50 ms) applied to Schaffer collateral axons before (baseline) and after wash-on of vehicle control (B), external MK801 (eMK801: 50 µM) (C), or AP5 (50 µM) (D). Right: histograms of the PPRs recorded during the baseline and vehicle or drug application periods were fit with single Gaussian curves. The p values for the comparison of the baseline to the experimental periods for the population mean () and variance (δ2) were obtained by two-tailed paired sample t-test and one-tailed f-test for equal variances, respectively. (E–G) Scatterplots of the change in PPR vs. the initial PPR in vehicle control (E), MK801 (F), or AP5 (G) where ΔPPR = PPRexperimental-PPRbaseline; linear fits, Pearson’s correlation coefficients (r) and p values are as indicated. X intercept: MK801 = 1.97, AP5 = 1.95. (H–J) Plots of normalized EPSC amplitudes before and during the application of NMDAR antagonists (shaded area); n, number of inputs examined for each experiment. Baseline and experimental periods are indicated (black bars). Right: summary bar graph. * p < 0.05, Mann-Whitney U-test. Control = 30 inputs, 15 cells, 13 mice; MK801 = 28 inputs, 14 cells, 9 mice; AP5 = 24 inputs, 12 cells, 11 mice. Data are presented as mean ± s.e.m.
Figure 1—figure supplement 1
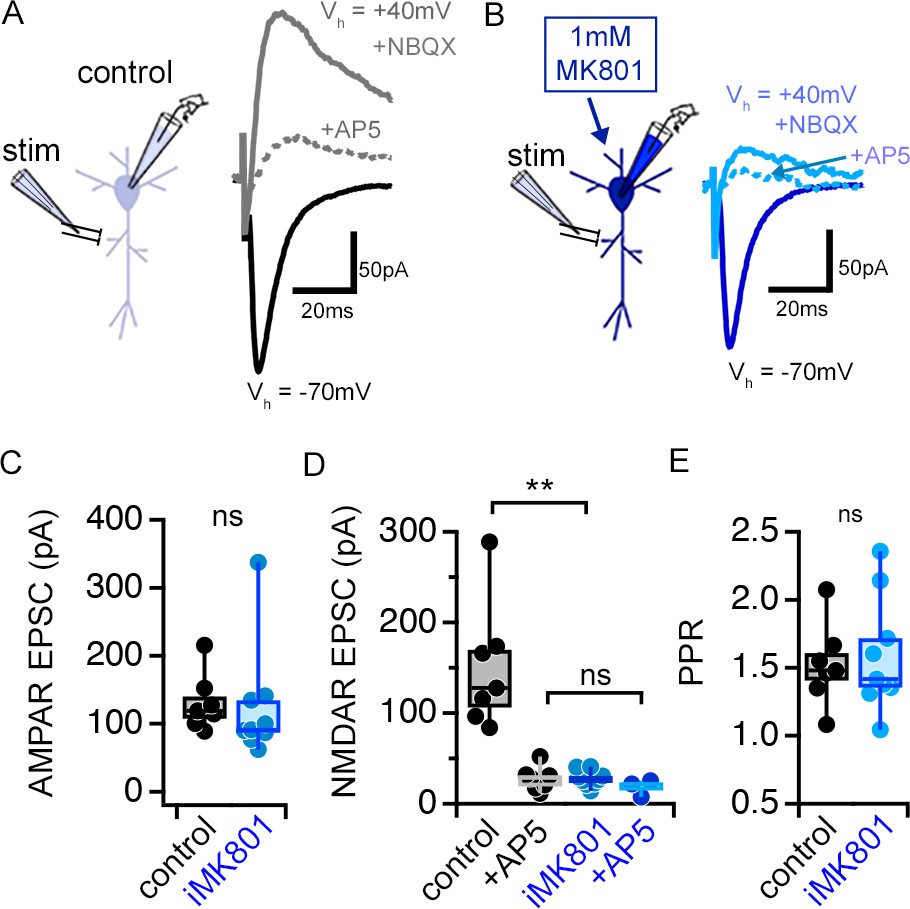
MK801 (1 mM) in the patch pipette (iMK801) completely blocks postsynaptic NMDARs.
(A–B) Representative traces of EPSC recorded at a holding potential (Vh) of –70 mV using control (A) or MK801-containing (B) pipette solution to measure AMPAR-mediated currents. EPSCs were recorded at a Vh of +40 mV and in the presence of NBQX (10 μM) to measure isolated NMDAR-mediated currents. AP5 (20 μM) was subsequently added to the bath to confirm the NMDAR-dependence of EPSCs. EPSCs were sampled following a pre-experiment stimulation period that consisted of at least 45 pairs of pulses delivered at 0.1 Hz at a Vh of –70 mV. (C) AMPA-mediated EPSCs are no different between control and iMK801experiments. (D) NMDAR-mediated EPSCs are completely abolished by the presence of iMK801. (E) Paired pulse ratios (PPRs) measured at Vh –70 mV are not altered by iMK801. Control n = 7 cells, 7 slices, 2 mice; control+ AP5 n = 7 cells, 7 slices, 2 mice; iMK801 n = 9 cells, 9 slices, 3 mice; iMK80+ AP5 n = 3 cells, 3 slices, 2 mice. ns p > 0.05, ** p < 0.0001 two-tailed t-test (D, E) or Mann-Whitney U test (C). Data are presented as mean ± s.e.m.
Figure 1—figure supplement 2
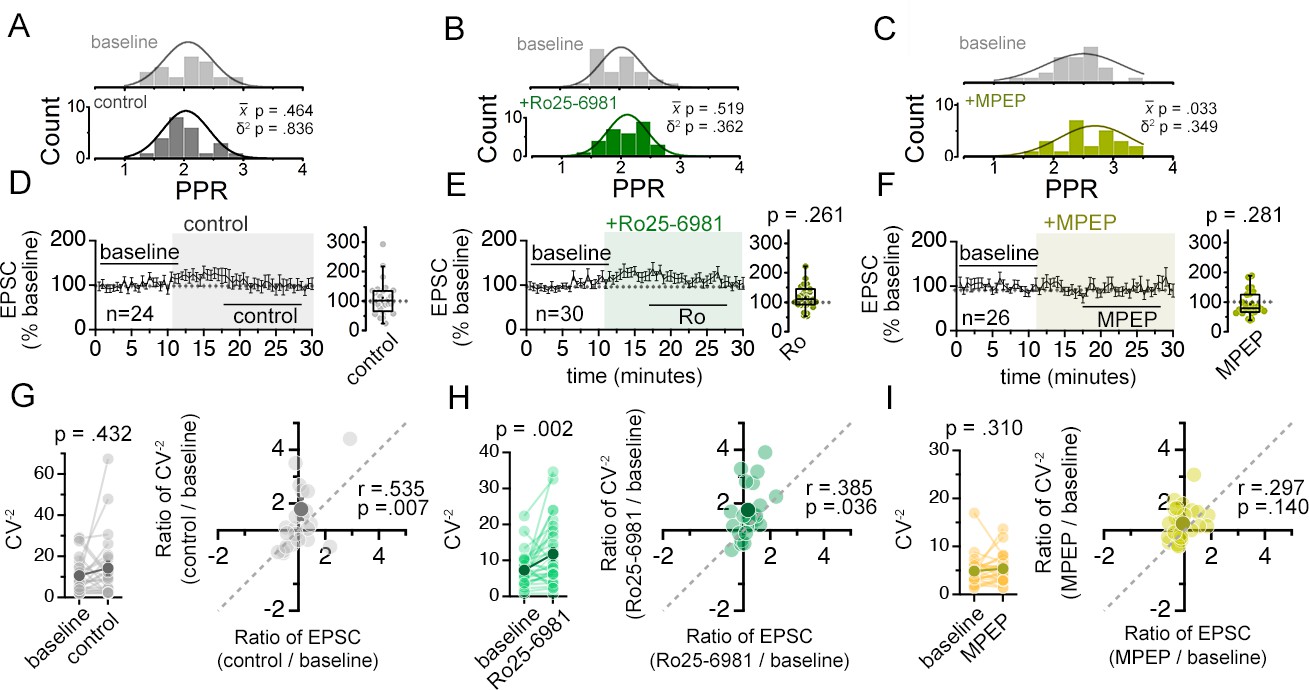
Antagonists of GluN2B-containing NMDARs (Ro25-6981) or mGluR5 (MPEP) do not alter synaptic weight diversity.
(A–C) Histograms of PPR distributions during the baseline (top histogram) and control aCSF or drug application (bottom histogram) were fit with single Gaussian curves. The p values obtained for the population mean () (two tailed paired sample t-test for A, B, Wilcoxon signed rank test for C) and variance (δ2) (one-tailed f-test for equal variances) comparing the baseline to the aCSF/drug application periods are shown in the graphs. (D–F) Plots of EPSC amplitudes (normalized to the baseline average) before and during the application of NMDAR antagonists (shaded area) where n is the number of inputs examined. Baseline and experimental periods are indicated (black bars). Box plots to the right show the summary of normalized EPSC amplitudes during the application of indicated inhibitors. p-Values are the result of Mann-Whitney U tests comparing EPSC change drug application period to the corresponding period in control experiments. (G–I) Left: Mean (dark circles) and individual (light circles) CV–2 of EPSCs during the baseline and aCSF/drug application periods. p-Values shown are the result of Wilcoxon signed rank tests. Right: Scatterplot of the relative change in CV–2 (CV–2 experimental/CV–2baseline) against the relative change in EPSC amplitude (EPSC experimental/EPSCbaseline) for the mean (dark circles) and individual inputs (light grey circles). Pearson’s correlation coefficients (r) and p values are shown in the graph. Control n = 12 inputs, 24 cells, 11 mice; Ro25-6981 n = 30 inputs, 17 cells, 11 mice; MPEP n = 26 inputs, 13 cells, 5 mice. Data are presented as mean ± s.e.m.
Figure 1—figure supplement 3
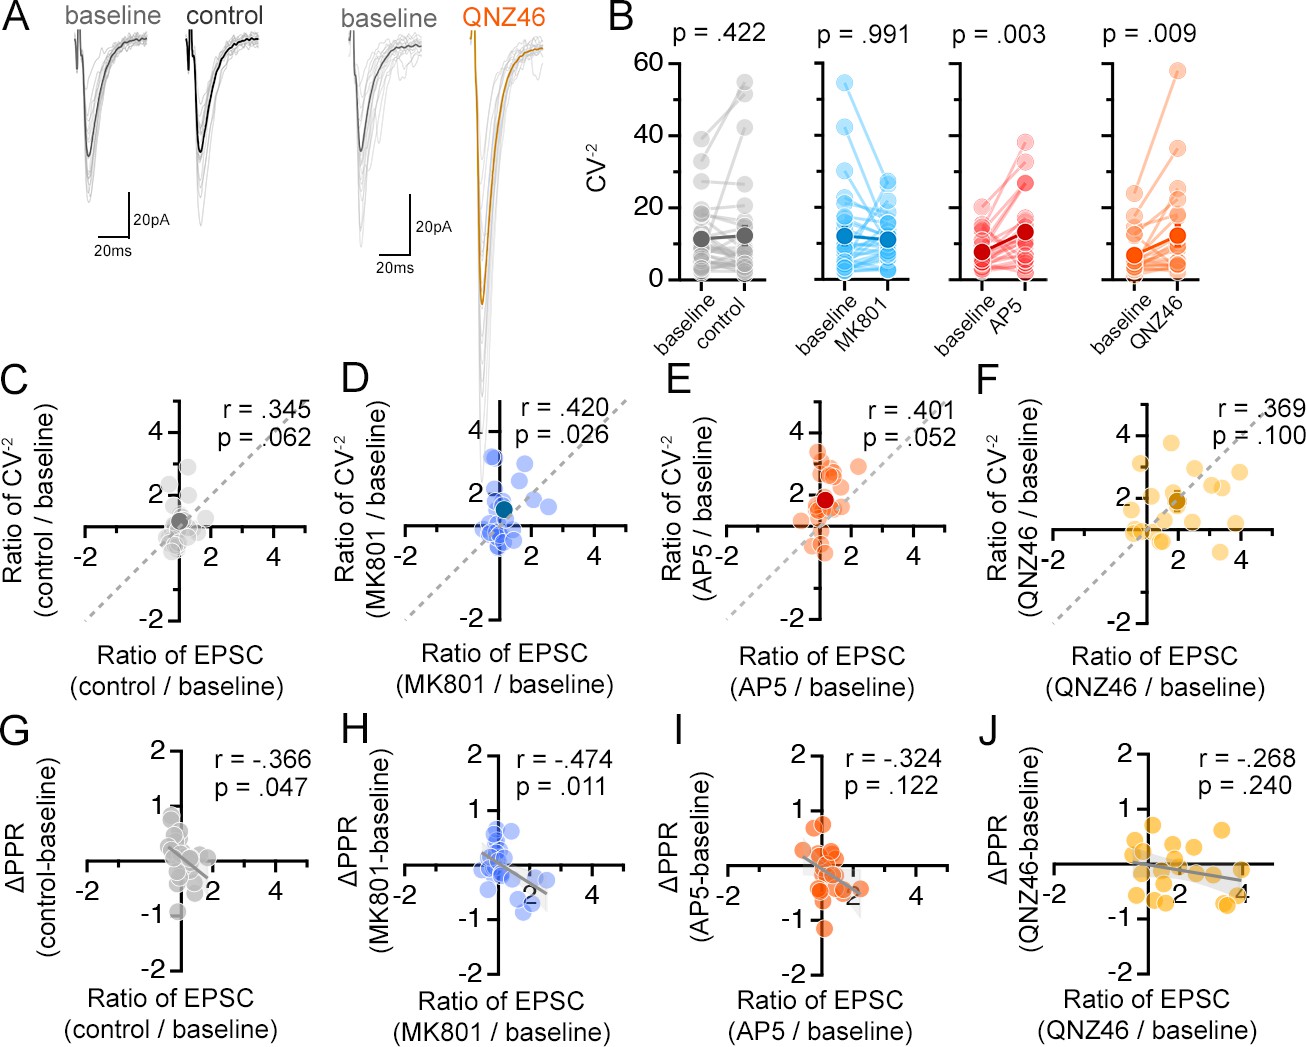
NMDAR antagonists differentially influence presynaptic function.
(Related also to Figure 6) (A) Averaged (dark colors) and individual (light grey) EPSC traces during the baseline and experimental periods from a representative experiment. (B) Mean (dark circles) and individual (light grey circles) CV–2 of EPSCs during the baseline and aCSF/drug application periods. P-values are the result of Wilcoxon signed rank tests. (C–F) Scatterplot of the relative change in CV–2 (CV–2 experimental/CV–2baseline) against the relative change in EPSC amplitude (EPSC experimental/EPSCbaseline) for the mean (dark circles) and individual inputs (light circles). Pearson’s correlation coefficients (r), p values, and the unity line (dashed) are shown in scatter plots. (G–J) Scatterplot of the difference in PPR (PPR experimental-PPRbaseline) against the relative change in EPSC amplitude (EPSC experimental/EPSCbaseline) for the mean (dark symbol) and individual inputs (light symbols). Linear fits (grey lines), Pearson’s correlation coefficients (r), and p values are shown in scatter plots. Control = 30 inputs, 15 cells, 13 mice; MK801 = 28 inputs, 14 cells, 9 mice; AP5 = 24 inputs, 12 cells, 11 mice; QNZ46 = 22 inputs, 11 cells, 7 mice; Ro25-6981 n = 30 inputs, 17 cells, 11 mice; MPEP n = 26 inputs, 13 cells, 5 mice. Data are presented as mean ± s.e.m.
Figure 1—figure supplement 4
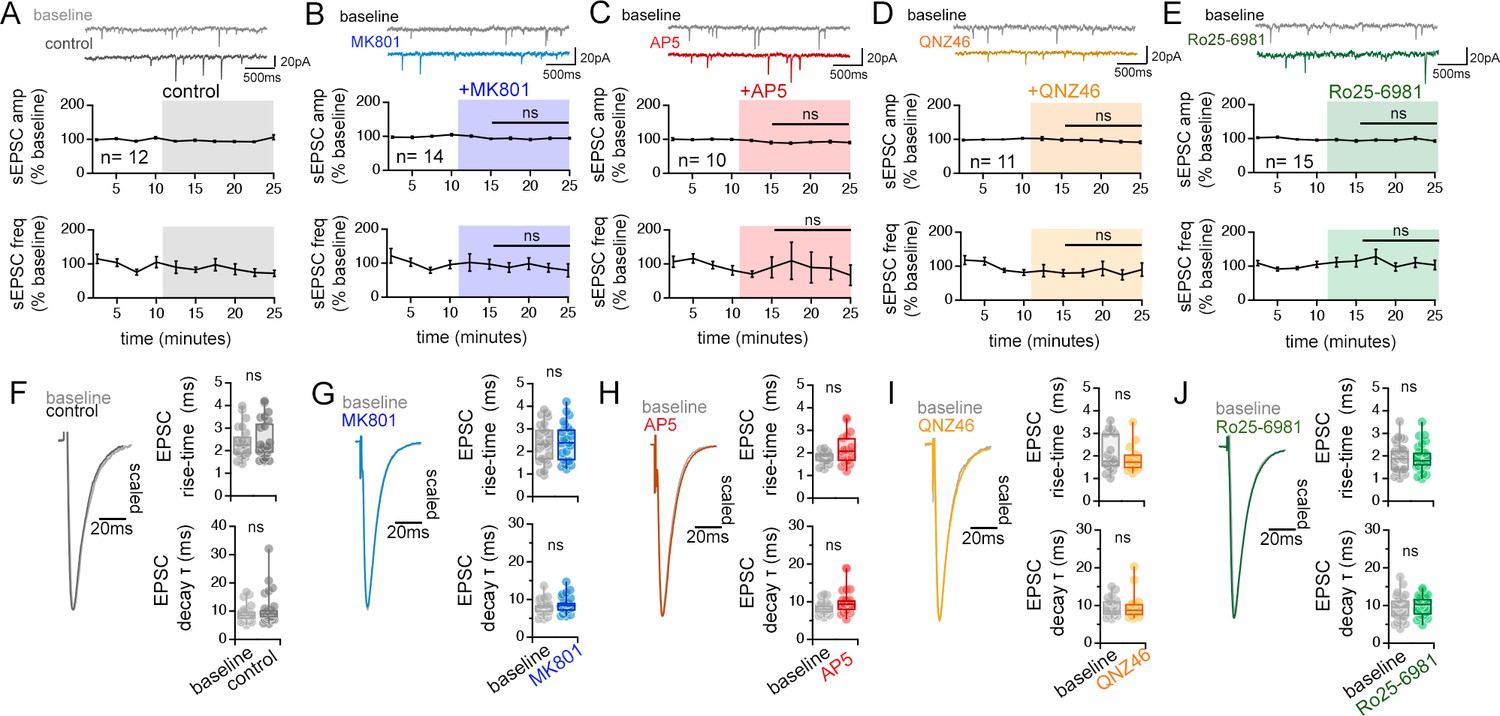
NMDAR antagonists have little effect on spontaneous neurotransmission and the waveform of evoked EPSCs.
[Related also to Figure 6] (A–E) Representative traces and quantification of spontaneous EPSC amplitude and frequency recorded during the baseline and after applying control aCSF (A), MK801 (B), AP5 (C), QNZ46 (D), and Ro-256981 (E). Control n = 12 cells, 10 mice; MK801 n = 14 cells, 9 mice; AP5 n = 10 cells, 9 mice; QNZ46 n = 11 cells, 8 mice; Ro25-6981 n = 15 cells, 10 mice. ns p > 0.05 one way ANOVA (amplitude), and Kruskal-Wallis ANOVA (frequency) comparing the normalized change during experimental periods across treatment conditions. (F–J) Left: Grand average waveforms of EPSCs recorded. Right: Box plots of EPSC risetime (top) and EPSC decay time constant (single exponential fit)(bottom) for baseline and control aCSF or drug application. ns p > 0.05 two tailed t-test or Mann-Whitney U tests. Control n = 24 inputs, 12 cells, 10 mice; MK801 n = 16 inputs, 11 cells, 11 mice; AP5 n = 26 inputs, 13 cells, 9 mice; QNZ46 n = 18 inputs, 9 cells, 6 mice; Ro25-6981 n = 32 inputs, 16 cells, 11 mice. Data are presented as mean ± s.e.m.
Figure 1—figure supplement 5
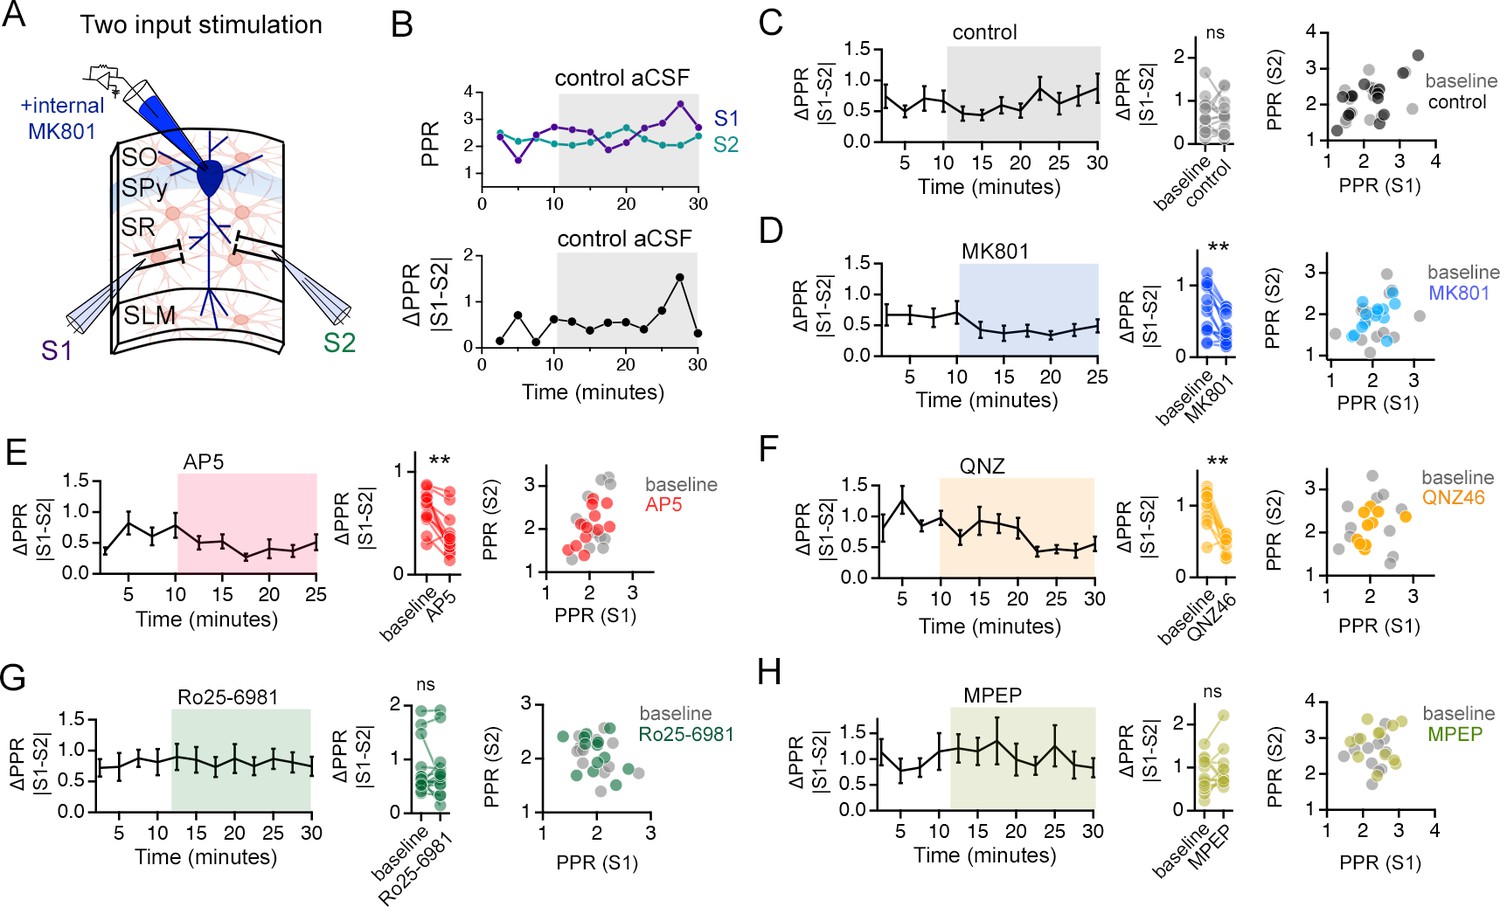
NMDAR antagonists that target GluN2C-containing NMDARs reduce PPR disparity in the stratum radiatum (SR).
[Related also to Figure 6] (A) Illustration of the two-input stimulation configuration. Two independent inputs in the SR were sampled with interleaved stimulation. (B) The absolute difference between the PPRs of the two inputs sampled during a 2.5 min window (average of 5 sweeps) is referred to as ΔPPR (|PPRS1-PPRS2|) and is taken as a measure of variability of presynaptic strength. (C–H) Left: Time course of ΔPPR before and after application of antagonists. Middle: Summary plots of individual experiments comparing ΔPPR in baseline and during antagonist treatment. Right: Scatter plots comparing PPR of the two independent inputs normalized to the first EPSC amplitude for baseline and in the presence of the antagonists. ΔPPR is reduced by MK801 (D), AP5 (E), QNZ46 (F), but not by Ro25-6981 (G) or MPEP (H). Similarly, the scatterplots demonstrate distribution of average PPR values across pairs of inputs (S1 and S2) of PPRs by MK801, AP5 and QNZ46, all of which target GluN2C-containing NMDARs, but not by Ro25-6981 or MPEP that target GluN2B-NMDAR or mGluR5, respectively. ns p > 0.05, ** p < 0.01 Wilcoxon signed ranks test comparing baseline to drug application period. Control n = 15 pairs of inputs, 15 cells, 13 mice; MK801 n = 14 pairs of inputs, 14 cells, 9 mice; AP5 n = 12 pairs of inputs, 12 cells, 11 mice; QNZ46 n = 11 pairs of inputs, 11 cells, 7 mice; Ro25-6981 n = 15 pairs of inputs, 15 cells, 11 mice; MPEP n = 13 pairs of inputs, 13 cells, 5 mice. Data are presented as mean ± s.e.m.
Figure 2 with 2 supplements
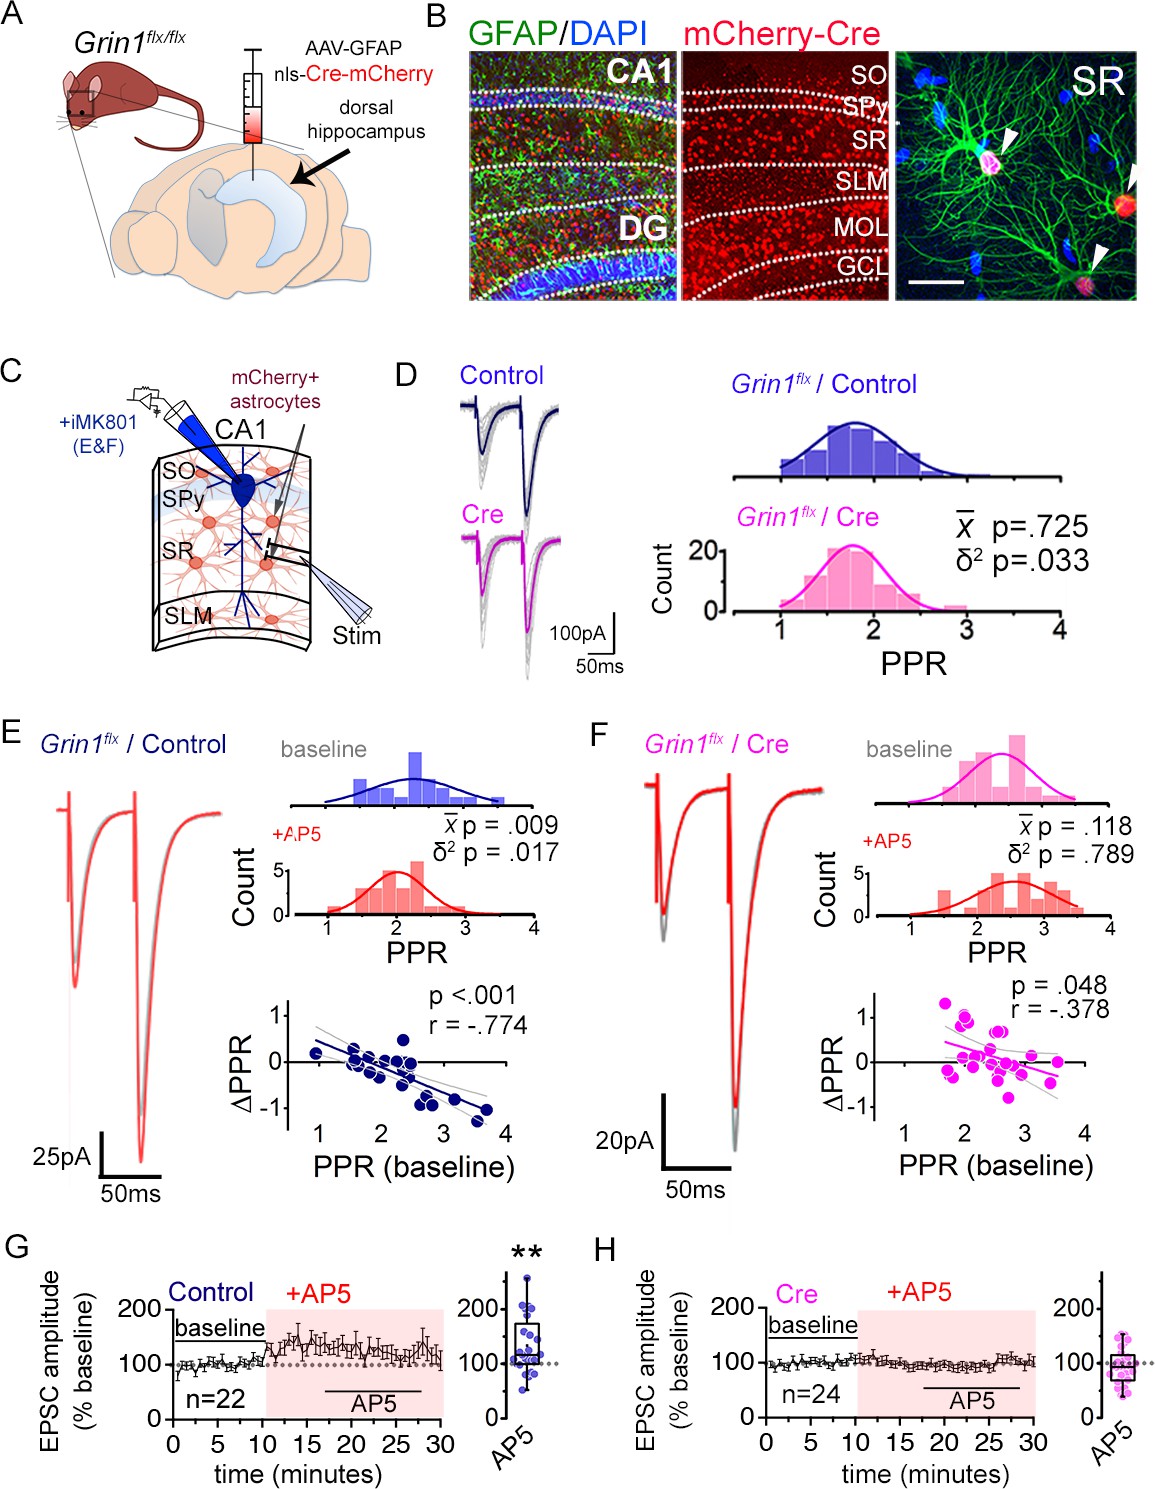
Astrocyte NMDARs mediate the antagonist-induced decrease in synaptic strength diversity.
(A) Astrocyte GluN1 was conditionally knocked down by injecting AAV-GFAP104-nls-mCherry-Cre (Cre), or as a control, AAV-GFAP104-nls-mCherry (Control), to the dorsal hippocampus of adult Grin1flx/flx mice. (B) Representative image of hippocampal area CA1 immunolabeled for GFAP (green) and mCherry (red) and counterstained with DAPI (blue), 21 days after virus injection. SO, stratum oriens; SPy, stratum pyramidale; SR, stratum radiatum; SLM, stratum lacunosum moleculare; MOL, molecular layer; GCL, granule cell layer. Right: magnified view in SR showing restricted expression of mCherry to GFAP-positive astrocytes (arrowheads). Scale bar, 20 µm. (C) Recording scheme: CA1 pyramidal neurons were patched in acute slices prepared 21 days after Control or Cre AAV infection. EPSCs were elicited by placing the stimulating electrode in the SR. Patch pipette contained MK801 (iMK801) for experiments in E-H. (D) Left: Averaged EPSC traces from representative recordings in slices from Control (top) or Cre (bottom) virus-infected mice. Individual traces are shown in grey. Right: Histograms of PPRs recorded from control (top) and Cre slices (bottom) were fit with single Gaussians. The p values were obtained for the population mean () (two-tailed t-test) and variance (δ2) (one-tailed f-test for equal variances) comparing PPR distributions from control (n = 72 inputs, 43 cells, 14 mice) and Cre (n = 74 inputs, 46 cells, 12 mice) slices. (E,F) Left: average EPSC traces in baseline (grey) and after drug treatment (color) from a representative experiment. Right: PPR histograms (top) and ΔPPR vs. baseline PPR plots (bottom) in baseline and after bath applying AP5 (50 µM) to control (E) and Cre (F) slices. The p values for the population mean () and variance (δ2) are as in D, comparing PPRs before and after the drug treatment. Linear fits and Pearson’s correlation coefficients (r) and p values are shown in scatter plots. (G,H) Plots of normalized EPSC amplitudes before and during the application of AP5 to control (G) and Cre-infected (H) slices (shaded area); n is the number of inputs examined. Right: summary bar graph. **p = 0.005, Mann-Whitney U-test. Control+ AP5 = 22 inputs, 12 cells, 5 mice; Cre+ AP5 = 24 inputs, 14 cells, 5 mice. Data are presented as mean ± s.e.m.
Figure 2—figure supplement 1
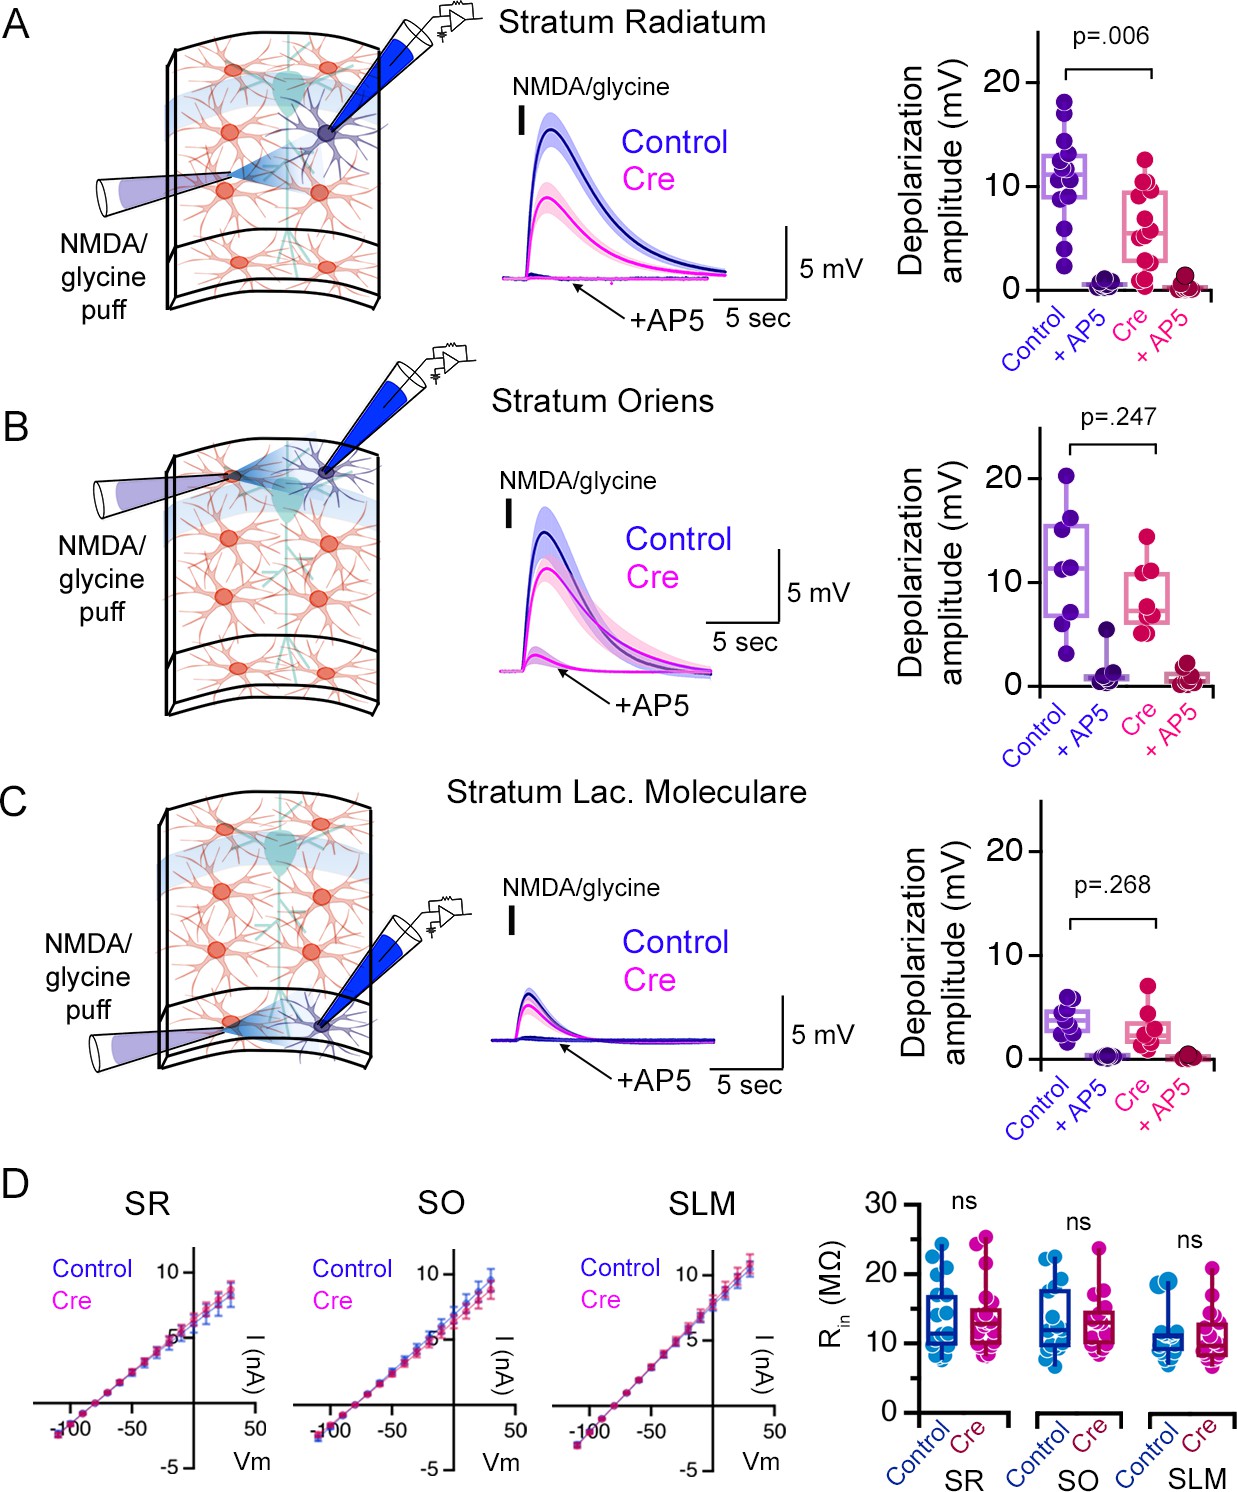
Puff application of NMDA and glycine triggers the depolarization of astrocytes in hippocampal CA1 in acute slices.
(A) Left: experimental setup. Middle: Local puff application (100 ms, black bar) of NMDA and glycine (1 mM each) to astrocytes that are whole-cell patch clamped in the stratum radiatum (SR) elicits slow membrane depolarization (Control, blue), which is prevented in the presence of AP5 (arrow). Once the depolarization is triggered, not only NMDARs but also other voltage-gated channels such as L-type calcium channels contribute to the slow depolarization (Letellier et al., 2016). The depolarization is substantially reduced when the same experiment is carried out in Cre-expressing astrocytes as monitored by mCherry expression in slices infected with the AAV-GFAP104-nls-mCherry-Cre virus to knock-down astrocyte NMDARs in Grin1flx/flx mice (Cre, red). Right: Summary plot of the peak membrane depolarization in control virus infected (Control) or NMDAR knock-down (Cre) slices in control aCSF or in the presence of AP5. (B–C) Same as (A) except NMDA and glycine puff was applied to astrocytes patch-clamped in the stratum oriens (SO)(B) and stratum lacunosum moleculare (SLM)(C). NMDA/glycine puff-mediated depolarizations elicited in SO and SLM astrocytes are not sensitive to astrocyte NMDAR knockout. SR Control n = 14 cells, 3 mice; SR Cre n = 14 cells, 3 mice. SO Control n = 8 cells, 3 mice; SO Cre n = 8 cells, 3 mice. SLM Control n = 9 cells, 2 mice; SLM Cre n = 8 cells, 2 mice. (D) Cre expression does not alter the input resistance (Rin) of astrocytes in any layer. IV relationships of Control and Cre positive astrocytes in the SR, SO, and SLM to square voltage steps (left; 500 ms duration) and quantification of Rin (right). SR Control n = 17 cells, 8 mice; SR Cre n = 20 cells, 10 mice. SO Control n = 16 cells, 10 mice; SO Cre n = 16 cells, 11 mice. SLM Control n = 19 cells, 8 mice; SLM Cre n = 18 cells, 9 mice. ns p > 0.05, p values shown are the result of two-tailed t-tests or Mann-Whitney U tests. Data are presented as mean ± s.e.m.
Figure 2—figure supplement 2
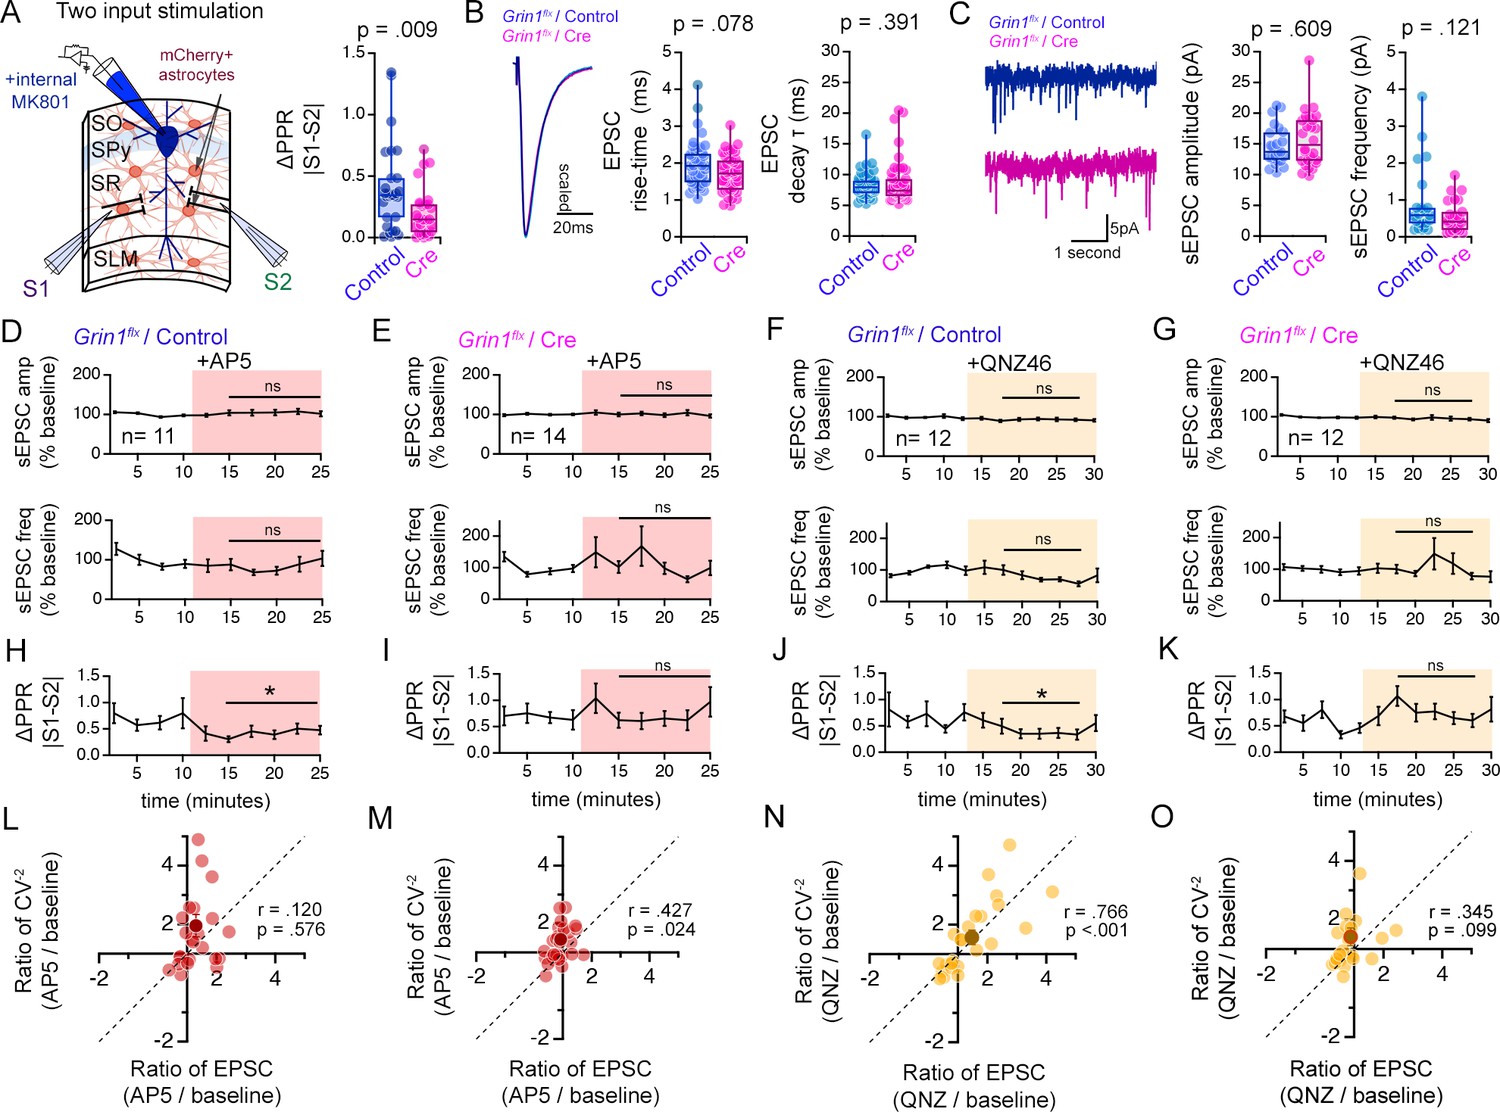
Knock-down of GluN1 in hippocampal astrocytes selectively alters the PPR disparity without affecting the basic properties of synaptic transmission.
[Related also to Figure 6] (A) Left: Illustration of the experimental configuration of two-pathway stimulation approach to estimate PPR disparity in slices from Grin1flx/flx mice infected with Control or Cre virus. Right: Comparison of ΔPPR (|PPRS1-PPRS2|) between Control or Cre slices. PPR disparity (ΔPPR) is reduced in Cre infected slices compared to controls. p = 0.009, Mann-Whitney U test. Control n = 29 pairs of inputs, 29 cells, 8 mice. Cre n = 28 pairs of inputs, 28 cells, 6 mice. (B) Left: Grand average waveforms of EPSCs recorded. Right: Box plots of EPSC risetime and EPSC decay time constant (single exponential fit). Each data point represents the average waveform of at least 5 sweeps of EPSCs. Control n = 46 inputs, 23 cells, 8 mice. Cre n = 41 inputs, 21 cells, 6 mice. (C) Left: Representative traces of spontaneous EPSC (sEPSC) recordings from Control (blue) or Cre (red) slices. Right: Boxplots of sEPSC amplitude and frequency measured in Control or Cre-infected slices. P values shown are the result of Mann-Whitney U test. Control n = 23 cells, 5 mice. Cre n = 26 cells, 5 mice. (D–G) Normalized sEPSC amplitude (top) and frequency (bottom) during baseline and in the presence of AP5 or QNZ46 in Control or Cre-infected slices. Neither sEPSC amplitude nor frequency is not affected by AP5 or QNZ46. Two tailed t-test or Mann-Whitney U test, comparisons made between Control vs. Cre normalized values in post drug period indicated. (H–K) ΔPPR (|PPRS1-PPRS2|) measurements during baseline and in the presence of AP5 or QNZ46 in Control or Cre-infected slices. The decrease in PPR disparity triggered by AP5 (H) and QNZ46 (J) is prevented upon knock-down of astrocyte NMDARs. * p < 0.05 Wilcoxon signed ranks test. Control+ AP5 n = 12 pairs of inputs, 12 cells, 6 mice. Cre+ AP5 n = 14 pairs of inputs, 14 cells, 5 mice. Control+ QNZ46 n = 12 pairs of inputs, 12 cells, 5 mice. Cre+ QNZ46 n = 12 pairs of inputs, 12 cells, 6 mice. (L–O) Scatterplot of the relative change of CV–2 (CV–2 experimental/CV–2baseline) against the relative change in EPSC amplitude (EPSC experimental/EPSCbaseline) for the mean (dark symbol) and individual inputs (light symbols). Dashed lines show positive unity line. Pearson’s correlation coefficients (r) and p values are shown in scatter plots. N values are the same as H-K. Data are presented as mean ± s.e.m.
Figure 3 with 2 supplements

Synaptic neurotransmitter release probability diversity impacts long-term synaptic plasticity.
(A) Illustration of the model used in the simulation. There are two leaky integrate-and-fire neurons with a synaptic connection. Each neuron receives a current injection whose magnitude is A1 for neuron 1 and A2 for neuron 2. The input spike trains for neuron 1 and neuron 2 are misaligned by Δt. A1 is set at 500 pA which is large enough to trigger neuron 1 to spike, while A2 is varied to test the sensitivity of STDP between neurons. The release probability of neuron 1 [subject to alteration by the neighboring astrocyte(s)] is modelled by different gamma distribution for three different conditions: ‘control’, ‘AP5’ representing narrowed release probability distribution, and ‘AP5-with-control mean’ in which the best fit distribution for the AP5 case has been obtained by fixing the mean to remain the same as the mean of the control distribution. (B) Summary of simulation illustrating the efficacy with which long-term synaptic plasticity is triggered as a function of the amplitude of postsynaptic current injection A2 . Changes in synaptic weight w(t) after giving 10 spike pairs at 20 Hz in which the current injection to the presynaptic neuron is 500 pA and the postsynaptic neuron is A2, in control (left), in AP5 (middle), and in AP5-with-control mean (right). The current injection sequences to the presynaptic and the postsynaptic neurons are separated by a time difference Δt. Color intensity shows the degree of potentiation (red) and depression (blue) of synaptic weight changes observed for variable amount of A2 injected to the postsynaptic neuron at each Δt for the three different conditions represented by each panel. Horizontal green dashed line shows the minimum amount of current injection to the postsynaptic neuron A2 that is required to trigger long-term potentiation (LTP) in the control condition, and similarly, the small arrows in each panel indicate the minimum amount of current injection A2 that evokes LTP in control (left), in AP5 (middle), and in AP5-with-control mean (right). Gray-shaded area is the range of A2 used to calculate the average of the maximum change in w(t) among Δt, which is shown in (C). For release probability distributions with the same mean, a smaller amount of current injection is needed to trigger LTP if the release probability distribution has a wider variance. (C) The averages of the maximum change in w(t) in the three different conditions.
Figure 3—figure supplement 1
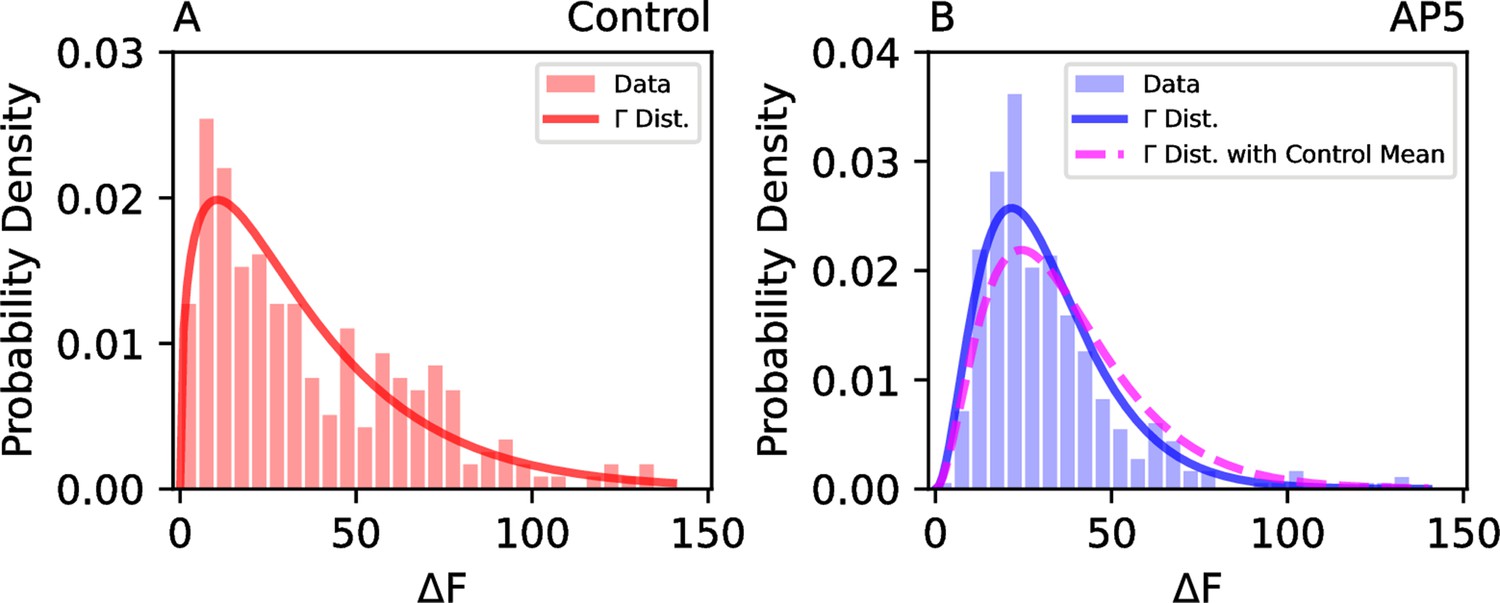
Additional data and corresponding fits to show how the effect on the variability of release probability distribution [subject to alteration by the neighboring astrocyte(s)] can be modelled by gamma distributions.
(A) Release probability was estimated in cultured hippocampal pyramidal neurons by the labelling of the readily releasable pool by FM1-43 (see Materials and Methods), and the histogram of FM1-43 signals (ΔF) observed in the control condition (550 synapses, n = 5 cells) is shown with the best-fitting gamma distribution (k = 1.4 and ). (B) A histogram of FM1-43 signals (ΔF) representing the readily releasable pool obtained in the presence of AP5 (302 synapses, n = 6 cells) with the best-fitting gamma distribution ( and ) and the best-fitting gamma distribution with control mean ( and ).
Figure 3—figure supplement 2
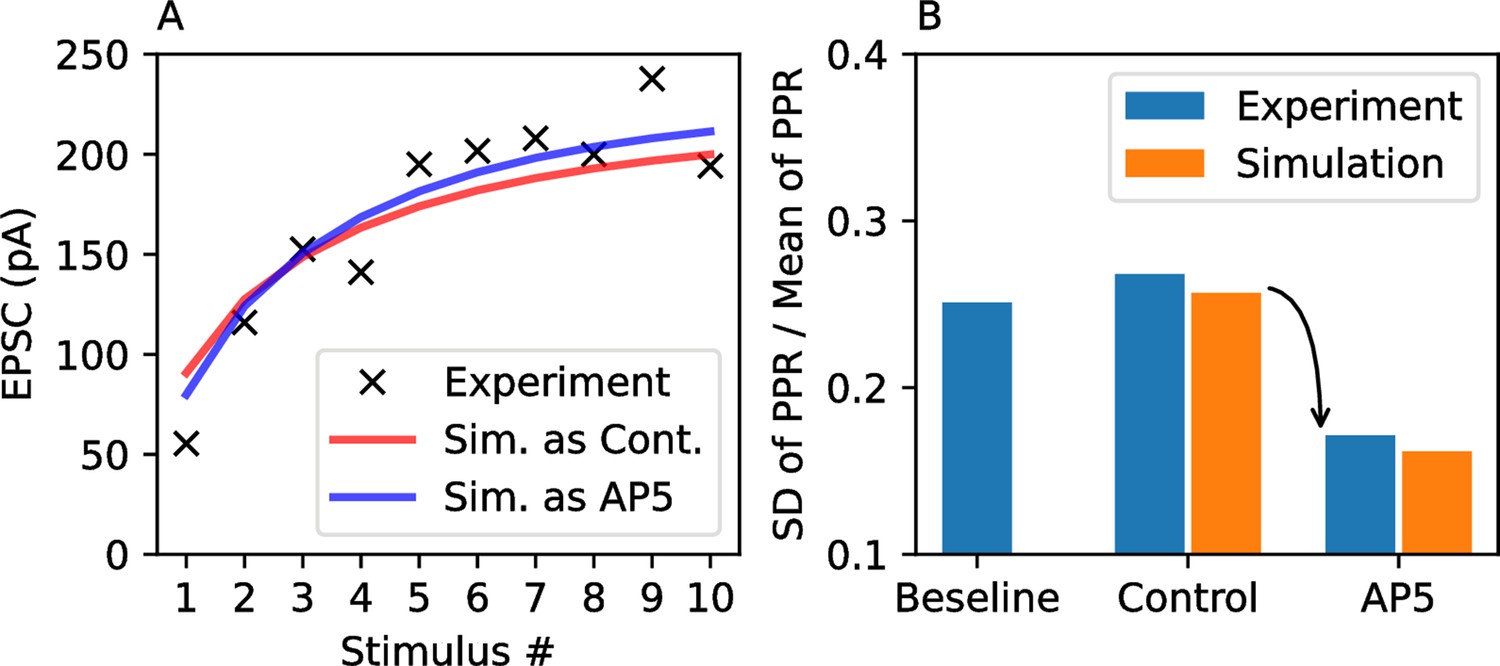
Additional data and comparisons showing how the model can fit experimentally obtained EPSC peak responses recorded in CA1 pyramidal neurons.
Also, the reduction of PPR variance associated with blocking NMDARs as shown in Figure 1 can be reproduced in the simulations. (A) Peak amplitudes of EPSCs evoked by stimulating the Schaffer collaterals at 20 Hz in acute hippocampal slices were fit to the model reproducing the release probability distribution in the control condition (red line) and the condition of reduced release probability variance under the NMDAR-blocked condition (blue line). The two curves showed only a small difference between each other. The fitted parameters are , ms and ms. (B) The experimentally observed reduction of PPR variance (blue bars; data from Figure 1B–D) is reproduced by the simulation (orange bars). The PPR variance in the NMDAR-blocked condition showed a smaller variance compared to the PPR variance in the control condition.
Figure 4

Synaptic neurotransmitter release probability diversity impacts long-term synaptic plasticity triggered by Poisson spike input series.
(A) Illustration of the model used in the simulation. Two leaky integrate-and-fire neurons with a synaptic connection received independent Poisson spike trains. Similarly to Figure 3, the release probability of neuron 1 [subject to alteration by the neighboring astrocyte(s)] is modelled by three different gamma distributions representing control, AP5, and AP5-with-control mean conditions. (B) Summary of simulation. Major vertical axis (left, blue) shows the relative differences in the final synaptic weights in AP5 (left plot) or AP5-with-control mean (right plot) compared to the control condition. The relative differences (blue dots) are plotted against the final synaptic weight change in control condition (horizontal axis). The binned data are shown as green bars (minor vertical axis: right, green). The plots indicate that spike inputs that promote potentiation under control condition tend to favor weaker potentiation in either AP5 or AP5-with-control mean, and spike inputs that promote depression under control condition tend to favor weaker depression in either AP5 or AP5-with-control mean. (C) The reduction of long-term plasticity in AP5 and AP5-with-control mean representing situations of narrowed release probability variance, relative to the control condition. The reduction of plasticity is defined by the mean of the differences between the final weights in NMDAR-blocked conditions and the control condition with a sign correction since long-term potentiation and long-term depression change weights in opposite directions.
Figure 5
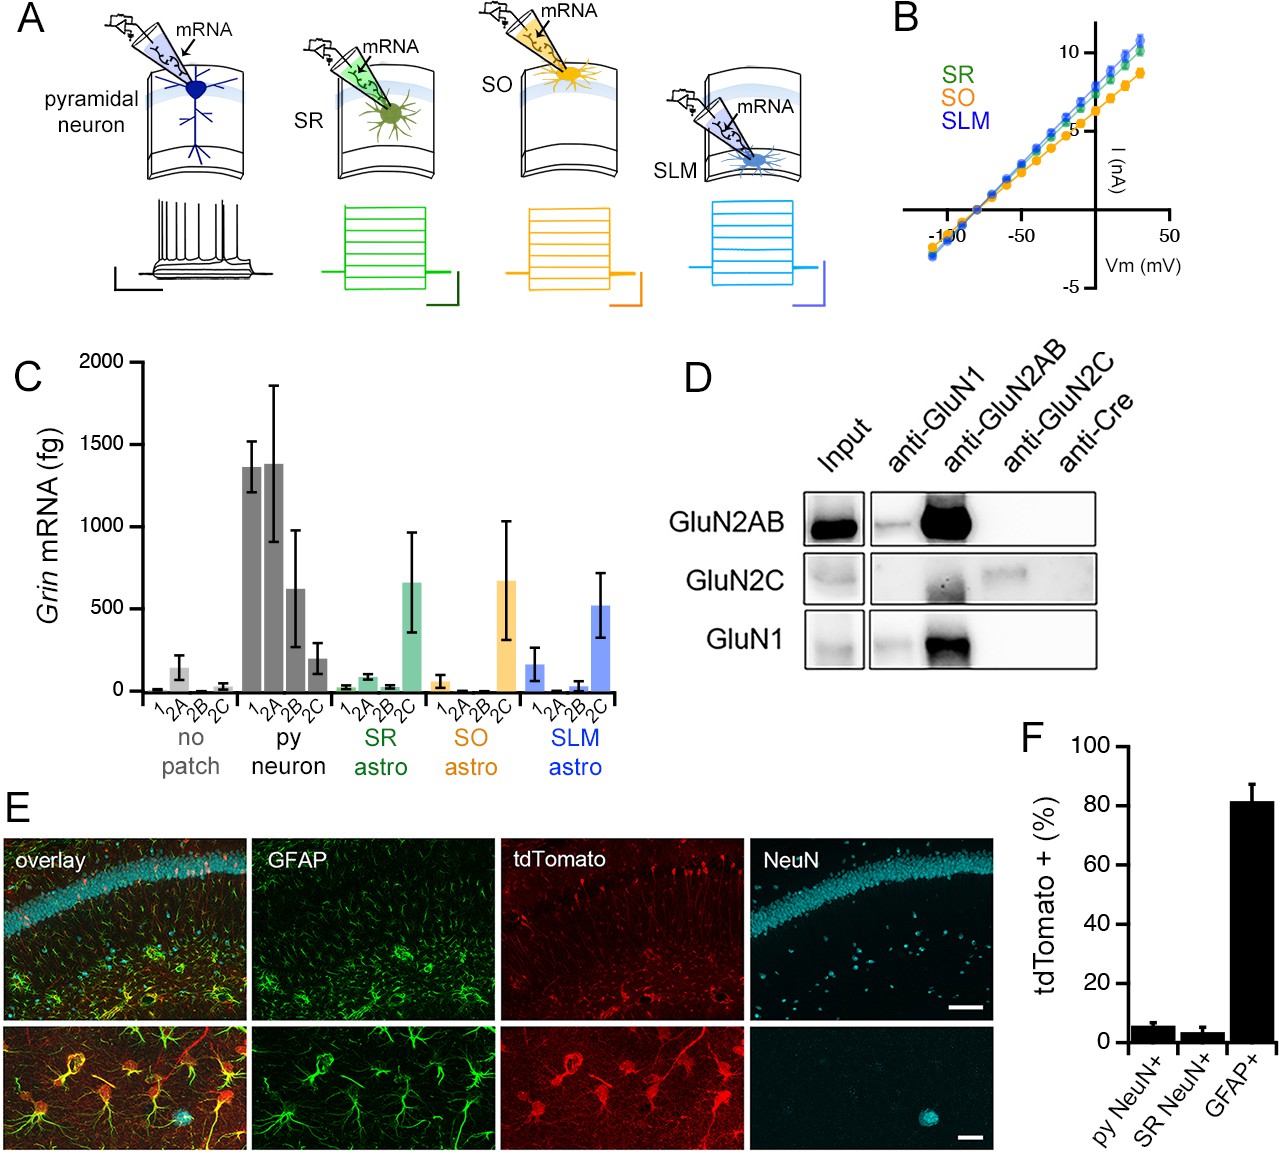
Adult mouse hippocampal astrocytes express GluN2C-NMDA receptors.
(A) Top: patch RT-PCR strategy. Bottom: representative voltage responses to current steps in CA1 pyramidal neuron (far left, black), and current responses to voltage steps in astrocytes in stratum radiatum (SR, green), stratum oriens (SO, yellow), and stratum lacunosum moleculare (SLM, blue). Scale bars: neuron, 40 mV, 500 ms; astrocytes, 6 nA, 200 ms. (B) Summary of I-V curves of astrocytes obtained before collecting RNA. N = 39 cells, 36 slices, 9 mice for each layer. (C) Summary of RT-PCR analysis for mRNA encoding indicated NMDAR subunits: Grin1 (1), Grin2a (2A), Grin2b (2B), and Grin2c (2C). Control samples (no patch) were obtained by inserting the electrode into the slice without patching cells. Three technical replicates were performed for each condition. (D) Western blots of co-immunoprecipitations performed using adult mouse hippocampal extracts with the indicated antibodies where anti-Cre antibody is used as a negative control. The blots are probed for GluN2A/2B (top row), GluN2C (middle row) or GluN1 (bottom row). (E) Representative brain sections of Grin2ciCre/+ mice crossed to a tdTomato reporter line (Ai9), showing hippocampal area CA1 immunolabelled for GFAP, tdTomato and NeuN; scale bars, 160 μm (top), 25 μm (bottom). (F) Quantification of % cells that are positive for tdTomato amongst the counts of NeuN-labelled cells in stratum pyramidale (left, total n = 3155 cells) and SR (middle, total n = 619 cells), and GFAP-labelled cells (right, total n = 3149 cells). N = 10 fields of view of area CA1 from individual hippocampal sections (n = 10) obtained from 5 mice. Data are presented as mean ± s.e.m.
Figure 6
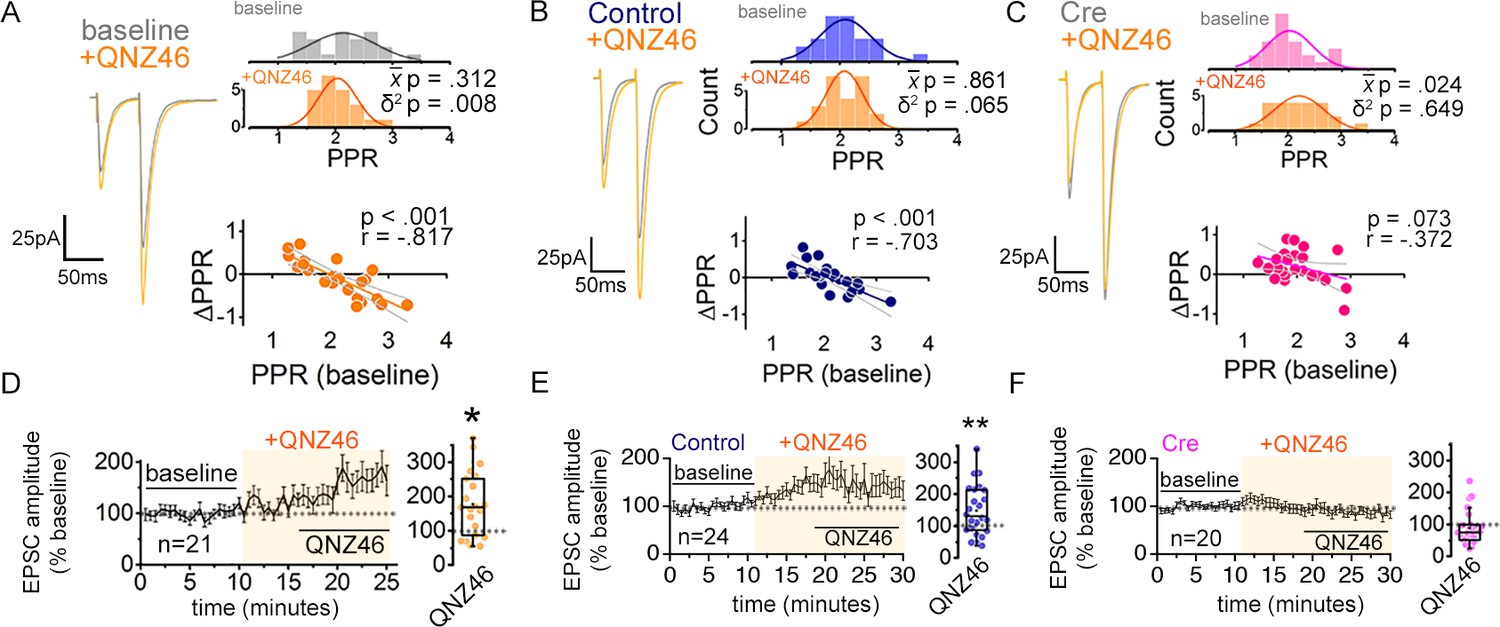
Inhibiting GluN2C NMDARs reduces PPR variability in a manner dependent on astrocyte expression of GluN1.
(A–C) Left: representative EPSC traces (average of 20 sweeps) to pairs of pulses (Δt = 50 ms) applied to Schaffer collateral axons in baseline and after wash-on of QNZ46 (25 µM). Right: PPR histograms (top) and ΔPPR vs. baseline PPR plots (bottom) before and after bath applying QNZ46 to control uninfected (A), Control (B) and Cre (C) slices. The p values were obtained for the population mean () (paired sample t-test) and variance (δ2) (one-tailed f-test for equal variances) comparing PPRs before and after the drug treatment. Linear fits and Pearson’s correlation coefficients (r) and p values are shown in scatter plots. (D–F) Plots of EPSC amplitudes (normalized to the baseline average) before and during the application of QNZ46 to control uninfected (D), Control (E) and Cre-infected (F) slices (shaded area) where n is the number of inputs examined for each experiment. Baseline and experimental periods are indicated (black bars). Box plots show the summary of normalized EPSC amplitudes during the QNZ46 application. *p < 0.05, **p = 0.005, Mann-Whitney U-test was used to compare the control to the drug conditions. No virus infection+ QNZ46 = 21 inputs, 11 cells, 7 mice; Control+ QNZ46 = 24 inputs, 12 cells, 5 mice; Cre+ QNZ46 = 20 inputs, 12 cells, 6 mice. Data are presented as mean ± s.e.m.
Figure 7 with 1 supplement
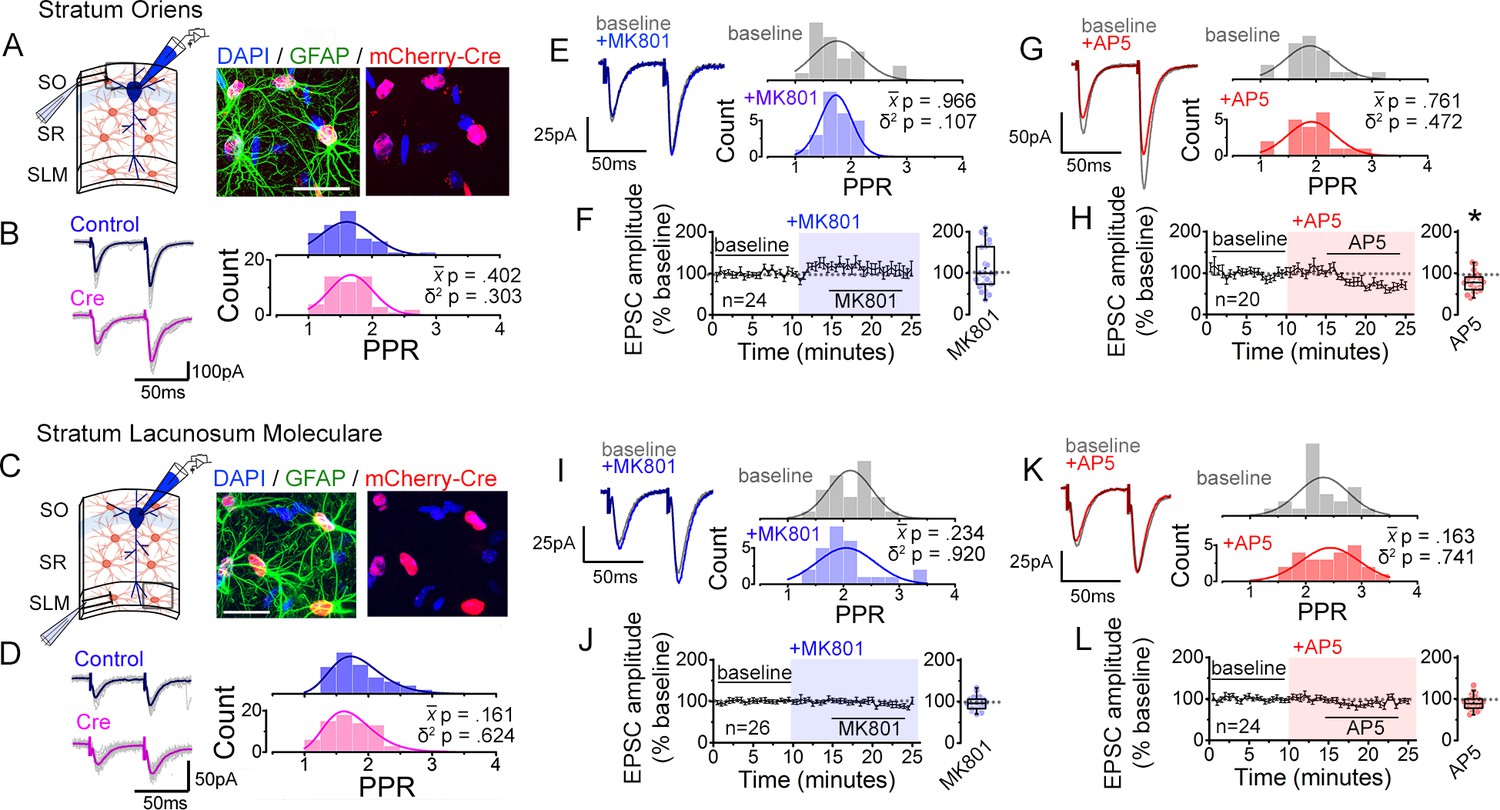
Interfering with astrocyte NMDARs has little effect on synaptic strength diversity in the stratum oriens (SO) and the stratum lacunosum moleculare (SLM).
(A) Left: recording scheme. Right: confocal image from SO in CA1 showing nls-mCherry-Cre-positive astrocytes labelled with GFAP and DAPI. Scale bar, 20 µm. (B) Average (color) and individual (grey) EPSC sweeps from representative recordings by stimulating SO of Control and Cre infected slices from Grin1flx/flx mice. PPR histograms from Control (top) and Cre slices (bottom) fit with single Gaussians. [p values: comparisons of population mean () (Mann-Whitney test) and variance (δ2) (one-tailed f-test for equal variances) between Control and Cre.] Control, n = 50 inputs, 25 cells, 7 mice; Cre, n = 50 inputs, 25 cells, 7 mice. (C,D) Same analysis as in A,B for SLM. Control, n = 67 inputs, 47 cells, 12 mice; Cre, n = 71 inputs, 49 cells, 12 mice. (E,G) Representative EPSC traces and PPR histograms of from SO stimulation in baseline and after applying MK801 (E) or AP5 (G). (F,H) Normalized EPSC amplitudes before and after applying MK801 (F) or AP5 (H) (shaded area) in SO. Right, summary bar graph. MK801, n = 24 inputs, 12 cells, 6 mice; AP5, n = 20 inputs, 10 cells, 7 mice. * p < 0.05 Mann-Whitney U-test. (I,K) Same analysis as in E,G for PPRs elicited in SLM in control and MK801 (I) or AP5 (K). (J,L) Same analysis as in F,H with MK801 (J) or AP5 application (L). MK801: n = 26 inputs, 13 cells, 8 mice; AP5, n = 24 inputs, 12 cells, 6 mice. Data are presented as mean ± s.e.m.
Figure 7—figure supplement 1
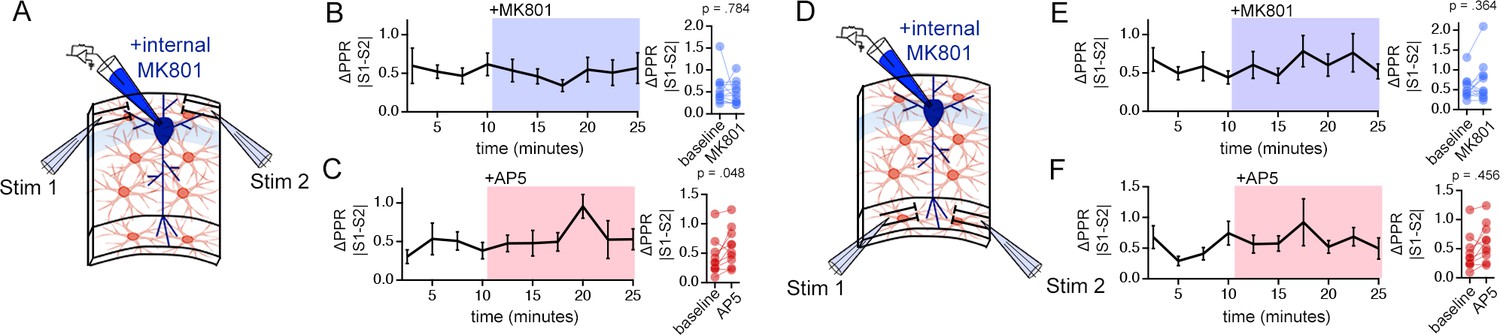
MK801 and AP5 do not alter PPR disparity in the stratum oriens (SO) or the stratum lacunosum moleculare (SLM).
(A) Illustration of the two-input stimulation configuration in SO. (B,C) Left: PPR disparity [ΔPPR (|PPRS1-PPRS2|)] during baseline and in the presence of MK801 (B) or AP5 (C). Right: Summary plot of ΔPPR. Neither MK801 nor AP5 application influences the PPR disparity. (D–F) Same experiments as described for (A–C) carried out in SLM. Similarly to SO recordings, MK801 and AP5 have no effects of PPR disparity in SLM. p-Values are the result of Wilcoxon signed rank tests. SO MK801 n = 12 pairs of inputs, 12 cells, 6 mice; SO AP5 n = 10 pairs of inputs, 10 cells, 7 mice; SLM MK801 n = 13 pairs of inputs, 13 cells, 8 mice; SLM AP5 n = 12 pairs of inputs, 12 cells, 6 mice. Data are presented as mean ± s.e.m.
Tables
Appendix 1—key resources table
| Reagent type (species) or resource | Designation | Source or reference | Identifiers | Additional information |
|---|---|---|---|---|
| strain, strain background (Mouse) | C57Bl/6 J | Nihon SLC | C57Bl/6JJmsSlc | |
| strain, strain background (Rat) | Sprague Dawley rat | Nihon SLC | Slc:SD | Time pregnant (pups were used at P0-P3 to harvest tissue for culture) |
| genetic reagent (mouse) | Grin1flx/flx | McHugh Lab (RIKEN CBS) | B6.129S4-Grin1tm2Stl/J Jackson Labs 005246 | (Tsien et al. Cell 87, 1327–1338, 1996) |
| genetic reagent (mouse) | Ai9 | Itohara Lab (RIKEN CBS) | B6.Cg-Gt(ROSA)26Sortm9(CAG-tdTomato)Hze/J Jackson Labs 007909 | (Madisen et al. Nat Neurosci 13, 133–140, 2010) |
| genetic reagent (mouse) | Grin2ciCre/+ | Sakimura Lab (Niigata U) | NA | (Miyazaki et al., J Neurosci 32, 1311–1328, 2012) |
| cell line (Homo-sapiens) | 293FT (derived from embryonic kidney) | ThermoFisher Scientific | CAT# R70007 | Used in AAV production; authenticated by STR anaylsis using GenePrint10 System (Promega)(Further details will be provided by the lead contact upon request.) |
| antibody | Anti-RFP (Chiken polyclonal) | Rockland | CAT# 600-901-379 | (IF 1:1000) |
| antibody | Anti-GFAP (Mouse monoclonal) | Synaptic Systems | CAT# 173011 RRID: AB_2232308 | (IF 1:1000) |
| antibody | Anti-GFAP (Rabbit polyoclonal) | Abcam | CAT# ab48050 RRID: AB_941765 | (IF 1:500) |
| antibody | Anti-NeuN (Recombiinant rabbit monoclonal) | Abcam | CAT# ab177487 RRID: AB_2532109 | (IF 1:500) |
| antibody | Anti-GluN1 (Guinea pig polyclonal) | Alamone Labs | CAT# AGP-046 | (IF 1:100) |
| antibody | Anti-Chicken AlexaFluor-555 (Goat polyclona) | Invitrogen | CAT# A32932 | (IF 1:1000) |
| antibody | Anti-Mouse AlexaFluor 633 (Goat polyclona) | Invitrogen | CAT# A21052 RRID: AB_2535719 | (IF 1:1000) |
| antibody | Anti-Rabbit AlexaFluor 488 (Goat polyclona) | Invitrogen | CAT# A11034 | (IF 1:1000) |
| antibody | Anti-Guinea pig AlexaFluor 647 (Goat polyclonal) | Invitrogen | CAT# A21450 RRID: AB_141882 | (IF 1:200) |
| antibody | Anti-GluN1 (Mouse monoclonal) | Synaptic Systems | CAT# 114011 RRID: AB_887750 | (WB 1:1000) (IP 5 μg / 40 μl ProteinA/G resin) |
| antibody | Anti-GluN2A/B (Rabbit polyclonal) | Synaptic Systems | CAT# 244003 RRID: AB_10804284 | (WB 1:1000) (IP 5 μg / 40 μl ProteinA/G resin) |
| antibody | Anti-GluN2C (Rabbit polyclonal) | Frontier Institute Co. | CAT# GLURE3C-RB-AF270 RRID: AB_2571763 | (WB 1:200) (IP 5 μg / 40 μl ProteinA/G resin) |
| antibody | Anti-Cre, clone 2D8 (Mouse monoclonal) | Merck Millipore | mouse anti-Cre (Merck Millipore clone 2D8) | (IP 5 μg / 40 μl ProteinA/G resin) |
| Biological sample (AAV) | AAV9.2 GFAP104-nls-mCherry-Cre | This paper | NA | Further information will be provided by the Lead Contact upon request. |
| Biological sample (AAV) | AAV9.2-GFAP104-nls-mCherry | This paper | NA | Further information will be provided by the Lead Contact upon request. |
| Biological sample (AAV) | AAVDJ8-GFAP104-nls-mCherry-Cre | Goda Lab | NA | (Letellier et al., PNAS 2016) |
| Biological sample (AAV) | AAVDJ8-GFAP104-eGFP | Goda Lab | NA | (Letellier et al., PNAS 2016) |
| sequence-based reagent | Grin1 fw | This paper | PCR primers | GACCGCTTCAGTCCCTTTGG |
| sequence-based reagent | Grin1 rv | This paper | PCR primers | CACCTTCCCCAATGCCAGAG |
| sequence-based reagent | Grin2a fw | This paper | PCR primers | AGACCCCGCTACACACTCTG |
| sequence-based reagent | Grin2a rv | This paper | PCR primers | TTGCCCACCTTTTCCCATTCC |
| sequence-based reagent | Grin2b fw | This paper | PCR primers | GGCATGATTGGTGAGGTGGTC |
| sequence-based reagent | Grin2b rv | This paper | PCR primers | GGCTCTAAGAAGGCAGAAGGTG |
| sequence-based reagent | Grin2c fw | This paper | PCR primers | GGAGGCTTTCTACAGGCATCTG |
| sequence-based reagent | Grin2c rv | This paper | PCR primers | ATACTTCATGTACAGGACCCCATG |
| sequence-based reagent | Grin2d fw | This paper | PCR primers | TCAGCGACCGGAAGTTCCAG |
| sequence-based reagent | Grin2d rv | This paper | PCR primers | TCCCTGCCTTGAGCTGAGTG |
| sequence-based reagent | Rn28s1 fw | This paper | PCR primers | CCTACCTACTATCCAGCGAAACC |
| sequence-based reagent | Rn28s1 rv | This paper | PCR primers | AGCTCAACAGGGTCTTCTTTCC |
| commercial assay or kit | Single Cell-to-CT qRT-PCR Kit | Invitrogen | CAT# 4458236 | |
| commercial assay or kit | BCA Protein Assay Kit | ThermoFisher Scientific | CAT# 23,227 | |
| commercial assay or kit | TaqMan Universal PCR Master Mix | Roche Applied Biosystems | CAT# 4304437 | |
| chemical compound, drug | AlexaFluor 488 | ThermoFisher Scientific | CAT# A10436 | |
| chemical compound, drug | AlexaFluor 594 | ThermoFisher Scientific | CAT# A10438 | |
| chemical compound, drug | NMDA | Tocris Bioscience | CAT# 0114 | |
| chemical compound, drug | (+)-MK 801 maleate | Tocris Bioscience | CAT# 0924 | |
| chemical compound, drug | D-AP5 | Tocris Bioscience | CAT# 0106 | |
| chemical compound, drug | QNZ46 | Tocris Bioscience | CAT# 4,810 | |
| chemical compound, drug | R025-6981 | Tocris Bioscience | CAT# 1,594 | |
| chemical compound, drug | MPEP | Tocris Bioscience | CAT# 1,212 | |
| chemical compound, drug | Picrotoxin | Sigma Aldrich | CAT# P1675 | |
| software, algorithm | Metamorph | Molecular Devices | RRID: SCR_002368 | |
| software, algorithm | pClamp | Molecular Devices | RRID: SCR_011323 | |
| software, algorithm | ImageJ | NIH | https://imagej.nih.gov/ij/ | |
| software, algorithm | OpenView | Ziv Lab (Technion) | NA | Kindly provided by Noam Ziv for use in the analysis of FM data (Kaufman et al., PLoSOne 7:e40980, 2012) |
| other | DAPI stain | Sigma Aldrich | D9564 | (1 µg/mL) |
| other | FM1-43 Dye | Invitrogen | CAT# T35356 | (10 µM) |
| other | ADVASEP-7- | Sigma Aldrich | CAT# A3723 | (1 mM) |
| other | TRIzol Reagent | Sigma Aldrich | CAT# T9424 | |
| other | cOmplete protease inhibitors | Merck (Roche Diagnostics GmbH) | CAT# 11873580001 | |
| other | EMCCD camera | Andor Technology | iXon | |
| other | Inverted Fluorescence microscope | Olympus | IX71 | |
| other | Upright Fluorescence microscope | Olympus | IX51WI | |
| other | Confocal Laser Scanning Microscope | Olympus | FV3000 |
Additional files
Download links
A two-part list of links to download the article, or parts of the article, in various formats.
Downloads (link to download the article as PDF)
Open citations (links to open the citations from this article in various online reference manager services)
Cite this article (links to download the citations from this article in formats compatible with various reference manager tools)
Astrocyte GluN2C NMDA receptors control basal synaptic strengths of hippocampal CA1 pyramidal neurons in the stratum radiatum
eLife 10:e70818.
https://doi.org/10.7554/eLife.70818


