Seizures, behavioral deficits, and adverse drug responses in two new genetic mouse models of HCN1 epileptic encephalopathy
- German Center for Neurodegenerative Diseases (DZNE), Germany
- University of Cologne, Institute for Molecular and Behavioral Neuroscience, Germany
- University of Cologne, Center for Molecular Medicine Cologne, Germany
- Department of Neuroscience, Mortimer B. Zuckerman Mind Brain Behavior Institute, Columbia University, United States
- Department of Biosciences, University of Milan, Italy
- In vivo Research Facility, Faculty of Medicine and University Hospital Cologne, University of Cologne, Germany
Figures
Figure 1 with 1 supplement
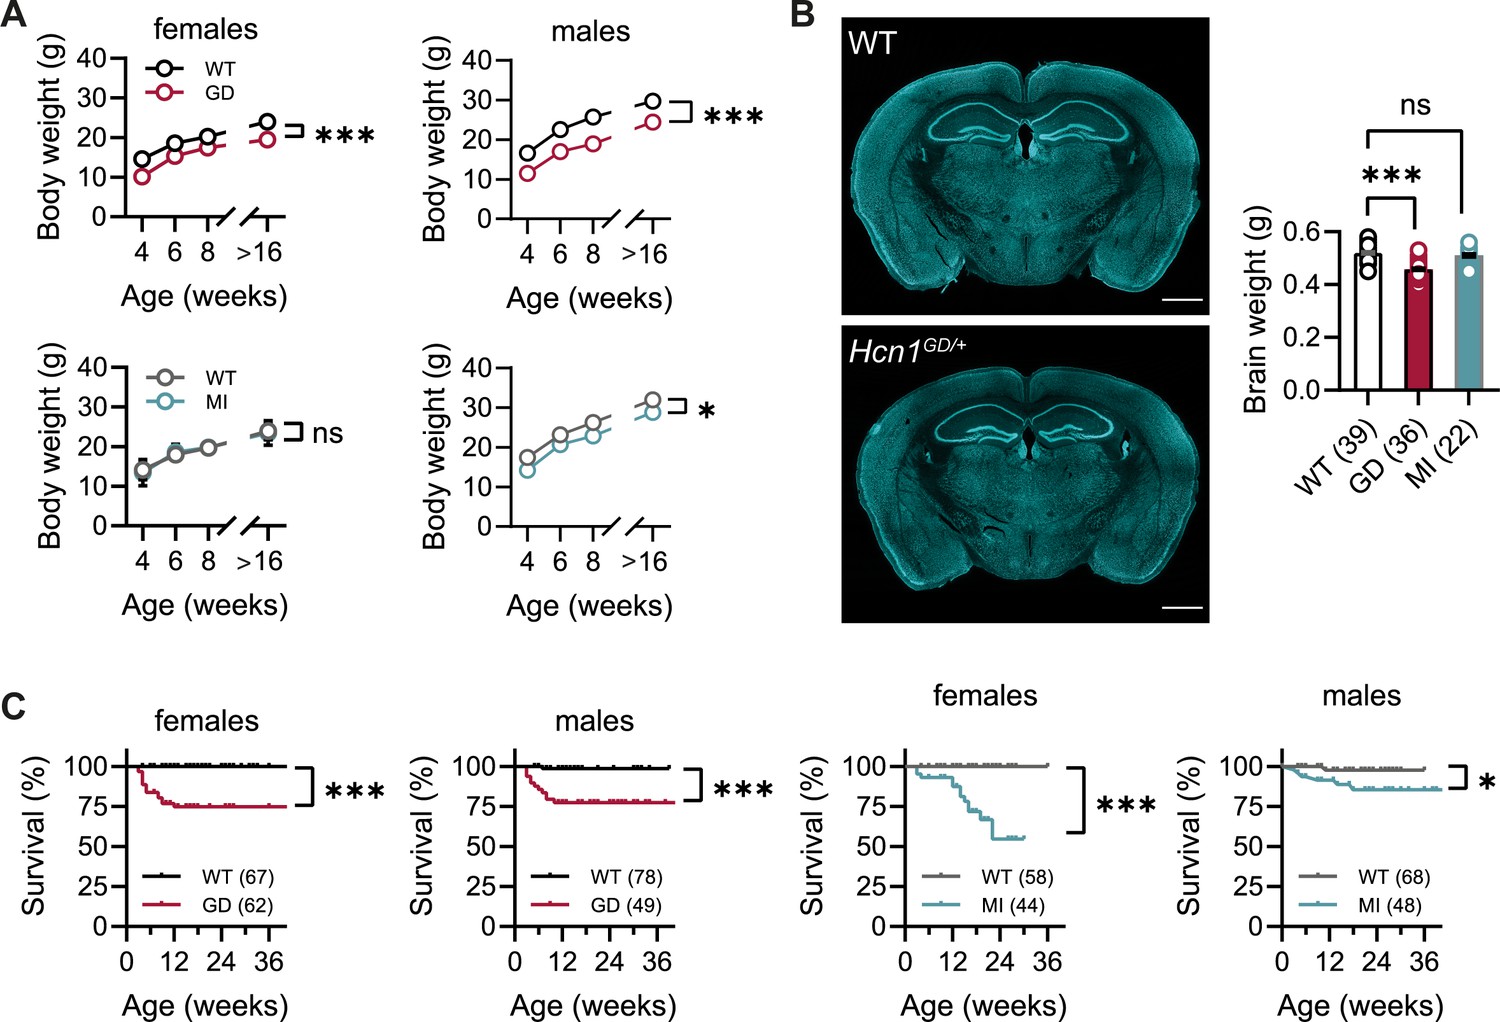
Body weight, survival, and general brain morphology in Hcn1GD/+ and Hcn1MI/+ mice.
(A) Reduced body weight post-weaning and through adult life in Hcn1GD/+ (GD) mice of both sexes, as well as in Hcn1MI/+ (MI) males (ns = not significant, *p<0.05, ***p<0.001; effect of genotype, mixed-effects model having age × genotype as grouping factors, GD: WT females n = 11–29, Hcn1GD/+ females n = 9–23, WT males n = 10–38, Hcn1GD/+ males n = 9–31; MI: WT females n = 11–28, Hcn1MI/+ females n = 5–17, WT males n = 5–16, Hcn1MI/+ males n = 9–20). (B) Brain weight in WT, Hcn1GD/+, and Hcn1MI/+ mice. Fluorescent Nissl stain of mid-coronal brain sections from WT and Hcn1GD/+ mice shown on the left (scale bar = 1200 μm). Brain weight shown on the right (WT 0.52 ± 0.01 g; Hcn1GD/+ 0.46 ± 0.01 g; Hcn1MI/+ 0.51 ± 0.01 g, ns = not significant; ***p<0.001, after one-way ANOVA and post hoc Holm–Šídák’s multiple-comparisons test). Brain weights were measured on PFA-fixed tissue, after removal of both olfactory bulbs. (C) Kaplan–Meier survival curves show increased mortality in both Hcn1GD/+ and Hcn1MI/+ mice, with a marked sex difference in the case of Hcn1MI/+ animals. Each dot represents a death event in the colony, scored as 0 if resulting from experimental use and 1 if due to sudden or unprovoked death (survival at 30 weeks, i.e., the last time point where data for all groups were available: Hcn1GD/+ females = 75%, Hcn1GD/+ males = 78%, Hcn1MI/+ females = 55%, Hcn1MI/+ males = 86%, *p<0.05, ***p<0.001 after log-rank Mantel–Cox test). Data in (A) and (B) represent mean ± SEM (note that in A smaller error bars may be obscured by the circles representing mean values). Number of animals tested in (B) and (C) is indicated in parentheses (n).
Figure 1—figure supplement 1

Cerebellum and brainstem area in Hcn1GD/+ mice.
Fluorescent Nissl stain of hindbrain sections from WT and Hcn1GD/+ (GD) mice is shown on the left (Bregma –6.12 mm, scale bar = 1200 μm). Brain area measurements comparing cerebellum (CB) and brainstem (BS) shown on the right (CB: WT 20.84 ± 0.23 mm2, Hcn1GD/+ 18.11 ± 0.19 mm2; BS: WT 12.18 ± 0.06 mm2, Hcn1GD/+ 10.87 ± 0.11 mm2). CB area was more affected than BS area (two-way repeated-measures ANOVA, brain region × genotype interaction F(1, 9) = 49.56, ***p<0.0001), with mutant CB 13.1% smaller and mutant BS 10.8% smaller, compared to WT. Measured areas are indicated by dotted lines (for CB measurements, flocculus and paraflocculus were excluded on both sides; for BS, dorsal and ventral cochlear nuclei were excluded). Data represent mean ± SEM.
Figure 2 with 7 supplements
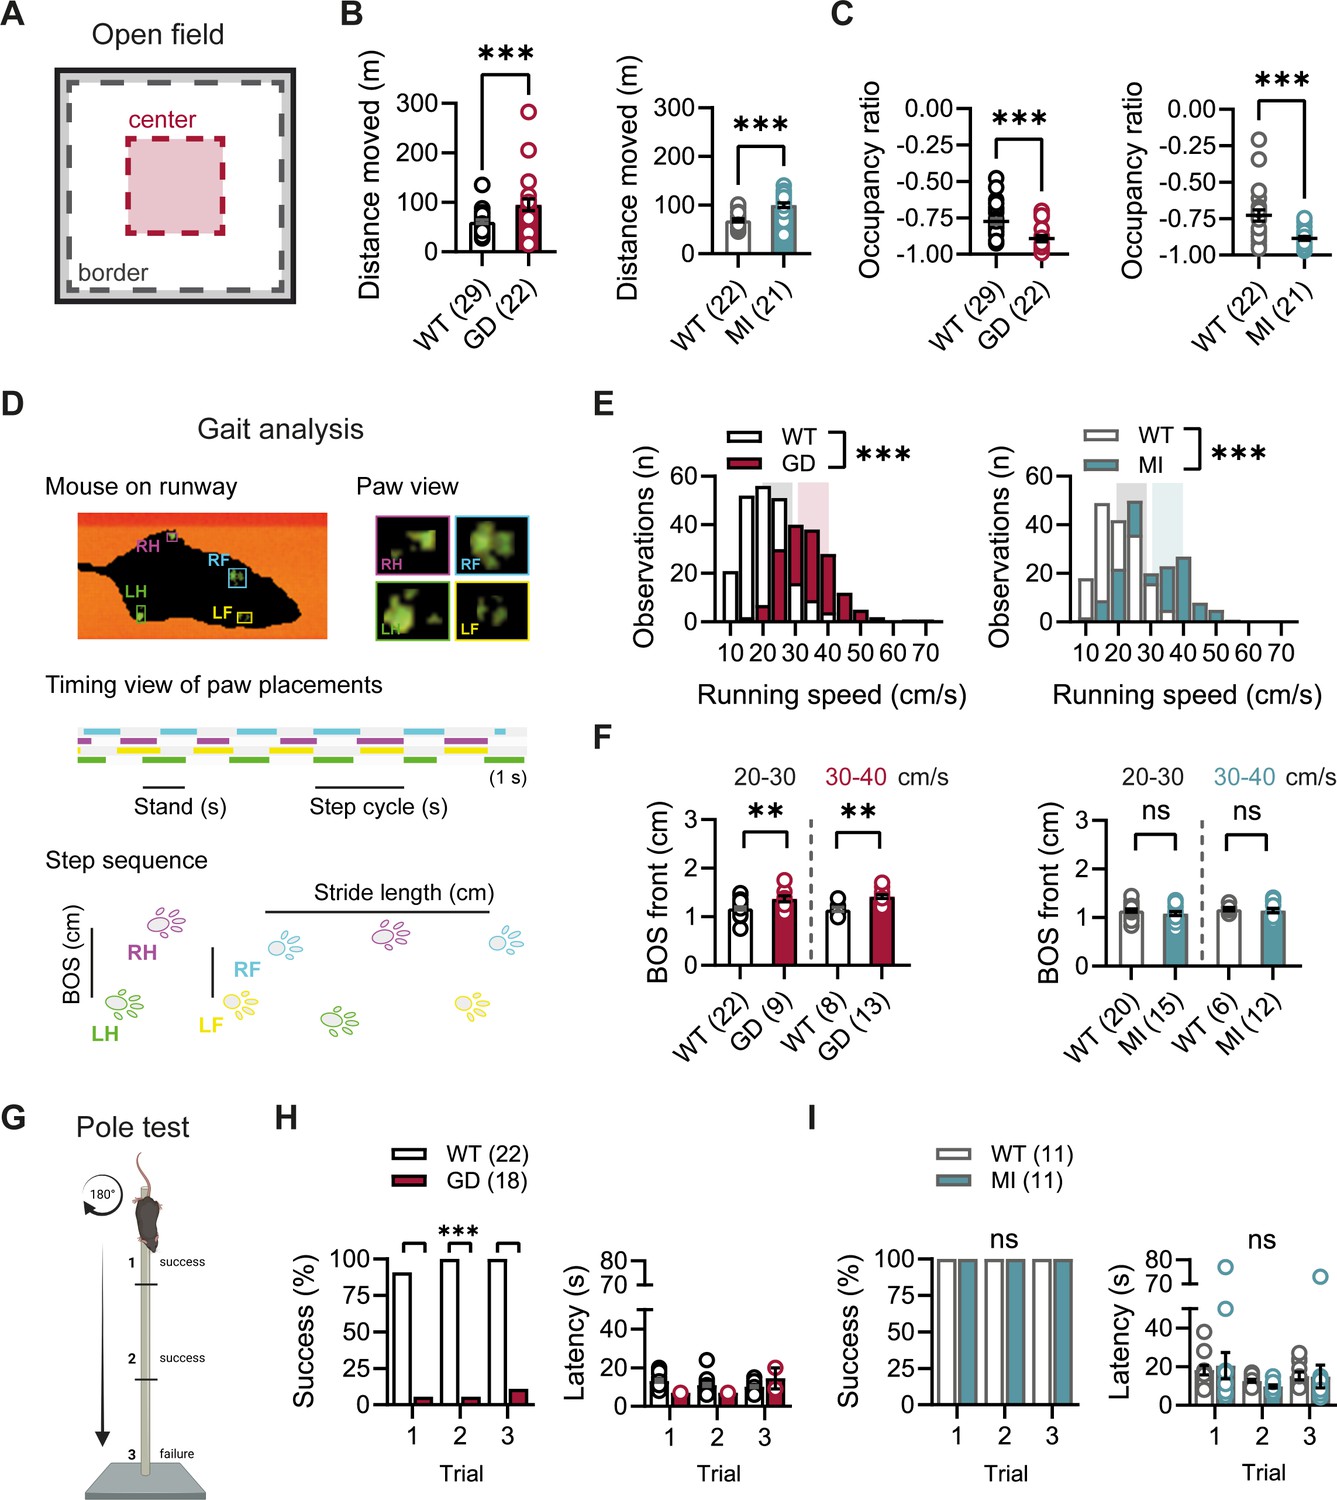
Baseline exploratory behavior, gait, and motor function analysis in Hcn1GD/+ and Hcn1MI/+ mice.
(A) Schematic representation of the open-field arena, with dashed lines depicting the imaginary border (gray) and center zones (red). Occupation ratio calculated as (Center – Border)/(Center + Border), with values <0 representing a preference for the border over the center zone. Mean distance moved was significantly increased (B) and mean occupation ratio decreased (C) in both Hcn1GD/+ (GD) and Hcn1MI/+ (MI) mice compared to WT littermates (**p<0.01; ***p<0.001, Mann–Whitney U test). (D) Representation of the Catwalk gait analysis system, depicting the mouse on the runway (top left), the paw print view (top right), and below the timing view of consecutive paw placements and step sequence, with the base of support (BOS) representing the distance between the hind and the front paws, respectively. (E) Distribution of running speeds of Hcn1GD/+ or Hcn1MI/+ mice compared to WT littermates (***p<0.001, Mann–Whitney U test). Multiple runs were performed for each animal (GD: WT n = 30 mice, n = 211 runs, mean number of runs per animal = 6.1 ± 0.4; Hcn1GD/+ n = 21 mice, n = 166 runs, mean number of runs per animal = 7.7 ± 0.4. MI: WT n = 22 mice, n = 166 runs, mean number of runs per animal = 7.6 ± 0.2; Hcn1MI/+ n = 21 mice, n = 167 runs, mean number of runs per animal = 8.0 ± 0.1). Shaded areas highlight speed range of 20–30 cm/s (gray) and 30–40 cm/s (color). (F) BOS of front paws was significantly increased in Hcn1GD/+ at both speed ranges, but not in Hcn1MI/+ mice (**p<0.01, ns = not significant, Student’s t-test). Only runs in the selected speed range were counted and BOS values averaged per animal. Data shown in (F) represent mean ± SEM for indicated number of animals. (G) Representation of the pole test apparatus (Created with BioRender.com) (H) Hcn1GD/+mice were severely impaired in motor coordination abilities compared to WT littermates (left; ***p<0.001, Fisher’s exact probability test). Latencies to climb down are shown on the right, but due to low numbers of successful Hcn1GD/+ animals we did not perform statistical analysis. (I) All Hcn1MI/+ mice tested performed successfully in each trial (left; ns = not significant, Fisher’s exact probability test) with latencies similar to their WT littermates (right; ns = not significant, two-way repeated-measures ANOVA with group × trial). Data in (B), (C), (F), (H, right), and (I, right) represent mean ± SEM (see Figure 2—source data 1, Figure 2—source data 2, Figure 2—source data 3 for numerical values).
-
Figure 2—source data 1
Open-field parameters for Hcn1GD/+ and Hcn1MI/+ heterozygous mice in comparison to WT littermates.
Number of animals is indicated in parentheses. Times in border and center zones, respectively, are expressed as percentage of total trial duration. *Data was analyzed with a Mann–Whitney U test; #data was analyzed with a Student’s t-test. Data represent mean ± SEM.
- https://cdn.elifesciences.org/articles/70826/elife-70826-fig2-data1-v2.docx
-
Figure 2—source data 2
Catwalk gait analysis parameters for Hcn1GD/+ and Hcn1MI/+ heterozygous mice in comparison to WT littermates.
Parameters listed correspond to the right front paw. Number of animals is shown in parentheses. *Data was analyzed with a Mann–Whitney U test; #data was analyzed with a Student’s t-test. Data represent mean ± SEM.
- https://cdn.elifesciences.org/articles/70826/elife-70826-fig2-data2-v2.docx
-
Figure 2—source data 3
Vertical pole test parameters for Hcn1GD/+ and Hcn1MI/+ heterozygous mice in comparison to WT littermates.
Number of animals is indicated in parentheses. Latency data represent mean ± SEM.
- https://cdn.elifesciences.org/articles/70826/elife-70826-fig2-data3-v2.docx
Figure 2—figure supplement 1
Open-field behavior of Hcn1GD/+ and Hcn1MI/+ mice.
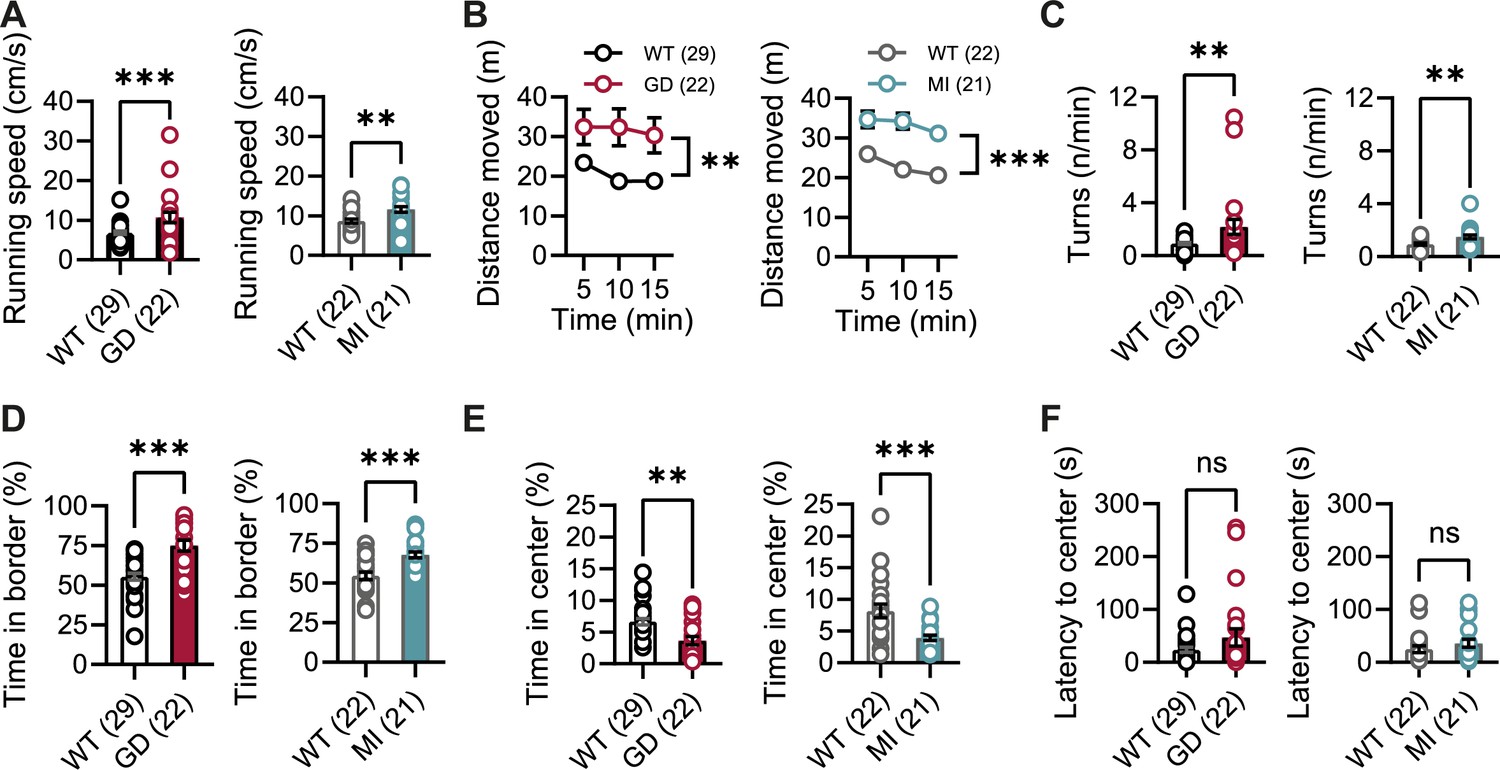
Comparison of open-field behavior between Hcn1GD/+ (GD) or Hcn1MI/+ (MI) mice and their respective WT littermates. (A) Mean running speed and (B) mean distance moved over time during 15 min in the open field (**p<0.01, ***p<0.001, effect of genotype, two-way repeated-measures ANOVA having genotype and time as grouping factors). (C) Mean number of body rotations (turns/min). (D) Mean time spent in border and (E) center zones (% total trial duration). (F) Latency to enter the center zone (ns = not significant, **p<0.01, ***p<0.001; see Figure 2—source data 1 for numerical values and statistical test used for each comparison). Data represent mean ± SEM (note that in B smaller error bars may be obscured by the circles representing mean values).
Figure 2—figure supplement 2
Gait analysis in Hcn1GD/+ mice.
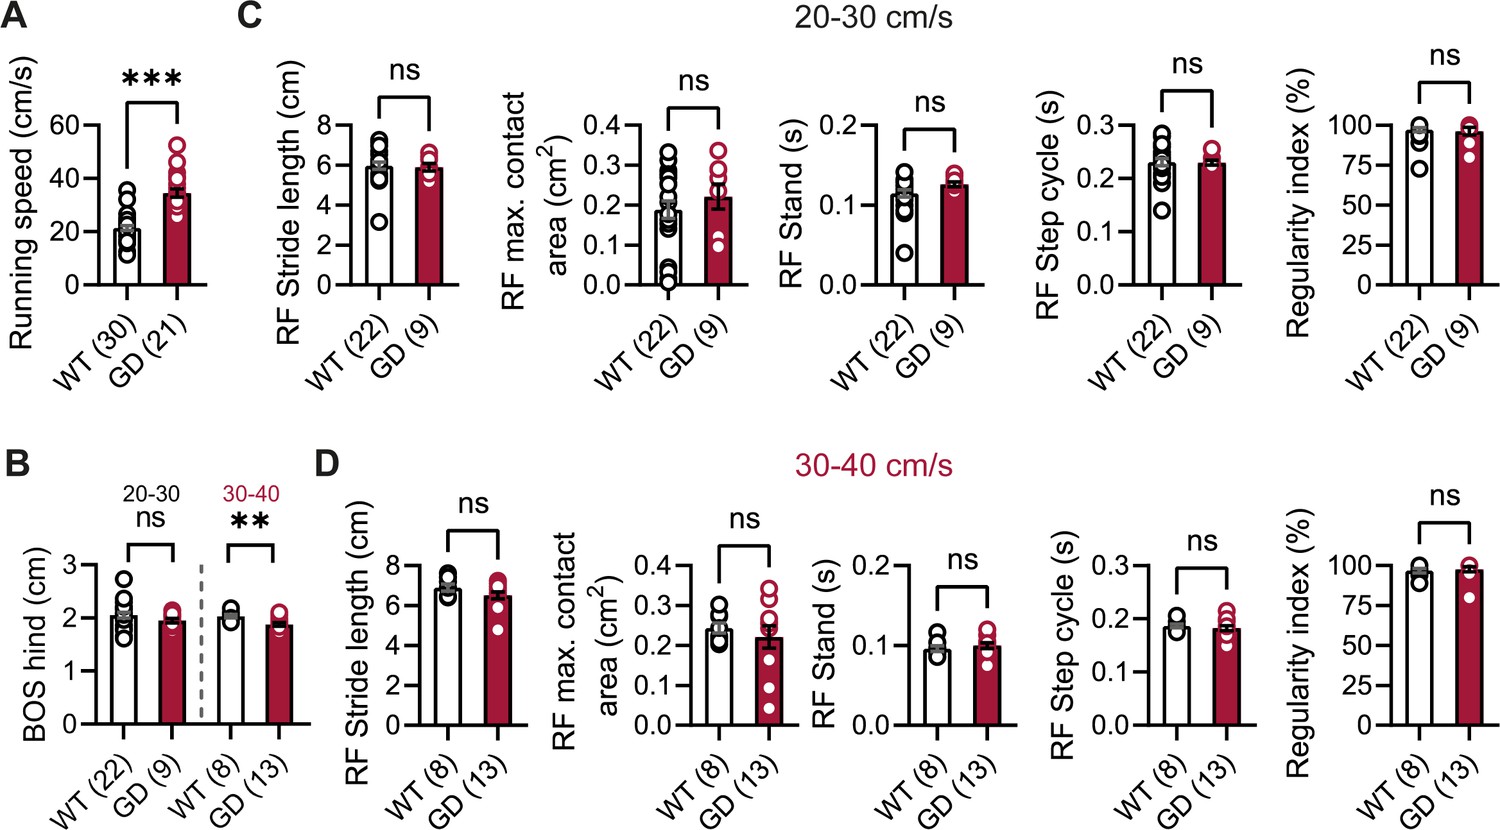
(A) Mean running speed of all runs was increased in Hcn1GD/+ (GD) mice compared to WT littermates. (B) Base of support (BOS) of the hind paws was decreased at the higher speed range in Hcn1GD/+ mice. Gait analysis parameters of the right front (RF) paw for speed ranges of (C) 20–30 cm/s and (D) 30–40 cm/s, including, from left to right, stride length, maximum (max.) contact area, stand, step cycle, and regularity index, were not changed in Hcn1GD/+ mice. The same results were obtained for the other three paws (data not shown) (ns = not significant, **p<0.01, ***p<0.001; see Figure 2—source data 2 for numerical values and statistical test used for each comparison). Data represent mean ± SEM.
Figure 2—figure supplement 3
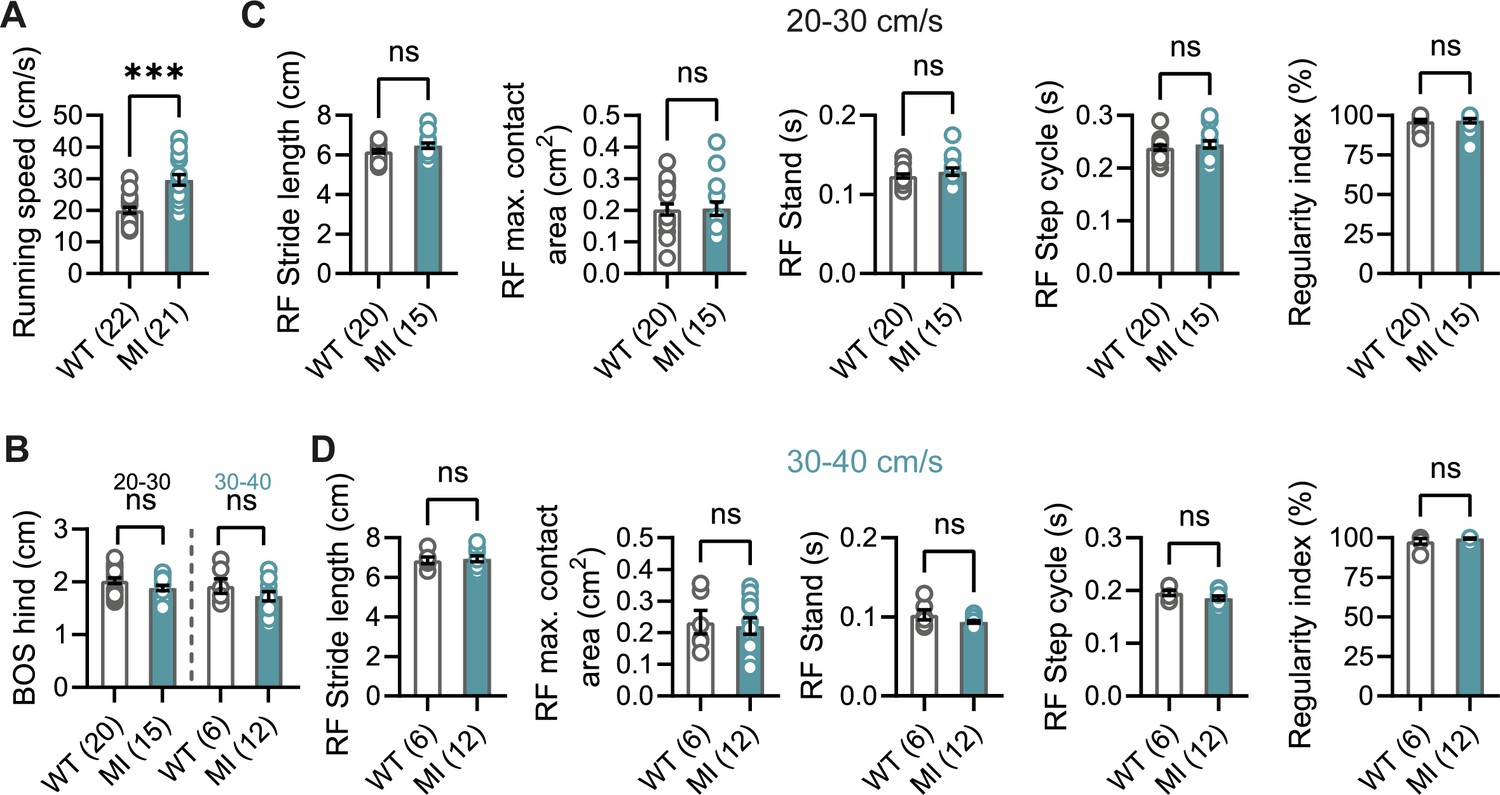
Gait analysis in Hcn1MI/+ mice.
(A) Mean running speed of all runs was increased in Hcn1MI/+ (MI) mice compared to WT littermates. (B) Base of support (BOS) of the hind paws was unchanged. Gait analysis parameters of the right front (RF) paw for speed ranges of (C) 20–30 cm/s and (D) 30–40 cm/s, including, from left to right, stride length, maximum (max.) contact area, stand, step cycle, and regularity index. Despite significantly increased running speeds in Hcn1MI/+ mice, other gait parameters were not changed. The same results were obtained for the other three paws (data not shown) (ns = not significant, ***p<0.001; see Figure 2—source data 2 for numerical values and statistical test used for each comparison). Data represent mean ± SEM.
Figure 2—video 1
Pole test recording of a Hcn1GD/+ heterozygous male falling off the pole.
The animal can be seen falling off at level 1 while trying to perform a body rotation.
Figure 2—video 2
Pole test recording of a Hcn1GD/+ heterozygous male sliding down the pole.
Although initially the animal performed a successful body rotation at level 1 of the pole, it could not maintain the posture and kept sliding down instead of using all four paws to climb down.
Figure 2—video 3
Pole test recording of a Hcn1MI/+ heterozygous female.
The animal performed a full 180° body rotation at level 1 of the vertical pole, then climbed down the pole with all four paws, successfully completing the trial.
Figure 2—video 4
Pole test recording of a WT female.
The animal can be seen successfully performing a full 180° body rotation at level 1 of the vertical pole, then climbing down the pole with all four paws.
Figure 3
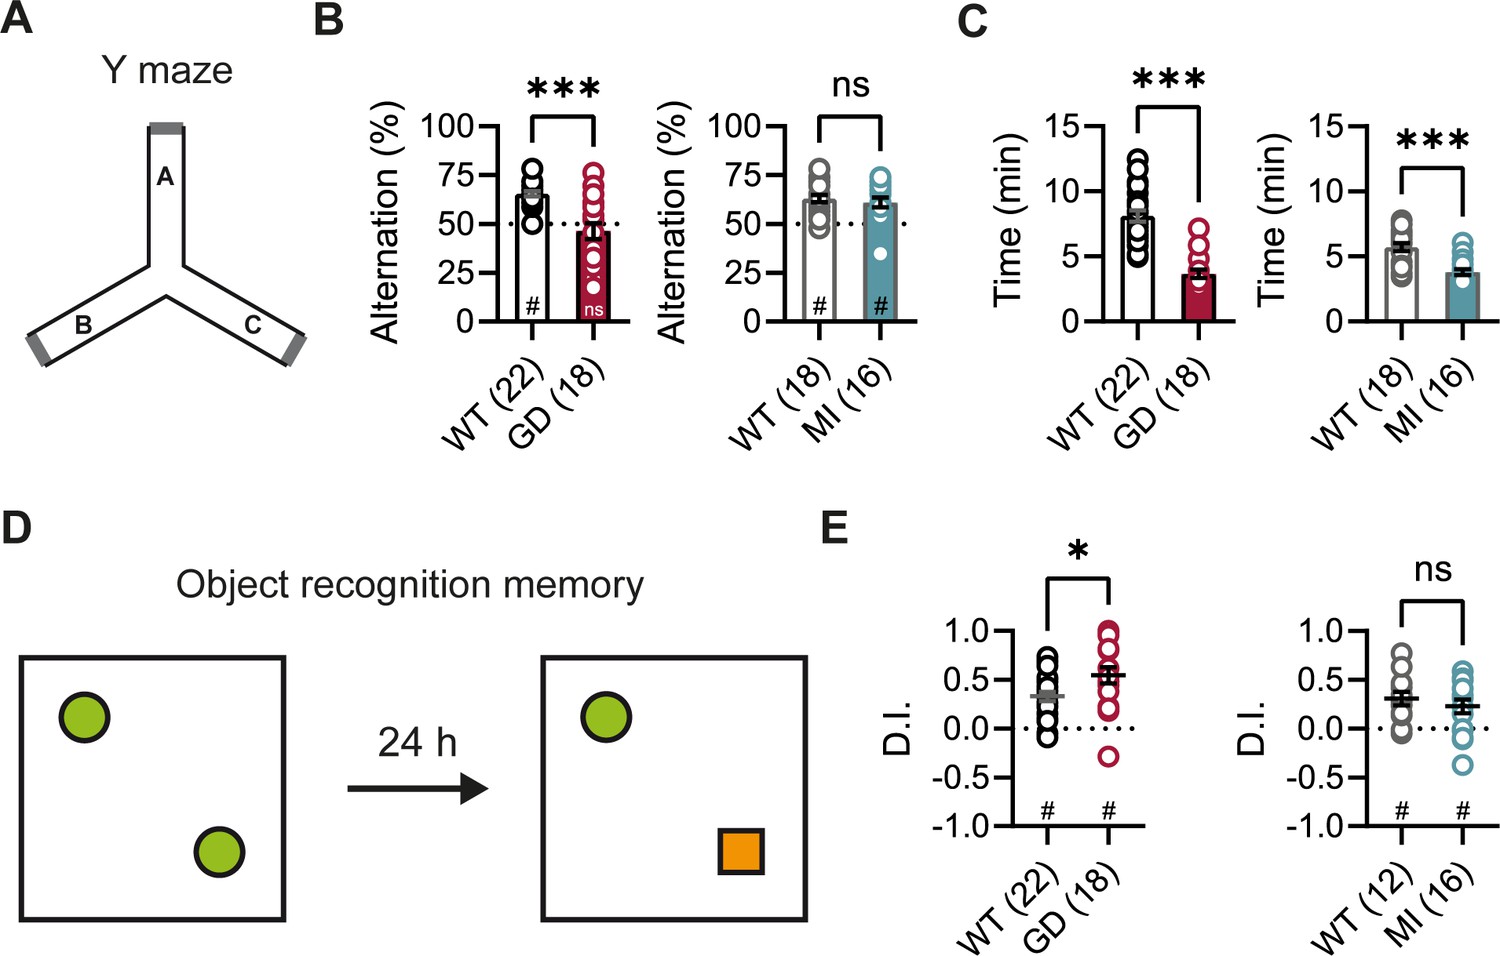
Spontaneous alternation and object recognition memory in Hcn1GD/+ and Hcn1MI/+ mice.
(A) Spontaneous alternation test with schematic representation of the Y maze consisting of three equal arms (A–C). (B) Alternation rates were significantly decreased in Hcn1GD/+ mice (GD, left), but not in Hcn1MI/+ mice (MI, right) when compared to their respective WT littermates (***p<0.001, Mann–Whitney U test; #p<0.05, one-sample Wilcoxon test to chance level of 50%; ns = not significant). (C) Time needed to complete 24 transitions was significantly reduced in both Hcn1GD/+ and Hcn1MI/+ mice compared to WT (***p<0.001, Mann–Whitney U test). (D) Object recognition memory after 24 hr was tested by replacing one familiar object (green circle) with a novel object (orange square). (E) Both Hcn1GD/+ and Hcn1MI/+ mice showed a preference for the novel object with mean discrimination indices (D.I.) being significantly positive (#p<0.05, one-sample Wilcoxon test to chance level of 0). Mean D.I. was also higher in Hcn1GD/+mice compared to WT littermates (*p<0.05, ns = not significant, Mann–Whitney U test). Data represent mean ± SEM (see Figure 3—source data 1, Figure 3—source data 2 for numerical values).
-
Figure 3—source data 1
Spontaneous alternation in the Y maze.
Alternation rates and time to complete 24 transitions are expressed as the mean of 2 days. Number of animals is indicated in parentheses. *Data was analyzed using a Mann–Whitney U test. Data represent mean ± SEM.
- https://cdn.elifesciences.org/articles/70826/elife-70826-fig3-data1-v2.docx
-
Figure 3—source data 2
Object recognition memory test.
Number of animals is indicated in parentheses. *Data was analyzed using a Mann–Whitney U test. Data represent mean ± SEM.
- https://cdn.elifesciences.org/articles/70826/elife-70826-fig3-data2-v2.docx
Figure 4 with 3 supplements
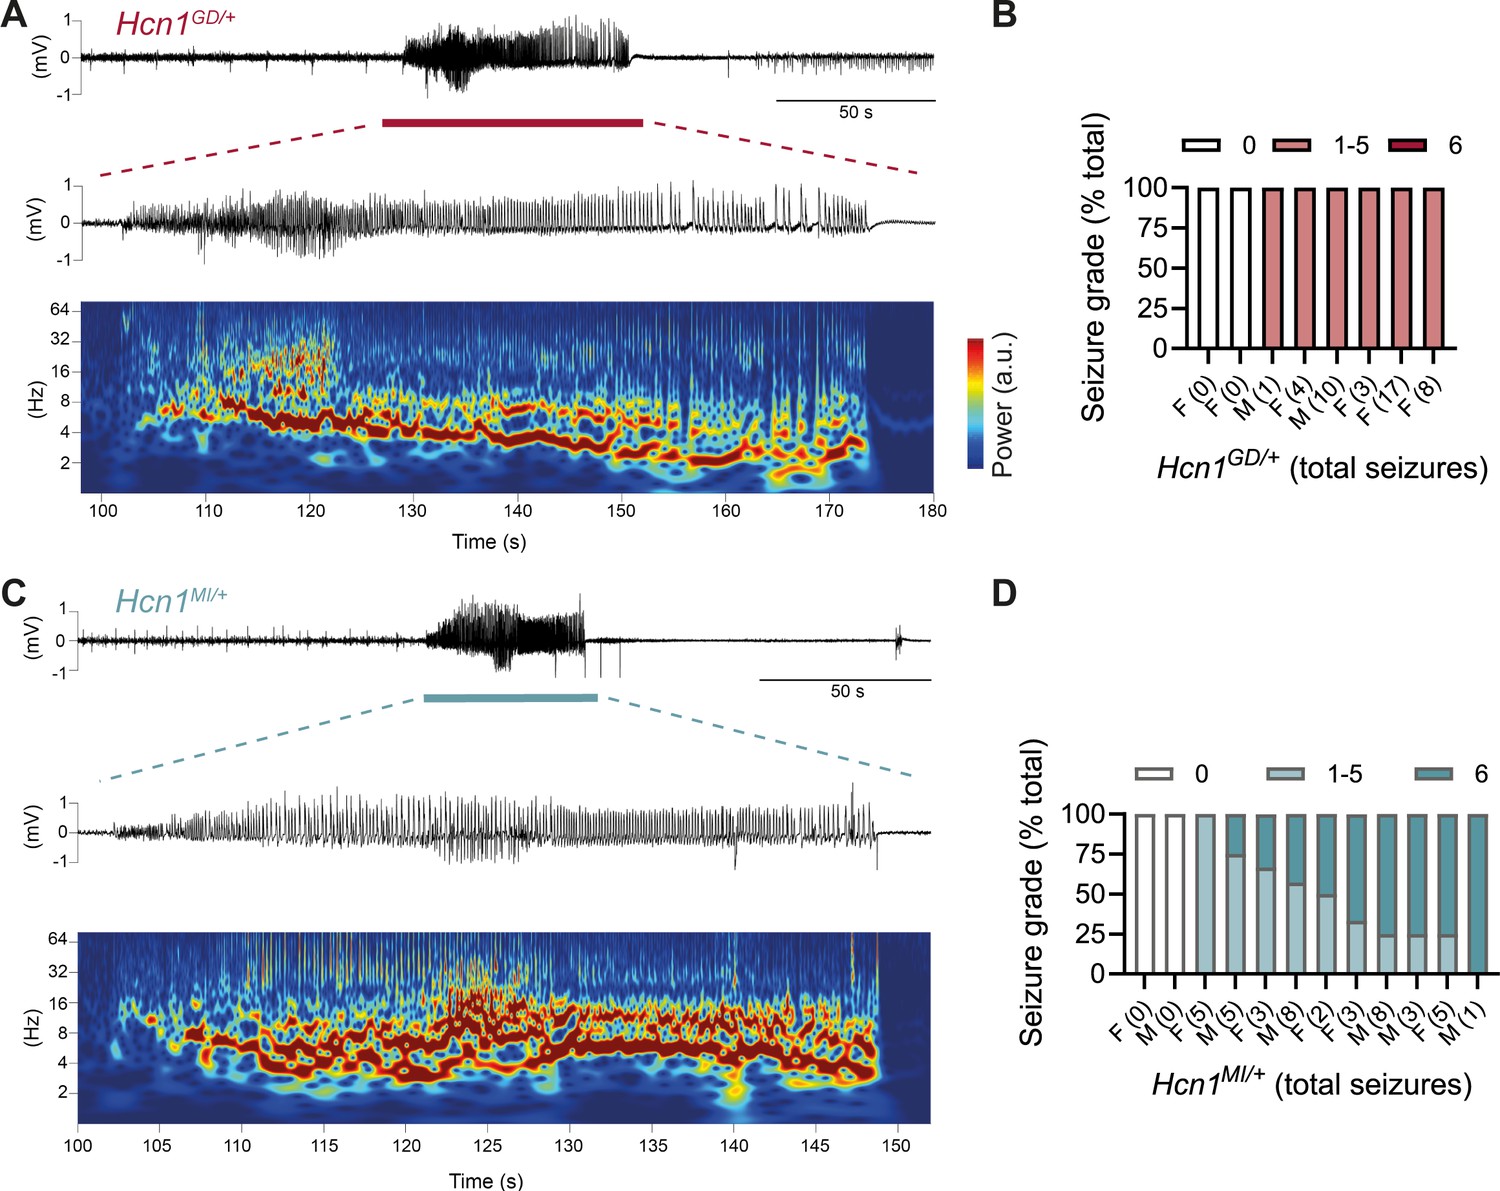
Spontaneous convulsive seizures in Hcn1GD/+ and Hcn1MI/+ mice.
(A) Example of a spontaneous seizure recorded in an Hcn1GD/+ mouse. Upper trace shows electrocorticogram (ECoG) signal of a behaviorally noted grade 4 seizure (red bar), with expanded trace and corresponding time–frequency spectrogram shown below. (B) Highest seizure grade reached (plotted as percentage of total seizure number) for all individual Hcn1GD/+ mice examined, with total number of seizure events observed during the recording period shown in parentheses. 2/8 animals did not exhibit spontaneous seizures during the recording period of 19 ± 3 days. Mean seizure frequency for Hcn1GD/+ animals was 0.33 ± 0.08 /day. (C) Same as in (A) showing a grade 6 seizure in an Hcn1MI/+ mouse. (D) Highest seizure grade reached and total seizure event number shown for all individual Hcn1MI/+ mice. 2/12 animals did not exhibit spontaneous seizures during the recording period of 11 ± 1 days. Of the 10 individuals with seizures, 9 animals reached a seizure grade of 6, indicating an overall higher severity of the spontaneous seizures in Hcn1MI/+ animals. Mean seizure frequency for Hcn1MI/+ animals was 0.42 ± 0.07 /day (females, 0.40 ± 0.08 /day; males, 0.45 ± 0.11 /day; p=0.7).
Figure 4—figure supplement 1
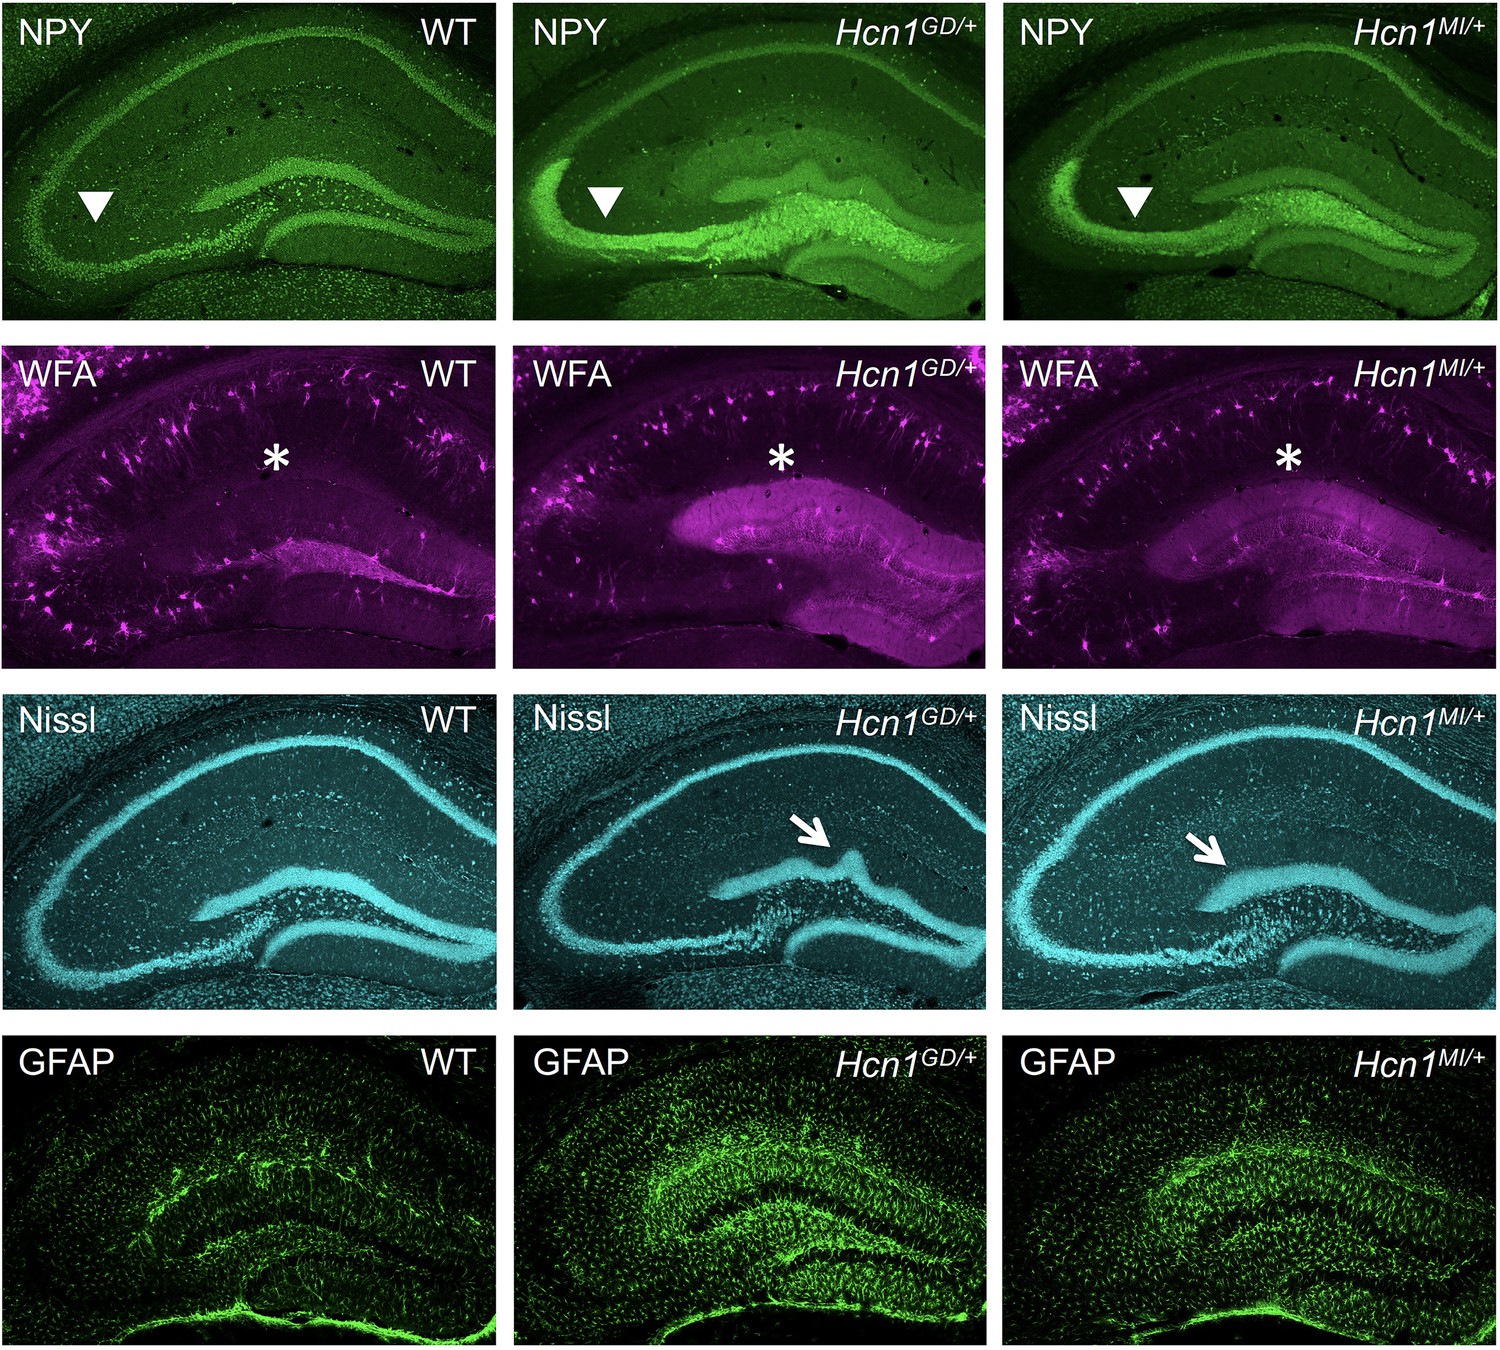
Histological markers show hippocampal changes associated with epilepsy in Hcn1GD/+ and Hcn1MI/+ mice.
Immunofluorescent staining of mid-coronal sections from adult brains in WT, Hcn1GD/+, and Hcn1MI/+ mice showing hippocampal region labeled for neuropeptide Y (NPY, first row), Wisteria floribunda agglutinin (WFA, second row), Nissl bodies (Nissl, third row), and glial fibrillary acidic protein (GFAP, bottom row). Arrowheads highlight the position of the granule cell mossy fiber tract (top row), asterisks the hippocampal fissure, located above the dentate gyrus molecular layer (second row). Note ectopic expression of NPY in mossy fiber tract, increased WFA labeling in the molecular layer of dentate gyrus, granule cell layer dispersion and upper blade gyrification (arrows in third row), and increased gliosis in mutant animals from both lines.
Figure 4—video 1
Video - electrocorticogram (ECoG) recording of a spontaneous seizure in Hcn1GD/+ heterozygous female.
The first portion of the video illustrates a period of grade 3–4 behavioral seizures, accompanied by high -amplitude oscillatory activity on the ECoG trace. Immediately following the high -amplitude ECoG activity, note the onset of post-ictal depression (start at 1:33:36 time mark on EcoG trace, approximately) as indicated by the flat ondulatory trace on ECoG and accompanying behavioral immobility.
Figure 4—video 2
Video -electrocorticogram (ECoG) recording of a spontaneous seizure in Hcn1MI/+ heterozygous male.
The first portion of the video illustrates grade 2–5 behavioral seizures, accompanied by high -amplitude oscillatory activity on the ECoG trace, similar to Hcn1GD/+ animals. This is followed by a period of irregular, low -amplitude cortical activity on the ECoG trace as seizure activity moves into lower brain areas, accompanied by grade 6 behavioral seizures (start at 12:04:31 time mark on EcoG trace, approximately). Post-ictal depression can be noted in the last few seconds of the clip.
Figure 5 with 1 supplement

HCN1 protein expression and Ih-dependent voltage sag in CA1 pyramidal neurons are reduced in Hcn1GD/+ and Hcn1MI/+ mice.
(A) Immunofluorescent labeling of HCN1 protein in hippocampus from adult WT, Hcn1GD/+, and Hcn1MI/+ animals. (B) Quantification of fluorescent signal along the somatodendritic axis of pyramidal neurons demonstrating a significant decrease in protein expression in the distal dendrites, the normal site of greatest HCN1 expression (***p<0.001, effect of genotype × distance from alveus after two-way repeated-measures ANOVA; number of slices is indicated in the graphs; number of animals used: GD WT n = 4, Hcn1GD/+ n = 4; MI WT n = 4, Hcn1MI/+ n = 7; measurements expressed in arbitrary units [au]). Rightmost panel shows a direct comparison of fluorescence intensity in Hcn1GD/+ and Hcn1MI/+ animals, measured as a fraction of the corresponding WT littermate control intensities (dashed line at 1); the reduction in HCN1 protein expression was significantly larger in Hcn1GD/+ compared to Hcn1MI/+ pyramidal neurons (***p<0.001; two-way repeated-measures ANOVA). (C) Sample traces from whole-cell current-clamp recordings in hippocampal CA1 pyramidal neurons from WT, Hcn1GD/+, and Hcn1MI/+ animals. Holding potential was –70 mV for all samples, with a series of hyperpolarizing and depolarizing current steps in 25 pA increments applied in the negative and positive direction (only depolarizing step at +200 pA is shown). (D) Voltage sag in response to hyperpolarizing current steps was significantly reduced in both mutant lines (expressed as sag ratio, see ‘Materials and methods’; GD: WT = 0.78 ± 0.01 versus Hcn1GD/+ = 0.96 ± 0.01; MI: WT = 0.79 ± 0.01 versus Hcn1MI/+ = 0.87 ± 0.01; ***p<0.001, Student’s t-test). (E) Resting membrane potential (RMP) was shifted to significantly more positive values in neurons from Hcn1GD/+ but not Hcn1MI/+ animals, compared to WT littermates (GD: WT = –69.55 ± 0.55 mV versus Hcn1GD/+ = –64.43 ± 0.71 mV; MI: WT = –67.08 ± 0.50 mV versus Hcn1MI/+ = –66.59 ± 0.51 mV, ***p<0.001, Student’s t-test; (D, E) number of cells is indicated in the bar graphs; number of animals used: GD WT n = 6, Hcn1GD/+ n = 5; MI WT n = 6, Hcn1MI/+ n = 5). Data represent mean ± SEM.
-
Figure 5—source data 1
Action potential (AP) properties of Hcn1GD/+ and Hcn1MI/+ pyramidal neurons compared to respective WT littermate controls.
Number of cells is shown in parenthesis. Number of animals used for GD: WT n = 6 mice, GD n = 5 mice; and for MI: WT n = 3 mice, MI n = 3 mice. *Data was analyzed using a Mann–Whitney U test. Data represent mean ± SEM.
- https://cdn.elifesciences.org/articles/70826/elife-70826-fig5-data1-v2.docx
Figure 5—figure supplement 1
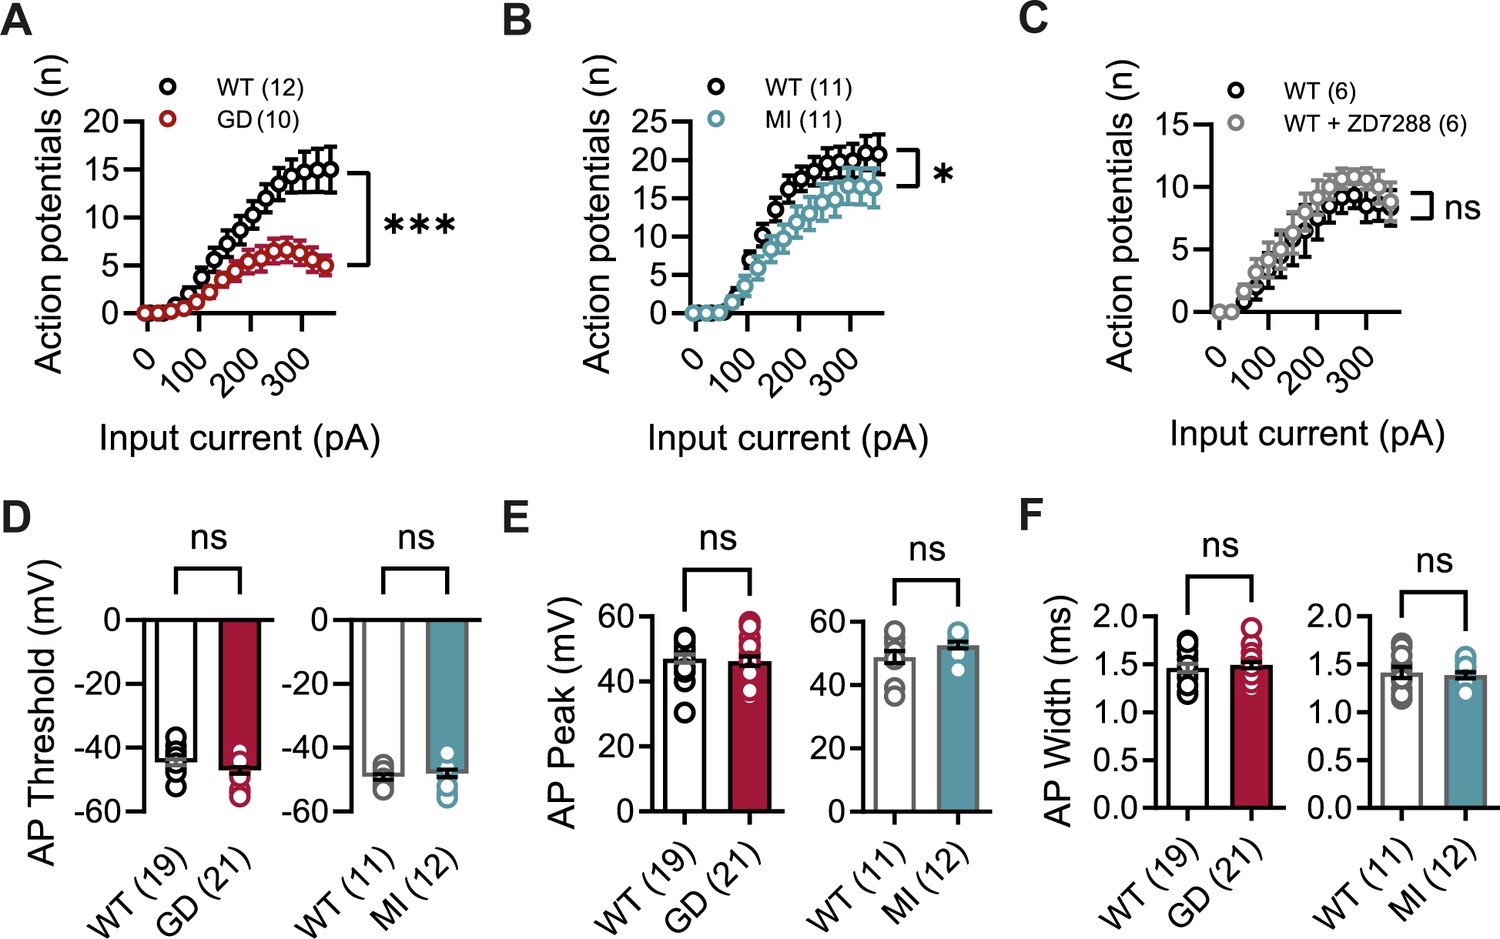
Impaired action potential (AP) firing in Hcn1GD/+ and Hcn1MI/+ neurons.
(A) Input–output curves (number of APs versus injected current) for CA1 pyramidal neurons from Hcn1GD/+ (GD) and WT littermates. (B) Same comparison for CA1 pyramidal neurons from Hcn1MI/+ (MI) and WT littermates. (C) Same comparison for CA1 pyramidal neurons from WT control mice, before and after bath application of 10 μM ZD7288. Note strong suppression of excitability in mutant lines not seen with acute blockade of HCN channels with ZD7288 (*p<0.05, ***p<0.001, effect of genotype × input current, after two-way repeated-measures ANOVA; number of cells is indicated in the graphs; number of animals used: GD WT n = 4, Hcn1GD/+ n = 5; MI WT n = 3, Hcn1MI/+ n = 3; WT ± ZD7288 n = 2). (D) AP threshold, (E) peak, and (F) width were not changed in Hcn1GD/+ or Hcn1MI mice when compared to WT littermates (ns = not significant, Mann–Whitney U test; number of cells is indicated in the bar graphs; number of animals used: GD WT n = 6, Hcn1GD/+ n = 5; MI WT n = 3, Hcn1MI/+ n = 3; see Figure 5—source data 1 for numerical values). Data represent mean ± SEM.
Figure 6 with 1 supplement
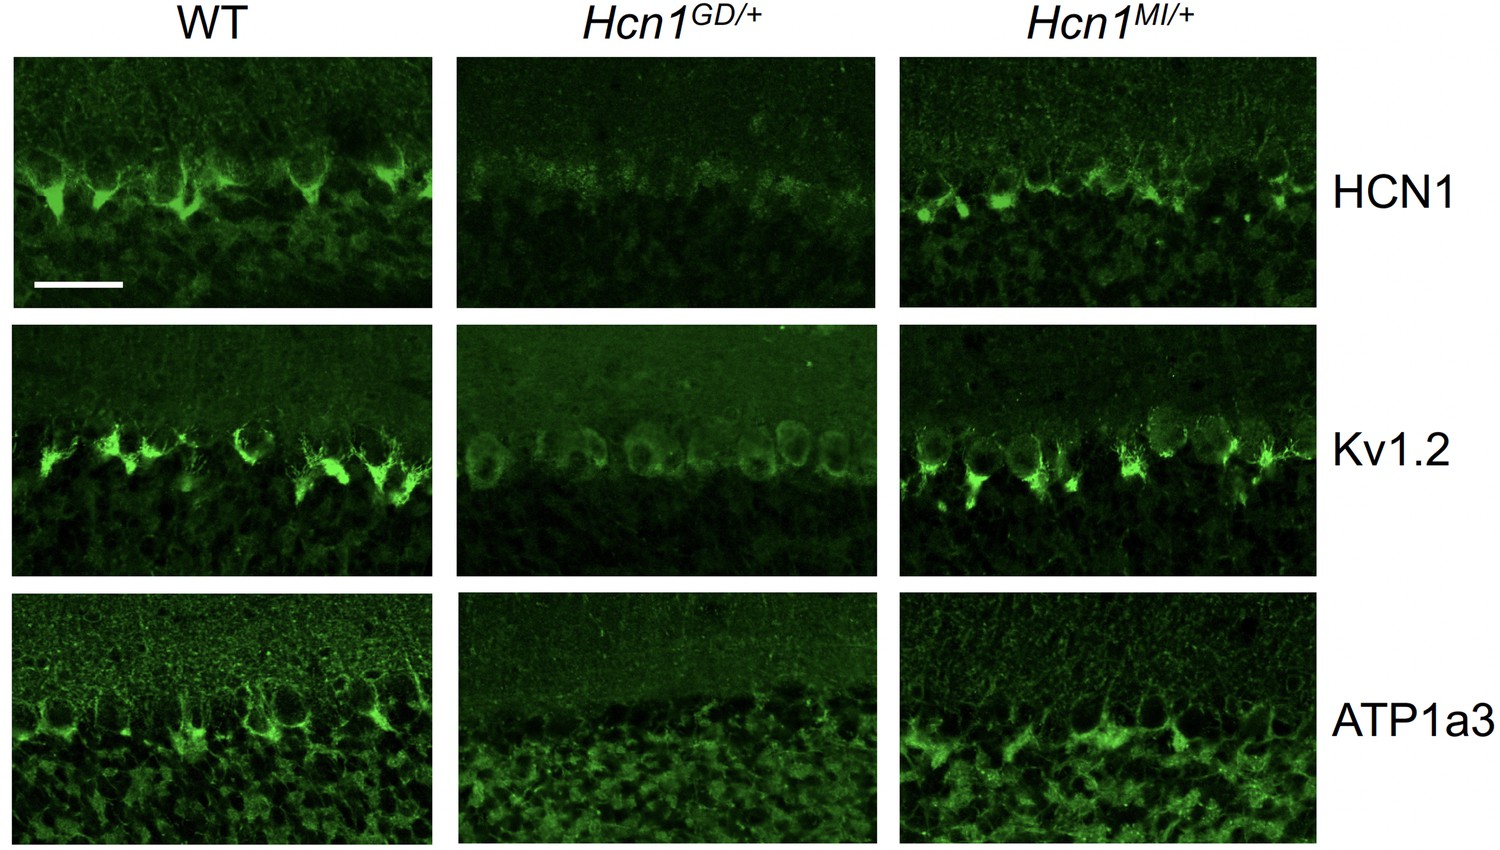
Alterations in HCN1 localization in cerebellar basket cell pinceau with accompanying loss of KV1.2 and ATP1a3 in Hcn1GD/+ but not Hcn1MI/+ mice.
Immunofluorescent labeling of coronal hindbrain sections from adult mouse brain. Detail of the cerebellar cortex of WT, Hcn1GD/+, and Hcn1MI/+ mice is shown, displaying the Purkinje cell layer. Top row: HCN1 protein labeling; middle row: KV1.2 protein labeling; bottom row: Na+/K+ pump labeling (protein isoform ATP1a3). The parvalbumin-positive (PV+) interneuron (basket cell) terminal pinceau surrounding the Purkinje cell axon initial segment is labeled by HCN1, ATP1a3, and Kv1.2 antibodies in WT and Hcn1MI/+, while no labeling is present in Hcn1GD/+ brains. Scale bar = 50 μm in all panels.
Figure 6—figure supplement 1
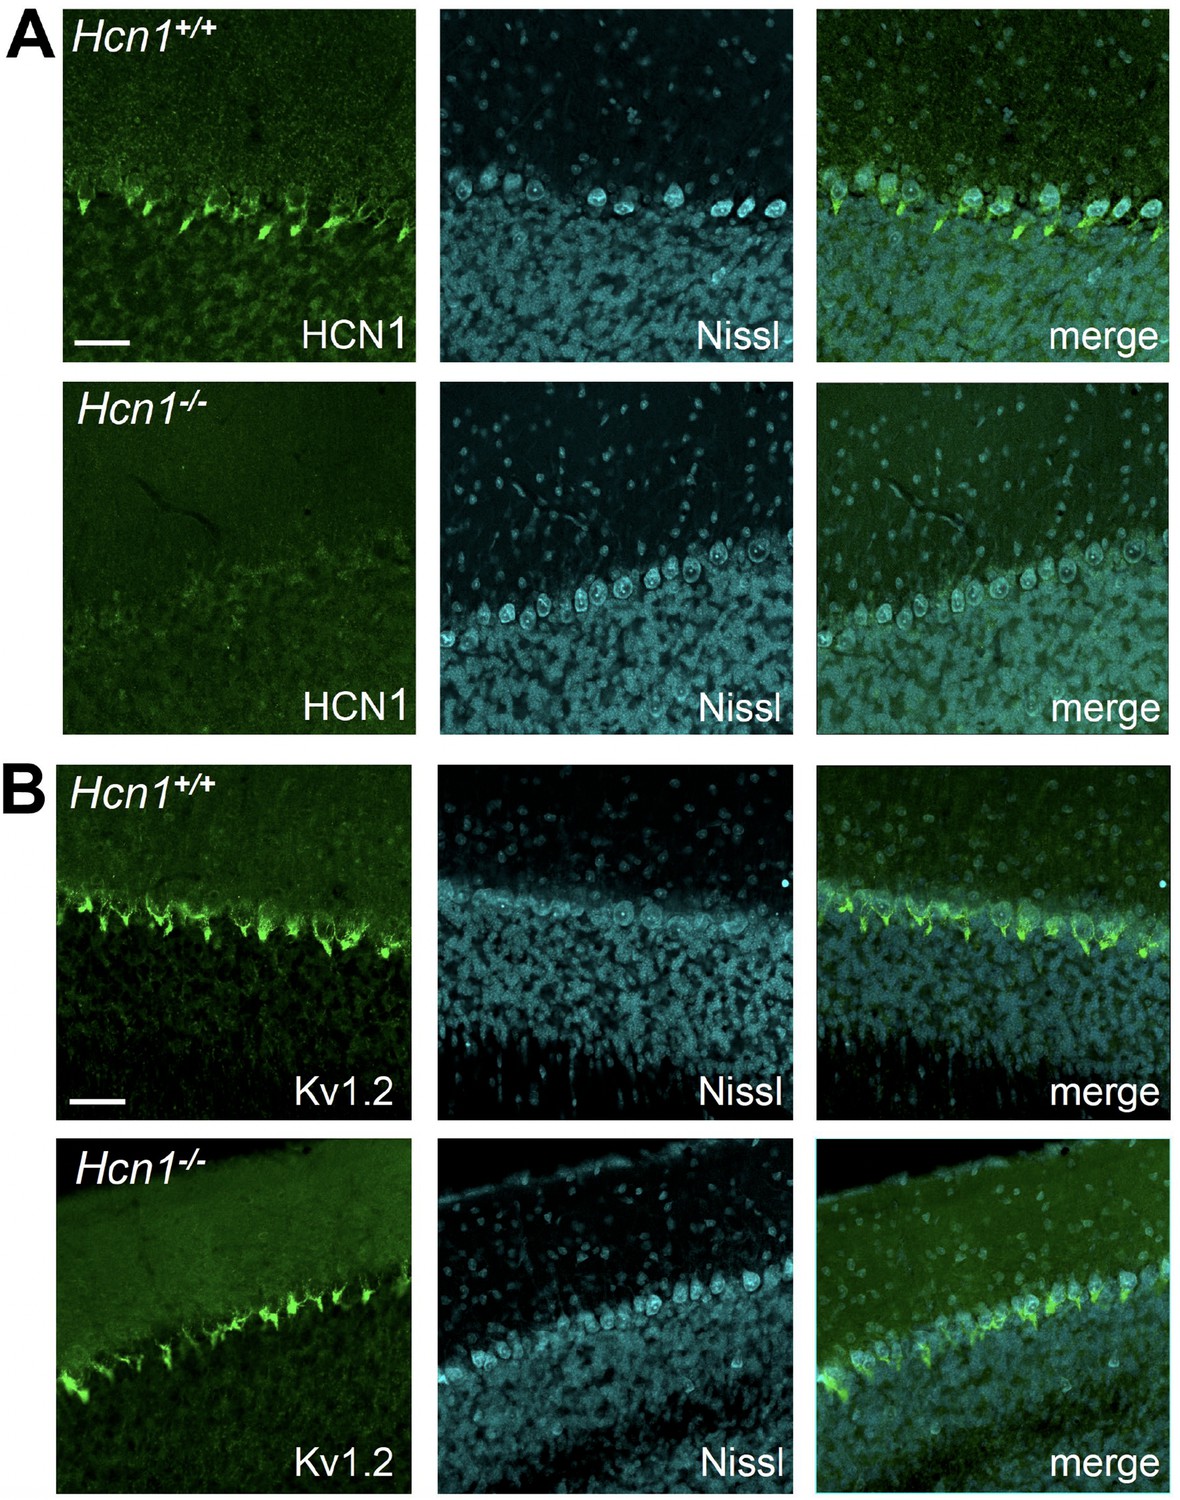
KV1.2 protein expression is unaltered in cerebellar pinceau of global HCN1 knockout animals.
Immunofluorescent staining of coronal hindbrain sections from adult brains in Hcn1+/+ and Hcn1-/- mice, showing the cerebellar cortex. (A) Left: HCN1 protein labeling; center: Nissl counterstain; right: merged images. (B) Left: KV1.2 protein labeling; center: Nissl counterstain; right: merged images. Nissl counterstain highlights the location of Purkinje cell bodies. The pinceau is visible surrounding the Purkinje cell axon initial segment. Scale bar = 50 μm in all panels.
Figure 7 with 2 supplements
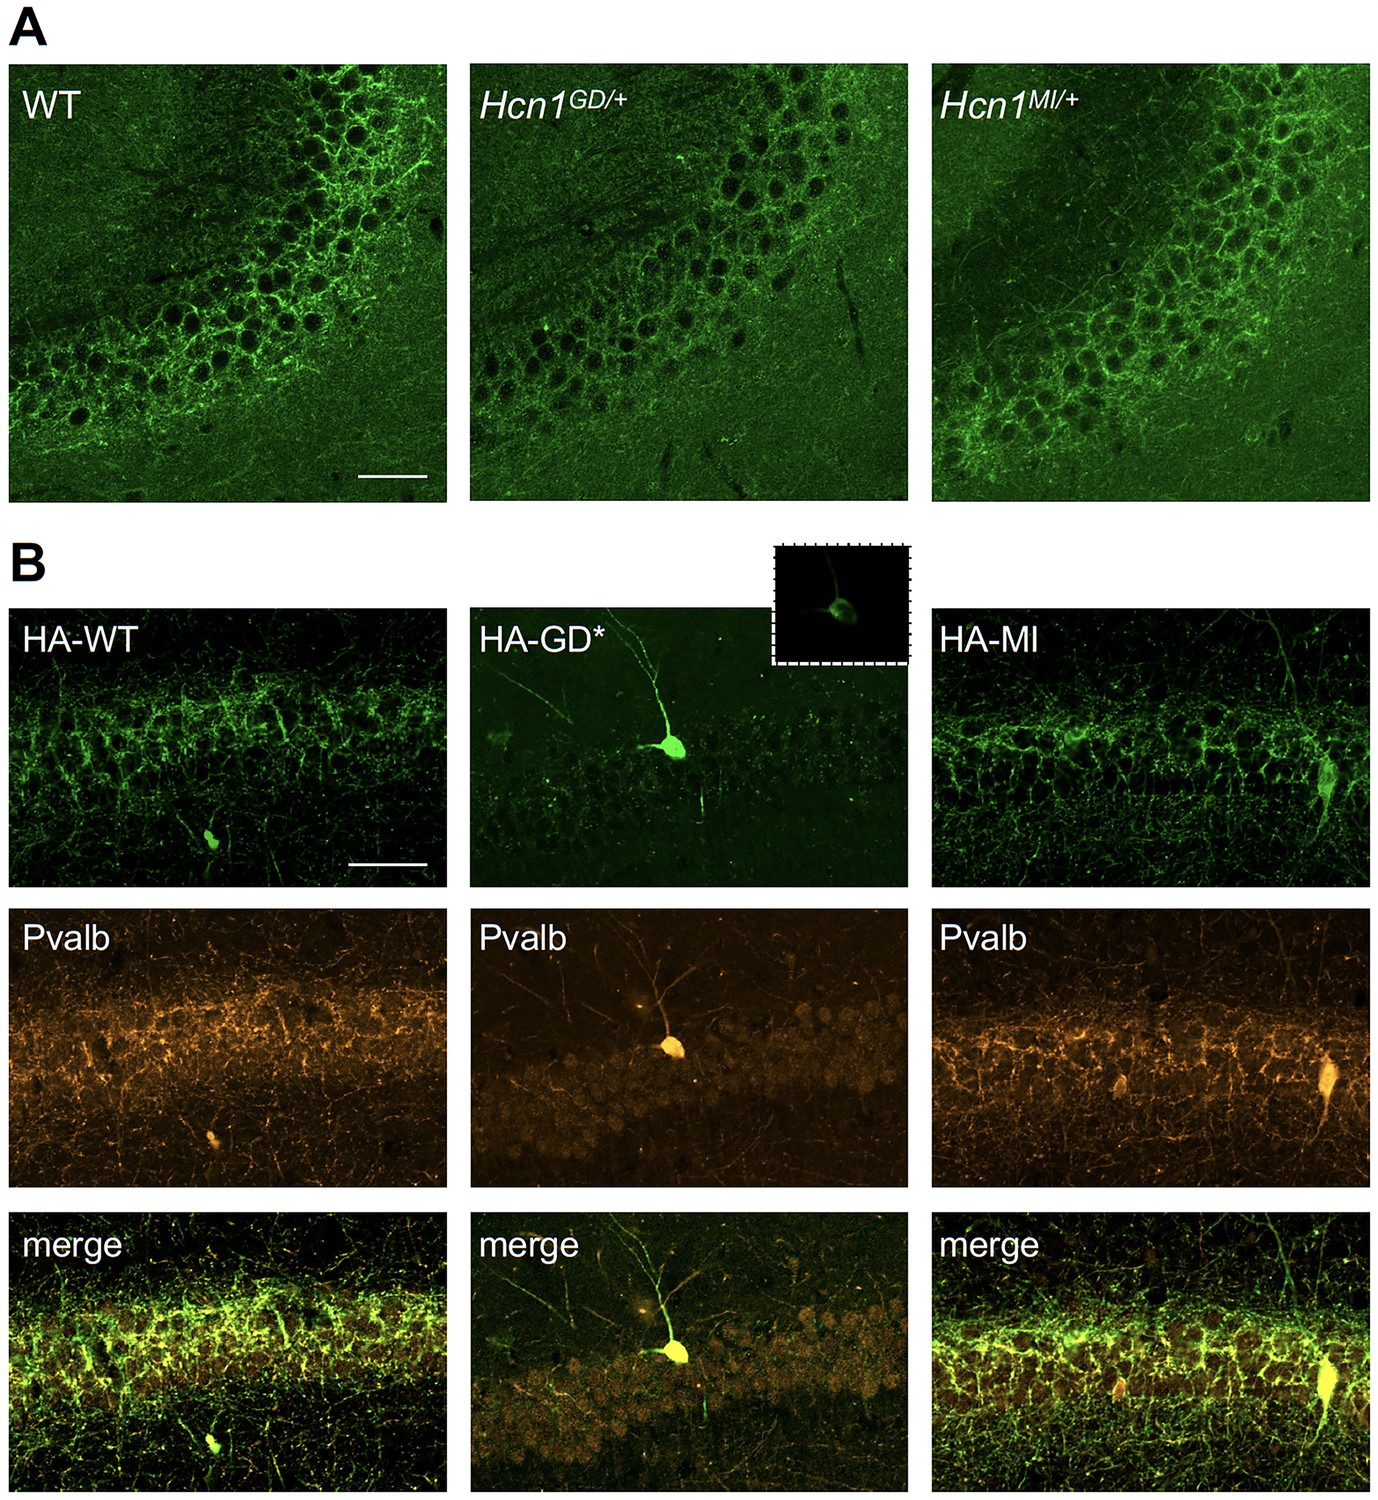
Viral targeting of HCN1 subunits to parvalbumin-positive (PV+) interneuron terminals in hippocampus shows impaired trafficking of HCN1-GD mutant protein.
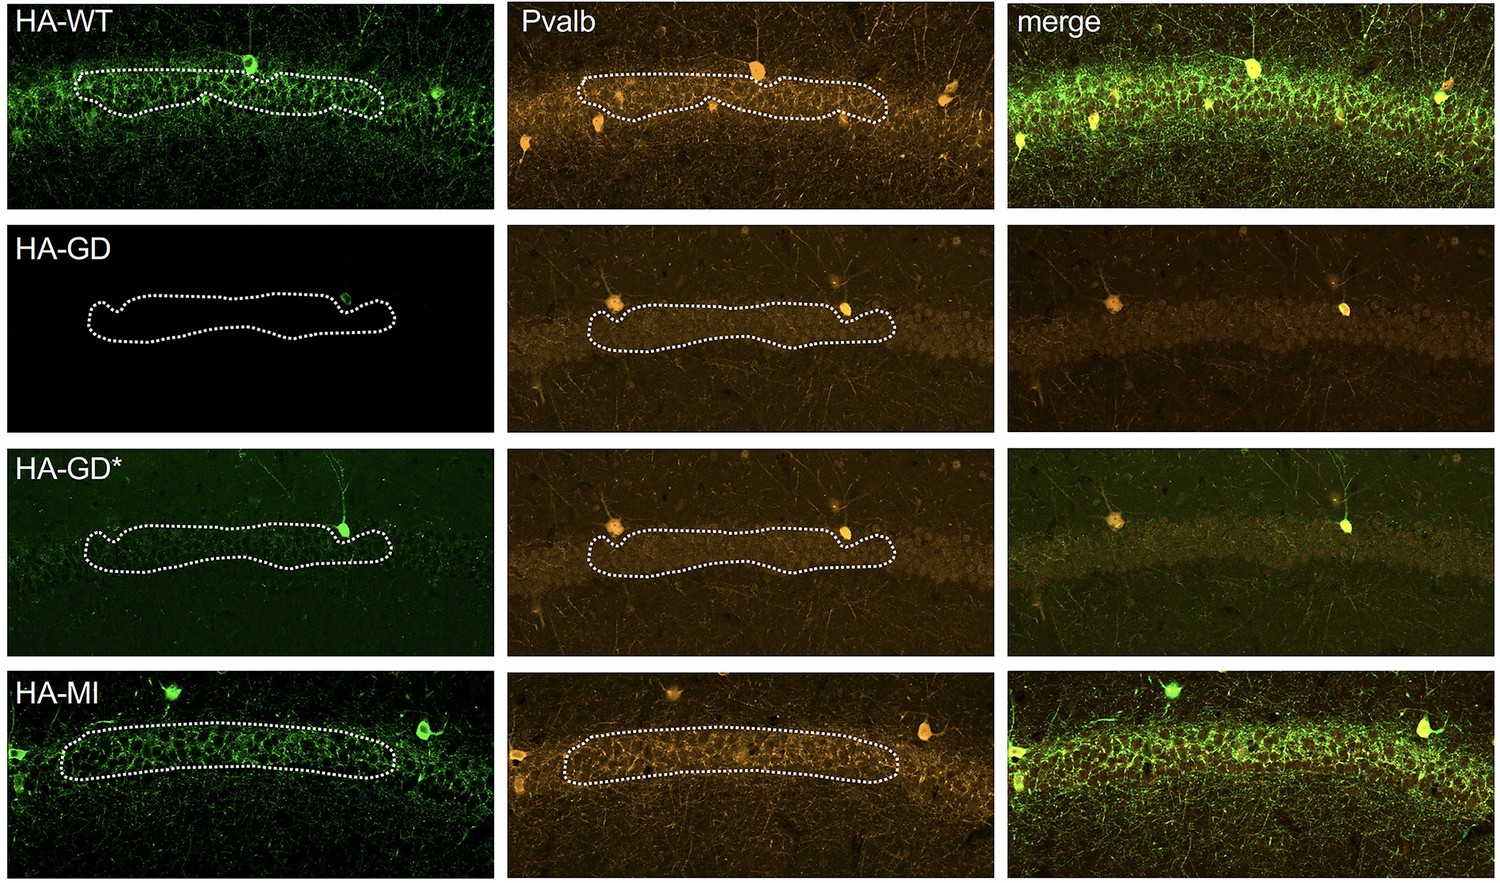
Immunofluorescent staining of midcoronal sections from adult mouse brain. (A) Labeling of HCN1 protein in the hippocampus of WT, Hcn1GD/+, and Hcn1MI/+ mice. Images show a close-up of the pyramidal cell layer of area CA3, with the PV+ interneuron axonal terminals visible. Scale bar = 50 μm for all panels. (B) Anti-hemagglutinin (anti-HA) tag labeling of virally expressed HCN1 protein after stereotaxic injection into hippocampal area CA1 of adult Pvalb-Cre mice. Top panels show distribution of HA-HCN1-WT (HA-WT), HA-HCN1-GD (HA-GD), and HA-HCN1-MI (HA-MI) protein at 21 days after injection. Equivalent laser power and gain were used for images in HA-WT, HA-MI, and inset for HA-GD sample; the HA-GD* full panel image was obtained at higher laser power and gain to compensate for the lower expression levels of the HA-GD protein. Middle row panels show co-labeling for parvalbumin protein, with merged images shown in bottom panels. Note that HA-tagged protein labeling is visible in the soma and dendrites of PV+ interneurons in all samples, presumably owing to virus overexpression (see Figure 7—figure supplements 1 and 2). However, only HA-WT and HA-MI are also visible in axonal terminals, with minimal or absent labeling of axons noted in HA-GD samples even when laser power and gain are increased. Scale bar = 50 μm for all panels.
Figure 7—figure supplement 1
Impaired trafficking of virally transduced HCN1-GD protein to parvalbumin-positive (PV+) interneuron terminals in hippocampus.
Immunofluorescent staining of midcoronal sections from adult mouse brain. Anti-hemagglutinin (anti-HA) tag labeling of virally expressed HCN1 protein after stereotaxic injection into hippocampal area CA1 of adult Pvalb-Cre mice. Left panels show distribution of HA-HCN1-WT (HA-WT), HA-HCN1-GD (HA-GD), and HA-HCN1-MI (HA-MI) protein at 21 days after injection. Equivalent laser power and gain were used for HA-WT, HA-MI, and HA-GD images, while the HA-GD* full panel image was obtained at higher laser power and gain to compensate for the lower expression levels of the HA-GD protein. Middle panels show co-labeling for parvalbumin protein, with merged images shown in right panels. HA-tagged protein labeling is visible in the soma and dendrites of PV+ interneurons in all samples; however, only HA-WT and HA-MI are also visible in PV+ axonal terminals within the pyramidal cell layer. Dotted lines show region of interest (ROI) drawn for fluorescence intensity measurements. Scale bar = 100 μm for all panels.
Figure 7—figure supplement 2
Viral targeting of HCN1 subunits to parvalbumin-positive (PV+) interneurons in hippocampal area CA1.
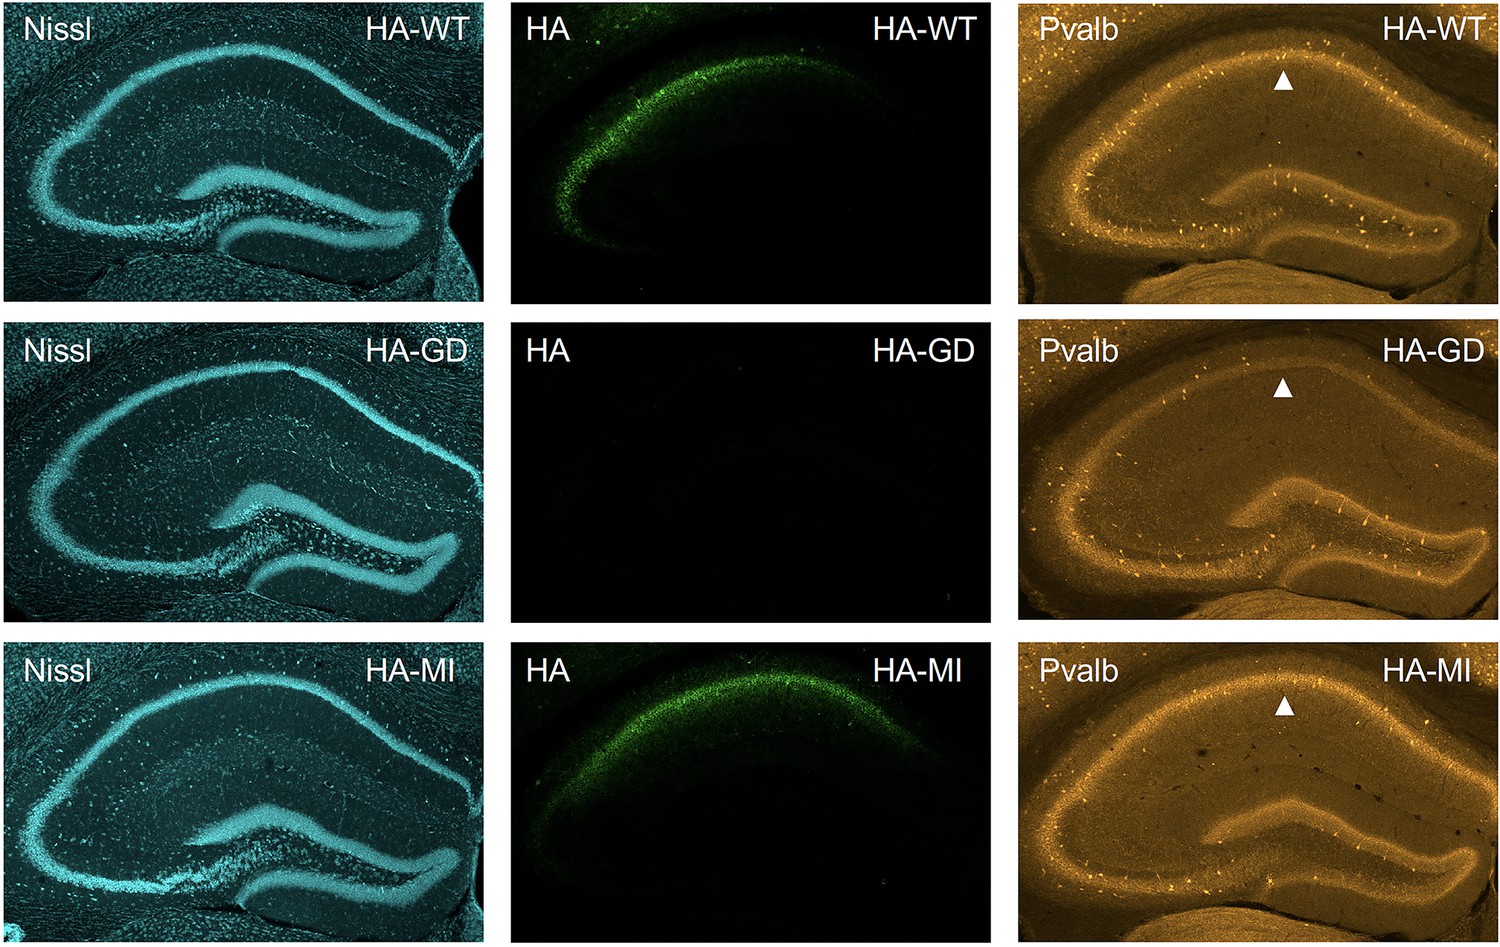
Immunofluorescent staining of midcoronal sections from adult mouse brain, showing the hippocampus region. Anti-hemagglutinin (anti-HA) tag labeling of virally expressed HCN1 protein after stereotaxic injection into hippocampal area CA1 of adult Pvalb-Cre mice at 21 days after injection. Left panels show Nissl counterstain, with middle panels showing expression of HA-HCN1-WT (HA-WT), HA-HCN1-GD (HA-GD), and HA-HCN1-MI (HA-MI) protein. Equivalent laser power and gain were used for all HA-WT, HA-MI, and HA-GD images. Right panels show co-labeling for parvalbumin protein, with arrowhead indicating area of reduced parvalbumin expression seen in brains injected with HA-HCN1-GD construct.
Figure 8
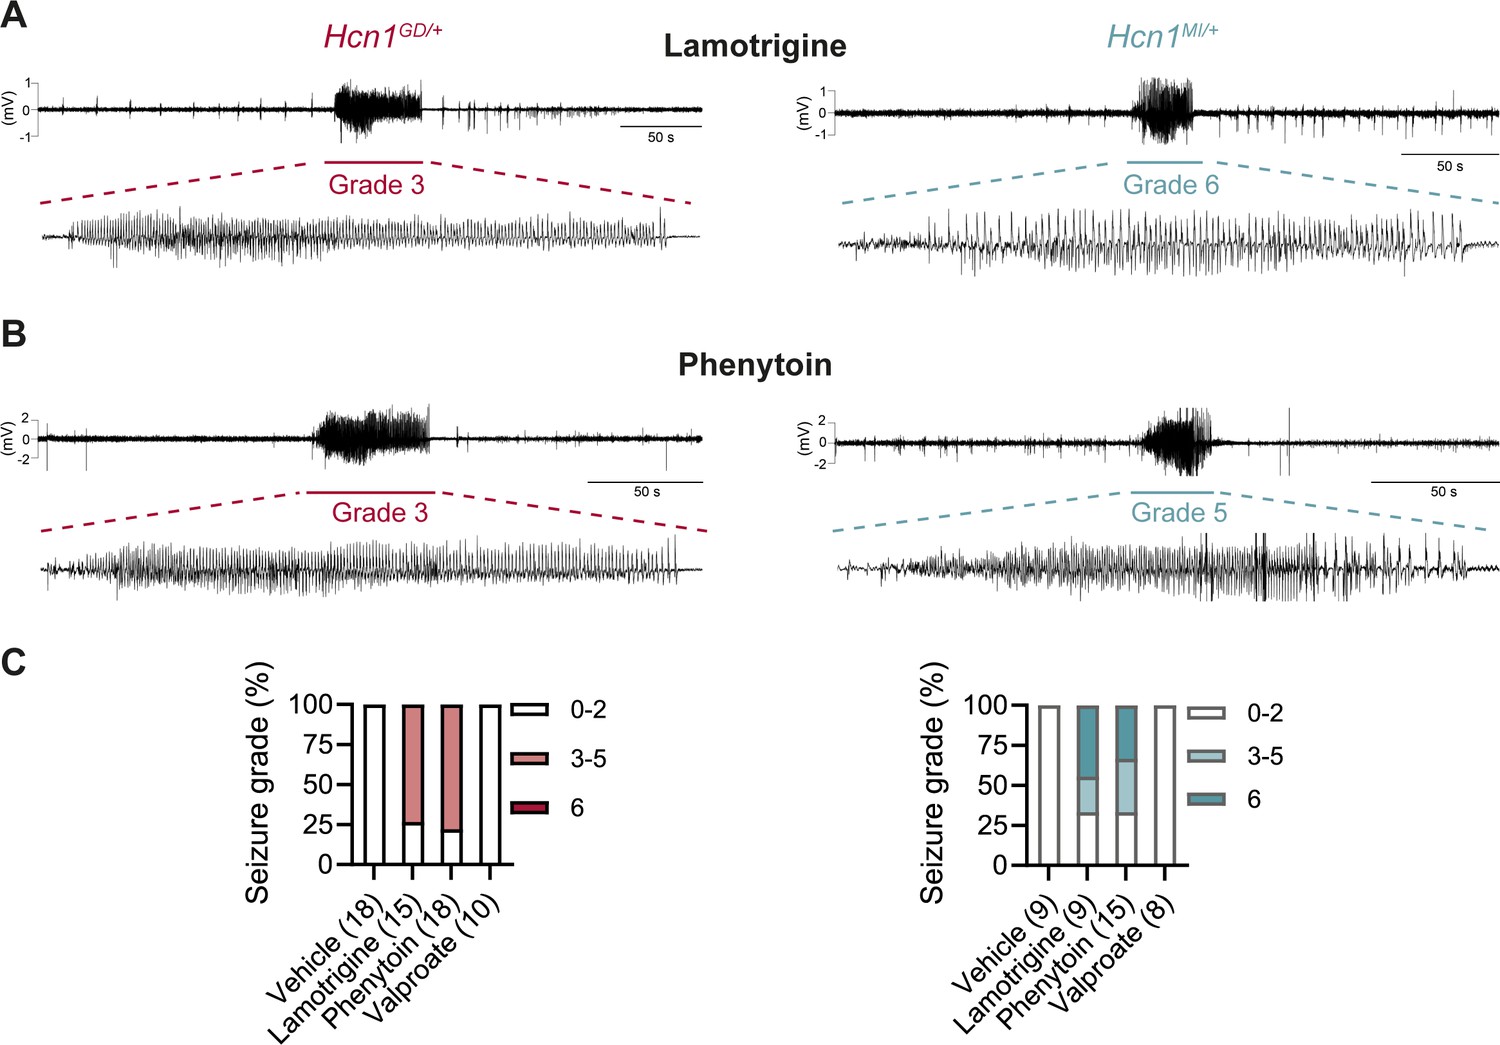
Anticonvulsant-drug induced seizures in Hcn1GD/+ and Hcn1MI/+ mice.
(A) Example electrocorticogram (ECoG) trace for lamotrigine-induced grade 3 seizure in Hcn1GD/+ (left) and grade 6 seizure in Hcn1MI/+ mouse (right), with seizure shown at expanded time scale below. (B) Phenytoin-induced grade 3 seizure in Hcn1GD/+ (left) and grade 5 seizure in Hcn1MI/+ mouse (right). (C) Percentage of Hcn1GD/+ (left) and Hcn1MI/+ (right) mice experiencing convulsive seizures (grade 3 and higher) upon administration of vehicle, lamotrigine, phenytoin, or sodium valproate, with highest seizure grade indicated by color. As in the case of spontaneous seizures, Hcn1MI/+ animals showed an overall higher seizure severity in response to drug administration. No convulsive seizures were observed in response to vehicle or sodium valproate during the observation period of the experiment (see ‘Materials and methods’). Total number of animals tested for each condition is reported in parentheses (see ‘Results’ for the number of video ECoG recordings versus behavioral observations).
Figure 9 with 1 supplement

Lamotrigine (LTG) has no direct effect on HCN1 or HCN2 channel activity.
(A) Sample current traces from whole-cell voltage-clamp recordings in HEK293T cells transiently expressing HCN1 (top), HCN1 and TRIP8b (middle) or HCN2 (bottom), in the absence or presence of bath applied LTG (100 μM). Voltage step protocol for HCN1 and HCN1 + TRIP8b: holding potential was –20 mV (1 s), with steps from –30 mV to –120 mV (–10 mV increments, 3.5 s) and tail currents recorded at –40 mV (3.5 s); for HCN2: holding potential was similarly −20 mV (1 s), but steps were applied from −40 mV to −130 mV in –15 mV increments (5 s) and tail currents recorded at −40 mV (5 s). (B) Tail current activation curves (left) and tail current density (right) group data obtained for each condition. Lines show data fitting with a Boltzmann function (see ‘Materials and methods’). Data show that neither the midpoint voltage of activation (V1/2) nor the maximum tail current density was altered by LTG addition (ns = not significant, paired t-test; see Figure 9—source data 1 for numerical values). Data in (B) represent mean ± SEM (note that smaller error bars in the tail current activation curves may be obscured by the circles representing mean values).
-
Figure 9—source data 1
Lamotrigine has no direct effect on HCN1 or HCN2 channel activity.
Number of cells is indicated in parenthesis. #Data was analyzed with a Student’s t-test. Data represent mean ± SEM.
- https://cdn.elifesciences.org/articles/70826/elife-70826-fig9-data1-v2.docx
Figure 9—figure supplement 1
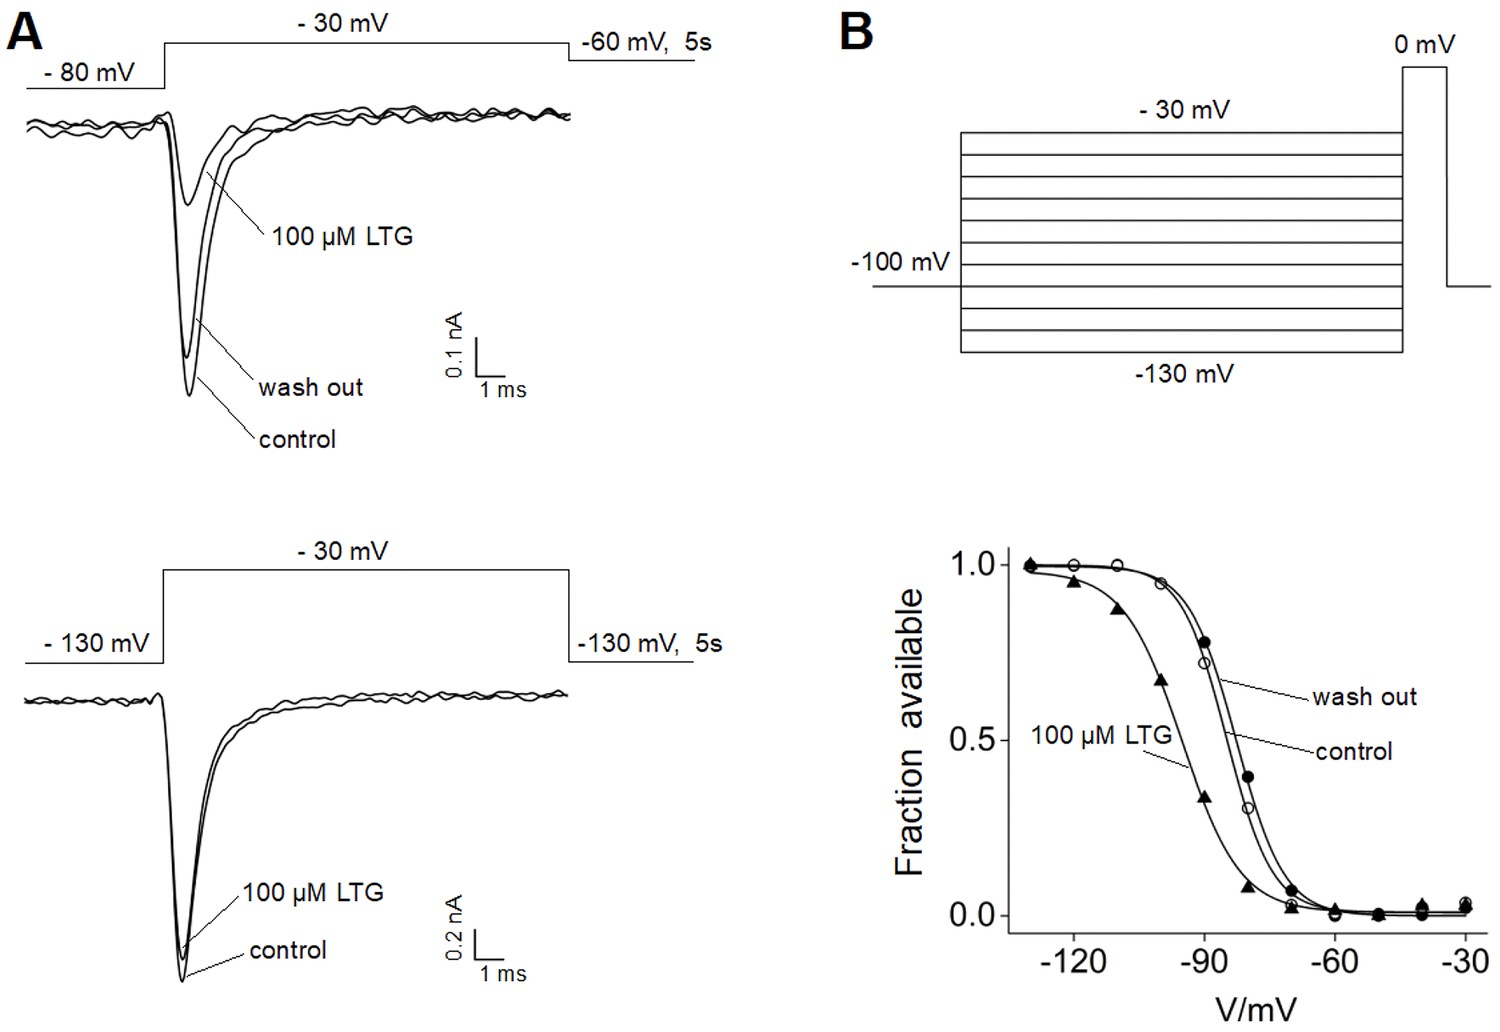
Effects of lamotrigine (LTG) on NaV1.5 channels.
(A) The inhibition of NaV1.5 channel activity by LTG was tested at different holding potentials. Representative sodium currents recorded from HEK293T cells transiently expressing NaV1.5 channels before (control), upon 100 μM LTG bath application (LTG) and after drug washout (washout) are shown. The cell was held at −80 mV (top) or –130 mV (bottom), then stepped to a test potential of –30 mV for 20 ms every 5 s. After the test potential, the cell was stepped to –60 mV or –130 mV to keep the channel in the inactivated or resting state (top and bottom, respectively). Marked current inhibition can be noted in the traces shown on the top, consistent with the preferential binding of LTG to the inactivated state of sodium channels. (B) LTG binding shifts the inactivation curve of NaV1.5 channel. Inactivating currents were elicited every 10 s using the voltage step protocol shown. The holding potential between each series of steps was set to –60 mV in order to keep the channel in the inactivated state. The current recorded at the test pulse of 0 mV was plotted against the voltage of the inactivating pulse to get the inactivation curve in control solution, upon bath application of 100 μM LTG, and after drug washout (traces from representative cell are shown at the bottom). Solid lines show fitting with a Boltzmann function, providing V1/2 values used to calculate the mean shift (ΔV): 13.6 ± 2.8 mV for 100 μM LTG and 2.1 ± 1.8 mV after drug washout (n = 3). LTG treatment caused a leftward shift of the inactivation curve, rescued by the washout of the drug.
Figure 10

Lack of effect of ZD7288 on Hcn1GD/+ neurons and heterologously expressed hHCN1-WT/G391D channels.
(A) Whole-cell voltage-clamp recordings in HEK293T cells heterologously expressing either human HCN1 (hHCN1) WT or heteromeric hHCN1 WT/G391D channels. Sample current traces are shown, in response to a voltage step to –110 mV from a holding potential of –20 mV, before (control, CTRL) and after full block from ZD7288 (30 μM) or CsCl (5 mM) bath application. (B) Bar plot with % inhibition from group data (WT = 66.83 ± 4.5% versus WT/G391D = 15.00 ± 3.89%; ***p<0.001, Mann–Whitney U test). (C–E) The HCN blocker ZD7288 (10 μM) abolished sag (C), significantly hyperpolarized resting membrane potential (RMP) (D), and increased input resistance (E) in WT, but did not alter any of these parameters Hcn1GD/+ neurons (**p<0.01, ***p<0.001, paired t-test; number of recorded cells is indicated in the bar graphs; number of animals used: WT n = 4, WT + ZD7288 n = 3, Hcn1GD/+ n = 3, Hcn1GD/+ + ZD7288 n = 3; see Figure 10—source data 1 for numerical values). (F) Snapshots of the human HCN1 pore region structure at the end of a 100 ns molecular dynamics (MD) simulation run, with or without introduction of the G391D mutation in two or four subunits. Top left: WT; top right: heteromer with G391D variant on two opposite subunits; bottom left: heteromer with G391D variant on two adjacent subunits; bottom right: homomer with G391D variant on all four subunits. The outer pore helix S5 is labeled (S5), with asterisks indicating the position of the G391 residue in all cases. Carbonyls of modeled G391D residues are colored in red. Side chains of V390 residues are colored in light orange. Data in (B–E) represent mean ± SEM.
-
Figure 10—source data 1
Lack of effect of ZD7288 on Hcn1GD/+ neurons.
Number of cells is shown in parenthesis. *Data was analyzed with a paired t-test. #Data was analyzed with a Wilcoxon matched-pairs signed-rank test. Data represent mean ± SEM.
- https://cdn.elifesciences.org/articles/70826/elife-70826-fig10-data1-v2.docx
Tables
Key resources table
| Reagent type (species) or resource | Designation | Source or reference | Identifiers | Additional information |
|---|---|---|---|---|
| Antibody | Anti-HCN1 (mouse monoclonal) | NeuroMab | RRID:AB_2877279; clone N70-28, Cat# N75-110 | IHC (1:300) |
| Antibody | Anti-NPY (rabbit polyclonal) | Immunostar Hudson | RRID:AB_572253; Cat# 22940 | IHC (1:1000) |
| Antibody | Anti-GFAP (mouse monoclonal) | Invitrogen | RRID:AB_10598206; clone GA5, Cat# 14-9898-82 | IHC (1:250) |
| Antibody | Anti-ATP1a3 (mouse monoclonal) | Invitrogen | RRID:AB_2274447; clone G10, Cat# MA3-915 | IHC (1:400) |
| Antibody | Anti-HA tag (rat monoclonal) | Roche | RRID:AB_390917; clone BMG-3F10, Cat# 12013819001 | IHC (1:100) |
| Antibody | Anti-KV1.2 (mouse monoclonal) | NeuroMab | RRID:AB_2296313; clone K14/16, Cat# N75-008 | IHC (1:300) |
| Antibody | Anti-parvalbumin (rabbit polyclonal) | Synaptic Systems | RRID:AB_2156474; Cat# 195002 | IHC (1:1000) |
| Cell line (human) | HEK293T | ATCC (authenticated by STR profiling) | RRID:CVCL_0063 | Tested for mycoplasma: negative result |
| Commercial assay, kit | Clariom S Assay, mouse | Thermo Fisher Scientific | Cat# 902931 | |
| Genetic reagent (Mus musculus) | Hcn1-/- (B6.129S-Hcn1tm2Kndl/J) | Jackson Laboratory | RRID:IMSR_JAX:016566 | Males and females |
| Genetic reagent (M. musculus) | Hcn1G380D (C57BL/6J-Hcn1em1(G380D)Cecad) | This paper | Males and females | |
| Genetic reagent (M. musculus) | Hcn1M142I (C57BL/6J-Hcn1em2(M142I)Cecad) | This paper | Males and females | |
| Genetic reagent (M. musculus) | Pvalb-Cre (B6.129P2-Pvalbtm1(cre)Arbr/J) | Jackson Laboratory | RRID:IMSR_JAX:017320 | Males and females |
| Peptide, recombinant protein | WFA biotin conjugate | Sigma-Aldrich | RRID:AB_2620171; Cat# L-1516 | IHC (1:1000) |
| Peptide, recombinant protein | Streptavidin Alexa Fluor 594 conjugate | Life Technologies | RRID:AB_2337250; Cat# S32356 | IHC (1:500) |
| Recombinant DNA reagent | pcDNA 3.1 (plasmid) | Invitrogen | Used for HEK293T experiments to express human HCN1 and mouse TRIP8b | |
| Recombinant DNA reagent | pCI (plasmid) | Promega | U47119; Cat# E1731 | Used for HEK293T experiments to express mouse HCN2 |
| Recombinant DNA reagent | pmaxGFP (plasmid) | Amaxa Biosystems | HEK293T experiments (cotransfection for target cell visualization) | |
| Recombinant DNA reagent | pIRES-EGFP (plasmid) | Clontech Laboratories | Used for HEK293T experiments to express human NaV1.5 | |
| Recombinant DNA reagent | pAAV-hSyn-DIO-hM4D(Gi)-mCherry (plasmid) | Addgene | Cat# 44362 | Used to replace hM4D(Gi)-mCherry with mouse HCN1 cDNAs |
| Recombinant DNA reagent | pAAV-hSyn-DIO-HA-HCN1-WT (plasmid) | This paper | Mouse HCN1 with N-terminal HA tag (YPYDVPDYA); AAV virus injection | |
| Recombinant DNA reagent | pAAV-hSyn-DIO-HA-HCN1-GD (plasmid) | This paper | Mouse HCN1-GD with N-terminal HA tag (YPYDVPDYA); AAV virus injection | |
| Recombinant DNA reagent | pAAV-hSyn-DIO-HA-HCN1-MI (plasmid) | This paper | mouse HCN1-MI with N-terminal HA tag (YPYDVPDYA); AAV virus injection | |
| Sequence-based reagent | crRNA for Hcn1GD | This paper | 5'-ACTGGATCAA AGCTGTGGCA-3' | |
| Sequence-based reagent | ssODN for Hcn1GD | This paper | 5'-CCCAAGCCCCTGTCAGCATGTCTGACCTCTGGATTACCATGCTGAGC ATGATTGTGGGCGCCACCTGCTACGCAATGTTTGTTGATCATGCCACAG CTTTGATCCAGTCTTTGGACTCTTCAAGGAG-3' | |
| Sequence-based reagent | crRNA for Hcn1MI | This paper | 5'-ATCATGCTTAT AATGATGGT-3' | |
| Sequence-based reagent | ssODN for Hcn1MI | This paper | 5'-ATCGGATGCCA CGTTGAAAATAATCCACGGTGTTGTCGTCTGCTCTGTGAAGAAC GTGATTCCAACTGGTATGATGACCAAATTTCCAACGATCATTATAA GCATGATTAAATCCCAATAAAACCTA-3' | |
| Sequence-based reagent | Hcn1GD WT forward primer | This paper | 5'-ACGGTGATGA CACTTGTTCAGT-3' | |
| Sequence-based reagent | Hcn1GD WT reverse primer | This paper | 5'-TGGATCAAAGCTGTGGCATGGC-3' | |
| Sequence-based reagent | Hcn1GD mutant forward primer | This paper | 5'-ACCTGCTACGC AATGTTTGTTGAT-3' | |
| Sequence-based reagent | Hcn1GD mutant reverse primer | This paper | 5'-GGCACTACA CGCTAGGAA-3' | |
| Sequence-based reagent | Hcn1MI forward primer | This paper | 5'-CAACATTTGTT TGTTCTCCTCACC-3' | |
| Sequence-based reagent | Hcn1MI reverse primer | This paper | 5'-ATGATCGAAT GCCACGTTGA-3' | |
| Software, algorithm | ImageJ | NIH | v1.49 | |
| Software, algorithm | Axograph X | Axograph Scientific | 1.7.6 | |
| Software, algorithm | MATLAB | MathWorks | R2022a | |
| Software, algorithm | Prism | GraphPad | v9.0.1 | |
| Software, algorithm | OriginPro | OriginLab | v2016 | |
| Software, algorithm | pClamp 10 | Molecular Devices | RRID:SCR_011323 | v10.7 |
| Software, algorithm | EZ Patch | Elements srl | v 1.2.3 | |
| Software, algorithm | TAC4.0 | Thermo Fisher Scientific | v4.0.2.15 | |
| Transfected construct (human) | HCN1 (cDNA) | Xention Ltd (Cambridge, UK) | HEK293T experiments | |
| Transfected construct (human) | NaV1.5 (cDNA) | PMID:33213388 | HEK293T experiments | |
| Transfected construct (mouse) | HCN1 (cDNA) | PMID:11331358 | Used to generate AAV virus construct and mutants thereof (see ‘Materials and methods’) | |
| Transfected construct (mouse) | HCN2 (cDNA) | PMID:11331358 | HEK293T experiments | |
| Transfected construct (mouse) | TRIP8b (cDNA) | PMID:19555649 | HEK293T experiments |
Additional files
-
Transparent reporting form
- https://cdn.elifesciences.org/articles/70826/elife-70826-transrepform1-v2.pdf
-
Source code 1
MATLAB code to generate Figure 4A and C.
Source code used to plot typical examples of seizures, including the electrocorticogram (ECoG) trace and corresponding time–frequency spectrogram, using the custom written function plot_telemSz_andrea.
- https://cdn.elifesciences.org/articles/70826/elife-70826-code1-v2.docx
-
Source data 1
Microarray-based analysis of differential ion channel gene expression in Hcn1GD/+ and Hcn1MI/+ mice.
Average intensity (log2), fold change, p-value, and false discovery rate (FDR)-corrected p-value (considering all 22,206 probe sets) were derived using an Affymetrix-based screening of hippocampal tissue from Hcn1GD/+, Hcn1MI/+, and WT mice (n = 4 for each group) for 112 candidate genes, representing all main families of voltage-gated ion channels (see ‘Materials and methods’). Top 10 hits, ranked by p-value, are shown for each comparison. Values for GFAP and vimentin, two genes with an expected increase in hippocampal expression as a result of reactive gliosis (Figure 4—figure supplement 1, Escartin et al., 2021; Stringer, 1996), are also shown for reference. Note that both markers showed a nearly approximately twofold increase in Hcn1GD/+ animals (with FDR-corrected p-value<0.05 in the case of vimentin), while negligible changes were observed in Hcn1MI/+ animals.
- https://cdn.elifesciences.org/articles/70826/elife-70826-data1-v2.docx
Download links
A two-part list of links to download the article, or parts of the article, in various formats.
Downloads (link to download the article as PDF)
Open citations (links to open the citations from this article in various online reference manager services)
Cite this article (links to download the citations from this article in formats compatible with various reference manager tools)
Seizures, behavioral deficits, and adverse drug responses in two new genetic mouse models of HCN1 epileptic encephalopathy
eLife 11:e70826.
https://doi.org/10.7554/eLife.70826


