The cell adhesion molecule Sdk1 shapes assembly of a retinal circuit that detects localized edges
- Department of Physiology, McGill University, Canada
Figures
Figure 1 with 4 supplements
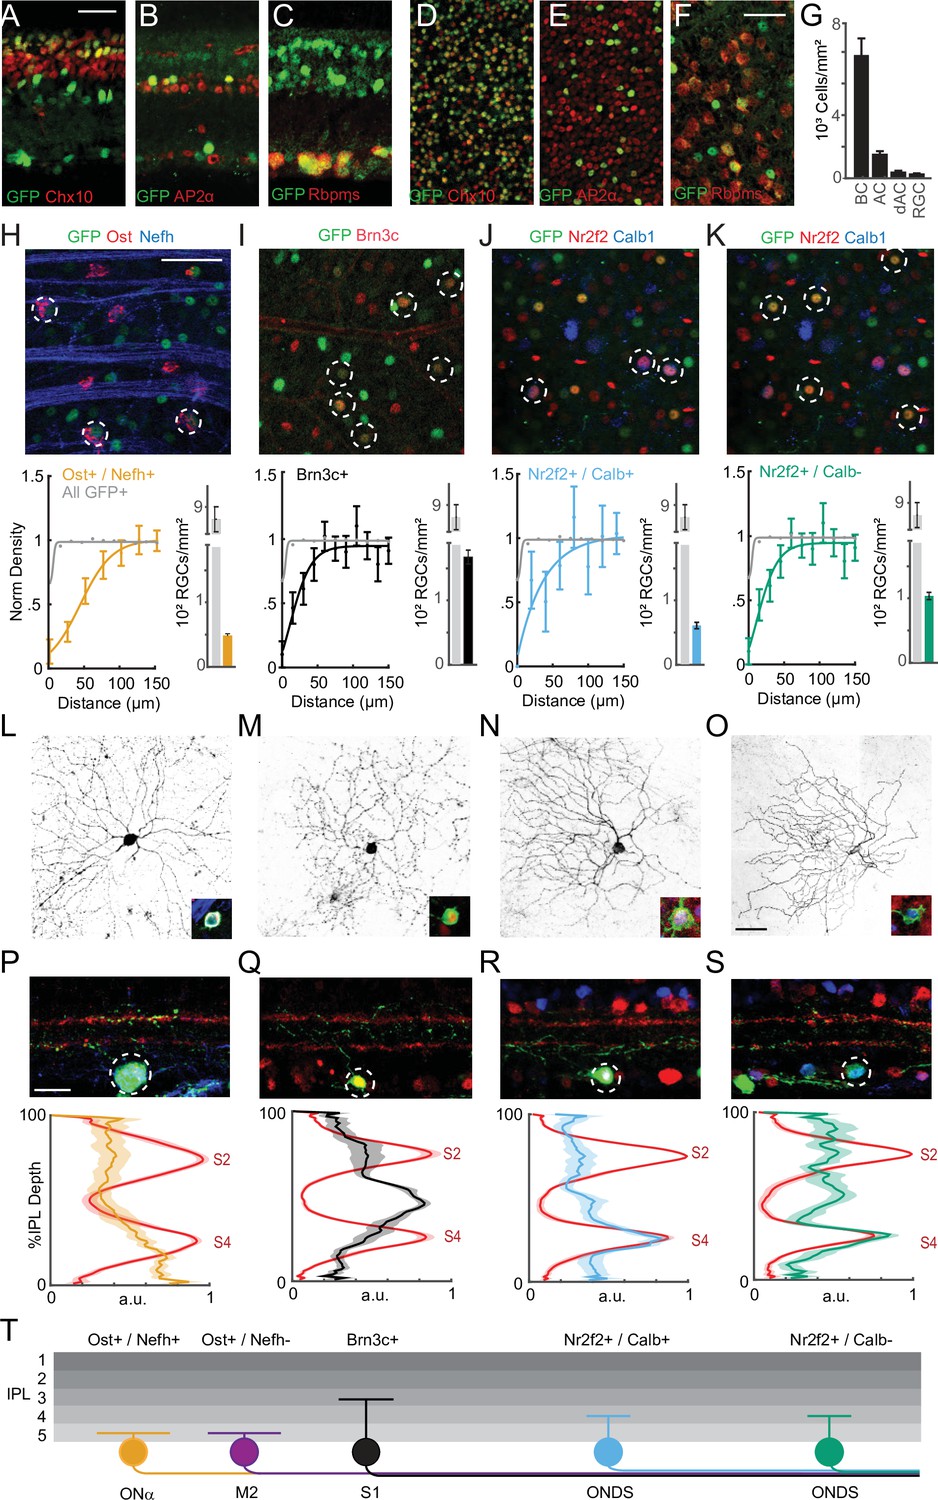
Sidekick-1 (Sdk1) labels a family of retinal ganglion cell (RGC) types.
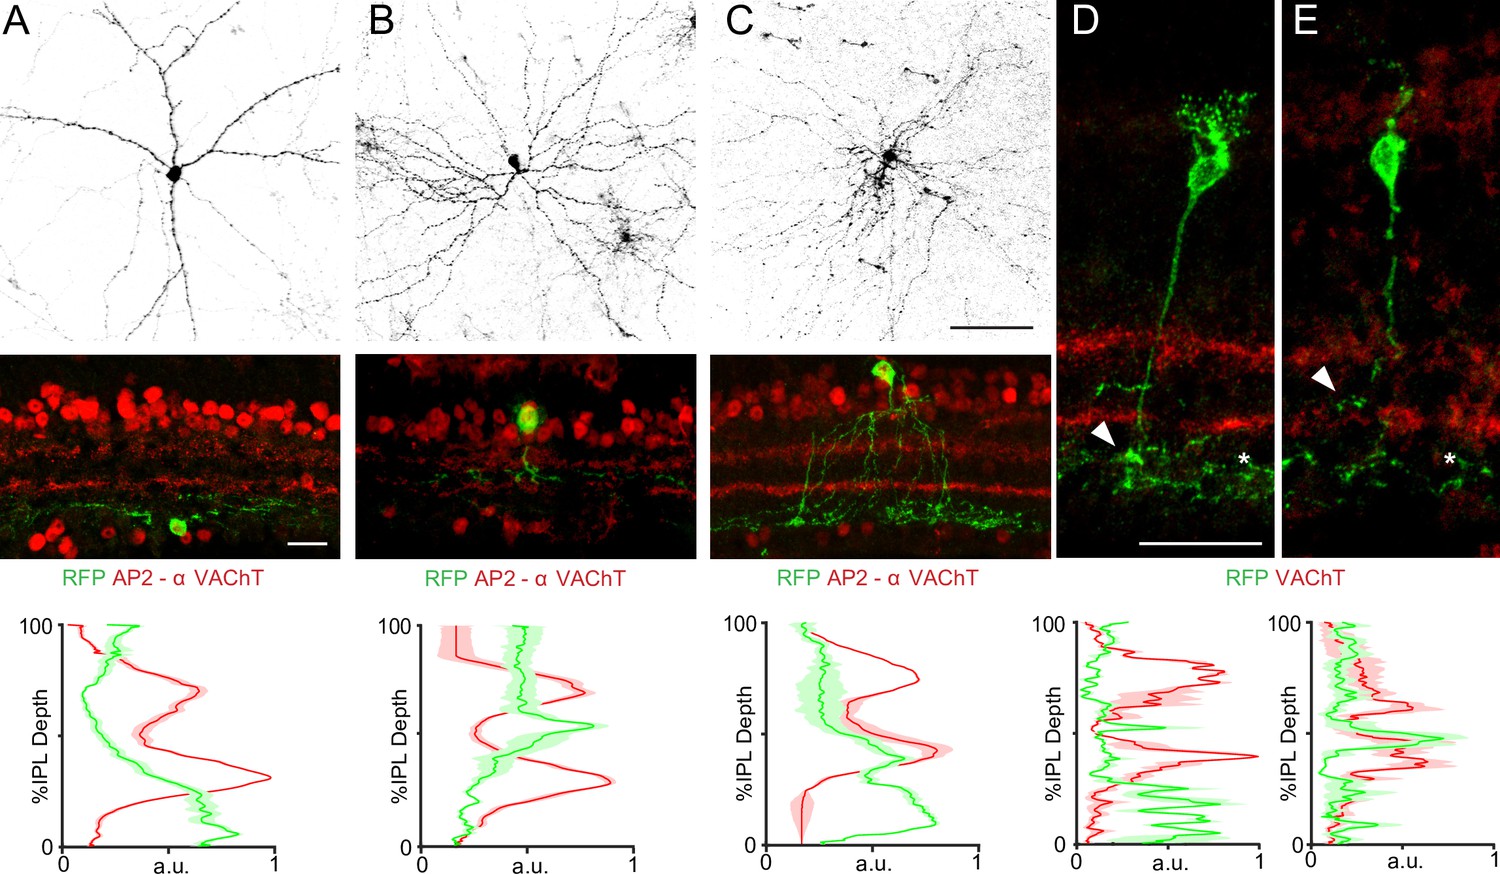
(A–F) Sample cross-sections (A–C) and whole mounts (D–F) from Sdk1CG mice stained with antibodies to GFP and the bipolar cell (BC) marker Chx10 (A, D), amacrine (AC) marker AP2-α (B,E), and RGC marker RBPMS (C, F). Scale = 25 μm. (G) Bar graph showing density of BCs, ACs, displaced amacrine cells (dACs), and RGCs expressing Sdk1 computed from experiments like those shown in (D–F) (n = 14 fields from three animals for each experiment). (H–K) Top: GFP-stained sample Sdk1CG retinal whole mounts co-stained with antibodies to osteopontin (Ost) and neurofilament heavy chain (Nefh) (H), Brn3c (I), or Nr2f2 and calbindin (Calb) (J, K). Dotted circles indicate co-labeled neurons and scale = 50 μm. Bottom: normalized density recovery profiles and average density of co-labeled RGCs measured from corresponding experiments shown in the top row. Colored traces indicate density recovery profiles for co-labeled neurons; gray traces indicate density recovery profiles for all GFP+ cells in the GCL (n = 13–18 fields from six animals for each experiment). (L–O) Images showing the dendritic morphology of individually labeled Ost+/Nefh+ RGCs (L), Brn3c+ RGCs (M), Nr2f2+/Calb+ RGCs (N), and Nr2f2+/Calb- RGCs (O) in Sdk1CG/+ retinal whole mounts. Inset shows marker expression in the soma. (P–S) Top: images showing the laminar morphology of individually labeled Ost+/Nefh+ RGCs (P), Brn3c+ RGCs (Q), Nr2f2+/Calb+ RGCs (R), and Nr2f2+/Calb- RGCs (S) in Sdk1CG/+ retinal cross-sections. Red staining indicates VAcht, a marker for sublaminae 2 (S2) and 4 (S4) (scale = 50 μm). Bottom: inner plexiform layer (IPL) linescans measured from corresponding experiments shown in the top row. Red traces show VAChT intensity, and colored traces show reporter intensity measured from experiments like those shown in the top row (n = 6–12 fields per RGC type from more than 16 animals). (T) Summary cartoon of the Sdk1 RGC family showing Ost+/Nefh+ Onα-RGCs, Brn3c+ S1 RGCs, Ost+/Nefh- M2-RGCs, and Nr2f2+/Calb+ and Calb- ON-DSGCs.
Figure 1—figure supplement 1
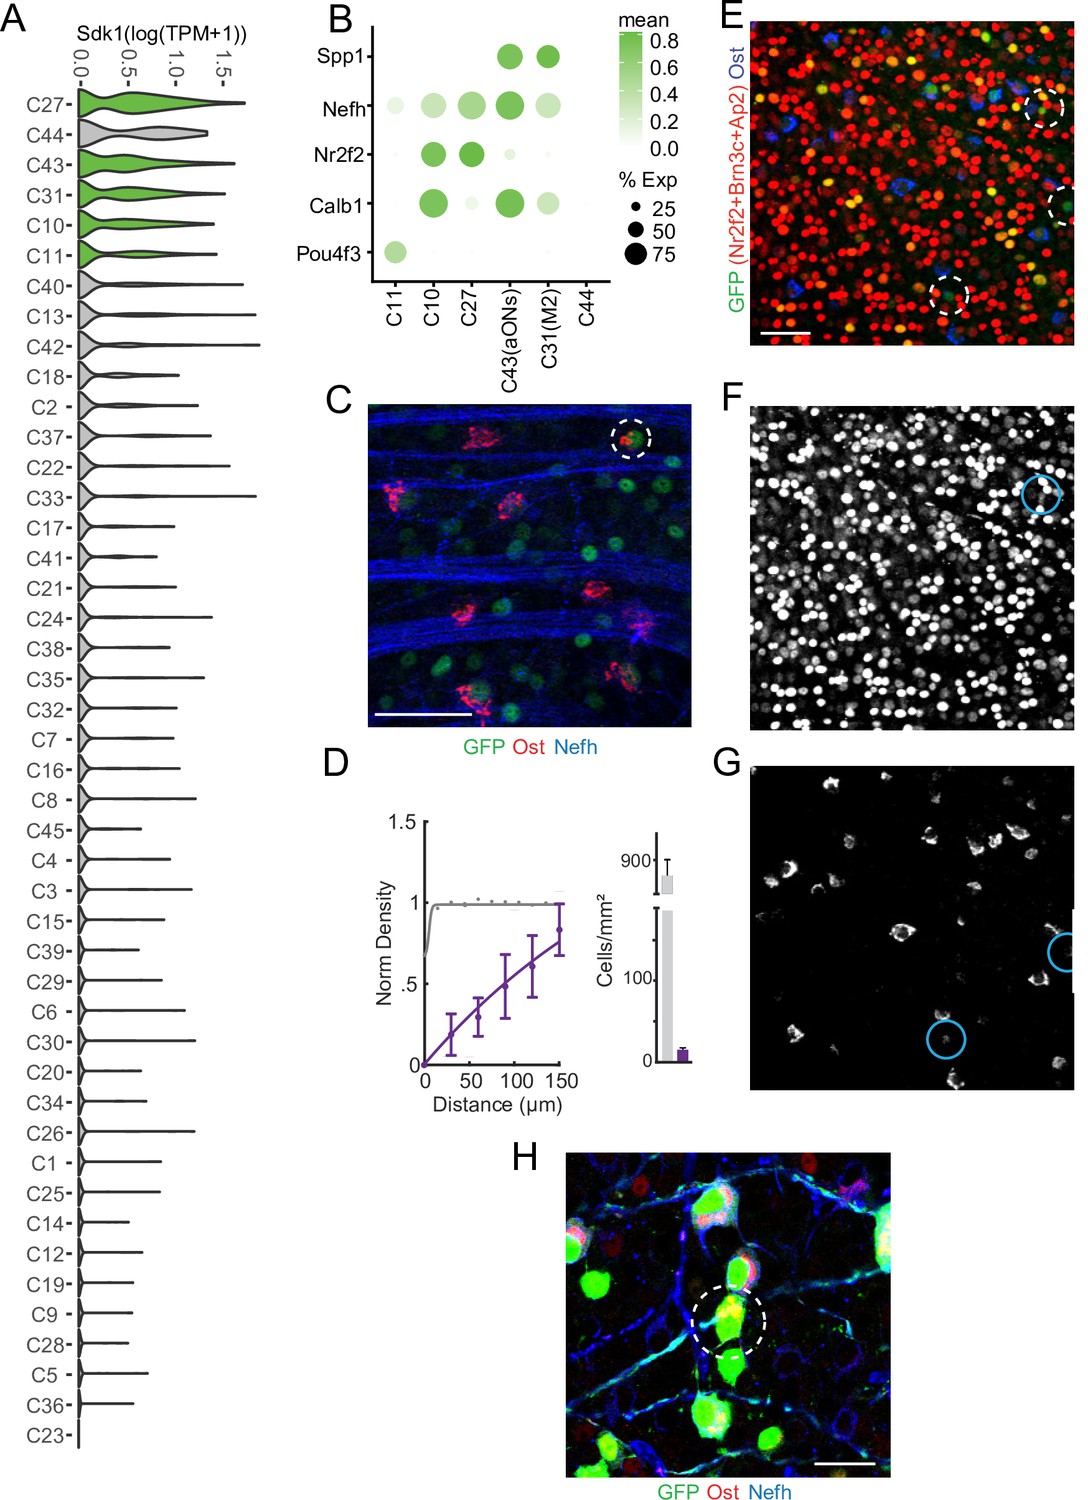
Molecular taxonomy of Sidekick-1-retinal ganglion cells (Sdk1-RGCs).
(A) Violin plots showing expression of Sdk1 extracted from a recently published RNAseq atlas of mouse RGCs (Tran et al., 2019). Violins are ordered according to mean Sdk1 expression. Colored violins indicate the RGCs in this study. (B) Dot plot showing mean expression of marker genes and fraction of expressing cells for Sdk1-RGCs generated from data in Tran et al., 2019. (C) GFP-stained sample Sdk1CG retinal whole mounts co-stained with antibodies to osteopontin (Ost) and neurofilament heavy chain (Nefh). Dotted circle highlights a single Ost+/Nefh- RGC. Scale = 50 μm. (D) Normalized density recovery profiles and average density of co-labeled RGCs measured from experiments like those shown in (C) (n = 13 fields from six animals). (E–G) Image of a Sdk1CG retinal whole-mount stained using a cocktail of antibodies against amacrine cells (AP2α), Brn3c, Nr2f2, Ost, and GFP (E), image of the marker cocktail alone (F), and Ost alone with dim marker-labeled cells encircled (G). Greater than 99% of GFP+ cells express the markers shown in (E) (six fields from three animals). Scale = 50 μm. (H) Whole-mount image showing an Ost+/Nefh- RGC amidst a field of other reporter labeled neurons in Sdk1CG/+ retinal whole mounts. Scale = 25 μm.
Figure 1—figure supplement 2
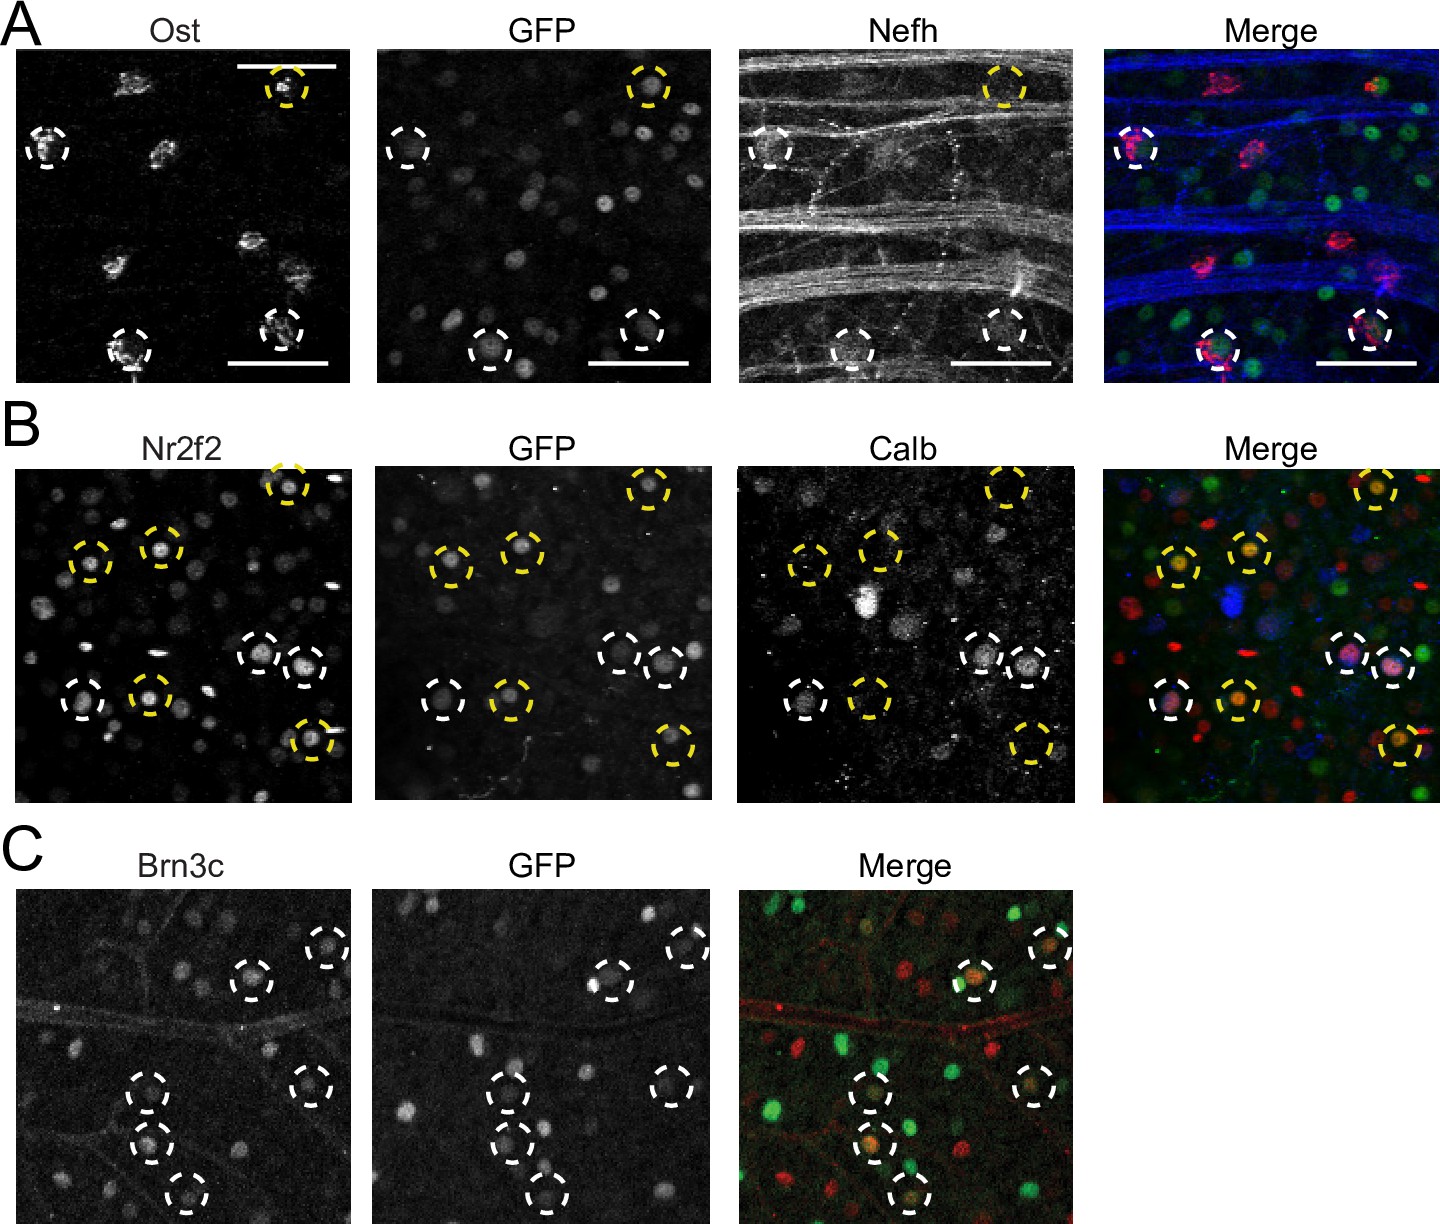
Marker gene histology for Sidekick-1-retinal ganglion cells (Sdk-RGCs).
(A–C) GFP-stained sample Sdk1CG retinal whole mounts co-stained with antibodies to osteopontin (Ost) and neurofilament heavy chain (Nefh), (A), Nr2f2 and calbindin (Calb) (B), and Brn3c (C). Dotted circles indicate co-labeled neurons. Same images as shown in Figure 1 with channels for the indicated protein shown individually for correspondence. Scale = 50 μm. White and yellow dotted circles highlight double- and triple-positive cells,.
Figure 1—figure supplement 3
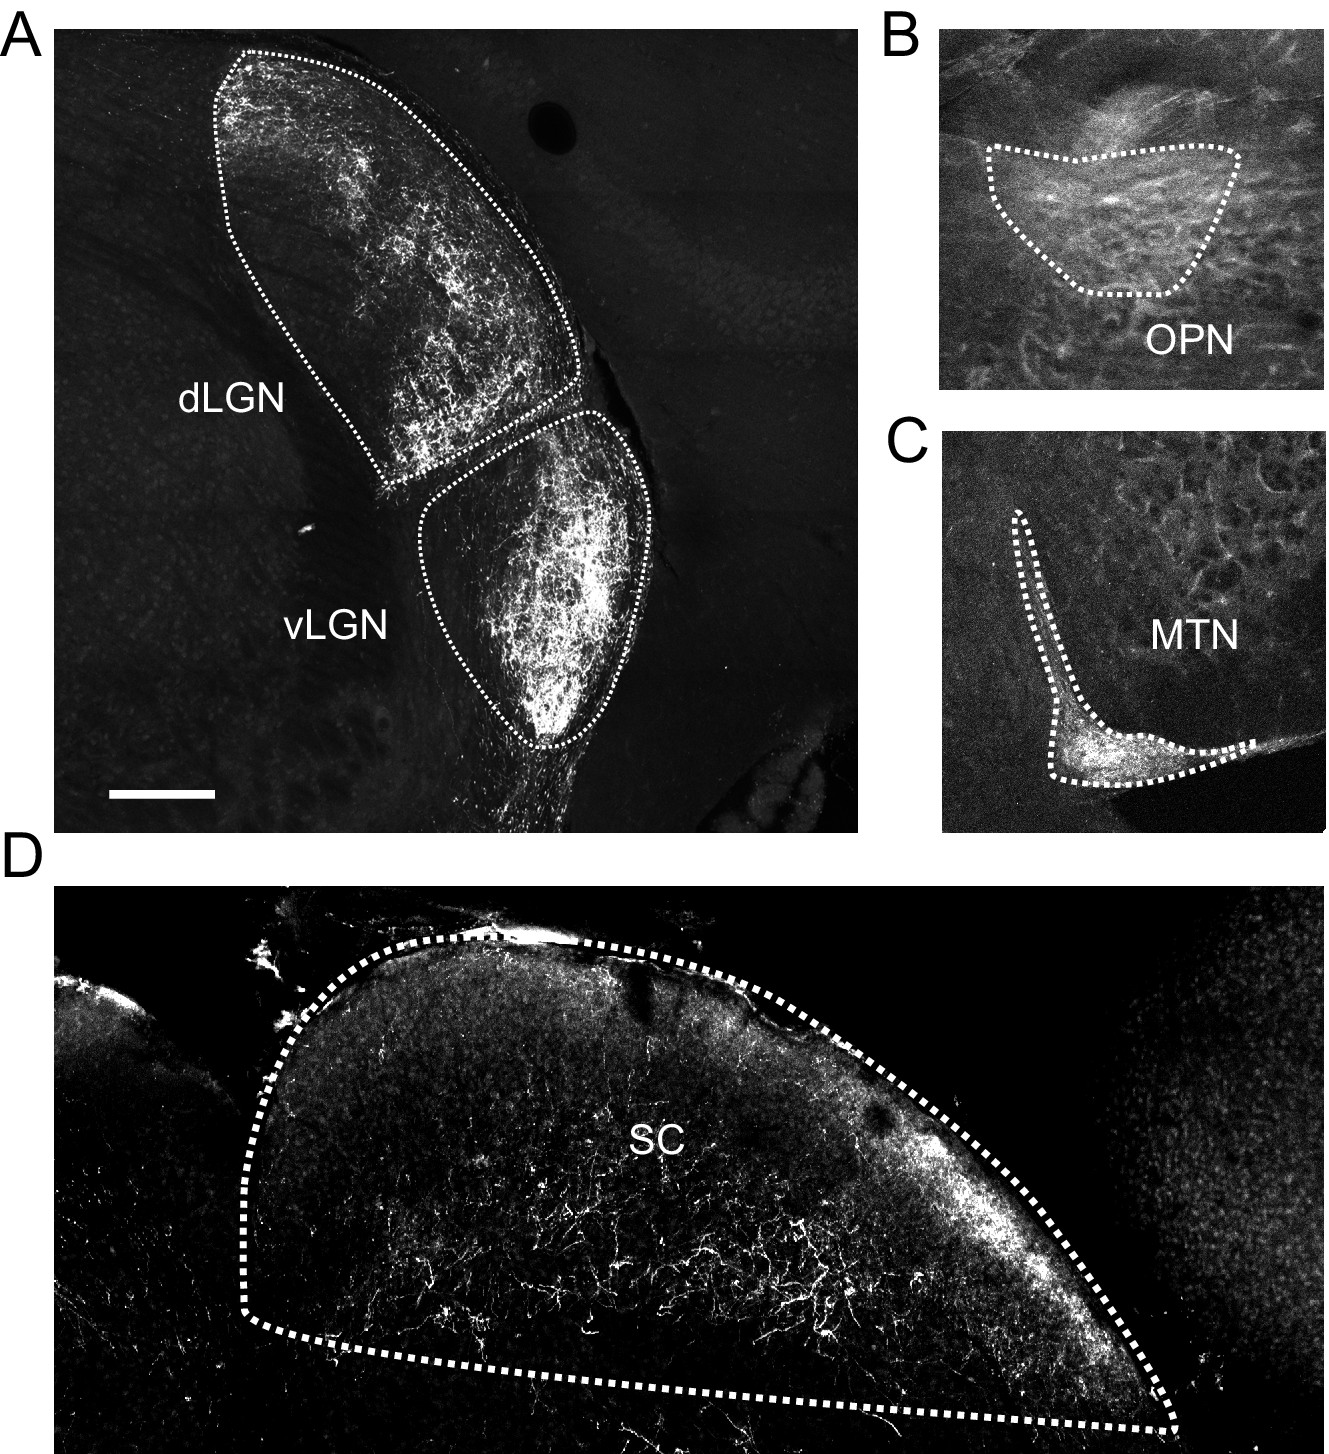
Sidekick-1-retinal ganglion cell (Sdk1-RGC) projections to retinorecipient areas.
(A–D) Magnified brain images taken from Sdk1CG mice intraocularly injected with Cre-dependent reporters showing Sdk1-RGC innervation in the dorsal (d) and ventral (v) compartments of the lateral geniculate nucleus (LGN) (A), the medial terminal nucleus (MTN) (B), olivary pretectal nuclei (OPN) (C), and superior colliculus (SC) (D). Scale = 100 μm.
Figure 1—figure supplement 4
Sidekick-1 (Sdk1) labels five kinds of interneurons.
(A–C) Images of Sdk1 amacrine cells in retinal whole mounts (top, scale = 50 μm) and cross-sections (middle, scale = 25 μm) and corresponding inner plexiform layer (IPL) linescans (bottom) showing two widefield types (A, B) and an A17-like waterfall type (C). (D, E) Images of bipolar cells (BCs) in retinal cross-sections taken from Sdk1CreER/+ mice crossed to reporters whose morphology matches rod BCs (D) or type 7 BCs (E). Arrowheads show BC axon arborization, and asterisks denote processes from sublamina-5-bound retinal ganglion cell (RGCs) and amacrine (ACs) whose somas are not included in this tissue section. Scale = 25 μm (n = 3–6 fields from 2 to 3 animals for each experiment).
Figure 2 with 2 supplements

Function of Sidekick-1 (Sdk1) circuits.
(A) Sample whole mount from a Sdk1CG retina infected with AAV-GCaMP6f labeled with the positions of a typical two-photon field (scale = 500 μm). Inset magnifies the boxed field after immunostaining and shows GCaMP-labeled Sdk1-RGCs (green) stained with Brn3c (red) and osteopontin (Ost, blue). (B–E) Magnified somata image, average full-field response, average bar response, sample polar plot, population direction-selective indices (DSI), and ON-OFF index for Ost+ (B, n = 107 cells from 18 retinae), Nr2f2+/Calb+ (C, n = 41 cells from 6 retinae), Nr2f2+/Calb- (D, n = 34 cells from 6 retinae), and Brn3c+ RGCs (E, n = 95 cells from 6 retinae). Raster above each averaged trace shows every response within each retinal ganglion cell (RGC) group. Each RGC shows a characteristic pattern of responses to stimuli. ON-OFF index distribution from a mouse line in which all RGCs express GCaMP6f (all RGCs; n = 1426 cells from five retinae) is shown for comparison. Vertical scales = z-score of 2. (F) Average DSI computed from bar stimuli moving at ~1000 μm/s (fast) or ~200 mm/s (slow) for each Sdk1-RGC group. Significance: **p<0.01; ***p<0.001. (G) Average orientation-selective indices computed from bar stimuli for each Sdk1-RGC group. (H) Average response magnitude to bars moving at ~1000 μm/s (fast) or ~200 mm/s (slow) for each Sdk1-RGC group. (I) Whole-mount retina from the Pcdh9-Cre line crossed to Cre-dependent reporter stained for Nr2f2 and Calb. Triple-labeled cells are encircled (scale = 50 μm).
Figure 2—figure supplement 1
Registration of stained and two-photon imaged retinal fields.
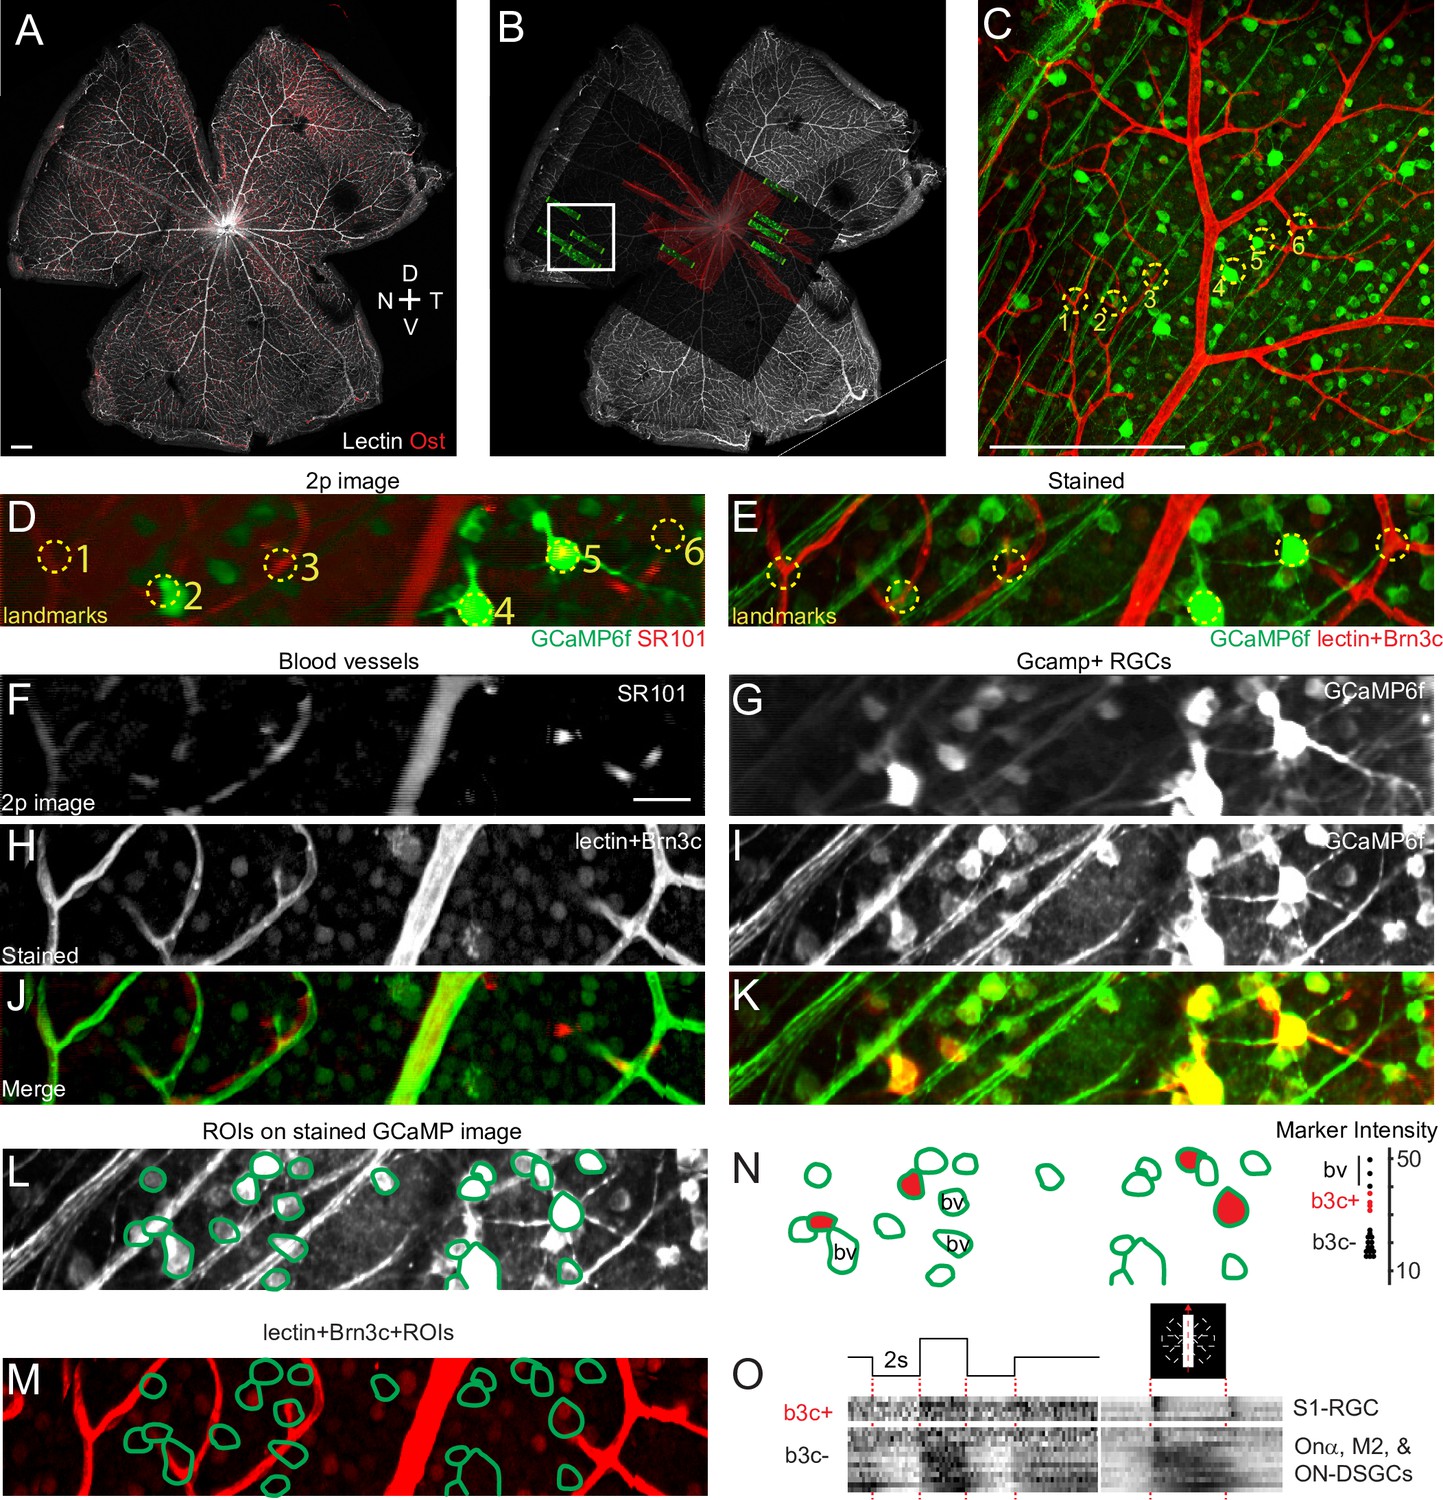
(A–C) Low-power whole-mount images of retinae stained with lectin and osteopontin (Ost) (A) with a superimposed map of calcium imaged fields from two-photon (2p) imaging (B) and a magnified image (C) of the boxed region in (B). Lectin staining helps align the two datasets, and Ost staining provides retinal orientation (scale = 500 μm). (D, E) Two-photon field containing the marked neurons in C (D) and confocal image of the same field following staining (E). (F–K) 2p and confocal images of sulphorhodamine (SR101) or lectin-stained blood vessels and Brn3c (F, H) and GCaMP6f+ RGCs (G, I) shown in (D) and (E) and a merge of each pair of images (J, K) showing overlap. (L, M) Example ROIs drawn on the stained retinal ganglion cell (RGC) field (L) were used to extract Brn3c marker intensity from a separate channel (M). (N) The same ROI contours from (L) with four RGCs showing high Brn3c expression (red) and blood vessel labeling (b.v.). Inset shows pixel intensity for each ROI with those containing high signal due to Brn3c (b3c) or blood vessel labeling indicated. (O) Mean RGC responses corresponding to the ROIs shown in (L) to a full-field flash and a bar moving in eight different directions. High-expressing Brn3c+ RGCs (S1-RGCs) and other Sdk1+ neurons (ONα, M2, ON-DSGCs, and dACs) are indicated. Scale = 50 μm.
Figure 2—figure supplement 2
Molecular markers define retinal ganglion cell (RGC) response clusters.
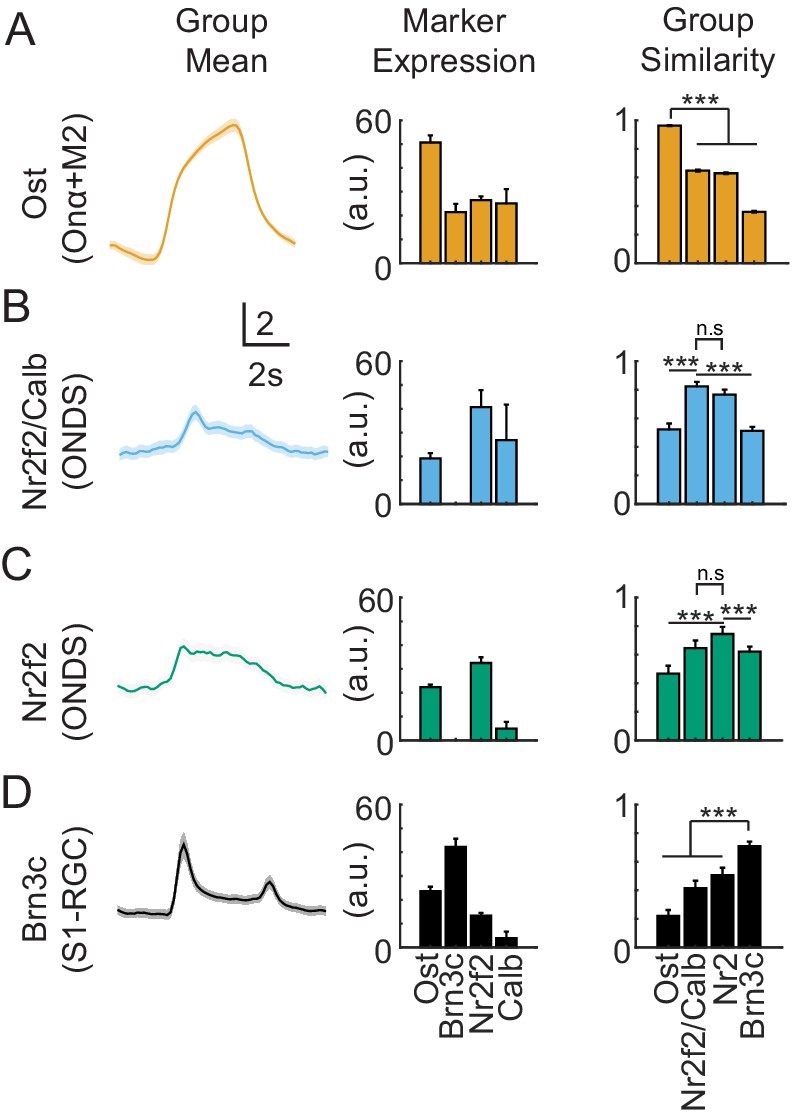
(A–D) Mean bar response, marker gene expression, and similarity for Ost+ (A), Nr2f2+/Calb+ (B), Nr2f2+/Calb- (C), and Brn3c+ RGC groups (D); vertical scale = z-score of 2. Group similarity bar graphs show the mean of the cosine similarity computed for traces in the osteopontin (Ost) (yellow), Nr2f2+/Calb+ (blue), Nr2f2+/Calb- (green), and Brn3c+ groups to the group mean listed on the x-axis. Traces are most similar to their group’s mean response versus the mean response for other groups (n values are the same as reported in Figure 2; significance: ***p<0.001).
Figure 3 with 1 supplement
Sidekick-1 (Sdk1) loss causes selective deficits in S1-RGCs.
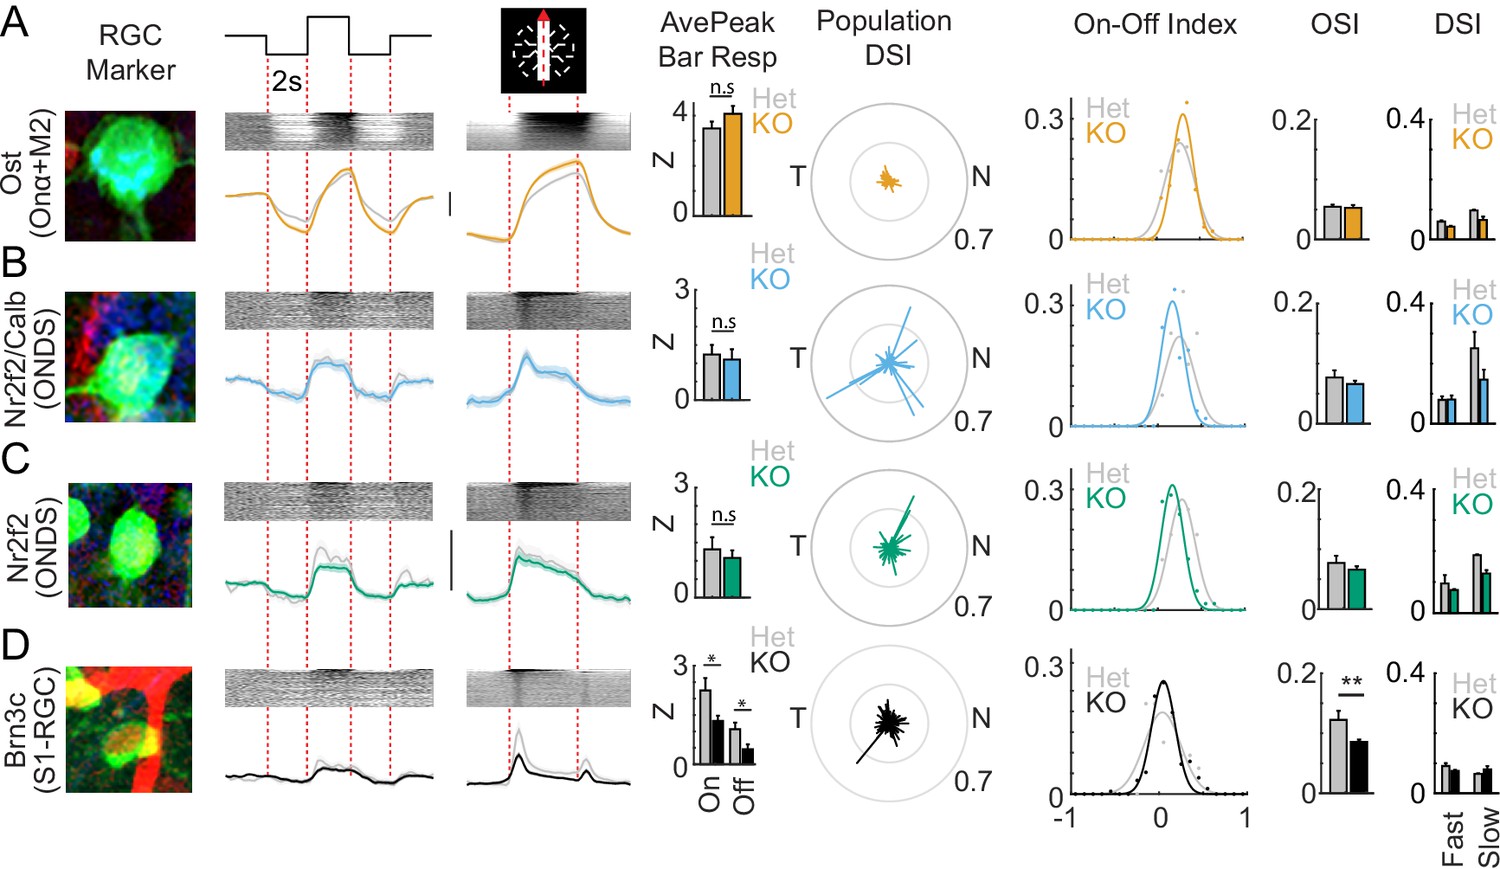
(A–D) Magnified somata image, average full-field response, average bar response, average peak response to bars, population direction-selective indices (DSI), ON-OFF index, mean orientation-selective index (OSI), and mean DSI corresponding to Ost+ (A, n = 97 cells from 10 retinae), Nr2f2+/Calb+ (B, n = 59 cells from 6 retinae), Nr2f2+/Calb- (C, n = 77 cells from 6 retinae), and Brn3c+ RGCs (D, n = 147 cells from 7 retinae) in Sdk1null retinae. Grayed traces and bars show the same measurements from Sdk1 heterozygotes (Het) (vertical scales = z-score of 2). Sdk1 loss alters Brn3c retinal ganglion cell (RGC) visual responses. Significance: *p<0.05.
Figure 3—figure supplement 1
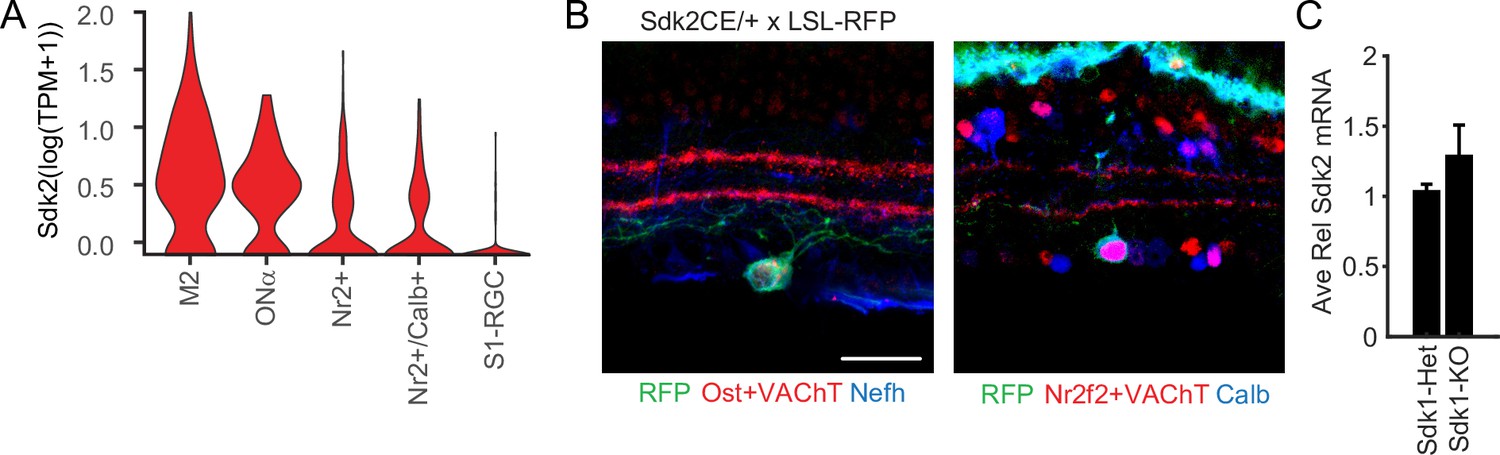
Expression of Sidekick-2 (Sdk2) in Sdk1-RGCs.
(A) Violin plots showing expression of Sdk2 extracted from a recently published RNAseq atlas of mouse retinal ganglion cell (RGC; Tran et al., 2019) for the Sdk1-RGCs in this study. Sdk2 expression is nearly absent in S1-RGCs. (B) Image of an Ost+/Nefh+ Onα-RGC and an Nr2f2+/Calb+ RGC in retinal cross-sections taken from Sdk2CreER/+ mice crossed with Cre-dependent reporters. Scale = 30 μm. (C) Bar graph showing mean Sdk2 transcript levels relative to GAPDH internal controls measured from whole Sdk1CreER/+ (Sdk1-Het) or Sdk1CreER/CreER (Sdk1-KO) retina quantitative PCR.
Figure 4 with 2 supplements
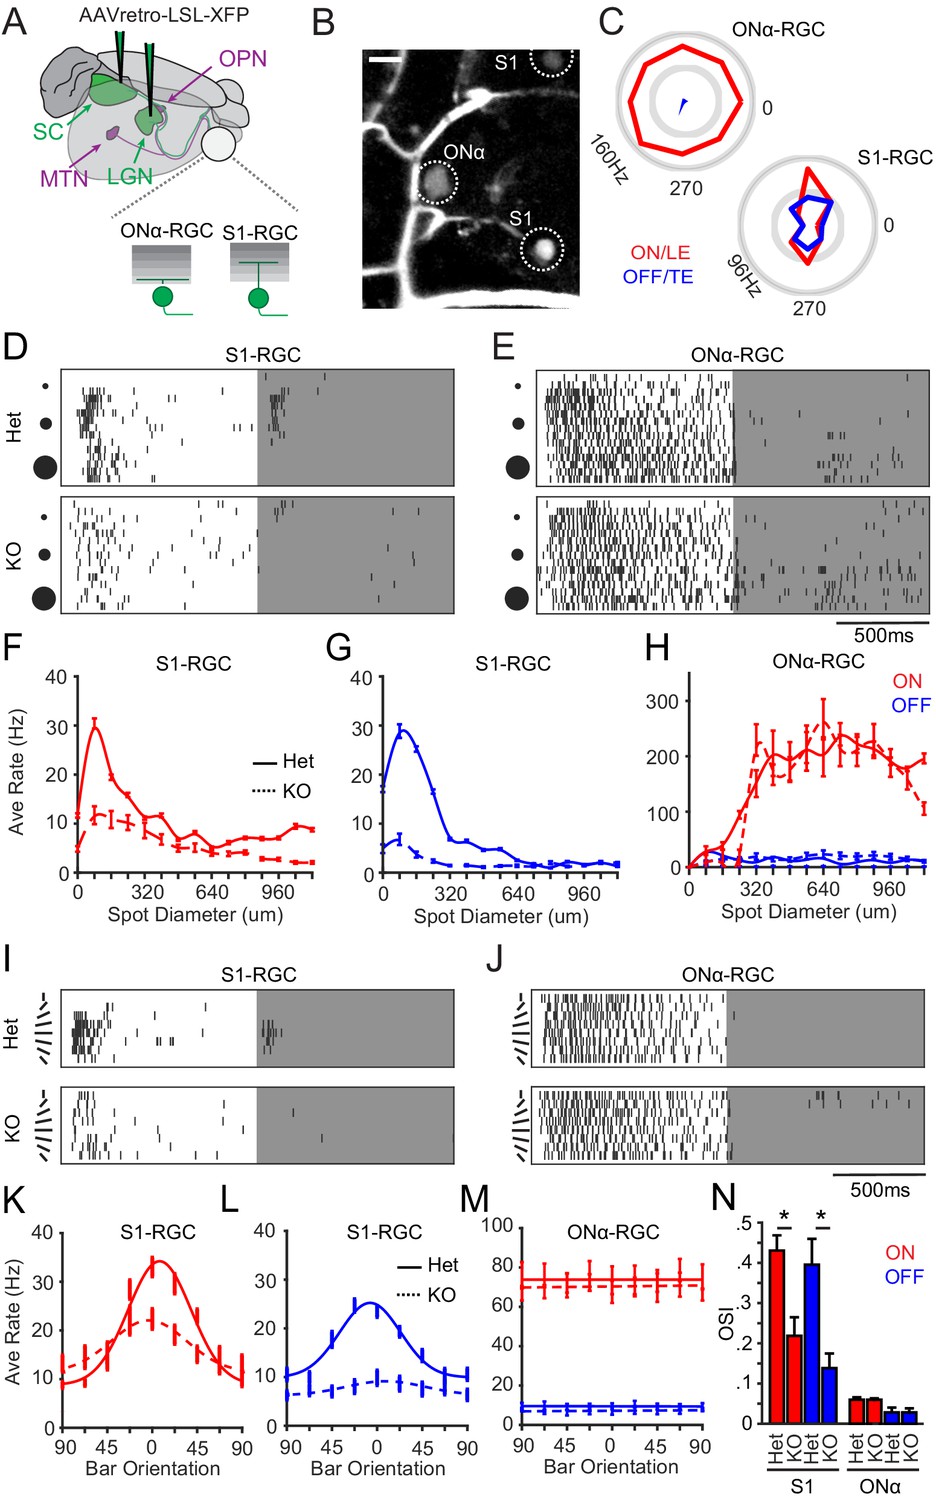
Selective loss of visual responses on S1-RGCs in the absence of Sidekick-1 (Sdk1).
(A) Cartoon of S1-RGCs and ONα-RGCs labeled by delivering retrogradely infecting AAVs bearing Cre-dependent reporters in the lateral geniculate nucleus (LGN) or superior colliculus (SC) of Sdk1CG mice. Targets of other Sdk1-RGCs that project to olivary pretectal nuclei (OPN) and medial terminal nucleus (MTN) are also shown. (B) Sample two-photon image of a Sdk1CG/+ retina labeled as described in (A) showing a large-soma ONα-RGC and a small-soma S1-RGC. Sulphorhodamine 101 labels vessels in the GCL. Scale = 25 μm. (C) Polar plots of spike responses to a bar moving in eight different directions recorded from example ONα- and S1-RGCs in experiments like those shown in (B). (D, E) Raster of spike responses to an expanding flashing spot recorded from example S1-RGCs (D) and Onα-RGCs (E) in Sdk1CG/+ (Het) or Sdk1CG/CG retinae (KO). (F, G) Average S1-RGCs firing rates versus bright (F) or dark (G) spot diameter measured from experiments like those shown in (D). (H) Average Onα-RGCs firing rate versus bright (ON) or dark (OFF) spot diameter measured from experiments like those shown in (E). (I, J) Raster of spike responses to centered dark or bright bar rotating through eight orientations recorded from S1-RGCs (I) and Onα-RGCs (J) in Sdk1CG/+ (Het) or Sdk1CG/CG retinae (KO). (K, L) Average firing rate versus bar orientation for S1-RGCs measured from experiments like those shown in (I). (M) Average firing rate versus bar orientation for ONα-RGCs measured from experiments like those shown in (J). (N) Average orientation selectivity indices computed for S1-RGC and ONα-RGC responses to the oriented bar stimulus in control (Het) and Sdk1-null (KO) retinae (n = 7 for Sdk1CG/+ ONα RGCs, n = 12 for Sdk1CG/+ Brn3c RGCs, n = 14 for Sdk1CG/CG Brn3c RGCs, n = 6 for Sdk1CG/CG ONα RGCs; *p<0.05). RGC: retinal ganglion cell.
Figure 4—figure supplement 1
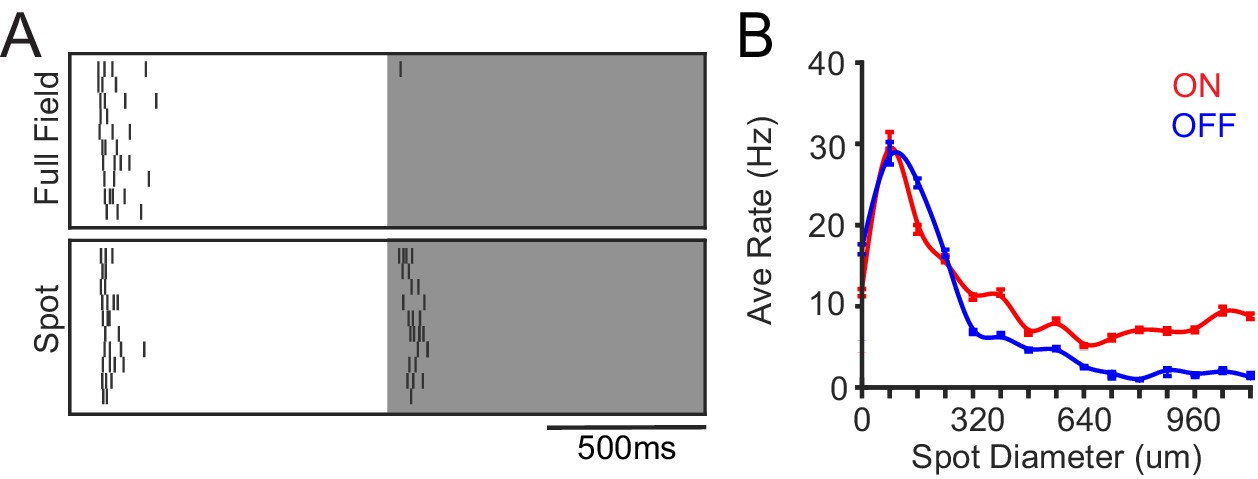
Visual responses of S1-RGCs to bright and dark stimuli.
(A) Raster of spike responses to a full-field and centered spot flash recorded from an example S1-RGC in Sdk1CG/+ (Het) retinae. (B) Average Sdk1 heterozygote S1-RGCs firing rates versus bright (F) or dark (G) spot diameter. Data replotted from Figure 4F and G. S1-RGCs are ON-dominated ON-OFF retinal ganglion cells.
Figure 4—figure supplement 2
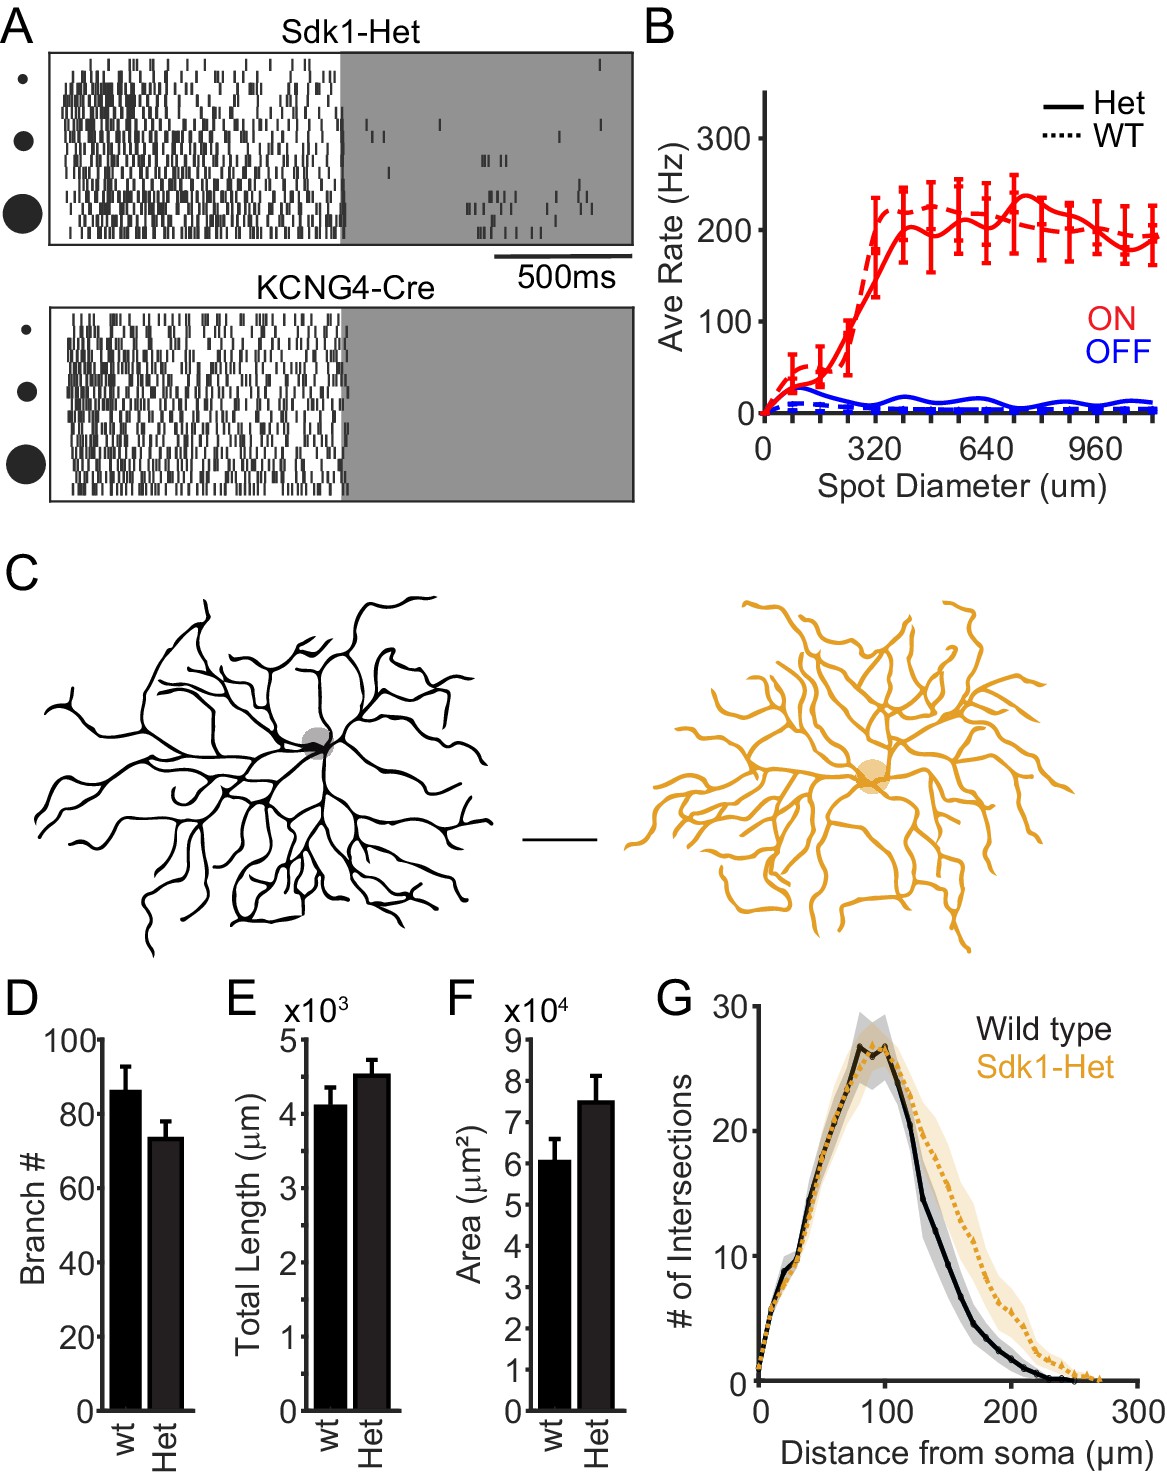
Physiology and anatomy of Sdk1+/+ Onα-RGCs.
(A) Raster of spike responses to an expanding flashing spot recorded from example Onα-RGCs in Sdk1CG/+ (Het) or KCNG4-Cre retinae (wild type). (B) Average Onα-RGCs firing rate versus bright (ON) or dark (OFF) spot diameter measured from experiments like those shown in (A). Heterozygote data replotted from Figure 4H (n = 7 Sdk1-Het Onα-RGCs and n = 6 wild-type Ona-RGCs). (C) Skeletonized ONα-RGC dendrites from wild-type (black) and Sdk1 heterozygote (yellow) retinae (scale bar = 50 μm). (D–F) Average branch number (D), cumulative branch Length (E), and dendritic area (F) measured from wild-type (wt) and Sdk1 heterozygote (Het) Onα-RGC dendritic arbors (L). (G) Sholl analysis of dendritic arbors measured from wild-type and Sdk1 heterozygote ONα-RGCs (n = 7 wild-type and n = 9 Sdk1-Het; *p<0.05; **p<0.01). RGC: retinal ganglion cell; Sdk1: Sidekick-1.
Figure 5 with 3 supplements
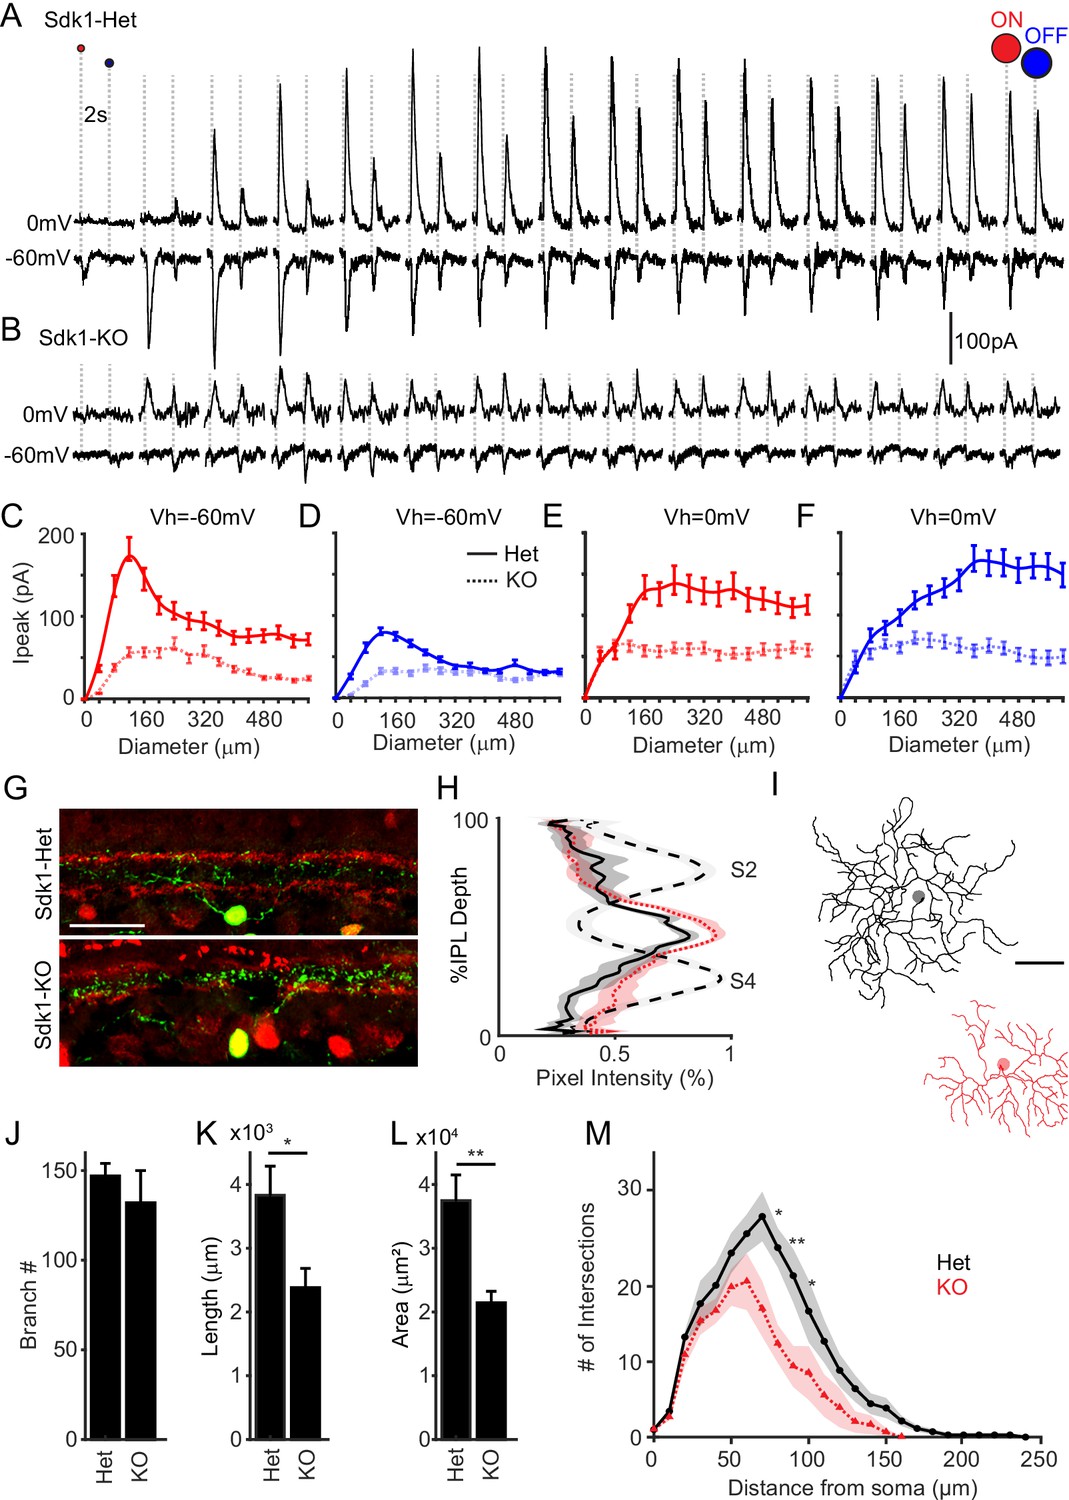
Sidekick-1 (Sdk1) loss causes S1-RGCs to lose synaptic inputs and dendritic arbor complexity.
(A–B) Whole-cell recordings from S1-RGCs held at potentials to isolate excitatory (~–60 mV) or inhibitory (~0 mV) currents to an expanding flashing spot in Sdk1CG/+ (Het) or Sdk1CG/CG retinae (KO). (C, D) Average peak current versus expanding bright (C) or dark (D) spot diameter measured from control or knockout S1-RGCs held at –60 mV in experiments like those shown in (A, B). (E, F) Average peak current versus expanding bright (E) or dark (F) spot diameter measured from control or knockout S1-RGCs held at –0 mV taken experiments like those shown in (A, B) (n = 8 for Sdk1-Het, n = 9 for Sdk1-KO). (G) Retinal cross-sections showing S1-RGCs in control (Het) Sdk1 knockout (KO) retinae. Scale = 50 μm. (H) Linescans through S1-RGC arbors in control in Sdk1 null retinae taken from experiments like those shown in (G). (I) Skeletonized S1-RGC dendrites from control (black) and Sdk1 null (red) retinae (scale = 50 μm). (J–L) Average branch number (J), cumulative branch length (K), and dendritic area (L) measured from control and Sdk1 null S1-RGC dendritic arbors. (M) Sholl analysis of dendritic arbors measured from Het and KO S1-RGCs (n = 8 for both Sdk1-Het and Sdk1-KO; *p<0.05; **p<0.01). RGC: retinal ganglion cell.
Figure 5—figure supplement 1
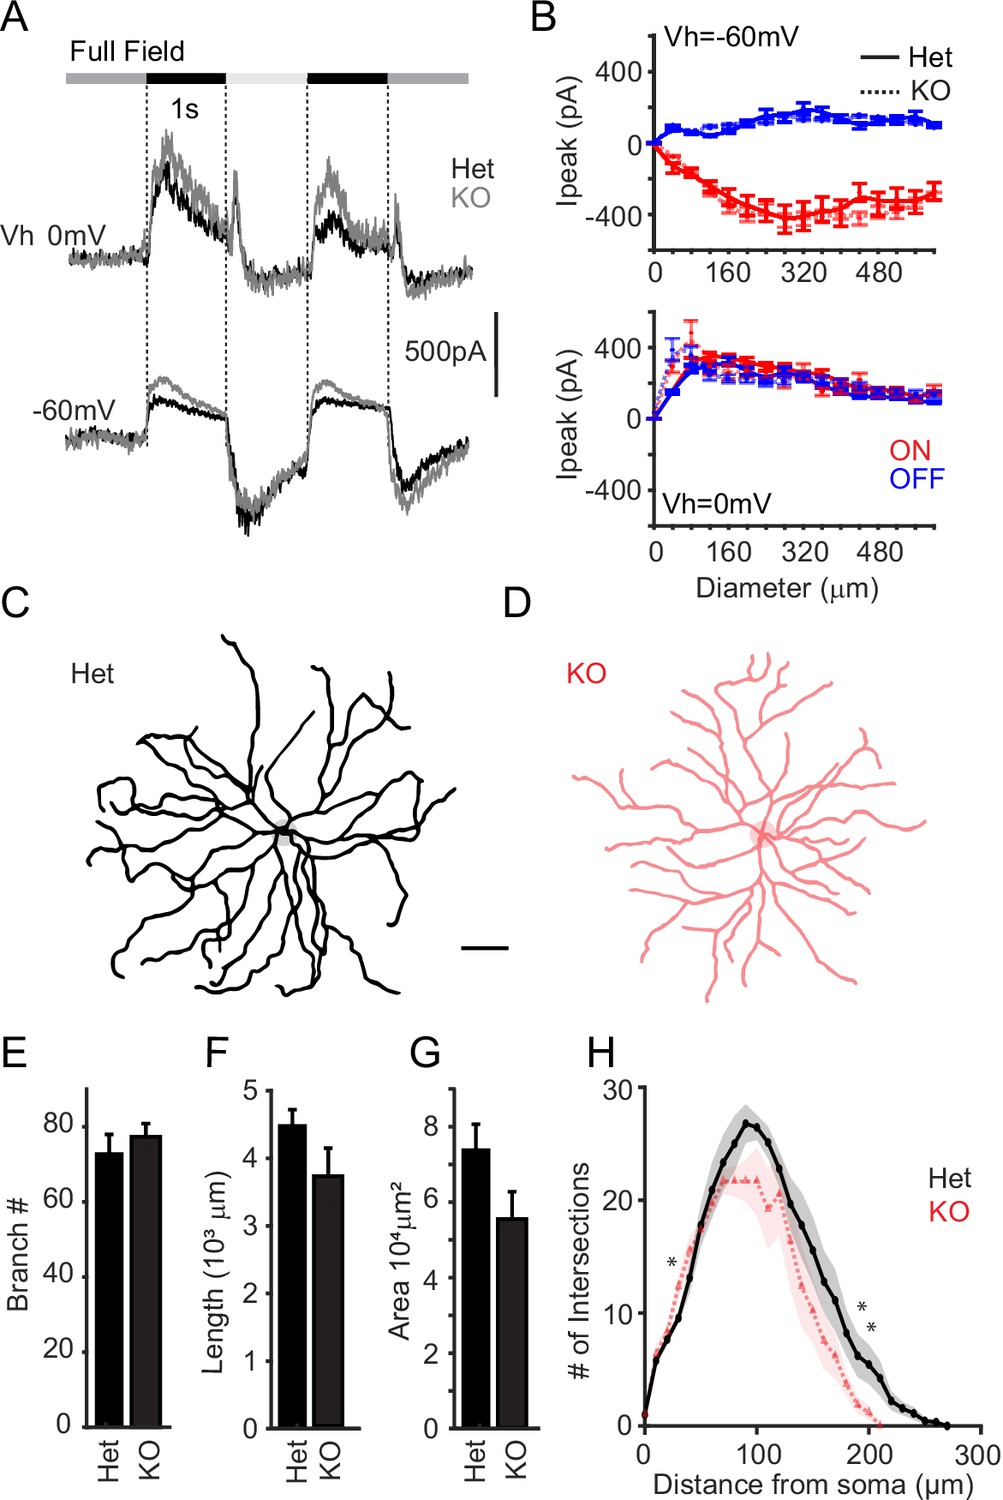
Sdk1+ Onα-RGC synaptic inputs and dendritic arbors in Sdk1 knockouts.
(A) Whole-cell recordings from ONα-RGCs held at potentials to isolate excitatory (~–60 mV) and inhibitory (~0 mV) synaptic currents to a full-field flash in Sdk1CG/+ (Het) or Sdk1CG/CG retinae (KO). (B) Average peak excitatory (~–60 mV, top) and inhibitory (~0 mV, bottom) currents versus expanding bright (ON) or dark (OFF) spot diameter measured from Het or KO ONα-RGCs presented with expanding spot stimuli (n = 4 for Sdk1-Het, n = 5 for Sdk1-KO). (C, D) Skeletonized ONα-RGC dendrites from control (black) and Sdk1 null (red) retinae (scale bar = 50 μm). (E–G) Average branch number (E), branch Length (F), and dendritic area (G) measured from control and Sdk1 null S1-RGC dendritic arbors (L). (H) Sholl analysis of dendritic arbors measured from Het and KO ONα-RGCs (n = 9 Sdk1-Het and n = 7 Sdk1-KO; *p<0.05; **p<0.01). RGC: retinal ganglion cell; Sdk1: Sidekick-1.
Figure 5—figure supplement 2
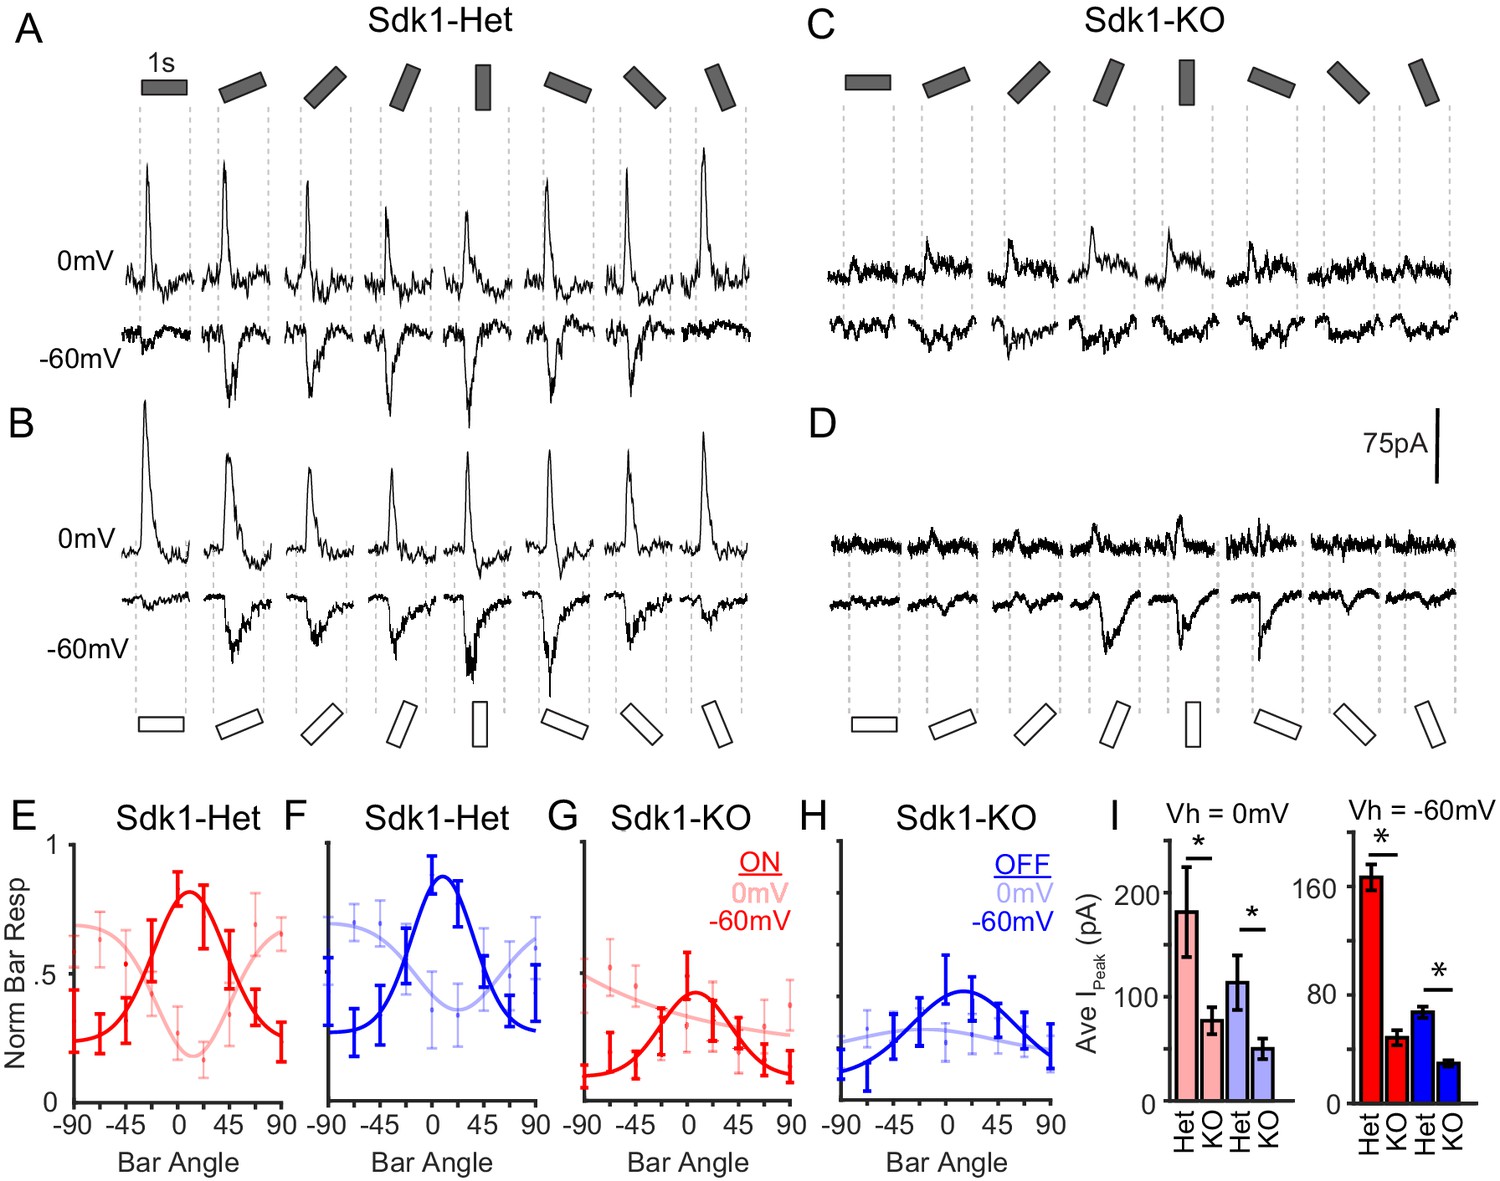
Synaptic currents evoked by oriented bars in control and Sdk1-null S1-RGCs.
(A–D) Sample whole-cell currents measured from S1-RGCs held at potentials to isolate excitatory (~–60 mV) and inhibitory (~0 mV) synaptic inputs to a dark (blue) or bright (red) bar that rotated through eight different angles in Sdk1CG/+ (Het) or Sdk1CG/CG retinae (KO). (E–H) Normalized responses versus the orientation of bright (E, G) or dark (F, H) bars presented to S1-RGCs in control (E, F) or KO (G, H) retinae. Y-values equal the stimulus-evoked charge integrated across the entire bar presentation time and normalized to the average maximum in controls. (I) Average peak current (Ipeak) evoked by bright (blue) or dark (red) bars for Het or KO S1-RGCs in the experiments shown in (A–D) (n = 8 for Sdk1-Het, n = 9 for Sdk1-KO; *p<0.05). RGC: retinal ganglion cell; Sdk1: Sidekick-1.
Figure 5—figure supplement 3
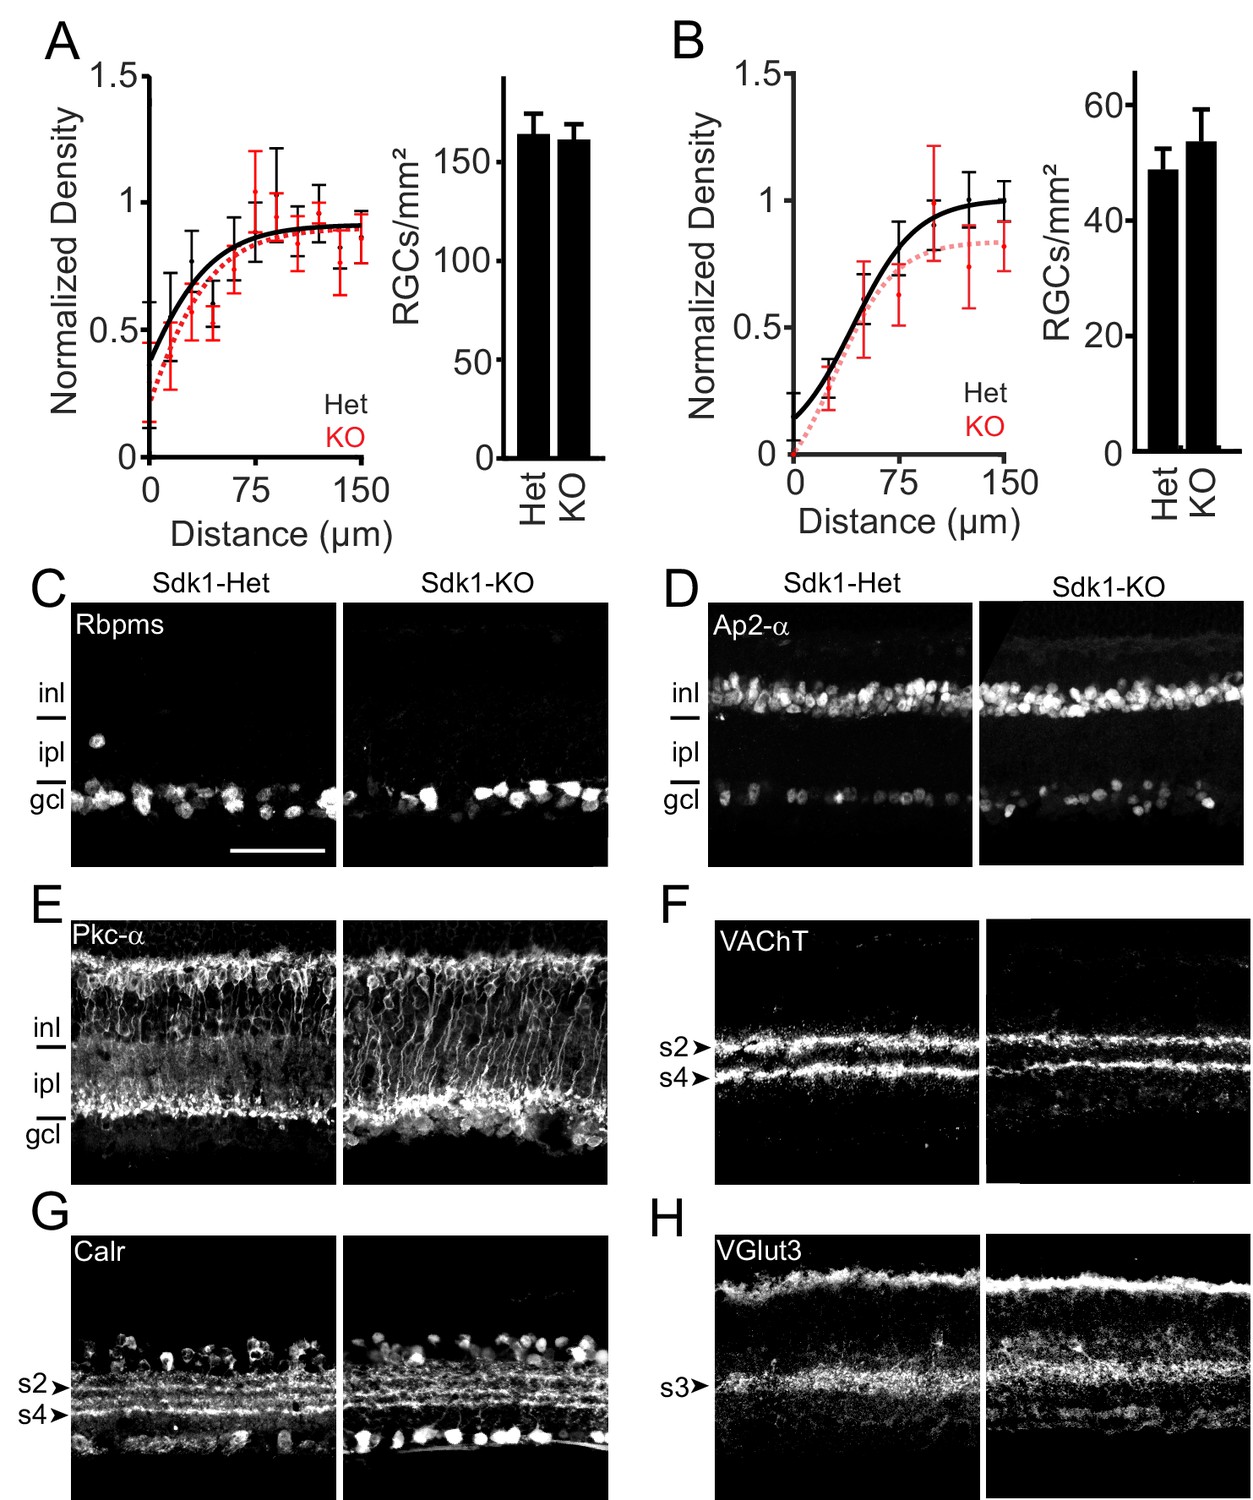
Onα- and S1-RGC spatial distribution and general inner plexiform layer (IPL) lamination in Sidekick-1 (Sdk1 null retinae).
(A, B) Normalized density recovery profiles (left) and average density of S1-RGC (A) and Onα-RGCs (B) measured from Sdk1CG/+ (Het) and Sdk1CG/CG (KO) retinae. (C–H) Sample retinal cross-sections stained with antibodies to RBPMS (C), Ap2-α (D), Pkc-α (E), VAChT (F), calretinin (G), and VGlut3 (H) taken from Sdk1CG/+ (Sdk1-Het) or Sdk1CG/CG retinae (Sdk1-KO) (scale = 50 μm). RGC: retinal ganglion cell. Major cellular layers: ganglion cell layer (gcl), inner nuclear layer (inl) are indicated.
Tables
Key resources table
| Reagent type (species) or resource | Designation | Source or reference | Identifiers | Additional information |
|---|---|---|---|---|
| Strain, strain background (Mus musculus) | Sdk1-CreGFP, Sdk1CG | Krishnaswamy et al., 2015 (doi: 10.1038/nature14682) | ||
| Strain, strain background (M. musculus) | Sdk2-CreER, Sdk1CreER | Krishnaswamy et al., 2015 (doi: 10.1038/nature14682) | ||
| Strain, strain background (M. musculus) | Sdk1-CreER, Sdk2CreER | Krishnaswamy et al., 2015 (doi: 10.1038/nature14682) | ||
| Strain, strain background (M. musculus) | KCNG-Cre | Jackson Laboratory | RRID:IMSR_JAX:016963 | |
| Strain, strain background (M. musculus) | Ai27D-ChR2-tdTomato | Jackson Laboratory | RRID:IMSR_JAX:012567 | |
| Strain, strain background (M. musculus) | Slc17a6-Cre | Jackson Laboratory | RRID:IMSR_JAX 016963 | |
| Strain, strain background (M. musculus) | Pcdh9-Cre | Mutant Mouse Research and Resource Centers | RRID:MMRRC_036084-UCD | Tissue donated by Yonehara K |
| Strain, strain background (M. musculus) | GCaMP6f | Jackson Laboratory | RRID:IMSR_JAX 024105 | |
| Sequence-based reagent | Sdk2-F | IDT | AssayID: Mm.PT.58.41577551 | GCTGTCCG TAAAGAAC TCCTT |
| Sequence-based reagent | Sdk2-R | IDT | AssayID: Mm.PT.58.41577551 | ATGAGGTCG TTGTACTTGGTG |
| Sequence-based reagent | Gapdh-F | Kechad et al., 2012 (doi: 10.1523/JNEUROSCI.4127-12.2012) | Accession#:NM 008084.2 | TGCAGTGGCA AAGTGGAGATdonated by Cayouette M |
| Sequence-based reagent | Gapdh-R | Kechad et al., 2012 (doi: 10.1523/JNEUROSCI.4127-12.2012) | Accession#:NM 008084.2 | ACTGTGCCG TTGAATTTGCCdonated by Cayouette M |
| Commercial assay or kit | RNeasy Mini-kit | Qiagen | Cat#:74134 | |
| Commercial assay or kit | EZ DNAse | ThermoFisher | Cat#:11766050 | |
| Commercial assay or kit | SuperScriptIV VILO master mix | ThermoFisher | Cat#:11756050 | |
| Commercial assay or kit | PowerUp SYBR Green Master Mix | ThermoFisher | Cat#:A25741 | |
| Recombinant DNA reagent | AAVrg CAG-flex-GCaMP6f | Neurophotonics Platform Canadian Neurophotonics Platform Viral Vector Core Facility | RRID:SCR_016477 | |
| Recombinant DNA reagent | AAV9 CAG-flex-GCaMP6f | Canadian Neurophotonics Platform Viral Vector Core Facility | RRID:SCR_016477 | |
| Recombinant DNA reagent | AAV9 ef1a-flex-Tdtomato | Canadian Neurophotonics Platform Viral Vector Core Facility | RRID:SCR_016477 | |
| Recombinant DNA reagent | AAVrg-flex-Tdtomato | AddGene | Cat#:28306-AAVrg | |
| Antibody | Anti-DsRed (rabbit polyclonal) | Clontech Laboratories | RRID:AB_10013483 | IF(1/1000) |
| Antibody | Anti-GFP (chicken polyclonal) | Abcam | RRID:AB_300798 | IF(1/1000) |
| Antibody | Anti-Nr2f2 (mouse monoclonal) | Abcam | RRID:AB_742211 | IF(1/1000) |
| Antibody | Anti-Brn3c (mouse monoclonal) | Santa Cruz Biotechnology | RRID:AB_2167543 | IF(1/250) |
| Antibody | Anti-Nefh (mouse monoclonal) | BioLegend | RRID:AB_2314912 | IF(1/1000) |
| Antibody | Anti-calbindin | Swant | RRID:AB_2314070 | IF(1/10 000) |
| Antibody | Goat anti-osteopontin | R&D Systems | RRID:AB_2194992 | IF(1/1000) |
| Antibody | Goat anti-VAChT (goat polyclonal) | MilliporeSigma | RRID:AB_2630394 | IF(1/1000) |
| Antibody | Anti-calretinin (rabbit polyclonal) | MilliporeSigma | RRID:AB_94259 | IF(1/2000) |
| Antibody | Anti-vGlut3 (guinea pig polyclonal) | MilliporeSigma | RRID:AB_2819014 | IF(1/2000) |
| Antibody | Pig anti-RBPMS (guinea pig polyclonal) | Phosphosolutions | RRID:AB_2492226 | IF(1/100) |
| Antibody | Anti-Chx10 (goat polyclonal) | Santa Cruz Biotechnology | RRID:AB_2216006 | IF(1/300) |
| Antibody | Anti-Ap2-α (mouse monoclonal) | Developmental Studies Hybridoma Bank | Clone:3b5 | IF(1/100) |
| Antibody | Donkey anti-rabbit Alexa Fluor 405 | Abcam | RRID:AB_2715515 | IF(1/1000) |
| Antibody | Donkey anti-chicken Alexa Fluor 488 | Cedarlane | RRID:AB_2340375 | IF(1/1000) |
| Antibody | Donkey anti-goat FITC | MilliporeSigma | RRID:AB_92588 | IF(1/1000) |
| Antibody | Donkey anti-rabbit Cy3 | MilliporeSigma | RRID:AB_92588 | IF(1/1000) |
| Antibody | Donkey anti-guinea pig Cy3 | Jackson ImmunoResearch | RRID:AB_2340460 | IF(1/500) |
| Antibody | Donkey anti-goat Cy3 | MilliporeSigma | RRID:AB_92570 | IF(1/1000) |
| Antibody | Donkey anti-mouse Alexa Fluor 647 | MilliporeSigma | RRID:AB_2687879 | IF(1/1000) |
| Chemical compound, drug | Isolectin | Fisher Scientific | RRID:SCR_014365 | IF(1/200) |
| Chemical compound, drug | Sulphorhodamine 101 | MilliporeSigma | Cat#:S7635 | .2 mg/mL |
| Chemical compound, drug | Tamoxifen | MillliporeSigma | Cat#:T5648 | ~1 g/50 g body weight |
| Chemical compound, drug | Fluorescein 3000 MW dextran | Thermo Scientific | Cat#:D7156 | |
| Chemical compound, drug | QX314 Bromide | Tocris | Cat#:1014 | 5 mM |
| Chemical compound, drug | Ames Medium | MilliporeSigma | Cat#:A1420 | |
| Software, algorithm | ImageJ | Fiji | https://imagej.net/Fiji | |
| Software, algorithm | MATLAB | Simulink | https://www.mathworks.com/products/matlab.html | |
| Software, algorithm | Simple Neurite Tracer | https://imagej.net/plugins/snt/ | RRID:SCR_016566 | |
| Software, algorithm | Trees Toolbox | https://www.treestoolbox.org/ | RRID:SCR_010457 | |
| Software, algorithm | RStudio | RStudio | https://rstudio.com | |
| Software, algorithm | ggplot2 | https://ggplot2.tidyverse.org/ | RRID:SCR_014601 |
Additional files
Download links
A two-part list of links to download the article, or parts of the article, in various formats.
Downloads (link to download the article as PDF)
Open citations (links to open the citations from this article in various online reference manager services)
Cite this article (links to download the citations from this article in formats compatible with various reference manager tools)
The cell adhesion molecule Sdk1 shapes assembly of a retinal circuit that detects localized edges
eLife 10:e70870.
https://doi.org/10.7554/eLife.70870


