Respiration aligns perception with neural excitability
- Institute for Biomagnetism and Biosignal Analysis, University of Münster, Germany
- Otto Creutzfeldt Center for Cognitive and Behavioral Neuroscience, University of Münster, Germany
- Institute of Psychology, University of Münster, Germany
- Centre for Cognitive Neuroimaging, Institute of Neuroscience and Psychology, University of Glasgow, United Kingdom
Figures
Figure 1 with 1 supplement
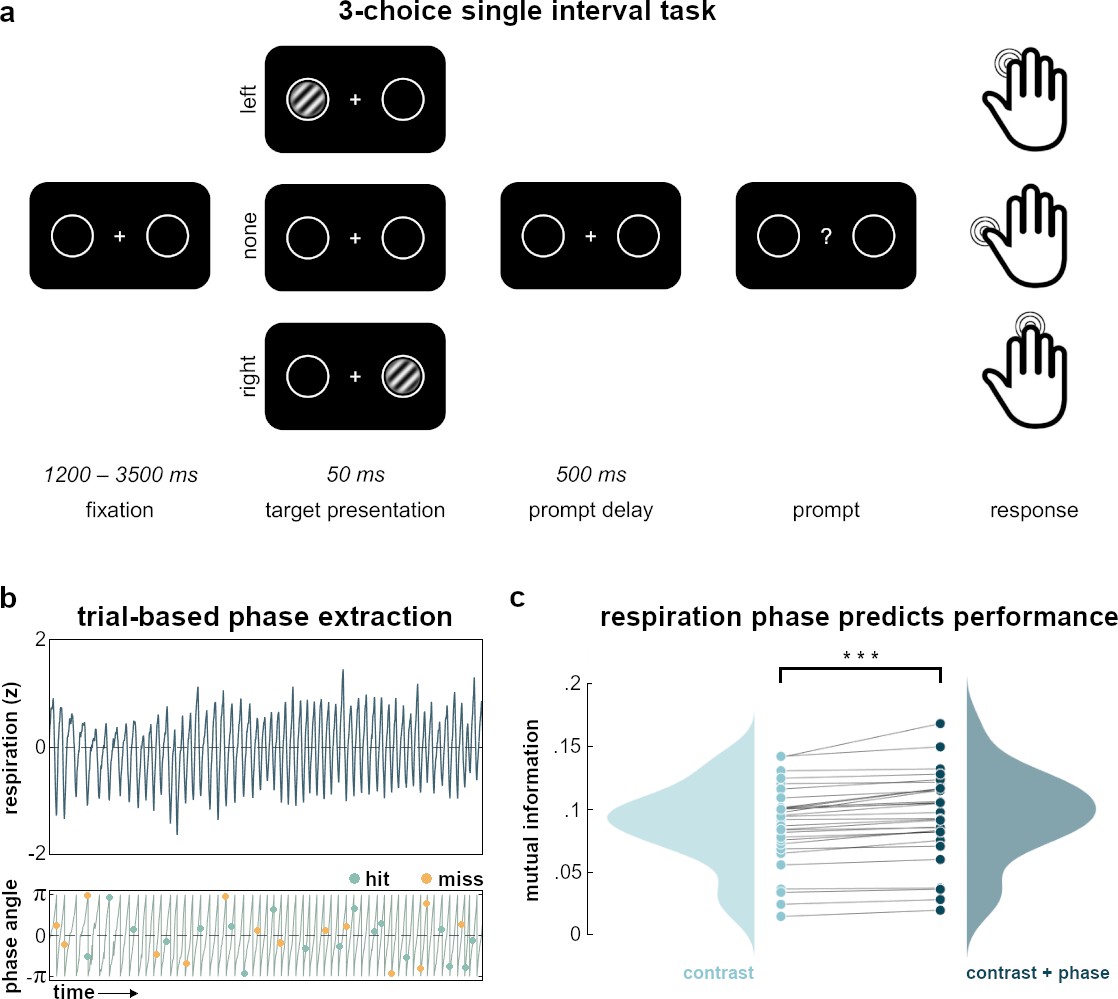
Task and behavioral results.
(a) In the experimental task, participants kept their gaze on a central fixation cross while a brief, near-threshold Gabor patch (magnified for illustrative purposes) was randomly presented either on the left or the right side of the screen. During catch trials, no stimulus was presented. After a brief delay, participants were prompted to indicate whether they had seen a stimulus on the left (index finger) or on the right side (middle finger), or no stimulus at all (thumb). (b) Exemplary segment of respiration recordings (normalized, top) plotted against its phase angle (bottom). Over time, targets were randomly presented over the respiration cycle and could be either detected (hits, green) or undetected (miss, yellow). (c) Raincloud plots show mutual information between task performance and stimulus contrast (left) and stimulus contrast plus respiration phase (right), respectively. Each dot for contrast or contrast+ phase represents one participant’s mutual information value computed across all trials for the respective condition. Links between dots identify mutual information values from the same participant and illustrate the increase in mutual information when respiration phase is included in its computation: Mutual information was significantly enhanced by adding respiration phase (Wilcoxon signed-rank test: z=4.78, p<0.001). Filled curves represent the respective probability density functions of mutual information values across participants. Raincloud plots generated with the RainCloudPlots toolbox for Matlab (Allen et al., 2019b).
Figure 1—figure supplement 1
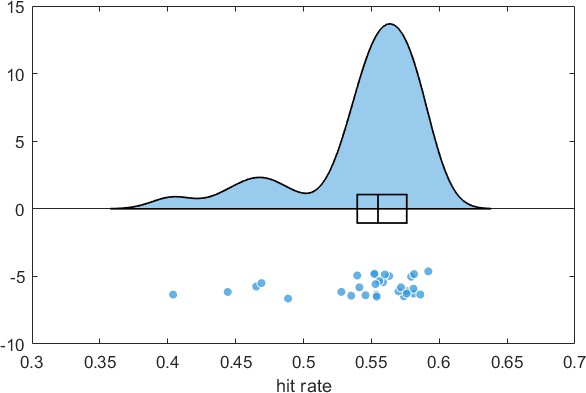
Group-level distribution of individual hit rates across all trials.
Figure 2 with 2 supplements

Respiration phase modulates performance.
(a) The first 20 trials of each run were discarded to allow initiation of the QUEST staircase (inset shows contrast variation of the full run). Extending the behavioral analysis shown in Figure 1, we obtained contrast values and respiration phase angle of hits (green) and misses (orange). Catch trials did not inform the QUEST staircase and are not shown. (b) Top panel shows the contrast values of all hit and miss trials of one exemplary participant sorted by the respiration phase angle at which the targets were presented. Moving along the respiration cycle (bottom) in increments of π/30, we applied a moving window with a width of π/5 to select a subset of trials for a phase-locked refitting of the psychometric function. Phase angles from −π to 0 covered inspiration whereas the range from 0 to π was expiration. (c) The psychometric function was first fitted to the full data set (black function, shown here for one typical participant). All parameters except the threshold were then fixed and used as priors for fitting the psychometric function iteratively to an angle-specific subset of trials (gray functions). Blue dots mark clusters of single trials scaled by frequency of occurrence. For each participant, the procedure of trial selection and refitting was repeated 60 times until all trials from all respiration phase angles had been sampled (see panel (b)). Vertical gray lines indicate the respective thresholds of refitted psychometric functions, whose variation is shown in the inset. (d) Histogram shows the empirical LMEM weight for the respiratory vector norm against the null distribution computed from 5000 iterations of randomized PsychF vectors on the subject level. (e) The moving window approach resulted in individual courses of PsychF threshold over respiration angles whose normalized mean is shown here ± SEM (top panel, black line, and shading). These modulations corresponded to contrast value changes within the range of [0.64–0.80] (5th and 95th percentile, respectively). Bottom panel shows t values from cluster-permutation testing. On the group level, PsychF threshold was significantly lowered during the inspiratory phase (covering a respiration phase angle between –128° and –76°, see main text).
Figure 2—figure supplement 1

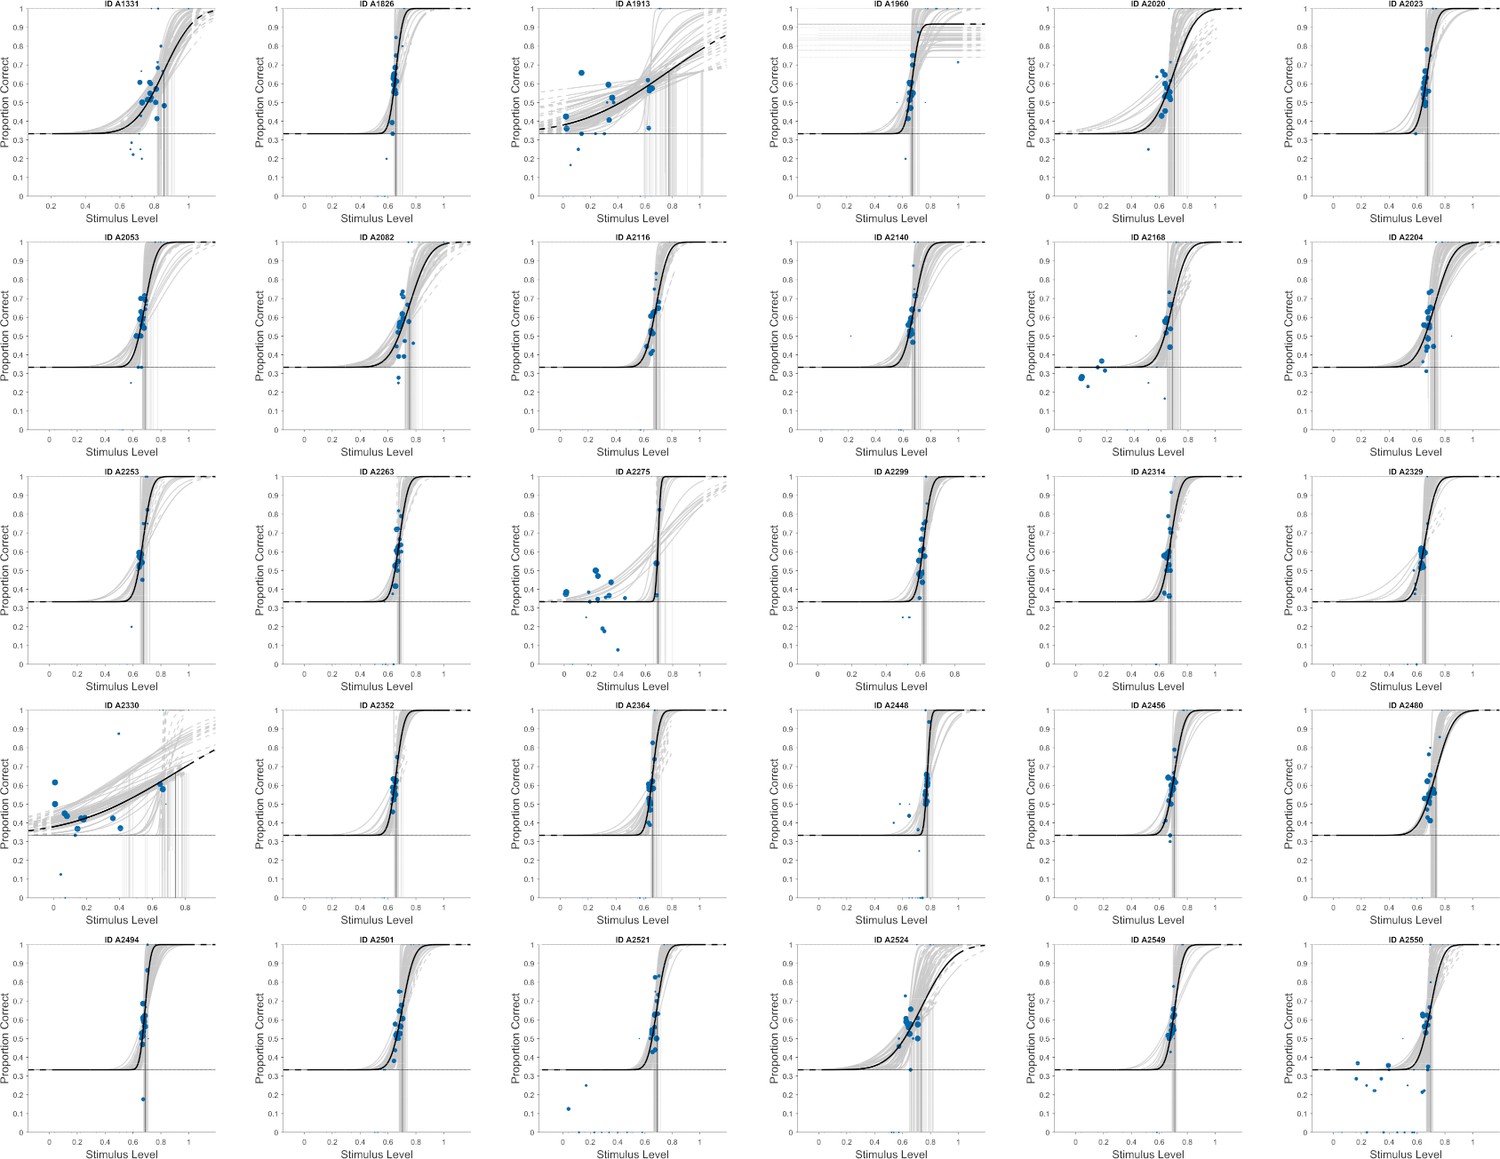
Individual psychometric functions (PsychF), fitted on the full data set.
For each participant, PsychF changes across the respiration cycle were assessed by subsequently fixing all parameters except the PsychF threshold (vertical lines) and refitting the PsychF on subsets of trials falling into one of n=60 respiration phase bins (exemplified in Figure 2b of the main manuscript).
Figure 2—figure supplement 2
Individual PsychF thresholds, iteratively refitted across respiration phase bins.
The psychometric function was first fitted to the full data set (black function). All parameters except the threshold were then fixed and used as priors for fitting the psychometric function iteratively to an angle-specific subset of trials (gray functions). Blue dots mark clusters of single trials scaled by frequency of occurrence. Trial selection and refitting were repeated 60 times until all trials from all respiration phase angles had been sampled. Vertical gray lines indicate the respective thresholds of refitted psychometric functions.
Figure 3 with 1 supplement

Pre- and peristimulus alpha suppression determine perceptual accuracy.
(a) Frequency spectra show prestimulus alpha suppression (interval [–1 0] s before target onset) for detected (hits, green) versus undetected targets (misses, yellow) averaged over bilateral parieto-occipital sensors (see inset). (b) Left panel shows the topographic distribution of normalized prestimulus power differences between detected and undetected targets (i.e., hits and misses). ROI channels with significant alpha-band differences (computed between [Arnal and Giraud, 2012; Busch and VanRullen, 2010] 8–13 Hz) for the contrast hits> misses are marked. Right panel shows the corresponding group-level t values from cluster-corrected permutation testing. Significant channels are marked for reference. (c) TFR shows power difference for the contrast hits> misses averaged across ROI sensors. Differences were computed on a frequency range of 5–40 Hz within a time frame of [–1 0.2] s around target onset, red frame indicates alpha frequencies (8–13 Hz). (d) Population statistic quantifying TFR differences (see panel (c)) on the sensor level. For each frequency at each time point, the heatmap illustrates which ratio of the n=82 ROI channels showed a significant difference for the contrast hits> misses (cluster-corrected, see main text).
Figure 3—figure supplement 1
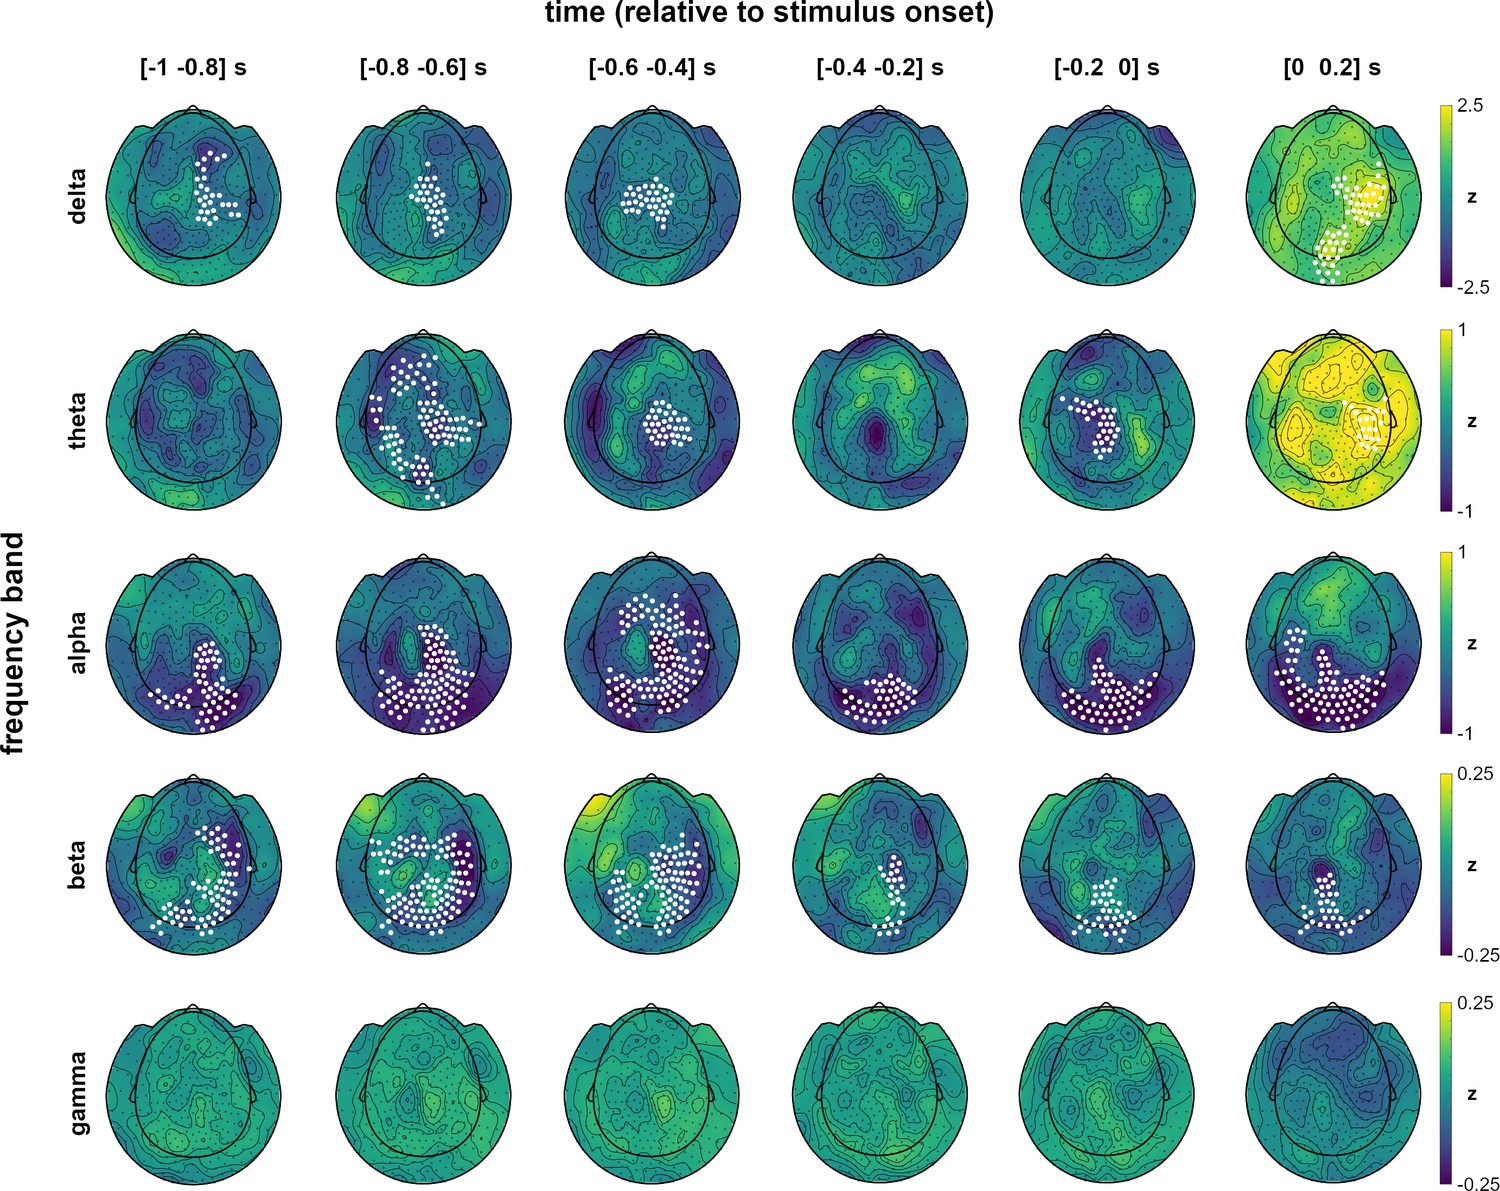
Band-specific topographies over time.
Whole-scalp topographic distribution of normalized pre- and peristimulus power differences between hits and misses, separately for each frequency band. Channels with significant differences in the respective band are marked (cluster-corrected within the respective time frame).
Figure 4 with 2 supplements
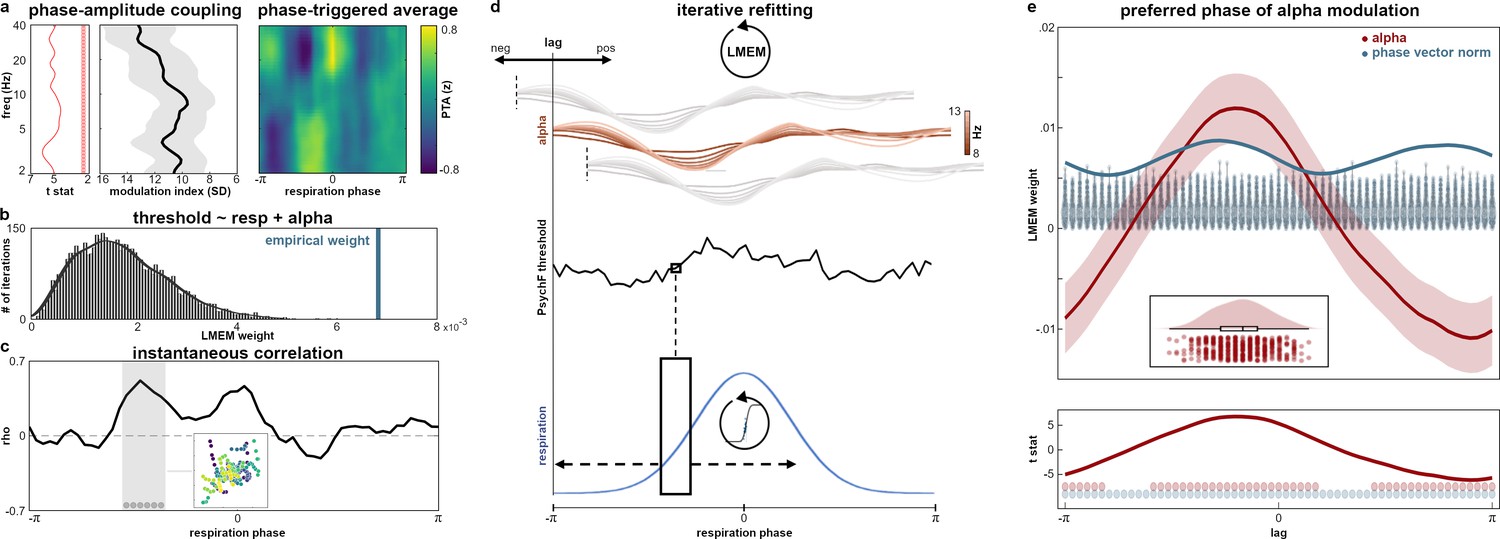
Respiration-locked alpha power modulations drive perception effects.
(a) Left panel shows modulation index as a measure of phase-amplitude coupling across frequencies and corresponding t values from cluster-permutation testing. Coupling was significant (FDR-corrected) over the entire frequency range from 2 to 40 Hz within the parieto-occipital ROI (see Figure 3a). Right panel shows ROI sensor-level TFR illustrating group-level average power changes over the course of one entire respiration cycle. Power was normalized within each frequency to highlight phasic changes and is shown in z values. (b) Histogram shows the empirical LMEM weight for the respiratory vector norm against the null distribution computed from 5000 iterations of randomized PsychF vectors on the subject level. (c) Instantaneous group-level correlation between individual alpha and PsychF threshold courses (averaged between 8 and 13 Hz) with significant phase vector (length of six time points) marked by gray dots (cluster-corrected). Inset shows the correlation within the significant time window: For each participant, six dots represent alpha power and Psych F at the respective significant time point (color-coded across participants). (d) Didactic panel illustrating the iterative refitting approach. Individual alpha and PsychF threshold courses (see top and middle) were continuously shifted against each other. At each lag (ranging from −π to π), the LMEM was recomputed on the group level to obtain the preferred phase of alpha modulation effects, that is, the lag at which alpha explained the maximum variance in PsychF thresholds. (e) Top panel shows LMEM beta weights ±95% confidence interval for alpha power (red) for all phase lags between alpha and PsychF threshold courses. Alpha effects were found to be strongest at a phase lag of −30°, that is, preceding PsychF modulation by π/6. Blue line shows the respiratory phase vector norm (i.e., the combination of LMEM weights for respiratory sine and cosine). Blue violin plots show the null distributions of the phase vector norm at each lag, resulting from n=1000 random permutations. Inset shows distribution of peak lags for the alpha power coefficient from a bootstrapping approach with n=500 iterations. Bottom panel shows the corresponding t-statistic for alpha across all phase lags. Dots indicate significance for alpha (red) and the respiratory phase vector norm (blue).
Figure 4—figure supplement 1
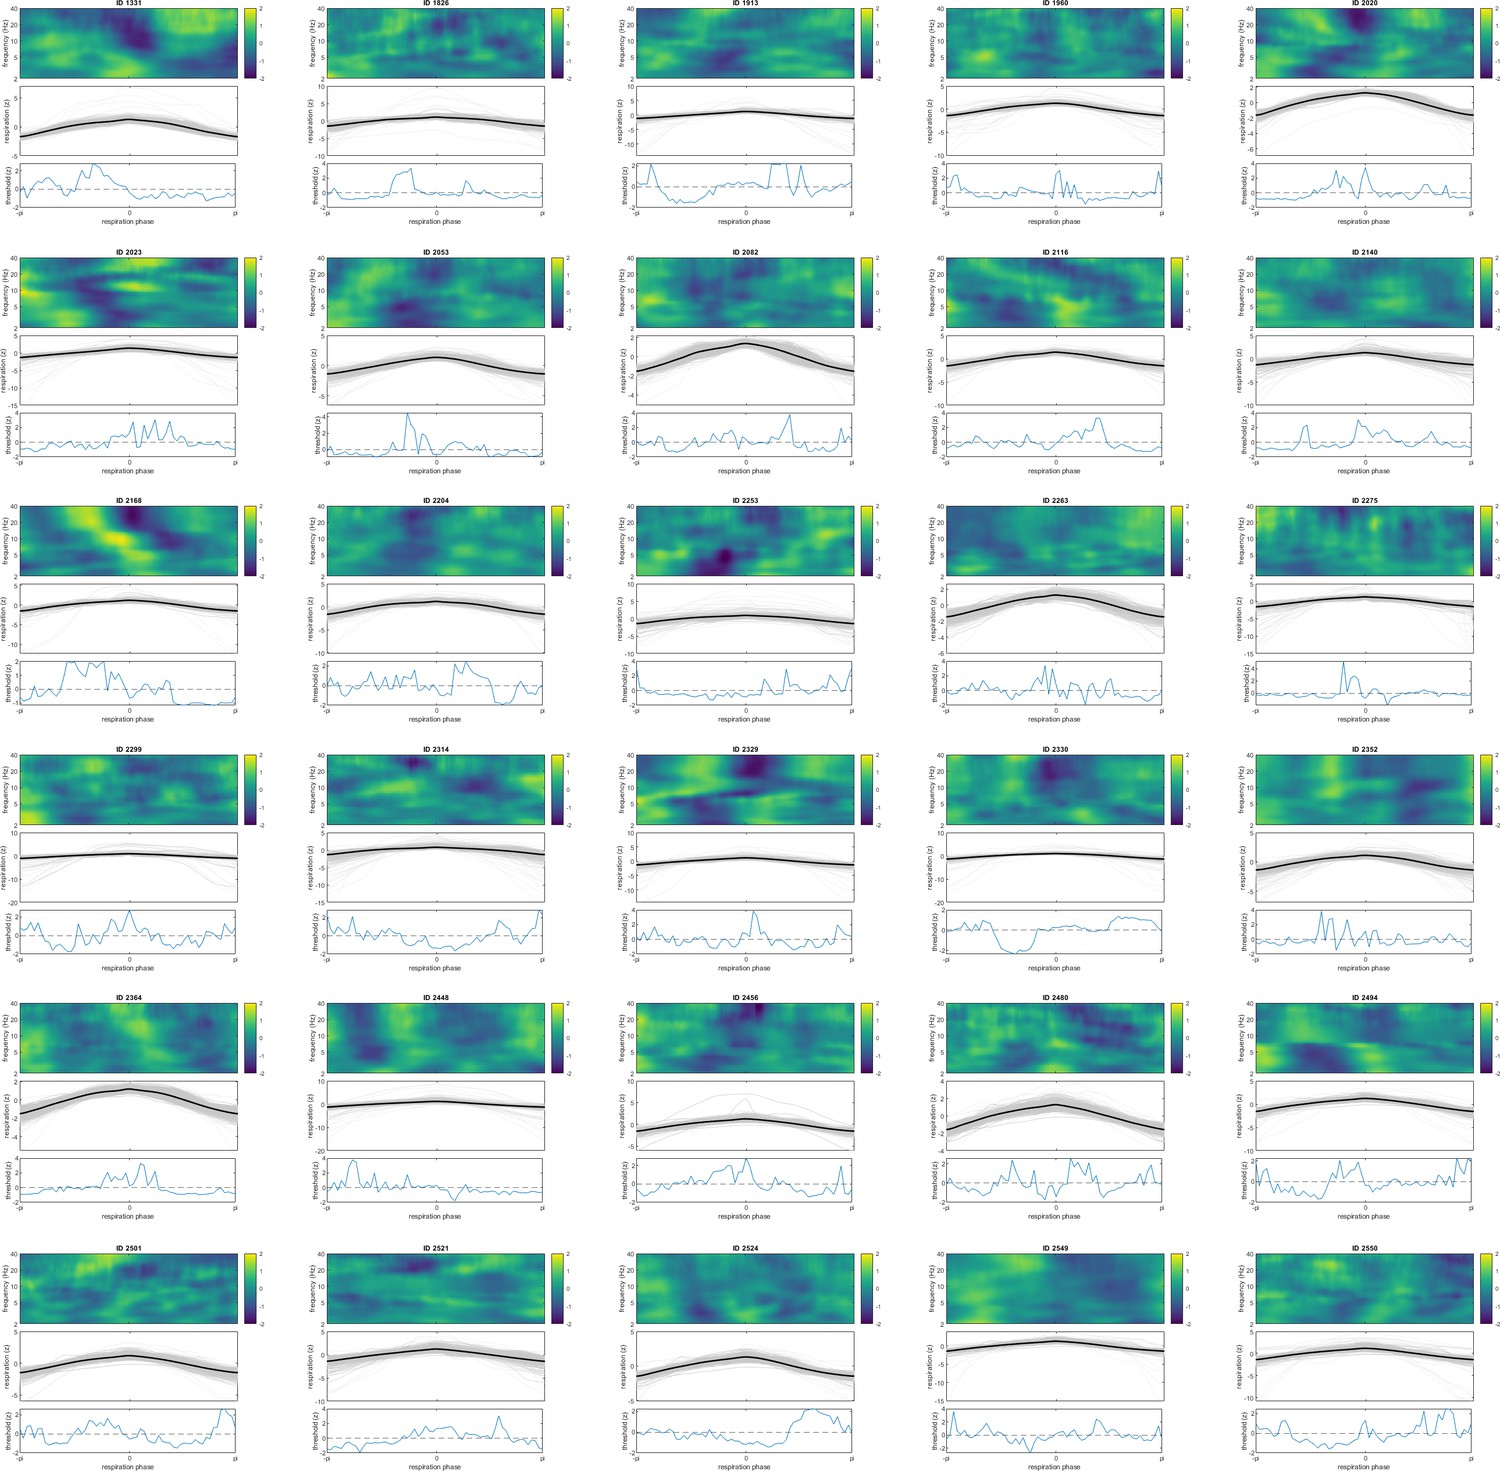
Individual phase-triggered averages (top), normalized respiration time courses (plus mean respiration time course in bold; middle), and normalized PsychF threshold over the respiration cycle (bottom).
Figure 4—figure supplement 2
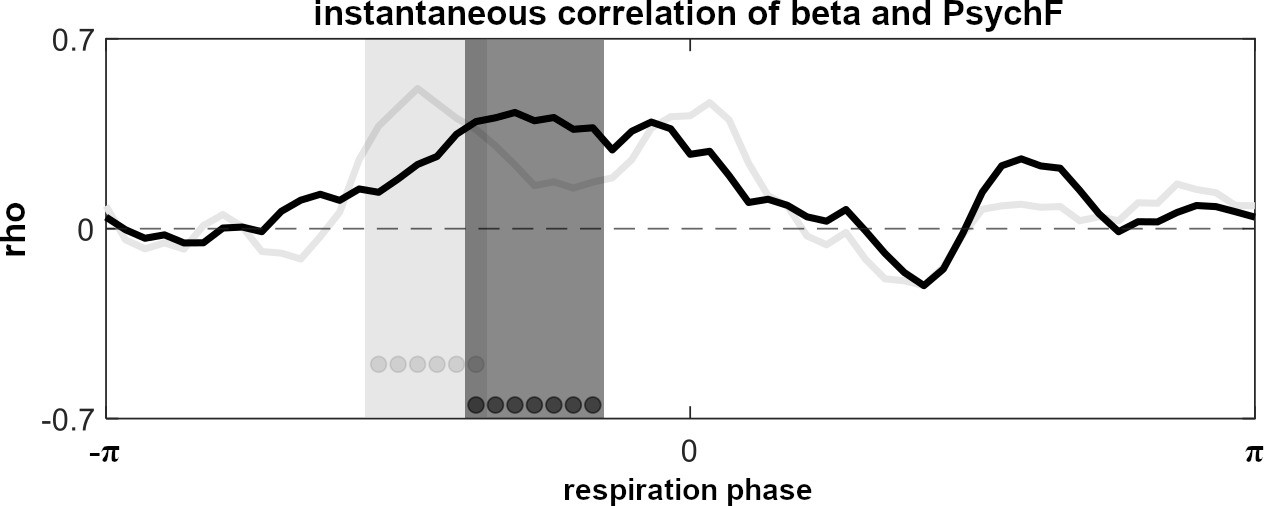
Instantaneous correlation of beta power and perceptual sensitivity.
Group-level correlation between individual beta and PsychF threshold courses (averaged between 14 and 30 Hz) with significant phase vector (length of seven time points) marked by dark gray dots (cluster-corrected). Correlation time course of the alpha band (see Figure 4c) shown for reference in light gray.
Additional files
Download links
A two-part list of links to download the article, or parts of the article, in various formats.
Downloads (link to download the article as PDF)
Open citations (links to open the citations from this article in various online reference manager services)
Cite this article (links to download the citations from this article in formats compatible with various reference manager tools)
Respiration aligns perception with neural excitability
eLife 10:e70907.
https://doi.org/10.7554/eLife.70907


