Subcellular proteomics of dopamine neurons in the mouse brain
- Department of Systems Biology, Columbia University Irving Medical Center, United States
- Medical Scientist Training Program, Columbia University Irving Medical Center, United States
- Department of Psychiatry, Columbia University Irving Medical Center, United States
- Division of Molecular Therapeutics, New York State Psychiatric Institute, United States
- Proteomics Shared Resource, Herbert Irving Comprehensive Cancer Center, Columbia University Irving Medical Center, United States
- Department of Neurology, Columbia University Irving Medical Center, United States
- Department of Pharmacology, Columbia University Irving Medical Center, United States
- Aligning Science Across Parkinson’s (ASAP) Collaborative Research Network, United States
- Department of Biochemistry & Molecular Biophysics, Columbia University Irving Medical Center, United States
- Sulzberger Columbia Genome Center, Columbia University Irving Medical Center, United States
Figures
Figure 1 with 2 supplements
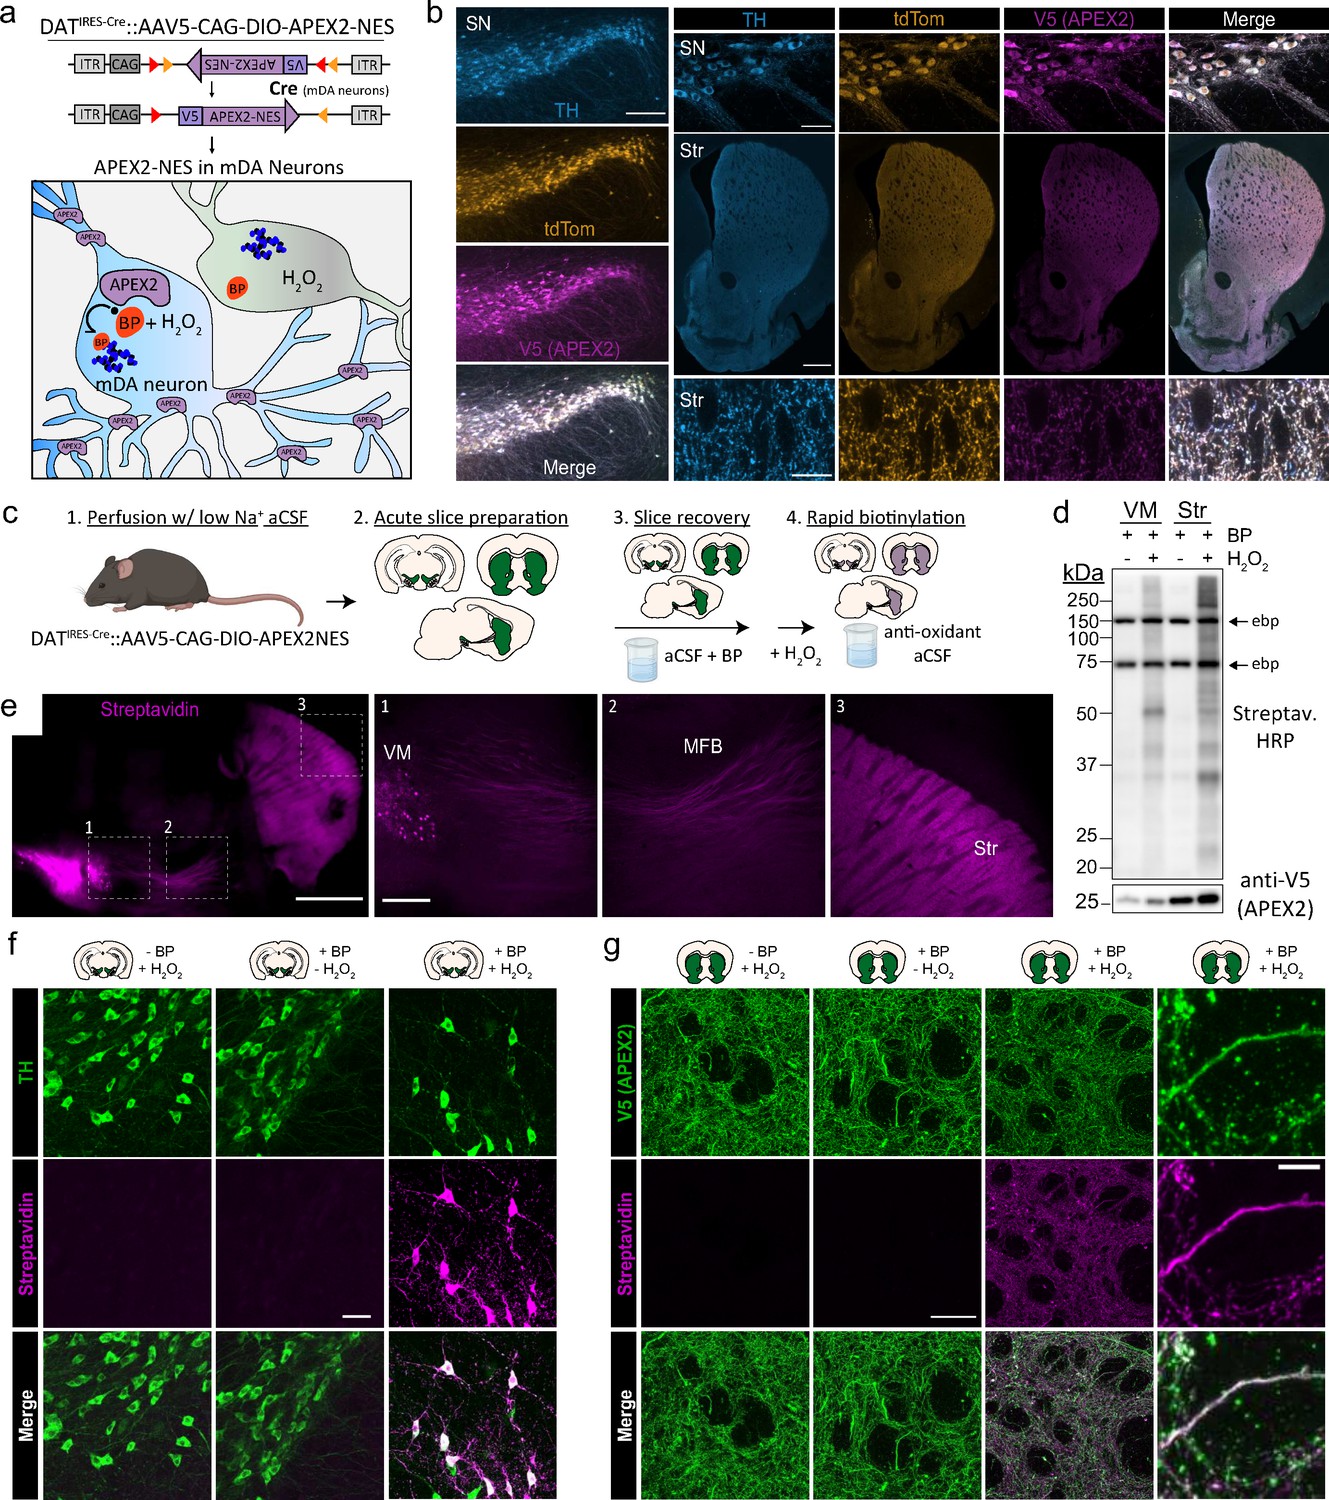
Cre-dependent viral expression of cytoplasmic APEX2 and midbrain dopaminergic (mDA) neuron-specific biotinylation in acute brain slices.
(a) Schematic depicting viral expression strategy: Cre-dependent, cytoplasmic APEX2 expressing AAV (AAV5-CAG-DIO-APEX2-NES) is injected into the midbrain of DAT-IRES-Cre mice for mDA neuron-specific APEX2 labeling. (b) Immunostaining of mDA neurons in DAT-IRES-Cre/Ai9tdTomato mice injected with AAV5-CAG-DIO-APEX2-NES. Anti-TH, anti-RFP (tdTomato), and anti-V5 (APEX2) all display diffuse localization throughout somatic, dendritic, and axonal cytoplasm. Left, substantia nigra, scale bar: 200 µm, upper right: substantia nigra at high power, scale bar: 50 µm, middle right: dorsal and ventral striatum, scale bar: 500 µm, lower right: dorsal striatum at high power, scale bar: 10 µm. (c) Schematic depicting APEX2 labeling procedure in acute brain slices. Slice are incubated for 1 hr with 0.5 mM biotin phenol prior to labeling with 1 mM hydrogen peroxide (H2O2) for 3 min. (d) Upper: western blotting of ventral midbrain and striatal slice lysates with streptavidin–horseradish peroxidase in the presence of biotin phenol with or without H2O2. Endogenously biotinylated proteins (ebp) are noted in all lanes at ~75 and ~150 kDa. Lower: same as above but with anti-V5 (APEX2). (e) Streptavidin-AlexaFluor647 staining of sagittal slices after APEX2 labeling in mDA neurons. Left, sagittal slice at low power, scale bar: 1 mm. Insets indicated in white dashed lines, right: insets of the ventral midbrain, medial forebrain bundle, and striatum, scale bar: 250 µm. (f) Streptavidin-AlexaFluor647 staining of coronal midbrain slices after APEX2 labeling in mDA neurons, scale bar: 50 µm. Labeling requires both biotin phenol and H2O2. (g) Same as (f) but with fields of striatal slices. First three columns, scale bar: 50 µm. Far right panels at high magnification, scale bar: 5 µm. Abbreviations: aCSF, artificial cerebrospinal fluid; BP, biotin phenol; HRP, horseradish peroxidase; MFB, medial forebrain bundle; NES, nuclear export sequence; TH, tyrosine hydroxylase; SN, substantia nigra; Str, striatum; VM, ventral midbrain.
-
Figure 1—source data 1
Western blots related to Figure 1d.
- https://cdn.elifesciences.org/articles/70921/elife-70921-fig1-data1-v2.zip
Figure 1—figure supplement 1
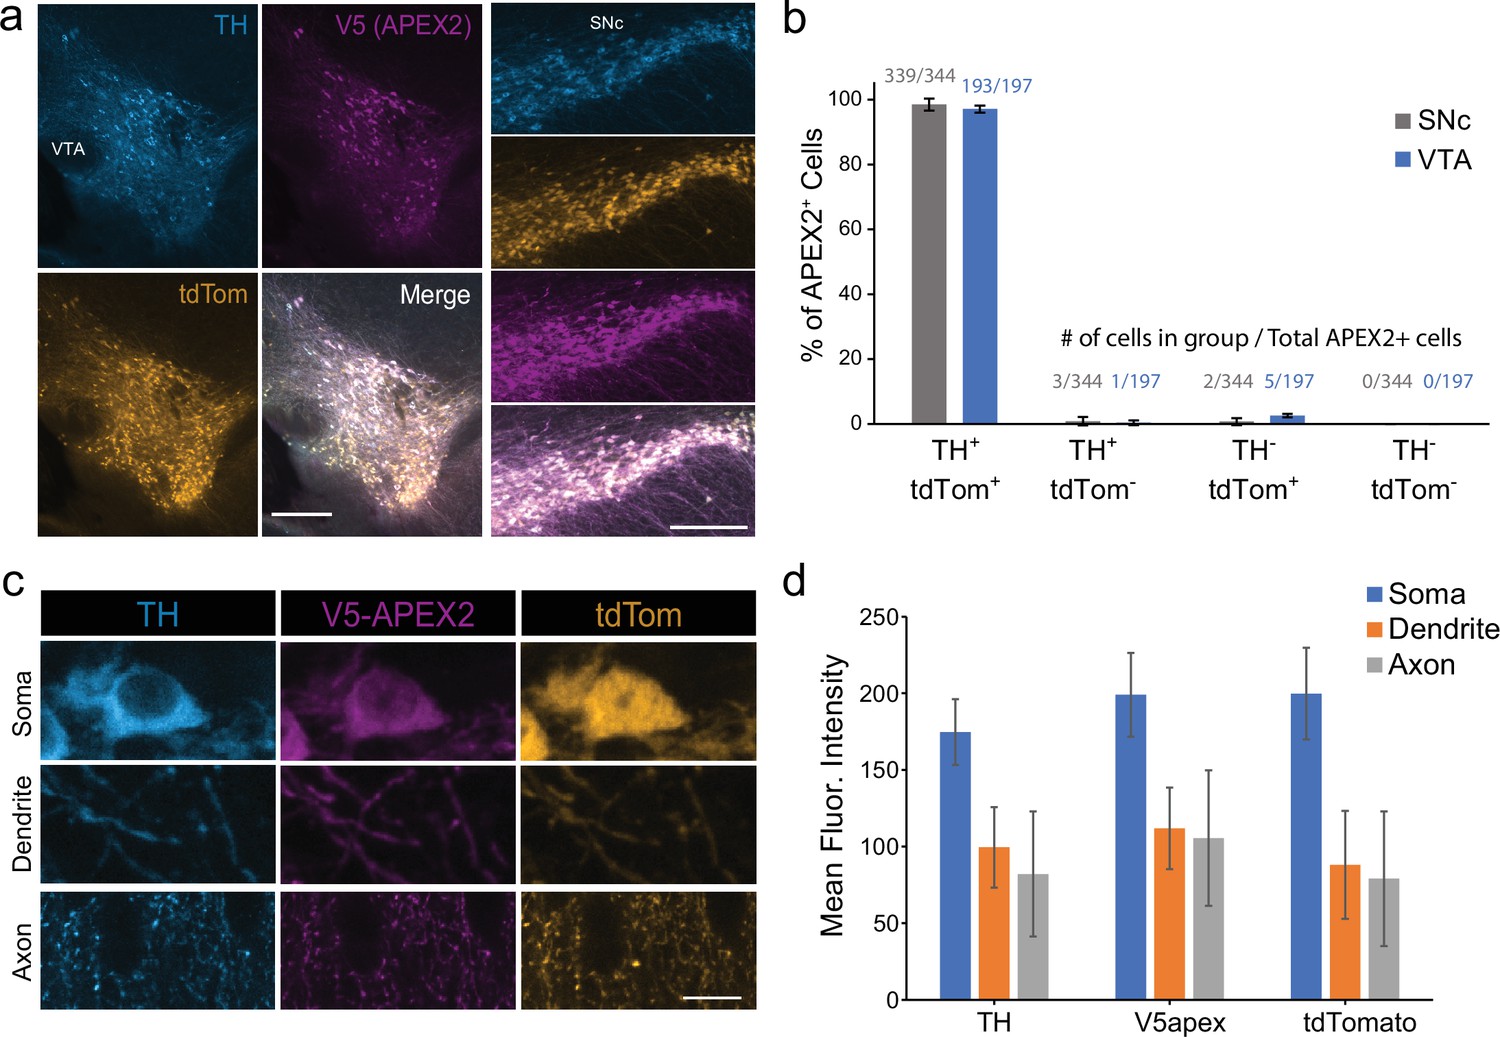
Specificity of APEX2-NES AAV expression.
(a) Immunostaining of midbrain dopaminergic (mDA) neurons in DAT-IRES-Cre/Ai9tdTomato mice injected with AAV5-CAG-DIO-APEX2-NES. The vast majority of V5-APEX2+ neurons are TH+/tdTomato+. Left, ventral tegmental area, right: substantia nigra pars compacta, both scale bar: 250 µm. (b) Quantification and cell counts related to (a), data from two sections each from n = 3 mice. (c) Representative images of dopaminergic soma, dendrites, and axons from DAT-IRES-Cre/Ai9tdTomato mice injected with AAV5-CAG-DIO-APEX2-NES. (d) Quantification related to (c); data are background subtracted mean fluorescence intensities from 20 segmented soma/dendrites/axons. Scale bar: 10 µm. Abbreviations: TH, tyrosine hydroxylase; SNc, substantia nigra; VTA, ventral tegmental area.
Figure 1—figure supplement 2
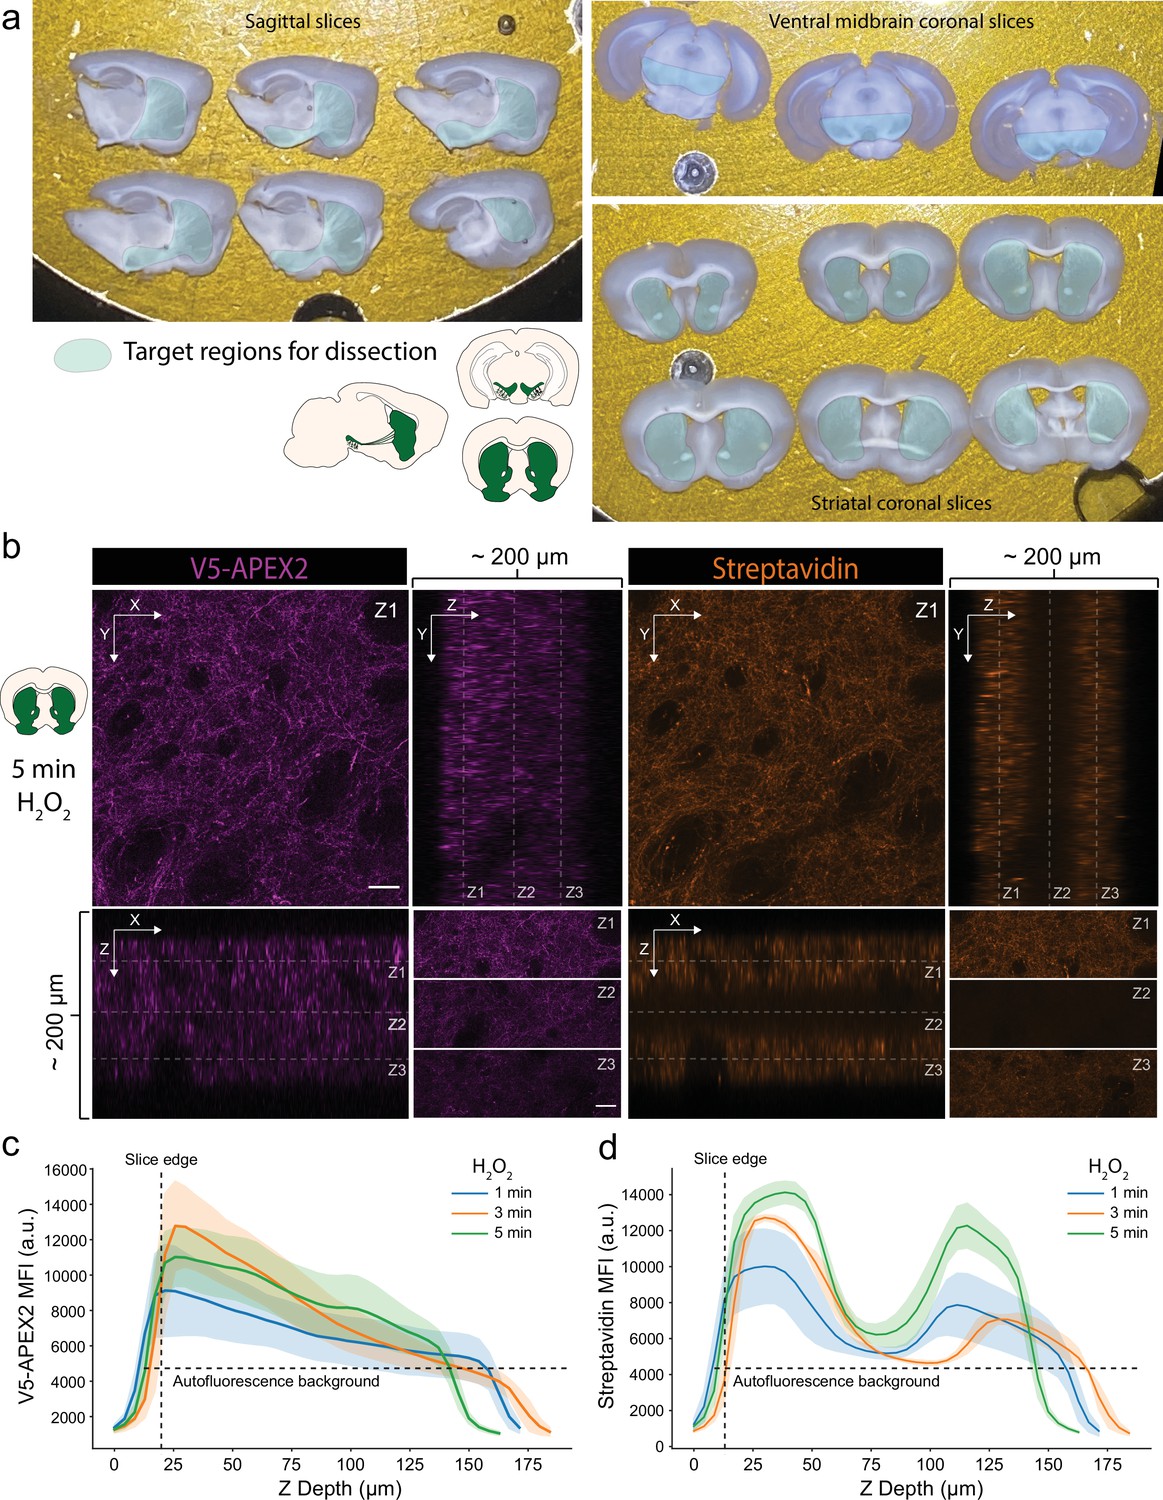
Characterization of slice labeling.
(a) Typical sets of sagittal or coronal slices. Target regions for anatomical dissection of midbrain dopaminergic (mDA) neuronal compartments are indicated. (b) Anti-V5 (APEX2) and streptavidin-AlexaFluor647 staining of a cleared striatal slice after 5 min labeling with 1 mM hydrogen peroxide (H2O2). Upper left, images display XY view at Z1 plane as indicated in the ZX (lower left) and YZ (upper right) views, scale bar: 50 µm. Lower right, top, middle, and bottom third of XY view at Z1, Z2, and Z3 planes, respectively, as indicated in the ZX and YZ views, scale bar: 50 µm. (c, d) Anti-V5 (APEX2) and streptavidin-AlexaFluor647 mean fluorescence intensity as a function of Z depth and H2O2 labeling time. Mean ± standard deviation is plotted from three fields. Although V5-APEX2 fluorescence decreases throughout the slice depth (likely due to laser power attenuation), streptavidin fluorescence exhibits a bimodal distribution with sparse labeling in the center third.
Figure 2 with 2 supplements

APEX2 proximity labeling proteomics in midbrain dopaminergic (mDA) neurons.
(a) Schematic depicting APEX2 proximity labeling proteomics in mDA neurons. Slices are labeled, rapidly quenched, dissected, and flash frozen. Frozen tissues are lysed and precipitated to remove free biotin, after which resolubilized tissue proteins are subjected to streptavidin bead purification to enrich biotinylated proteins. On-bead digestion produces peptides which are quantified by liquid chromatography with tandem mass spectrometry (LC–MS/MS). (b) Streptavidin–HRP western blotting of streptavidin pulldowns from tissue dissections of the indicated regions (duplicate lanes are biological replicates). Each lane contains proteins eluted from 5% of the streptavidin beads for each biological replicate (single mouse/region). Arrows on the right indicate prominent bands in APEX2+ and APEX2− samples of all regions, which represent endogenous biotinylated carboxylase proteins at ~75 and ~150 kDa. The majority of APEX2-specific biotinylation is found in the striatum, but specific labeling is present in both VM and MFB at high contrast (lower). (c) Mean ± standard error of the mean (SEM) of peptides and proteins detected per biological replicate of APEX2− or APEX2+ streptavidin pulldowns of indicated regions (n = 4 each). See Figure 2—source data 2 for raw label-free quantification intensity values of peptides and proteins for all samples used in this study. (d) Quantification of streptavidin–HRP reactivity in APEX2+ streptavidin pulldowns, related to panel (b). After subtraction of endogenously biotinylated protein signal within each lane, the APEX2-specific streptavidin–HRP intensity for each APEX2+ sample was determined by subtracting the average APEX2− lane intensity for the same region. Mean ± standard error of the mean (SEM) normalized streptavidin–HRP intensity is plotted for each region (n = 2 for VM, n = 2 for MFB, n = 4 for striatum). The percentage of APEX2-specific biotinylation found in each region are denoted above the bars. (e) Log–log abundance plots of APEX2− vs. APEX2+ streptavidin pulldown samples for the indicated regions. Axes represent the average log2(total intensity normalized abundance + 1) of n = 4 biological replicates for each sample type. Proteins significantly enriched or depleted from APEX2+ streptavidin pulldown samples are colored in red or blue, respectively. False discovery rate (FDR) represents q values from Benjamini–Hochberg procedure on Welch’s (unequal variance) t-test. See Figure 2—source data 4 for complete results of APEX2+ vs. APEX2− comparisons. (f) Heatmap of Z-scores for protein abundances for the union of the top 10 most abundant proteins enriched in APEX2+ vs. APEX2− differential expression analysis from panel (e). Each column represents a biological replicate (n = 4) of APEX2− and APEX2+ streptavidin pulldown samples in the indicated regions. The green color bar on the right indicates whether a given protein was in the top 10 of each region. (g) Heatmap of Z-scores for protein abundances for markers of mDA neurons, glia, striatal spiny projection neurons (SPNs), and cholinergic interneurons (ChI). Each column represents a biological replicate (n = 4) of bulk striatal tissue or APEX2+ streptavidin pulldown samples. See Figure 2—source data 5 for complete results of bulk tissue vs. APEX2+ comparisons. Abbreviations: aCSF, artificial cerebrospinal fluid; BP, biotin phenol; H2O2, hydrogen peroxide; HRP, horseradish peroxidase; MFB, medial forebrain bundle; Str, striatum; VM, ventral midbrain. See Figure 2—source data 1 for list of protein abbreviations in (f, g).
-
Figure 2—source data 1
Protein abbreviations used in Figure 2f, g.
- https://cdn.elifesciences.org/articles/70921/elife-70921-fig2-data1-v2.xlsx
-
Figure 2—source data 2
Raw label-free quantification intensity values of peptides and proteins for all samples used in this study.
- https://cdn.elifesciences.org/articles/70921/elife-70921-fig2-data2-v2.xlsx
-
Figure 2—source data 3
Welch’s t-test with BH false discovery rate (FDR) correction, related to Figure 2—figure supplement 2b, c.
(1) Striatum bulk tissue vs. ventral midbrain (VM) bulk tissue. (2) Acute vs. rested bulk tissue.
- https://cdn.elifesciences.org/articles/70921/elife-70921-fig2-data3-v2.xlsx
-
Figure 2—source data 4
Welch’s t-test with BH false discovery rate (FDR) correction, related to Figure 2e.
(1) Ventral midbrain (VM) streptavidin IP: APEX2+ vs. APEX2− (control). (2) Medial forebrain bundle (MFB) streptavidin IP: APEX2+ vs. APEX2− (control). (3) Striatum streptavidin IP: APEX2+ vs. APEX2− (control).
- https://cdn.elifesciences.org/articles/70921/elife-70921-fig2-data4-v2.xlsx
-
Figure 2—source data 5
Welch’s t-test with BH false discovery rate (FDR) correction, related to Figure 2g.
(1) Striatum bulk tissue vs. striatum APEX2+ streptavidin IP. (2) Ventral midbrain (VM) bulk tissue vs. VM APEX2+ streptavidin IP.
- https://cdn.elifesciences.org/articles/70921/elife-70921-fig2-data5-v2.xlsx
-
Figure 2—source data 6
Western blots related to Figure 2b.
- https://cdn.elifesciences.org/articles/70921/elife-70921-fig2-data6-v2.zip
Figure 2—figure supplement 1
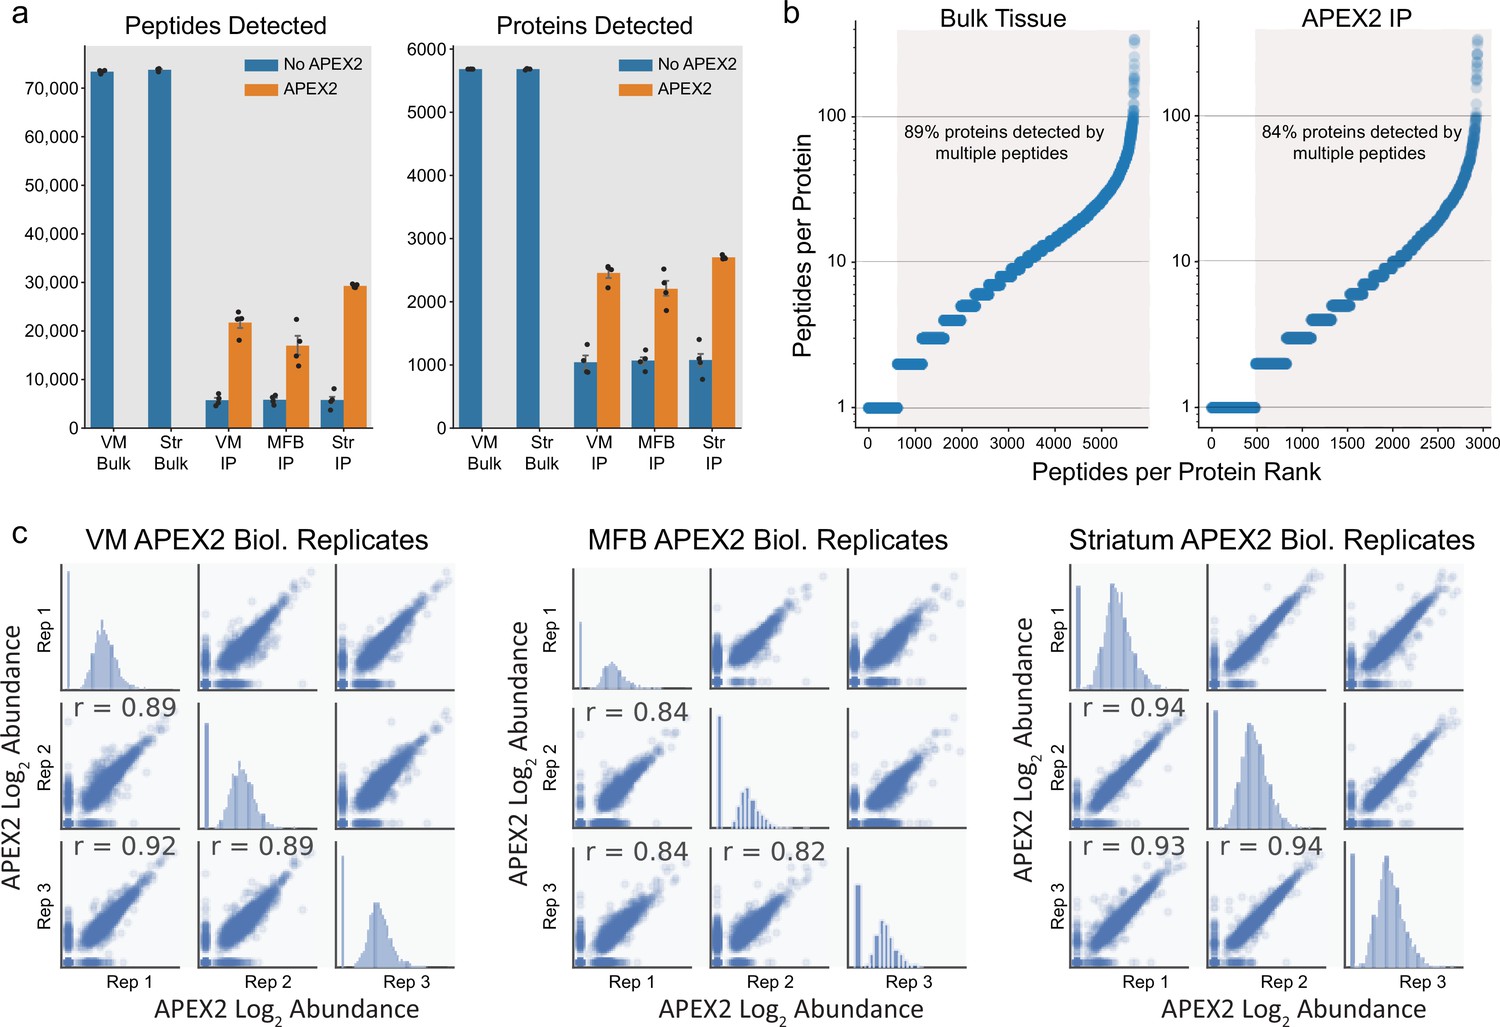
Proteomic depth and reproducibility.
(a) Mean ± standard error of the mean (SEM) of peptides and proteins detected per biological replicate of each sample type (n = 4 each). Tissue regions and protein fractions (bulk tissue or streptavidin pulldown) are indicated. (b) Peptide coverage of detected proteins in each sample type (bulk tissue or streptavidin pulldown). Highlighted region shows proteins with >1 peptide. (c) Pearson’s correlation (r) of three biological replicates (APEX2+ streptavidin pulldown) samples from the indicated regions. Abundance represents log2(total intensity normalized abundance + 1) for each sample.
Figure 2—figure supplement 2
APEX2 slice labeling conditions do not distort bulk tissue proteomes.
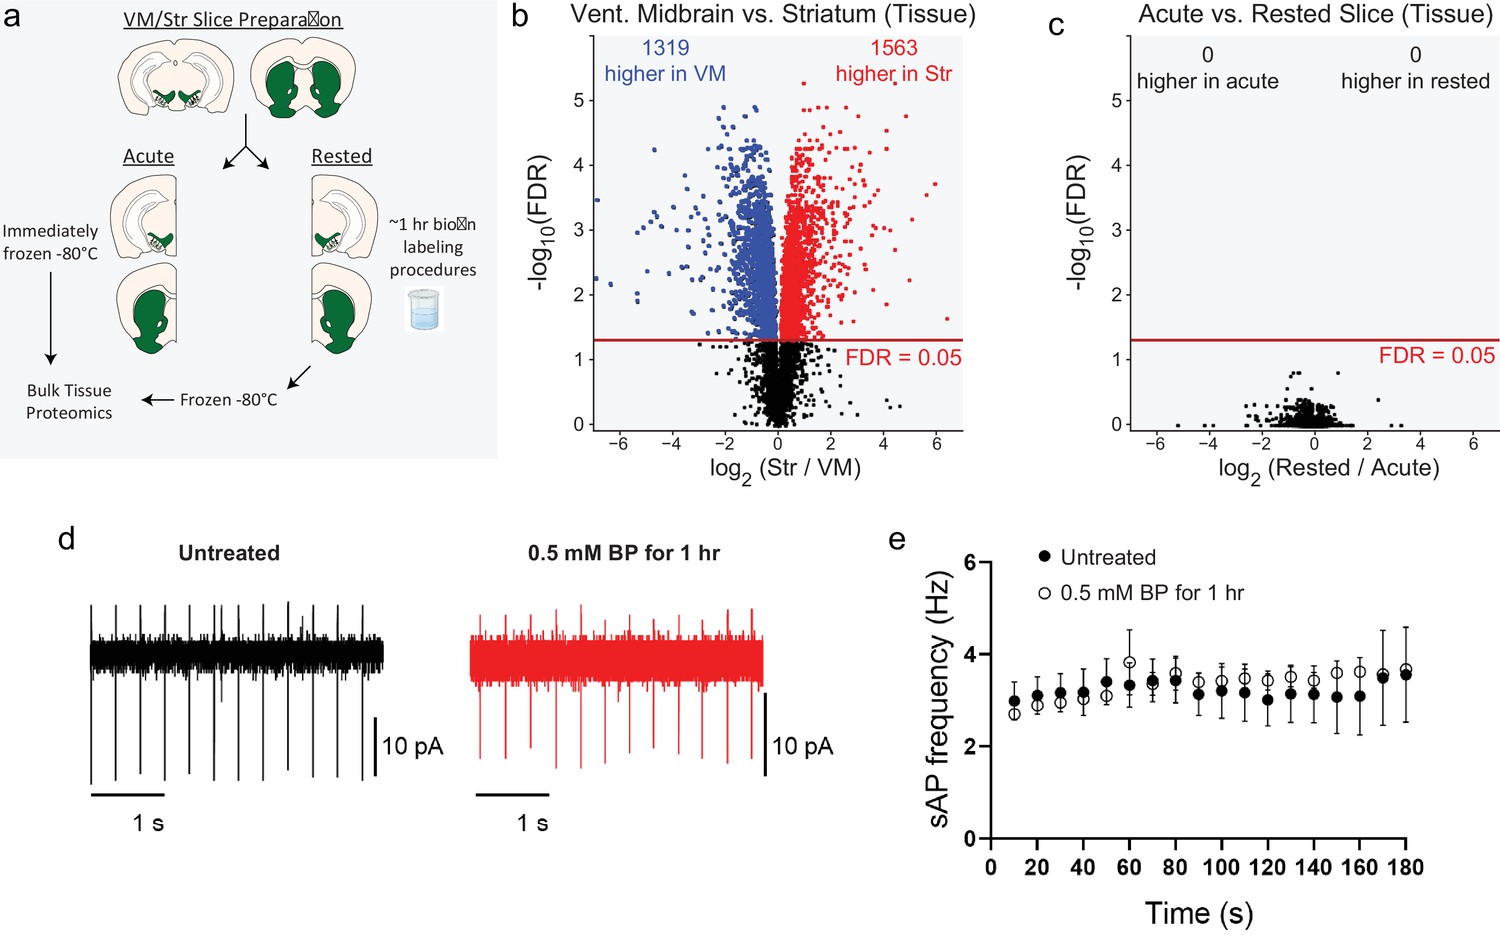
(a) Schematic depicting bulk tissue proteomics experimental design. Coronal slice prepared from the midbrain or striatum were split into lateral halves: one half was immediately frozen (acute), while the other half was subjected to APEX2 labeling conditions (1 hr artificial cerebrospinal fluid [aCSF] + 0.5 mM biotin-phenol followed by 3 min of 1 mM hydrogen peroxide [H2O2]) and then frozen. See Figure 2—source data 2 for raw label-free quantification intensity values of peptides and proteins for all samples used in this study. (b) Volcano plot comparing striatum and ventral midbrain bulk tissue proteomes. False discovery rate (FDR) represents q values from Benjamini–Hochberg procedure on Welch’s (unequal variance) t-test. See Figure 2—source data 3 for complete results. (c) Volcano plot comparing acute vs. rested bulk tissue proteomes for both striatum and ventral midbrain. FDR represents q values from Benjamini–Hochberg procedure on Welch’s (unequal variance) t-test. See Figure 2—source data 3 for complete results. (d) Cell attached recording of dopaminergic neurons in the substantial nigra. Representative traces of spontaneous firing of dopaminergic neurons from BP-treated and untreated slices. (e) 1 hour incubation with 0.5 mM BP does not affect the spontaneous action potential firing Untreated group: n=7 cells, N=2 mice, BP-treated: n=4 cells, N=2 mice. No significant effects were observed in two-way ANOVA: (Time) F(17,100) = 0.218, p = 0.99, (Treatment) F(1,100) = 0.589, p = 0.44, (Time:Treatment) F(17,100) = 0.098, p = 0.99.
Figure 3 with 3 supplements
Axonal and somatodendritic proteomics reveals gene ontologies enriched in subcellular compartments.
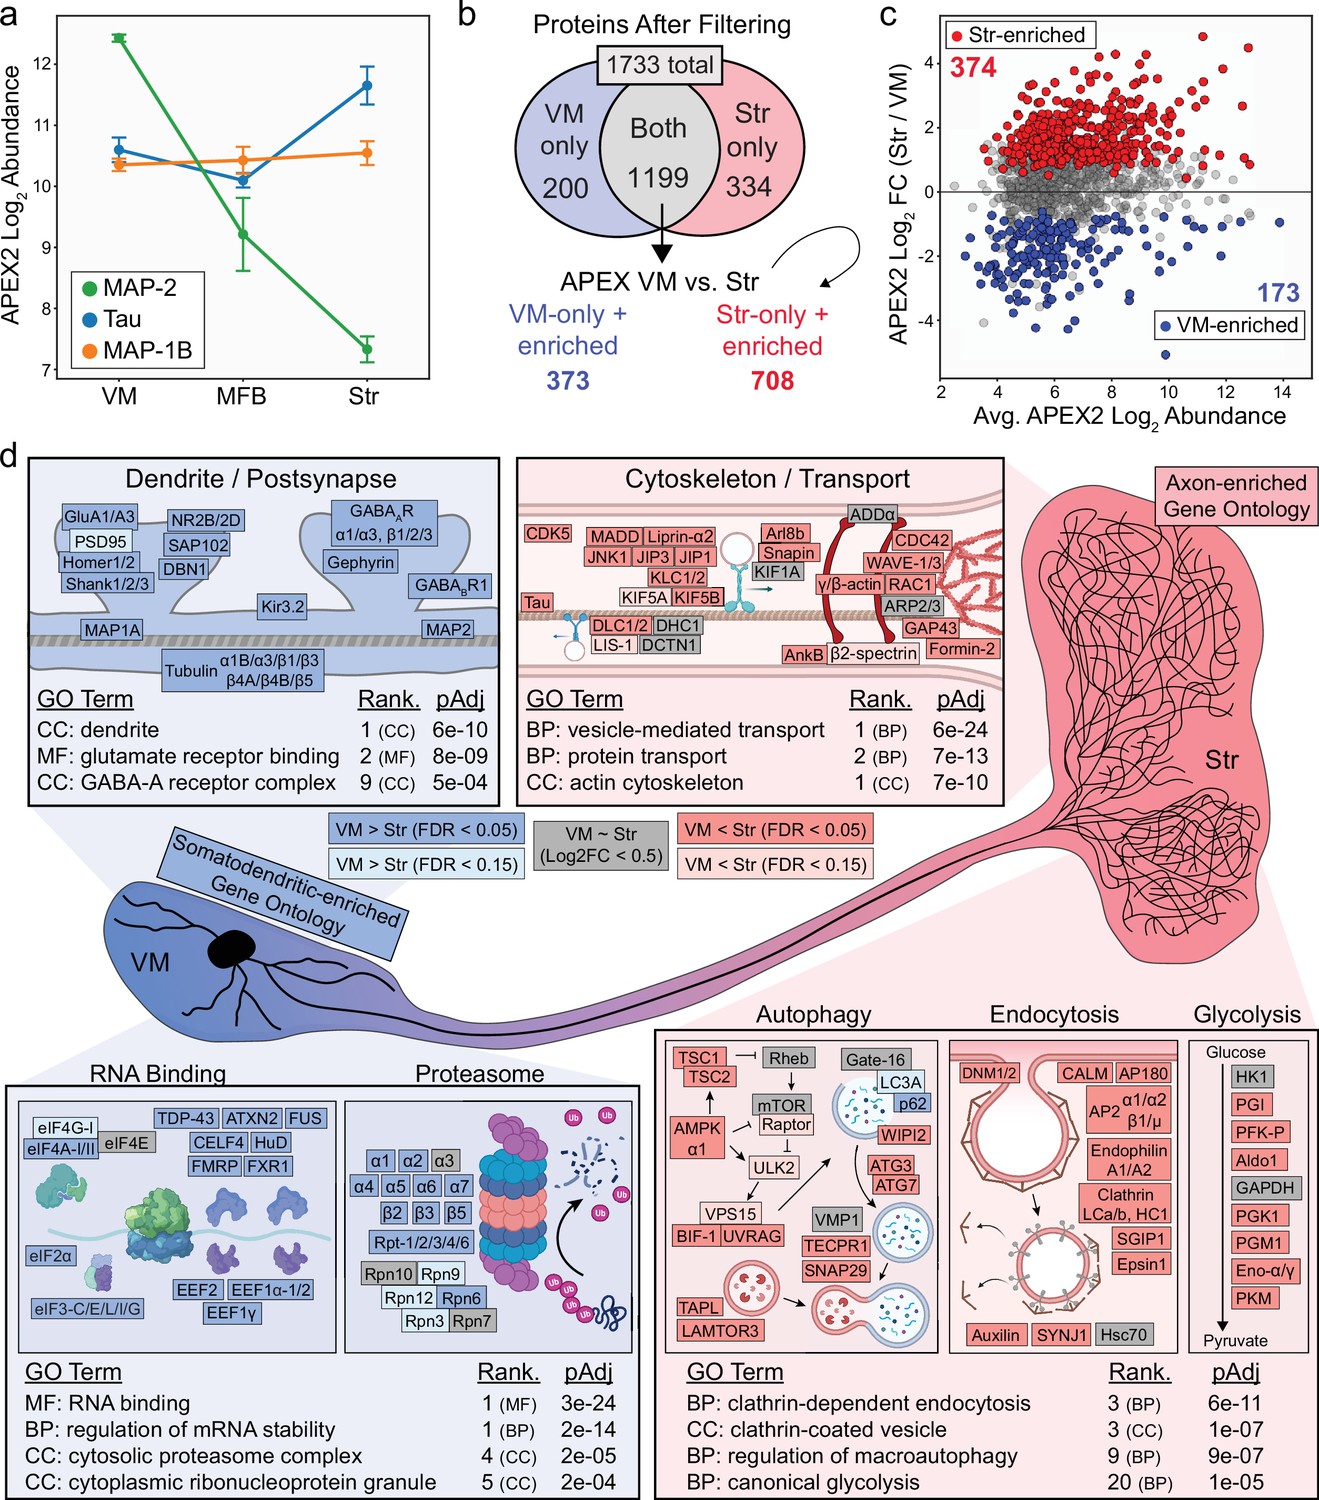
(a) APEX2 proteomics data for microtubule-associated proteins MAP-2, Tau, and MAP-1B. Mean ± standard error of the mean (SEM) of the protein abundances, as log2(total intensity normalized abundance + 1), are shown for n = 4 biological replicates of APEX2+ streptavidin pulldown samples in the indicated regions. (b) Schematic depicting proteins remaining after filtering. For complete filtering workflow, see Materials and methods and Figure 3—figure supplement 1. Proteins present in both VM and Str after filtering were further compared by differential expression—see panel (c). Proteins present only in VM or Str, plus those enriched in VM vs. Str differential expression analysis, were used for subsequent gene ontology (GO) analysis. (c) Differential expression comparison of VM vs. Str APEX2+ streptavidin pulldown samples. Proteins colored red or blue had a false discovery rate (FDR) <0.05 after Benjamini–Hochberg corrected p values from Welch’s (unequal variance) t-test. See Figure 3—source data 2 for complete results and summary of proteins before and after filtering. (d) GO analysis (Enrichr) of VM- and Str-enriched proteins (373 and 708, respectively, see panel b). Selected GO terms are listed along with adjusted p values and adjusted p value rank for each GO term category (Cellular Component, Molecular Function, Biological Process). Canonical and representative proteins from the ontologies are shown. Every protein depicted is present in the filtered proteomics data of VM, Str, or both. Colors indicate significant (dark red/blue) enrichment, near-significant enrichment (light red/blue), or similar levels between VM and Str (gray). Slashes indicate separate proteins (e.g., DLC1/2 represents both DLC1 and DLC2). See Figure 3—source data 3 for complete GO summary. Abbreviations: MAP-2, microtubule-associated protein 2; Tau, microtubule-associated protein tau; MAP-1B, microtubule-associated protein 1B; MFB, medial forebrain bundle; Str, striatum; VM, ventral midbrain. See Figure 3—source data 1 for list of protein abbreviations in (d).
-
Figure 3—source data 1
Protein abbreviations used in Figure 3d.
- https://cdn.elifesciences.org/articles/70921/elife-70921-fig3-data1-v2.xlsx
-
Figure 3—source data 2
Summary of all APEX2 comparisons and single-cell RNA-sequencing (scRNA-seq) data for all proteins and proteins retained after filtering, related to Figure 3—figure supplement 1.
- https://cdn.elifesciences.org/articles/70921/elife-70921-fig3-data2-v2.xlsx
-
Figure 3—source data 3
Enrichr gene ontology (GO) analysis related of ventral midbrain (VM)-enriched, and striatum-enriched proteins, related to Figure 3d and Figure 3—figure supplement 3c, d.
(1) Enrichr analysis using terms from COMPARTMENTS resource. (2) Enrichr analysis using terms from BP/MF/CC GO Consortium resource.
- https://cdn.elifesciences.org/articles/70921/elife-70921-fig3-data3-v2.xlsx
Figure 3—figure supplement 1
Filtering of APEX2 proteomics data using single-cell RNA-sequencing (scRNA-seq) data and cross-regional comparisons.
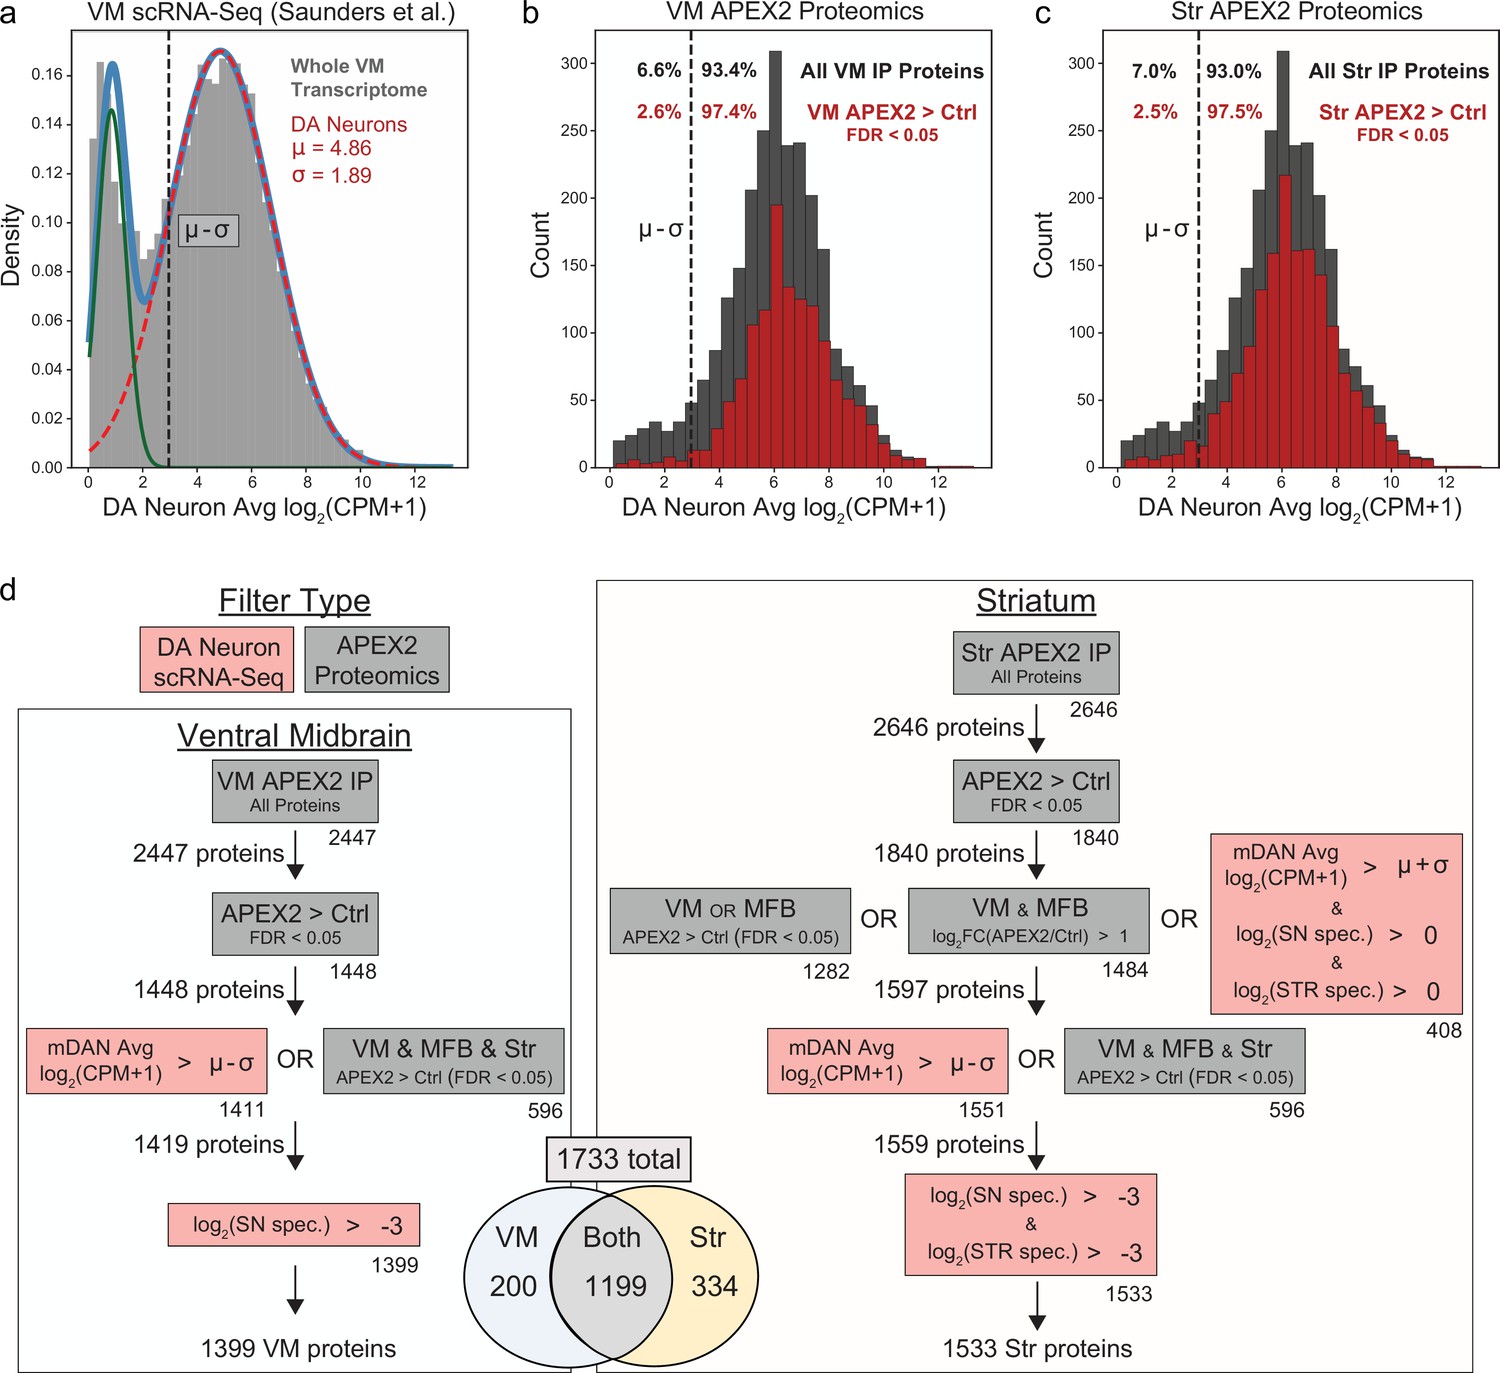
(a) Histogram of average mRNA expression in midbrain dopaminergic (mDA) neurons identified in our reanalysis of the DropViz scRNA-seq data (Saunders et al., 2018), see also Figure 5—figure supplement 1. Data were fit with a Gaussian mixture model (light blue trace), with the two Gaussian distributions representing genes expressed (dashed red trace) or not expressed (green trace) in mDA neurons. The mean (µ) and standard deviation (σ) for the mDA neuronal component are indicated in red. A conservative threshold of µ–σ (dashed black line) was set as the lower bound to consider a gene expressed in mDA neurons. (b) Histogram of average mDA neuron mRNA expression for all proteins detected in VM APEX2+ pulldown samples (dark gray) and proteins enriched in VM APEX2+ vs. APEX2− pulldown samples (false discovery rate [FDR] <0.05, red). Only 6.6% of all VM pulldown proteins were below the lower bound of mDA neuronal expression, which was decreased to 2.6% for proteins enriched in APEX2+ vs. APEX2− pulldowns. (c) Histogram of average mDA neuron mRNA expression for all proteins detected in Str APEX2+ pulldown samples (dark gray) and proteins enriched in Str APEX2+ vs. APEX2− pulldown samples (FDR < 0.05, red). Only 7.0% of all Str pulldown proteins were below the lower bound of mDA neuronal expression, which was decreased to 2.5% for proteins enriched in APEX2+ vs. APEX2− pulldowns. (d) Filtering strategy for VM (left) and striatum (right) APEX2 proteomics data. Filters using scRNA-seq data are shown in red, while filters using the proteomics data are shown in gray. Numbers below the bottom right corner of each box indicate the number of proteins passing that individual filter, while the total number of proteins passing each filter set is indicated to the left of the arrows. See Materials and methods for detailed description of the filters. In total, 1399 and 1533 proteins were retained from the VM and striatum, respectively, with 1733 total. For most downstream analyses, the union of VM and striatum filtered proteins (1733) are referred to as the filtered APEX2 proteomics data. See Figure 3—source data 2 for complete results and summary of proteins before and after filtering.
Figure 3—figure supplement 2
Clustered heatmap of protein abundances for union of filtered ventral midbrain (VM) and Str APEX2 proteins.
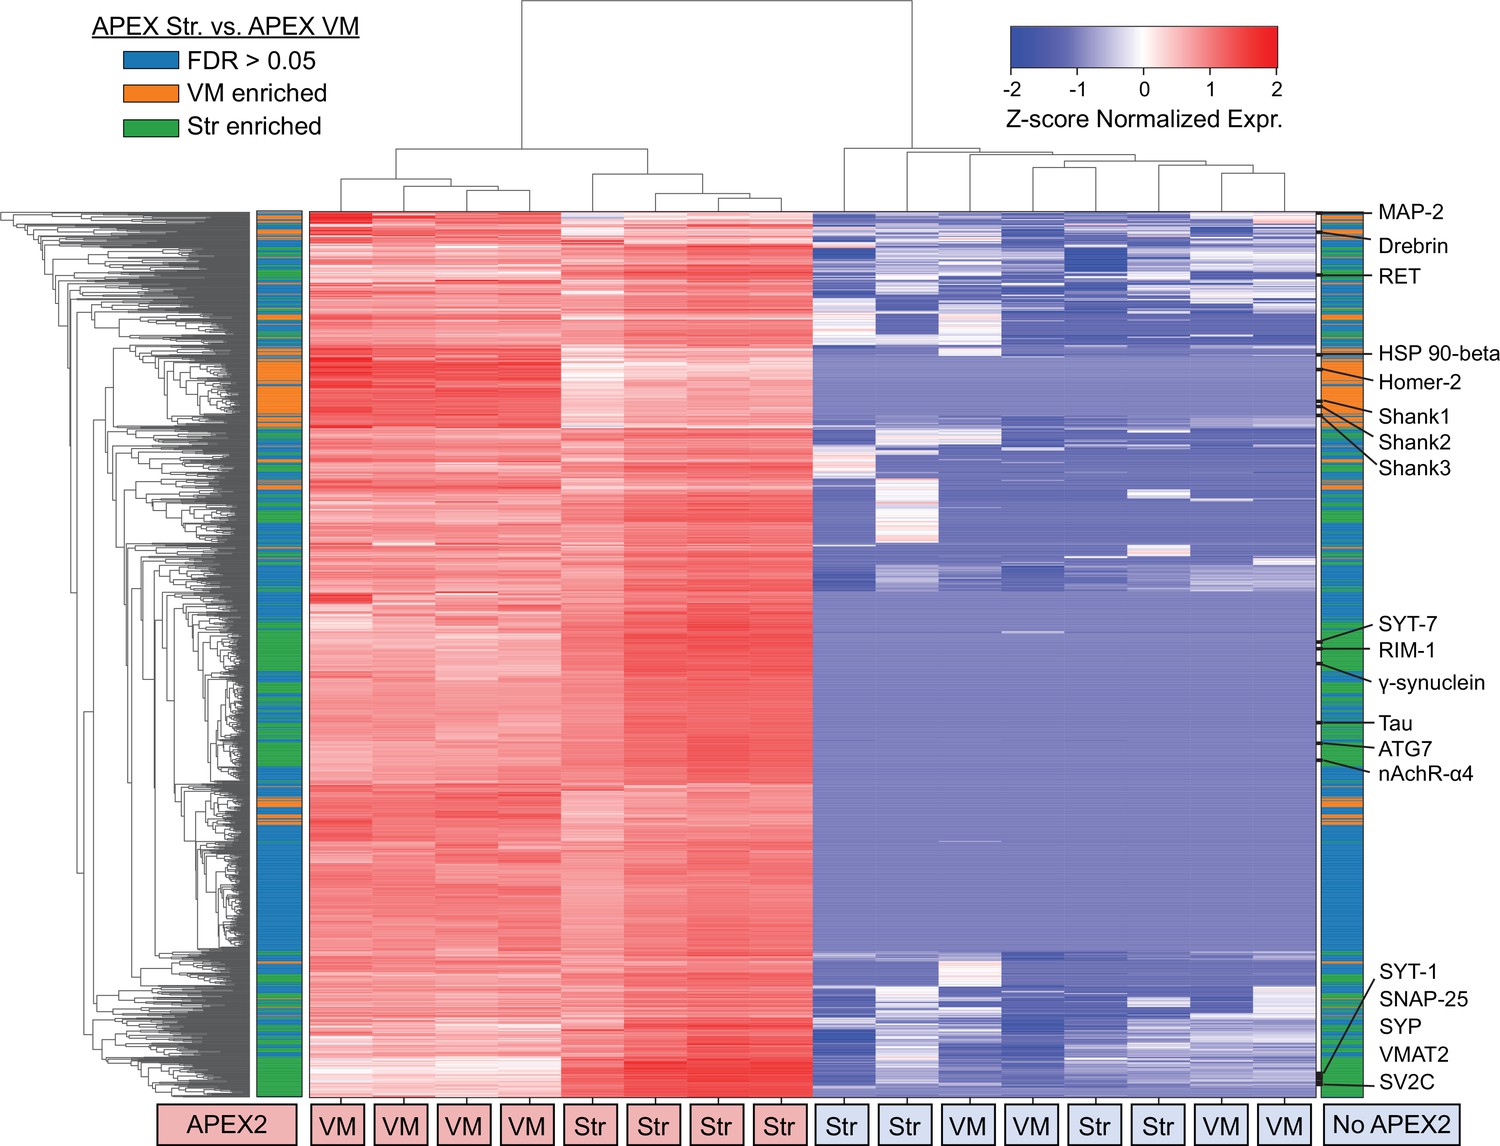
Clustered heatmap of Z-scores for abundances of proteins presents in the filtered proteomics data from VM or striatum (1733 proteins). Each column represents a biological replicate (n = 4) of APEX2+ or APEX2− streptavidin pulldown samples from the VM or striatum. The color bars on the left and right are identical; both indicate whether a given protein was enriched in the VM (orange) or striatum (green) in differential expression analysis between APEX2+ pulldown samples (false discovery rate [FDR] <0.05 after Benjamini–Hochberg corrected p values from Welch’s t-test). Select proteins from within given VM- or Str-enriched protein clusters are displayed on the right.
Figure 3—figure supplement 3
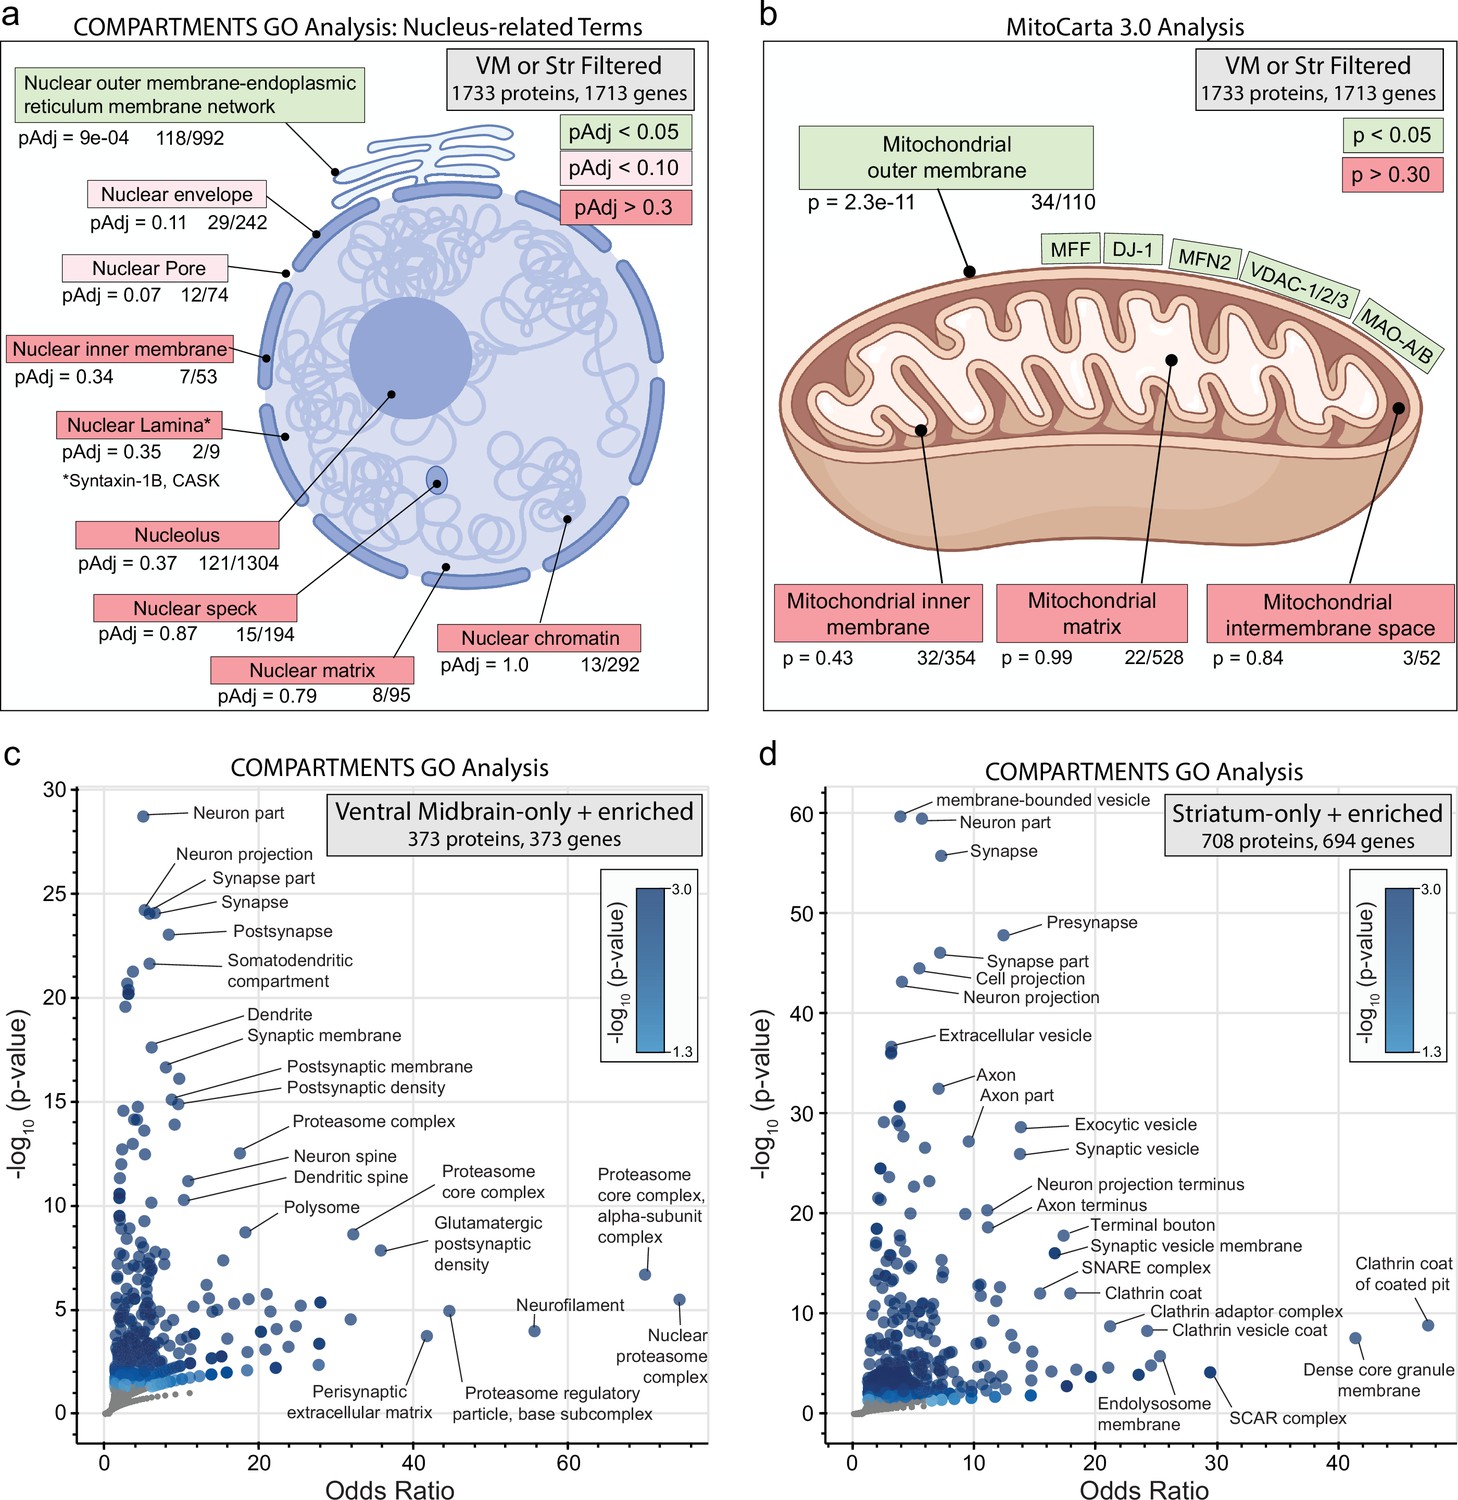
Subcellular compartment gene ontology (GO) analysis of filtered ventral midbrain (VM) and Str APEX2 proteins.
(a) Targeted GO analysis of proteins in filtered VM or striatum APEX2+ data (1733 proteins encoded by 1713 genes). Proteins were analyzed for overlap with GO terms related to nucleus in the COMPARTMENTS resource (Binder et al., 2014). The number of proteins present in the filtered APEX2 data out of all proteins in each ontology is shown below each term, with false discovery rate (FDR)-corrected p values derived from the hypergeometric test. (b) Same as (a) but using mitochondrial compartmental localizations present in the MitoCarta 3.0 database (Rath et al., 2021). Select proteins present in the mitochondrial outer membrane list are displayed. (c) Enrichr-based GO analysis of proteins passing filter only in VM APEX2+ samples or enriched in APEX2+ VM vs. striatum differential expression (in total, 373 genes encoding 373 proteins). The 373 genes were analyzed using the subcellular compartments ontology terms provided by the COMPARTMENTS resource (Binder et al., 2014). All GO terms with p < 0.05 are colored in blue, with select terms indicated for those displaying the lowest p values and highest odds ratio. See Figure 3—source data 3 for complete results. (d) Same as (c) but for proteins passing filter only in striatum APEX2+ samples or enriched in APEX2+ striatum vs. VM differential expression (in total, 694 genes encoding 708 proteins).
Figure 4 with 2 supplements
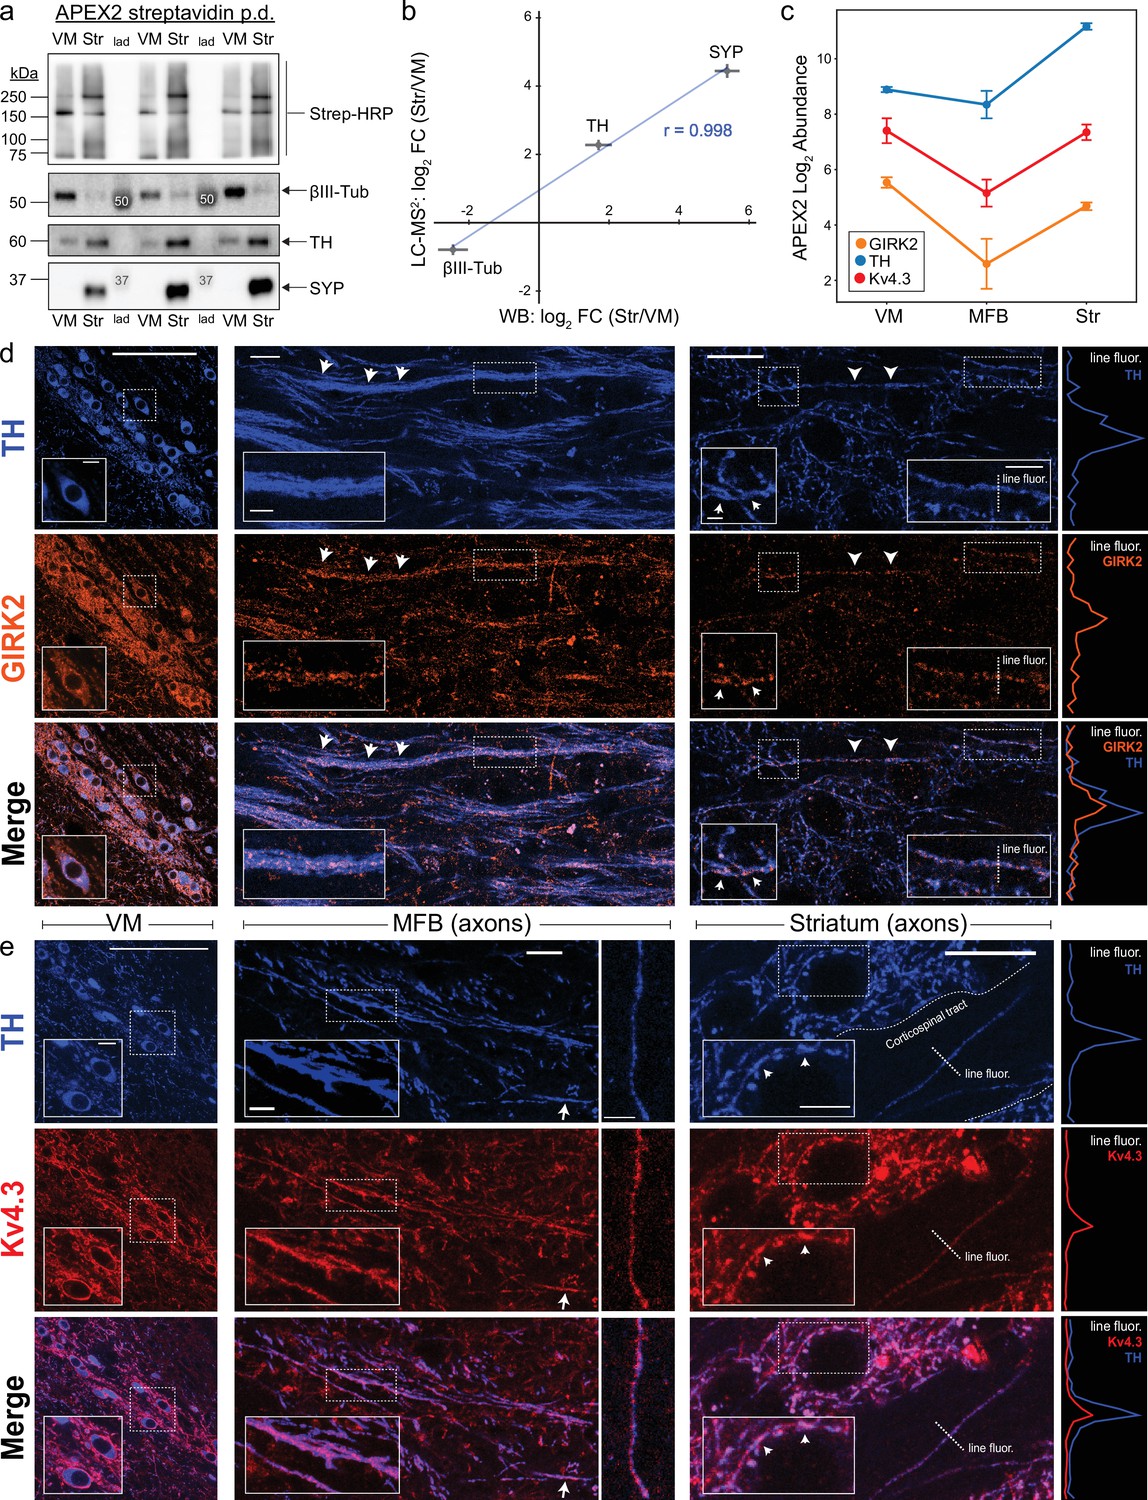
Antibody validation and axonal localization of potassium channels Kv4.3 and GIRK2.
(a) Western blotting of streptavidin pulldowns from APEX2+ samples, with proteins eluted from an equal fraction of streptavidin beads (~2.5% of total captured protein in each region) in each lane. Ventral midbrain (VM) and Str pairs from the same mouse are separated by molecular weight ladder (lad). Molecular weight markers detected by chemiluminescence are indicated with white font in the images. (b) Quantification of proteomics (LC–MS2) and western blot (WB) data for TH, SYP (synaptophysin), and βIII-tubulin (Tubb3). Mean ± standard error of the mean (SEM) of the log2 FC (Str/VM) from n = 4 biological replicates. Pearson’s correlation coefficient r as indicated (p < 0.05). (c) APEX2 proteomics data for GIRK2 (Kir3.2/Kcnj6), TH, and Kv4.3 (Kcnd3). Mean ± SEM of the protein abundances, as log2(total intensity normalized abundance + 1), are shown for n = 4 biological replicates of APEX2+ streptavidin pulldown samples in the indicated regions. Immunohistochemistry for TH and potassium channels GIRK2 (d) or Kv4.3 (e) in sagittal sections. Left: VM, soma, and dendrites. Middle: medial forebrain bundle (MFB), axons. Right: striatum, axons. Insets in each image are indicated with dashed white rectangles. Arrows indicate prominent sites of colocalization. Traces on the far right are fluorescence profiles for the indicated dashed lines (‘line fluor’). (d) Scale bars: (Left) main: 100 µm, inset: 10 µm. (Middle) main: 15 µm, inset: 5 µm. (Right) main: 15 µm, left inset: 2 µm, right inset: 5 µm. (e) Scale bars: (Left) main: 100 µm, inset: 10 µm. (Middle) main left: 15 µm, inset: 10 µm, main right: 10 µm. (Right) main: 15 µm, inset: 5 µm.
-
Figure 4—source data 1
Western blots related to Figure 4a.
- https://cdn.elifesciences.org/articles/70921/elife-70921-fig4-data1-v2.zip
-
Figure 4—source data 2
Enrichr GO analysis related to Figure 4—figure supplement 1.
- https://cdn.elifesciences.org/articles/70921/elife-70921-fig4-data2-v2.xlsx
Figure 4—figure supplement 1
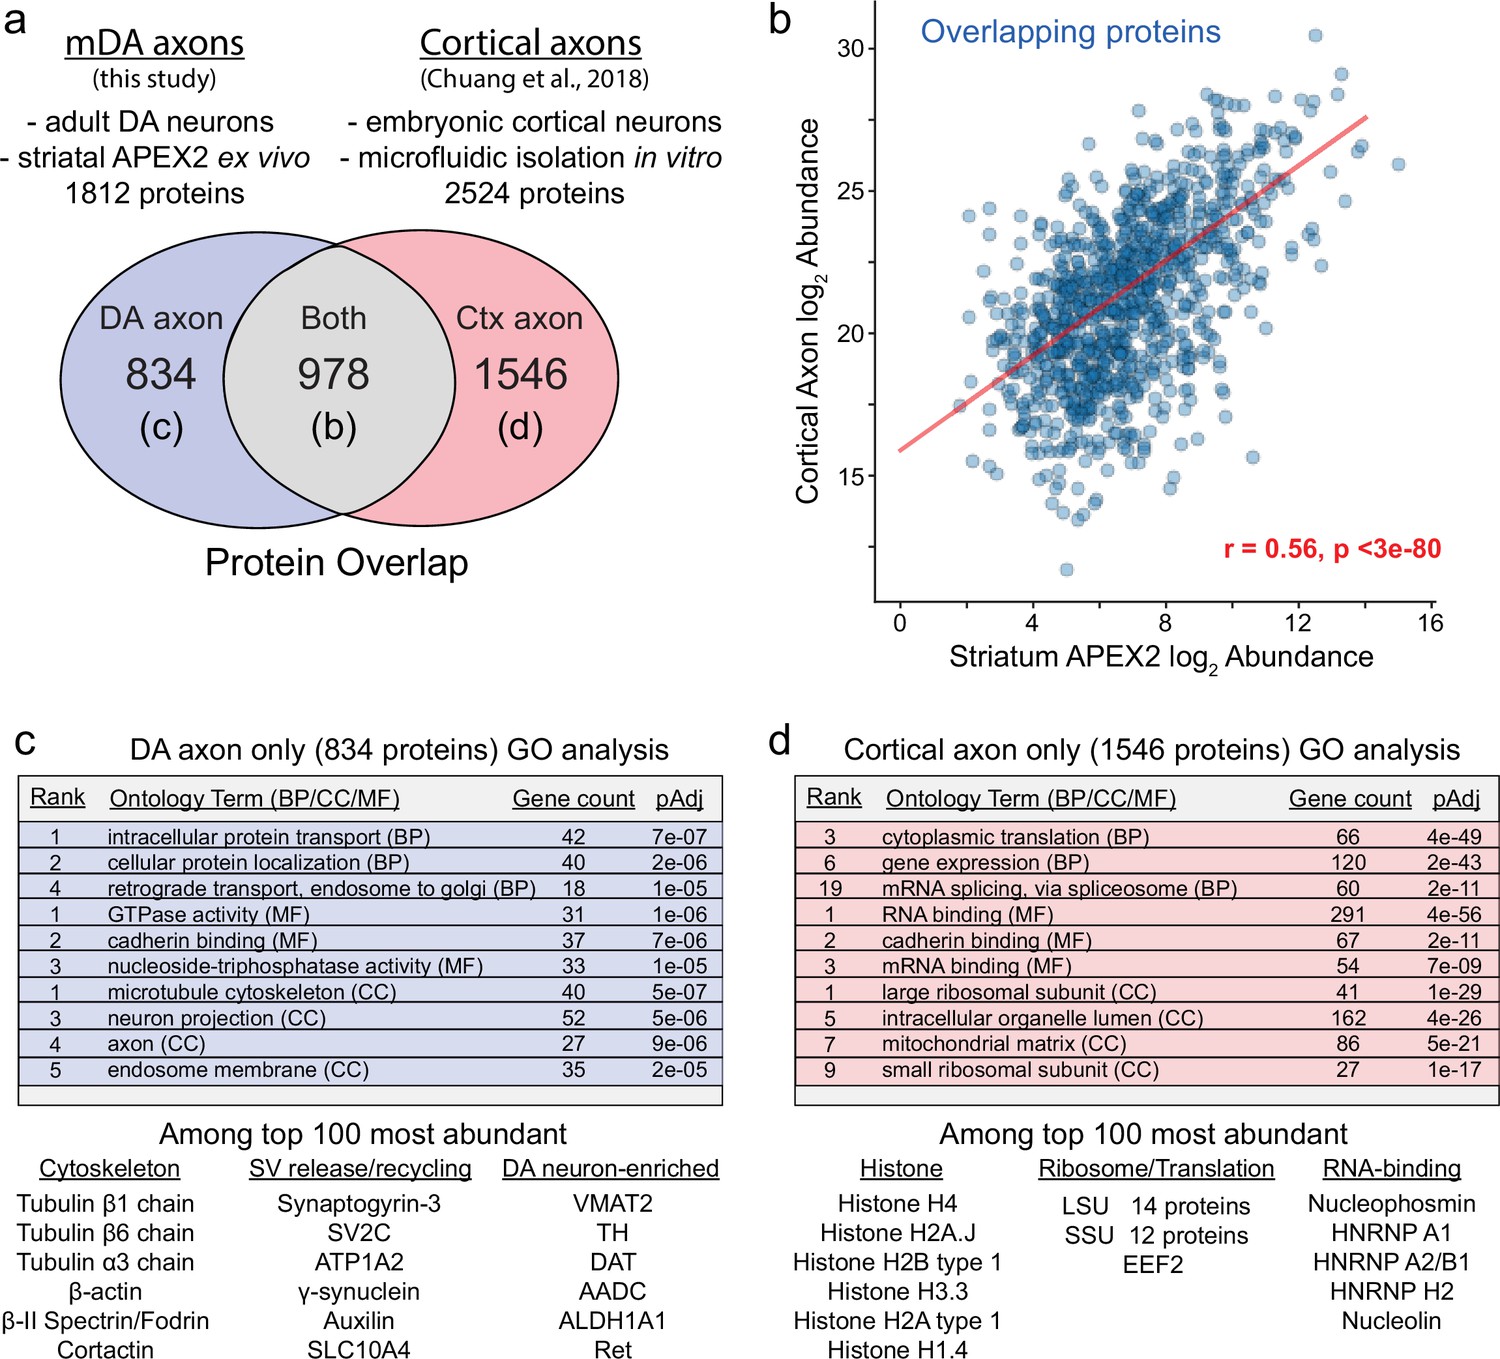
Comparison of striatal APEX2 midbrain dopaminergic (mDA) axon proteome and cortical axon proteome.
(a) Comparison of methodology and protein overlap between this study and Chuang et al., 2018. Proteins detected in both datasets are plotted in (b). Gene ontology (GO) analysis for proteins detected only in one dataset in (c, d). (b) Scatter plot of log2 normalized protein abundances for the 978 proteins detected in both datasets from (a). APEX2 data are log2(total intensity normalized abundance + 1), cortical axon data are log2(average iBAQ intensity) from Chuang et al., 2018. Pearson’s r = 0.56, p < 3e−80. (c, d) Enrichr-based GO analysis of genes encoding proteins identified only in the striatal APEX2 data (834) or only in the cortical axon data (1546). Representative examples of proteins among the top 100 most abundant in each set are listed below the tables.
Figure 4—figure supplement 2
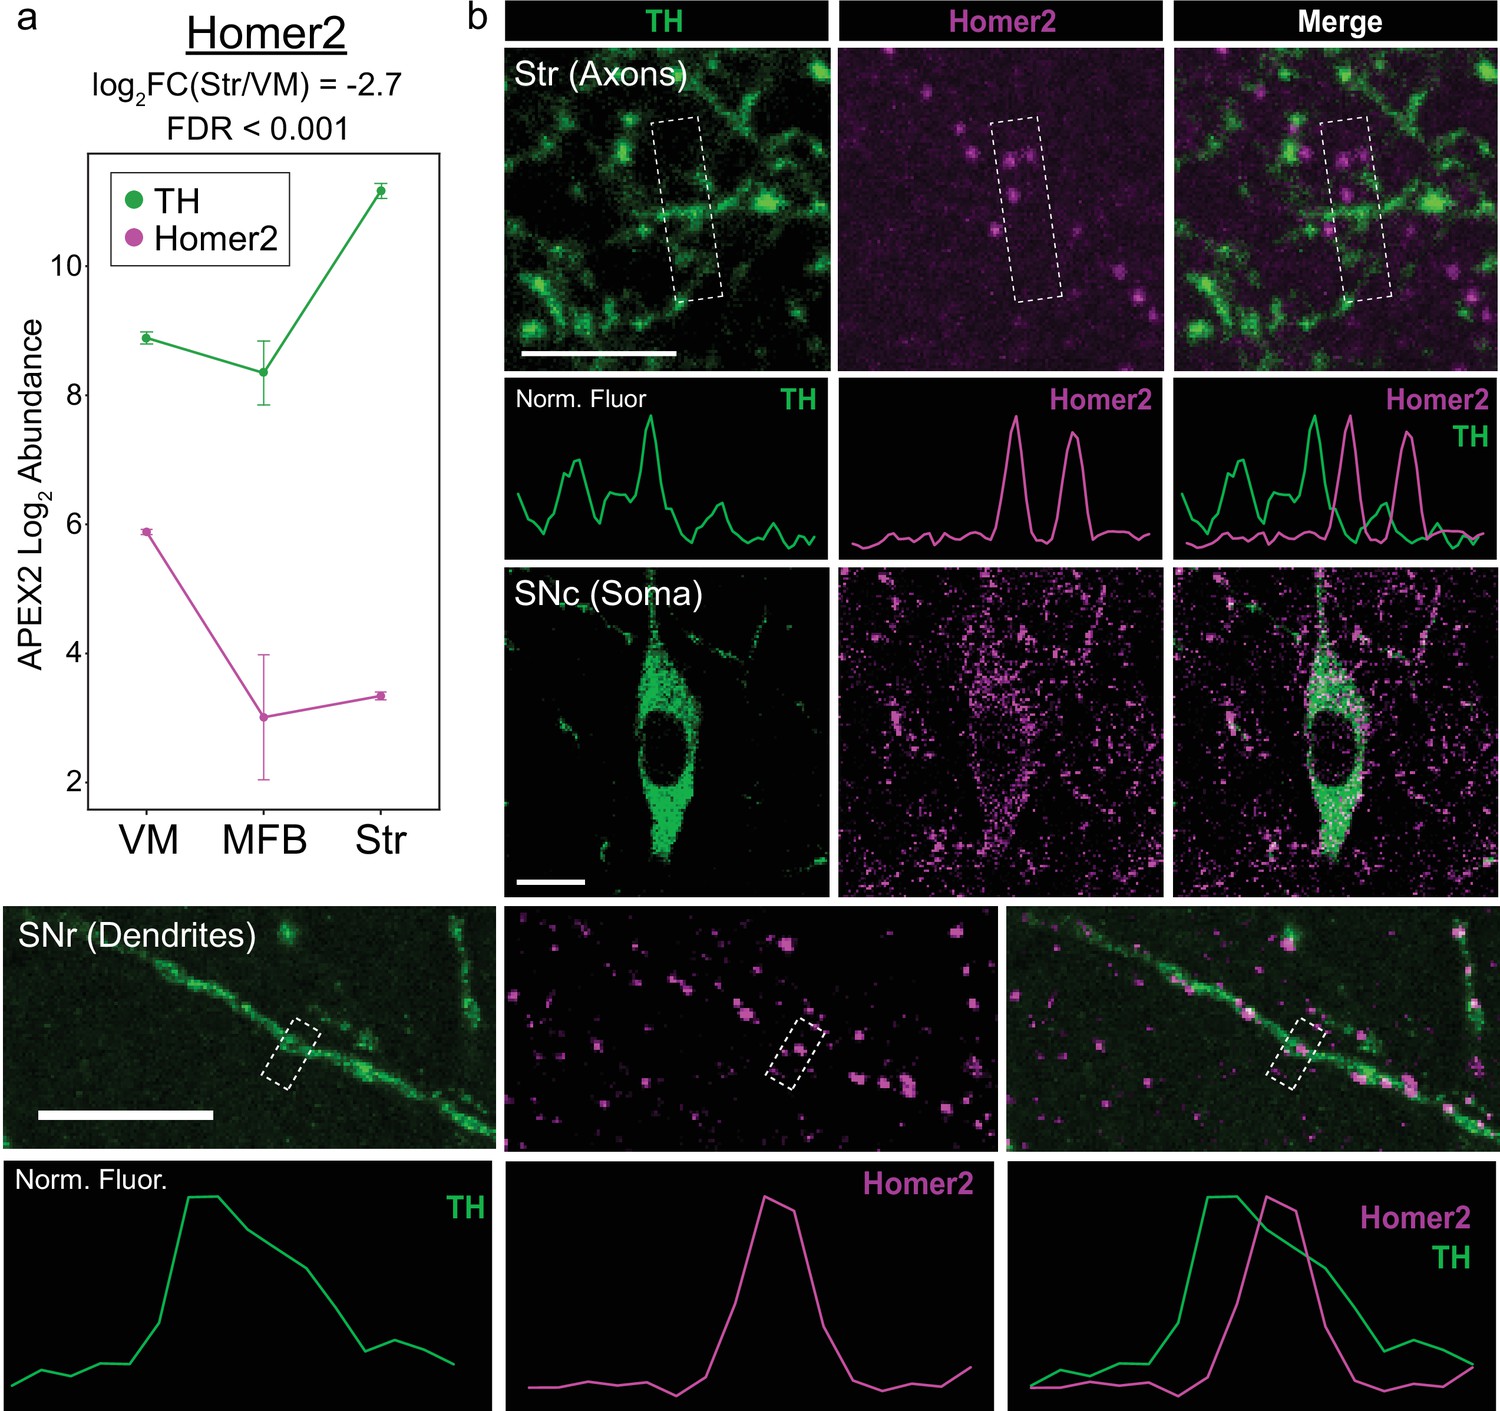
Somatodendritic enrichment of Homer2 confirmed via immunohistochemistry.
(a) APEX2 proteomics data for tyrosine hydroxylase (TH) and Homer2. Mean ± standard error of the mean (SEM) of the protein abundances, as log2(total intensity normalized abundance +1), are shown for n = 4 biological replicates of APEX2+ streptavidin pulldown samples. (b) Immunohistochemistry (IHC) for TH and Homer2 in the indicated regions. Normalized fluorescence traces are shown for line profiles through the center of the white dashed boxes. Scale bars: (Upper) 5 µm, (Middle) 10 µm, (Lower) 10 µm.
Figure 5 with 2 supplements
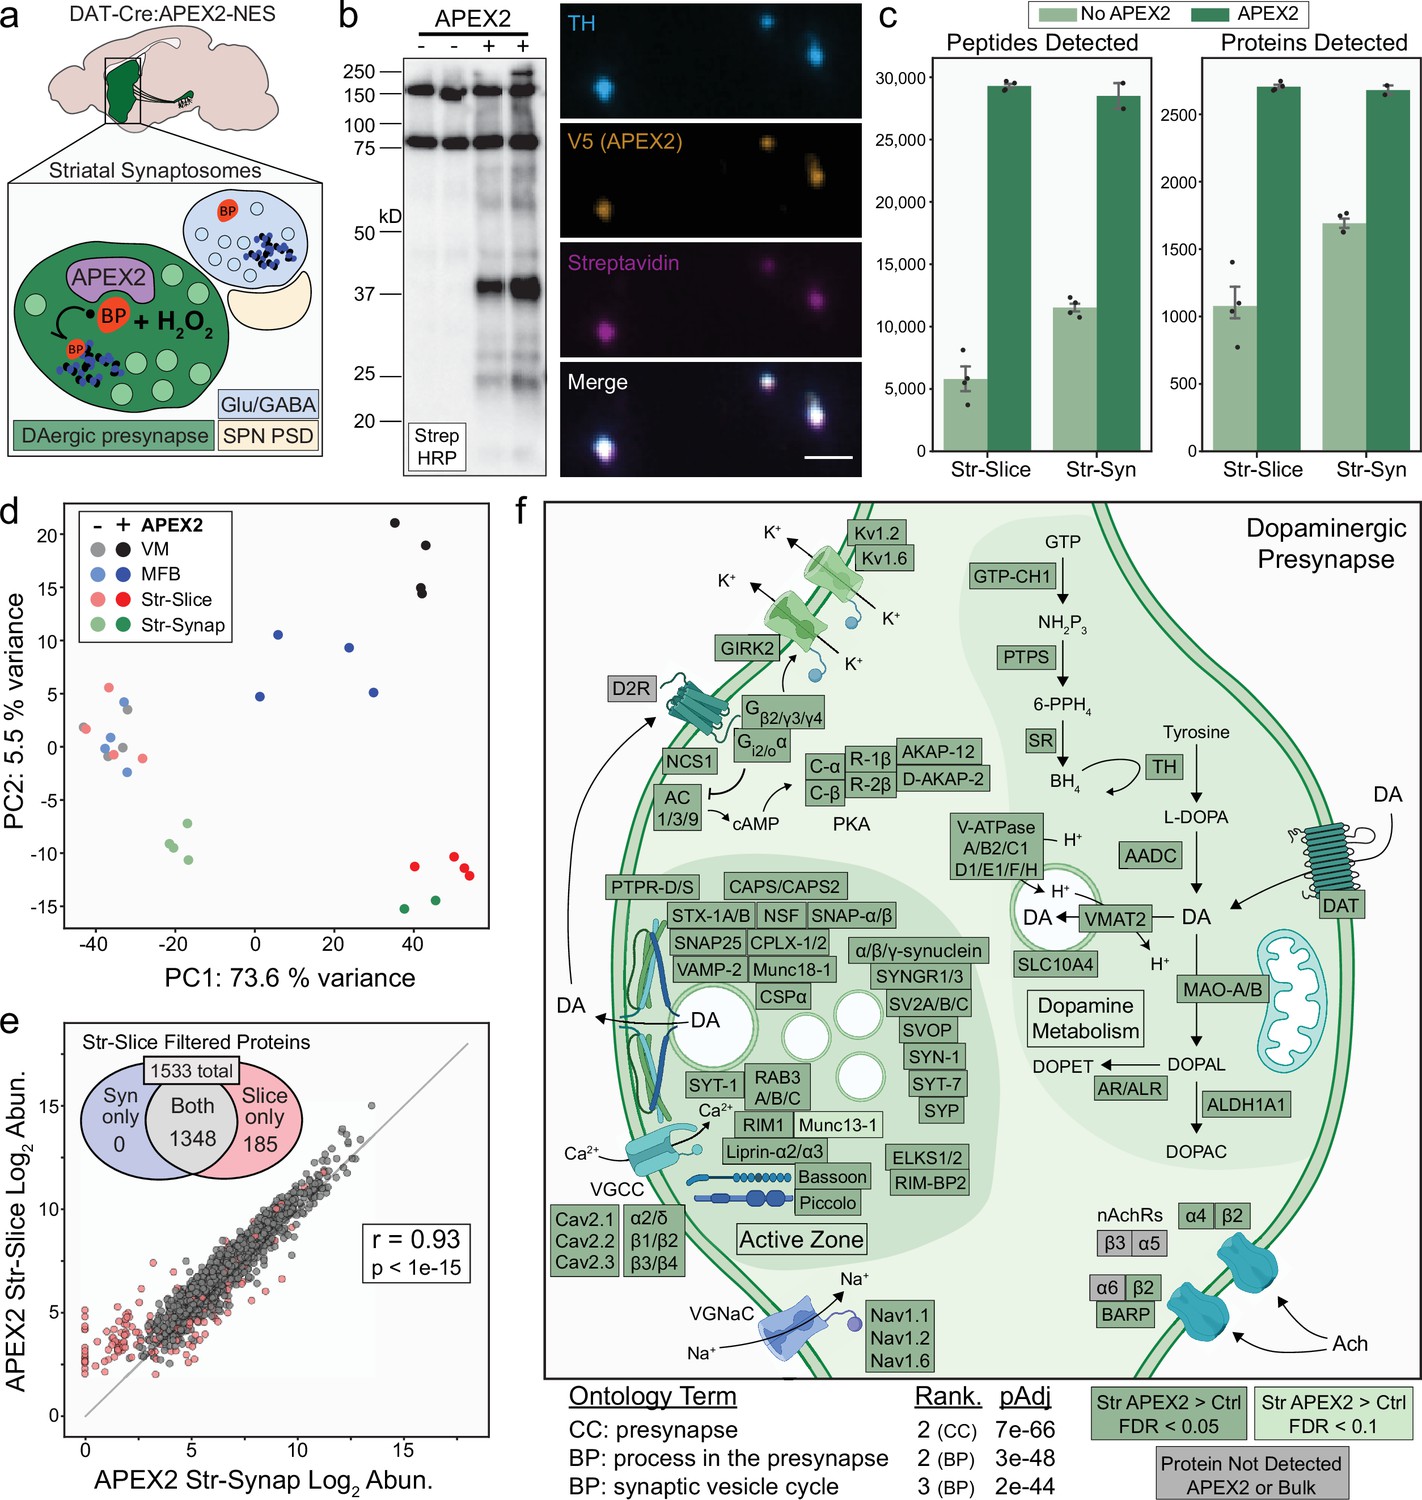
APEX2 labeling in synaptosomes and dopaminergic presynaptic proteome.
(a) Schematic depicting APEX2 labeling in dopaminergic striatal synaptosomes. A crude synaptosome fraction (P2) is rapidly prepared from the striatum, washed, incubated with biotin phenol (0.5 mM for 30 min), labeled with 1 mM hydrogen peroxide (H2O2) for 60 s, quenched with antioxidants and sodium azide, centrifuged, and flash frozen as a pellet for downstream streptavidin pulldown and proteomics (see Materials and methods). (b) Left: streptavidin–horseradish peroxidase (HRP) western blot of proteins captured by streptavidin pulldown from striatal synaptosomes of DAT-Cre mice with or without expression of APEX2-NES. Right: immunostaining of synaptosomes from DAT-Cre:APEX2+ striatum. Synaptosomes were bound to poly-lysine coated coverslips during biotin phenol incubation, washed, and fixed after H2O2 treatment. Scale bar: 2 µm. (c) Mean ± standard error of the mean (SEM) of peptides and proteins detected per biological replicate of APEX2− or APEX2+ streptavidin pulldowns of indicated regions. Str-slice data are the same as in same as in Figure 2c (n = 4 each for APEX2−/APEX2+). n = 4 for APEX2− Str-Syn, n = 2 for APEX2+ Str-Syn. (d) Principal components analysis of all APEX2− and APEX2+ biological replicates for the 1733 proteins present either in VM or Str after filtering (see Figure 3b). PC1 captures 73.6% of the variance and is dominated by APEX2+ vs. APEX2− samples, while PC2 captures 5% of the variance and stratifies regional APEX2+ samples. APEX2+ Str-Syn samples are highly similar to APEX2+ Str-Slice samples. (e) Log–log abundance plots of APEX2+ streptavidin pulldown samples for the indicated regions. Axes represent the average log2(total intensity normalized abundance + 1) for each sample type (n = 2 and n = 4 biological replicates for Str-Synaptosomes and Str-Slice, respectively). Out of 1533 Str-Slice APEX2+ filtered proteins (see Figure 3—figure supplement 1d), 1348 show concordant enrichment in Str-Syn APEX2+ vs. APEX2− comparisons (log2 FC >0 and false discovery rate [FDR] <0.15). These 1348 proteins were retained for gene ontology (GO) analysis (panel f). Accordingly, Str-Syn and Str-Slice APEX2+ samples show robust Pearson’s correlation (r = 0.93, p value <1e−15). (f) GO analysis (SynGO) of Str-Slice- and Str-Syn-enriched proteins 1348 proteins, see panel (e). Selected GO terms are listed along with adjusted p values and adjusted p value rank for each GO term category (Cellular Component, Biological Process). Canonical and representative proteins from the ontologies are shown. Proteins depicted are either present in the filtered Str-Slice proteomics data (FDR <0.05, APEX2 vs. Control, dark green), nearly missed the Str-Slice significance thresholds (FDR <0.1, APEX2 vs. Control, light green), or were not detected in any APEX2 or bulk striatal tissue samples (gray). See Figure 5—source data 2 for complete GO summary. Abbreviations: SPN PSD, spiny projection neuron postsynaptic density; TH, tyrosine hydroxylase; MFB, medial forebrain bundle; Str, striatum; VM, ventral midbrain. See Figure 5—source data 1 for complete list of protein and metabolite abbreviations in (f).
-
Figure 5—source data 1
Protein and metabolite abbreviations used in Figure 5f.
- https://cdn.elifesciences.org/articles/70921/elife-70921-fig5-data1-v2.xlsx
-
Figure 5—source data 2
SynGO analysis related to Figure 5f and Figure 5—figure supplement 1.
- https://cdn.elifesciences.org/articles/70921/elife-70921-fig5-data2-v2.xlsx
-
Figure 5—source data 3
Protein abbreviations used in Figure 5—figure supplement 1.
- https://cdn.elifesciences.org/articles/70921/elife-70921-fig5-data3-v2.xlsx
-
Figure 5—source data 4
Western blots related to Figure 5b.
- https://cdn.elifesciences.org/articles/70921/elife-70921-fig5-data4-v2.zip
Figure 5—figure supplement 1
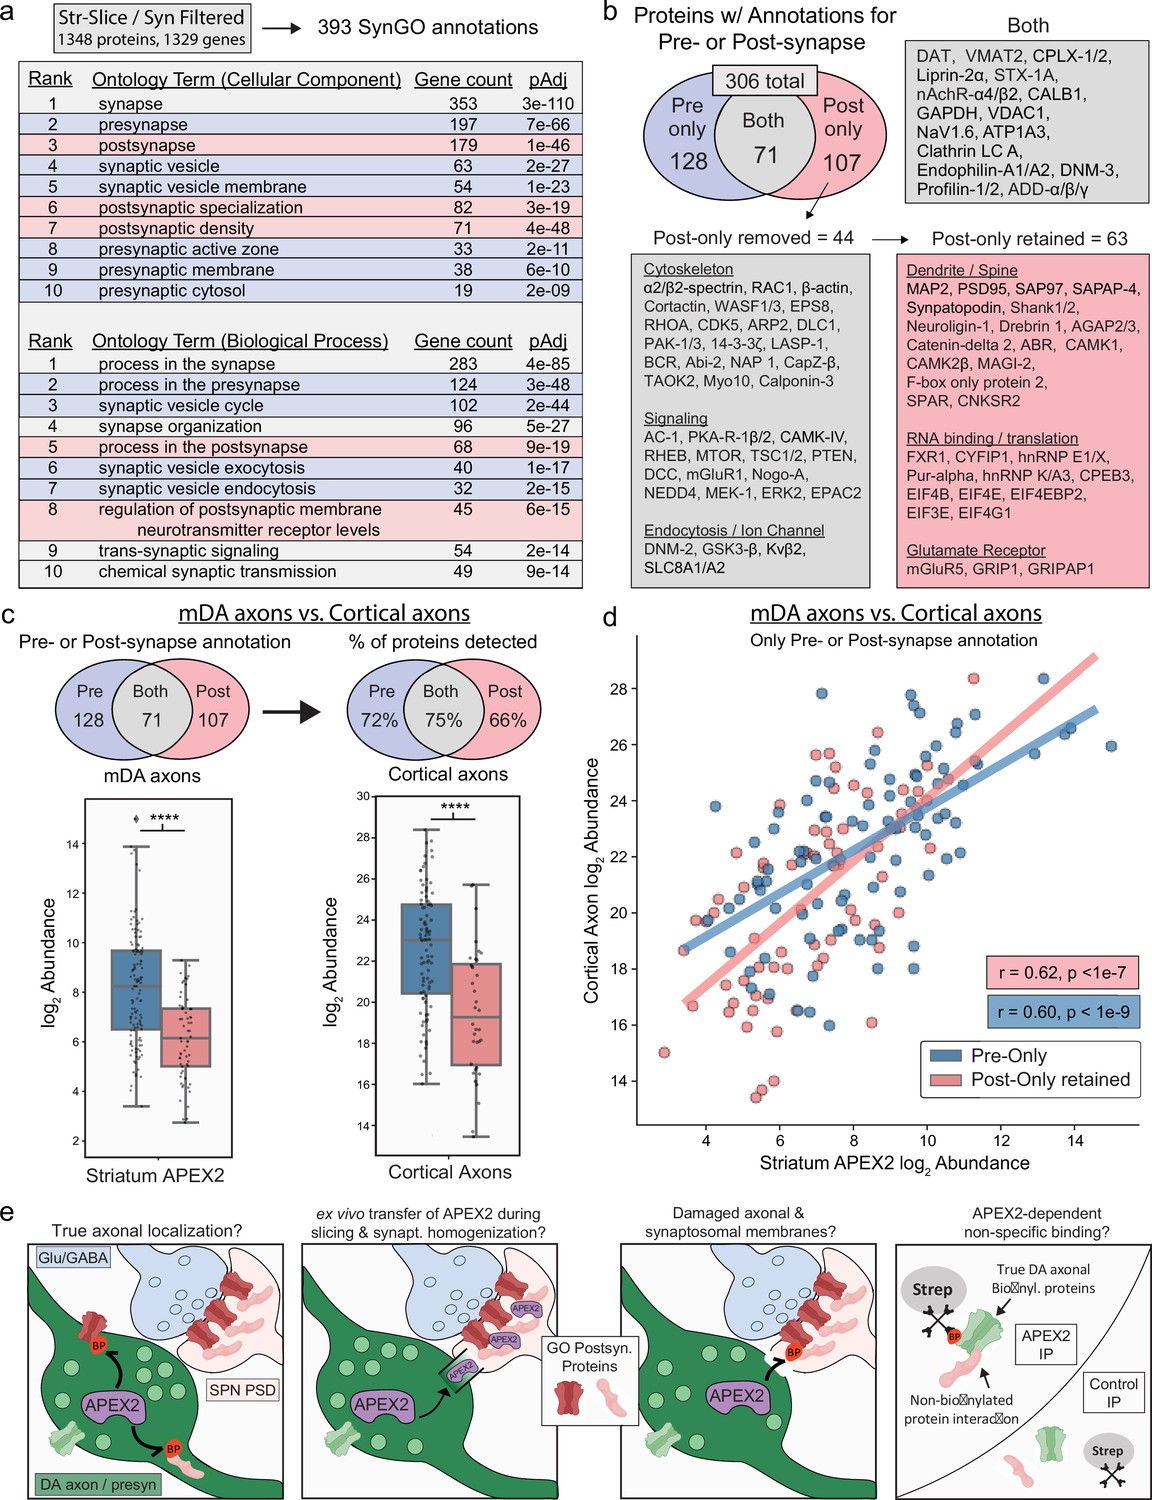
Synaptic gene ontology analysis proteins of striatal slice and synaptosomal APEX2 data.
(a) SynGO (Koopmans et al., 2019) analysis of striatum slice and synaptosome filtered proteins (1348 proteins encoded by 1329 genes, with 393 SynGO annotations). The top 10 ontology terms for Cellular Component and Biological Process are shown. See Figure 5—source data 2 for complete results. (b) Downstream filtering of 179 genes from Cellular Component term ‘postsynapse’. Seventy-one proteins with dual annotation to presynapse and postsynapse were removed from the ‘postsynapse’ set (proteins such as DAT and VMAT2 shown in ‘Both’). The remaining 107 proteins were designated as having ‘post-only’ annotations, and were further filtered to remove generic cytoskeletal, signaling, and synaptic proteins with functions in both pre- and postsynapse. All 44 proteins removed are shown under ‘post-only removed’. The remaining 63 proteins were designated as ‘post-only retained’ for downstream analysis. See Figure 5—source data 3 for complete list of protein abbreviations in (b). (c) Upper: overlap of indicated protein sets derived from SynGO analysis (a, b) with cortical axon data from Chuang et al., 2018. Lower: log2 abundance of protein sets from Upper in midbrain dopaminergic (mDA) axon data (left) and cortical axon data (right). APEX2 data are log2(total intensity normalized abundance + 1), cortical axon data are log2(average iBAQ intensity). **** indicates p < 0.0001, Mann–Whitney U-test. (d) Scatter plot of log2 abundance for proteins with pre- or postsynaptic annotation derived from SynGO analysis (a, b). APEX2 data are log2(total intensity normalized abundance + 1), cortical axon data are log2(average iBAQ intensity). Pearson’s r and p values are calculated separately for each set. (e) Schematic depicting possible mechanisms underlying striatal APEX2 enrichment of proteins associated with classical postsynaptic gene ontologies (‘post-only retained’ shown in b).
Figure 5—figure supplement 2
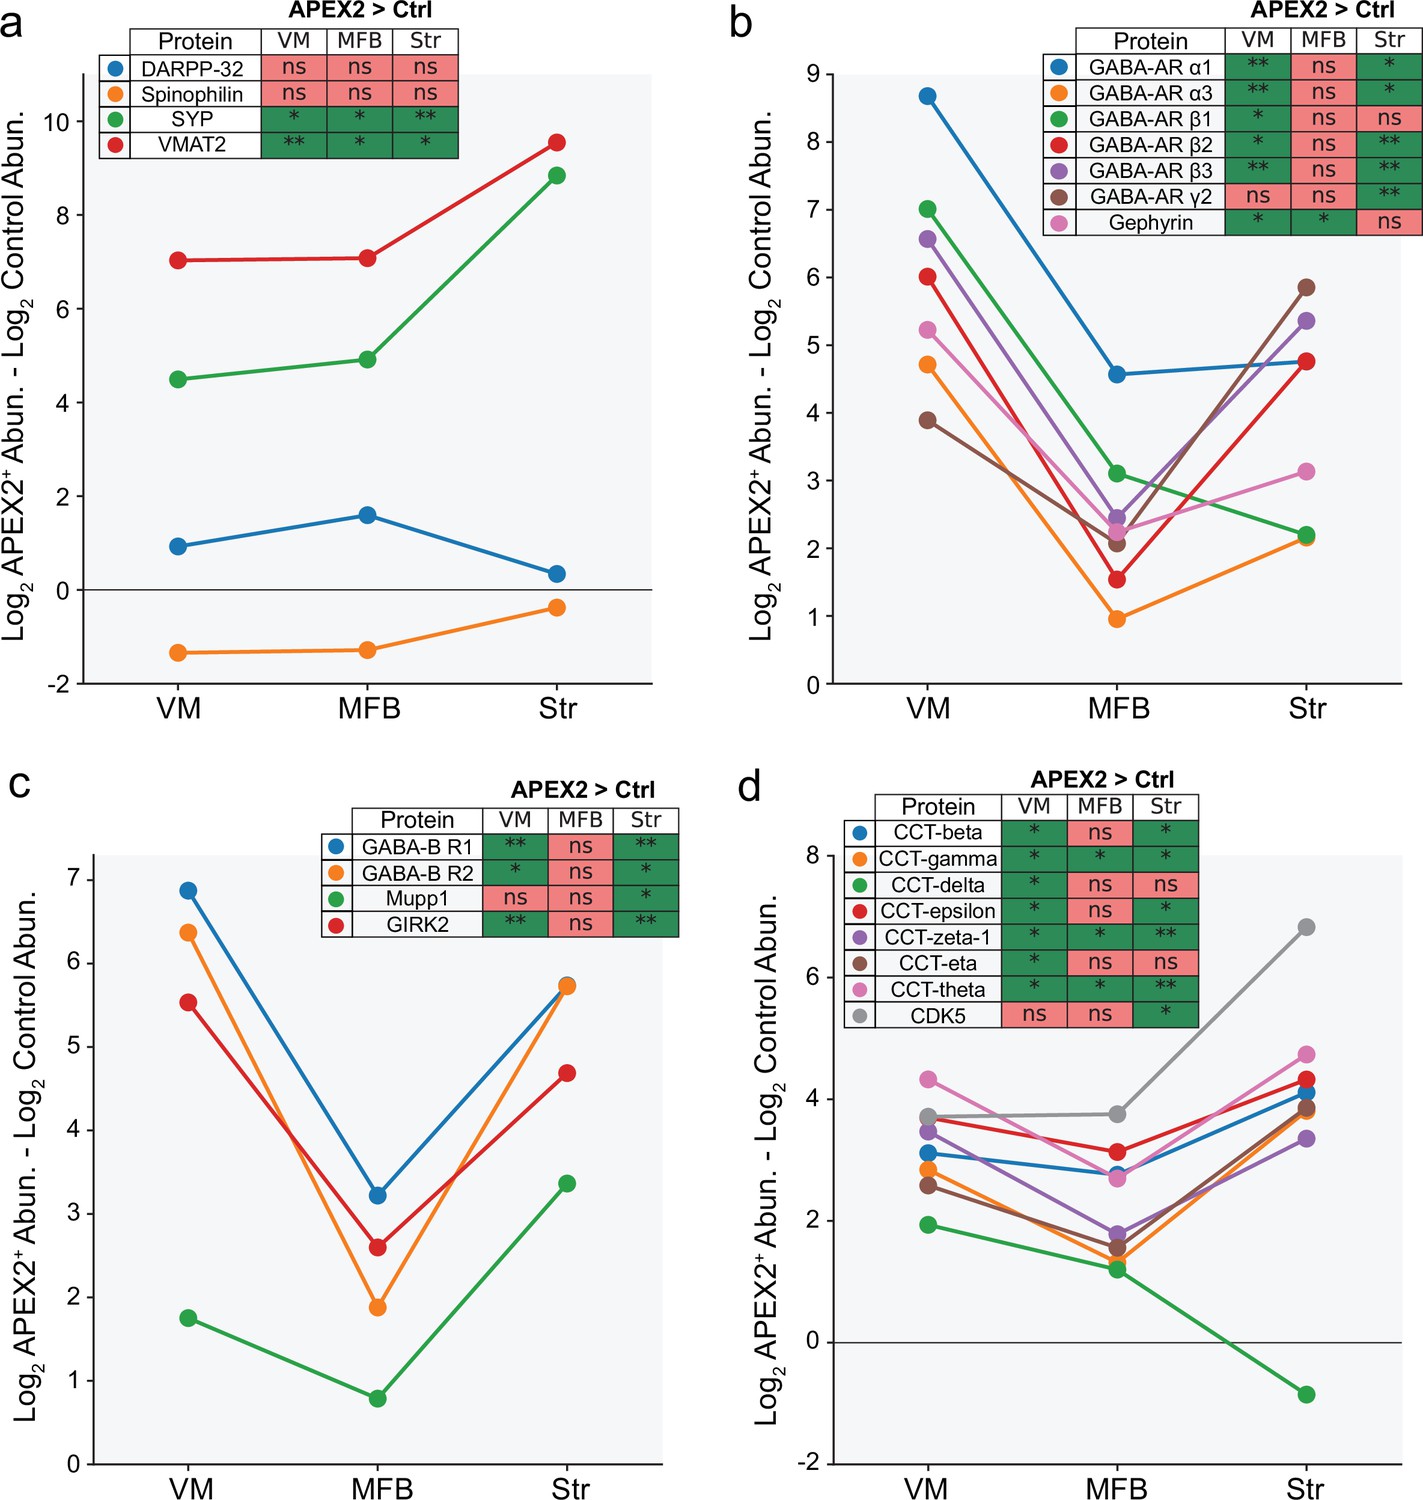
APEX2 enrichment of specific protein groups across midbrain dopaminergic (mDA) neuronal regions.
For all panels, the difference in average log2(total intensity normalized abundance + 1) between APEX2+ and APEX2− (control) samples is plotted for the indicated proteins. The legend indicates the result of the Welch’s unequal variance t-test with Benjamini–Hochberg procedure to control the false discovery rate (FDR; n = 4 biological replicates each for APEX2+ and APEX2− samples in each region). * indicates FDR <0.05, ** indicates FDR <0.001. (a) Dendritic spine proteins DARPP-32 and Spinophilin are not enriched in APEX2 striatal samples, while presynaptic proteins Synaptophysin and VMAT2 are massively enriched. (b) GABA-A receptor subunits and scaffolding protein Gephyrin are strongly enriched by APEX2 in the ventral midbrain, but are also captured in the medial forebrain bundle and striatum. (c) GABA-B receptor subunits, PDZ-domain containing scaffolding protein Mupp1, and effector ion channel GIRK2 are captured by APEX2 in both VM and striatum. (d) CDK5 and most all members of the eukaryotic group II chaperonin TRiC (tailless complex polypeptide one ring complex) are captured by APEX2 in the VM and striatum. Protein abbreviations: DARPP-32, dopamine- and cyclic-AMP-regulated phosphoprotein of molecular weight 32 kDa; SYP, synaptophysin; VMAT2, vesicular monoamine transporter 2; GABA-AR, GABA-A receptor subunit; GABA-BR, GABA-B receptor subunit; GIRK2, G-protein-activated inward rectifier potassium channel 2; CCT, chaperonin-containing tailless complex polypeptide one subunit; CDK5, cyclin-dependent kinase 5.
Figure 6 with 2 supplements
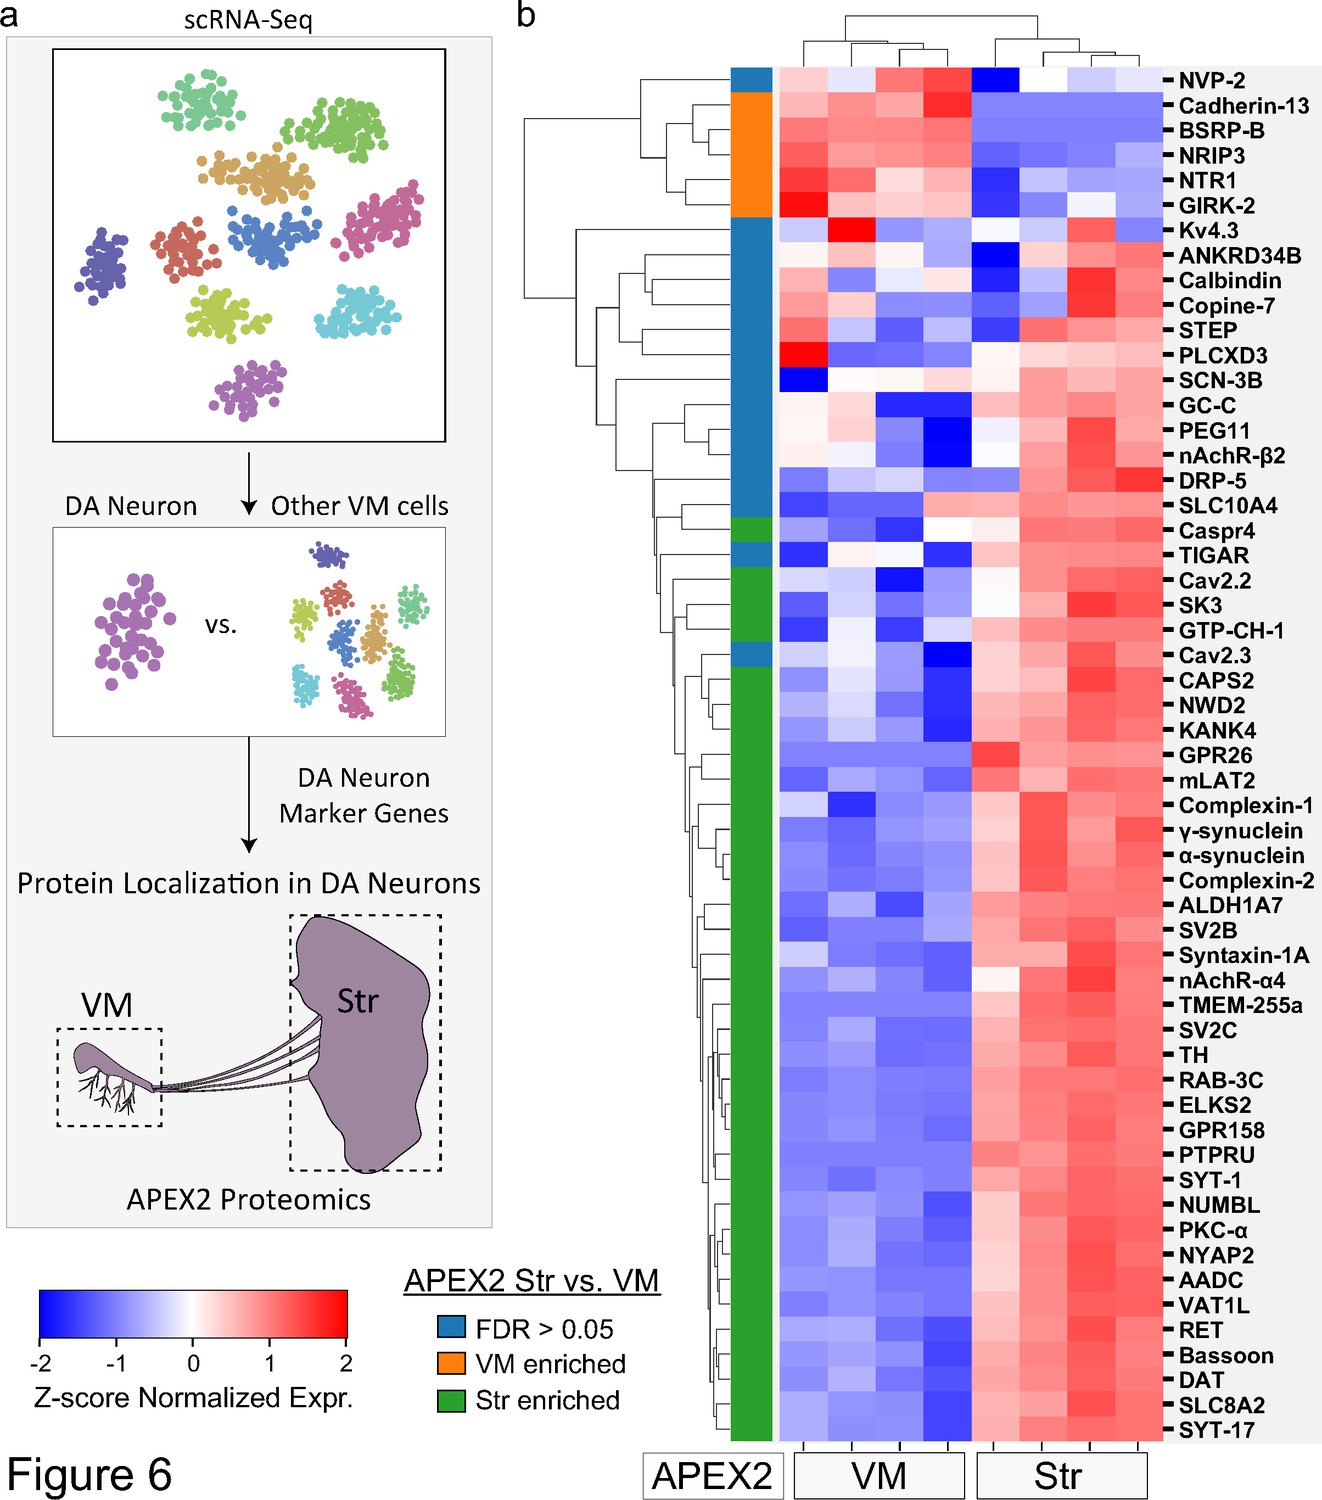
Subcellular proteomic analysis of proteins encoded by midbrain dopaminergic (mDA) neuron marker genes.
(a) Schematic depicting analysis workflow for integrating APEX2 proteomics data with single-cell RNA-sequencing (scRNA-seq) and genetic data. Proteins encoded by top mDA neuron marker genes from mouse scRNA-seq data (Saunders et al., 2018) are analyzed for subcellular protein localization in the APEX2 proteomics data. (b) Clustered heatmap of Z-scores for abundances of proteins encoded by the top 55 mDA neuron marker genes present in the filtered APEX2 proteomics data. Each column represents a biological replicate (n = 4) of APEX2+ streptavidin pulldown samples from the ventral midbrain (VM) or striatum. The color bar on the left indicates whether a given protein was enriched in the VM (orange) or striatum (green) in differential expression analysis between APEX2+ streptavidin pulldown samples (false discovery rate [FDR] <0.05 after Benjamini–Hochberg corrected p values from Welch’s t-test). See Figure 6—source data 1 for summary of mDA neuron marker genes and protein abbreviations.
-
Figure 6—source data 1
Mouse dopamine (DA) neuronal marker genes, corresponding mouse proteins, and protein abbreviations shown in Figure 6b.
- https://cdn.elifesciences.org/articles/70921/elife-70921-fig6-data1-v2.xlsx
-
Figure 6—source data 2
Unique molecular identifier (UMI) count matrix including high-confidence dopamine (DA) neuron single-cell RNA-sequencing (scRNA-seq) profiles used in this study (data from Saunders et al., 2018).
- https://cdn.elifesciences.org/articles/70921/elife-70921-fig6-data2-v2.zip
Figure 6—figure supplement 1
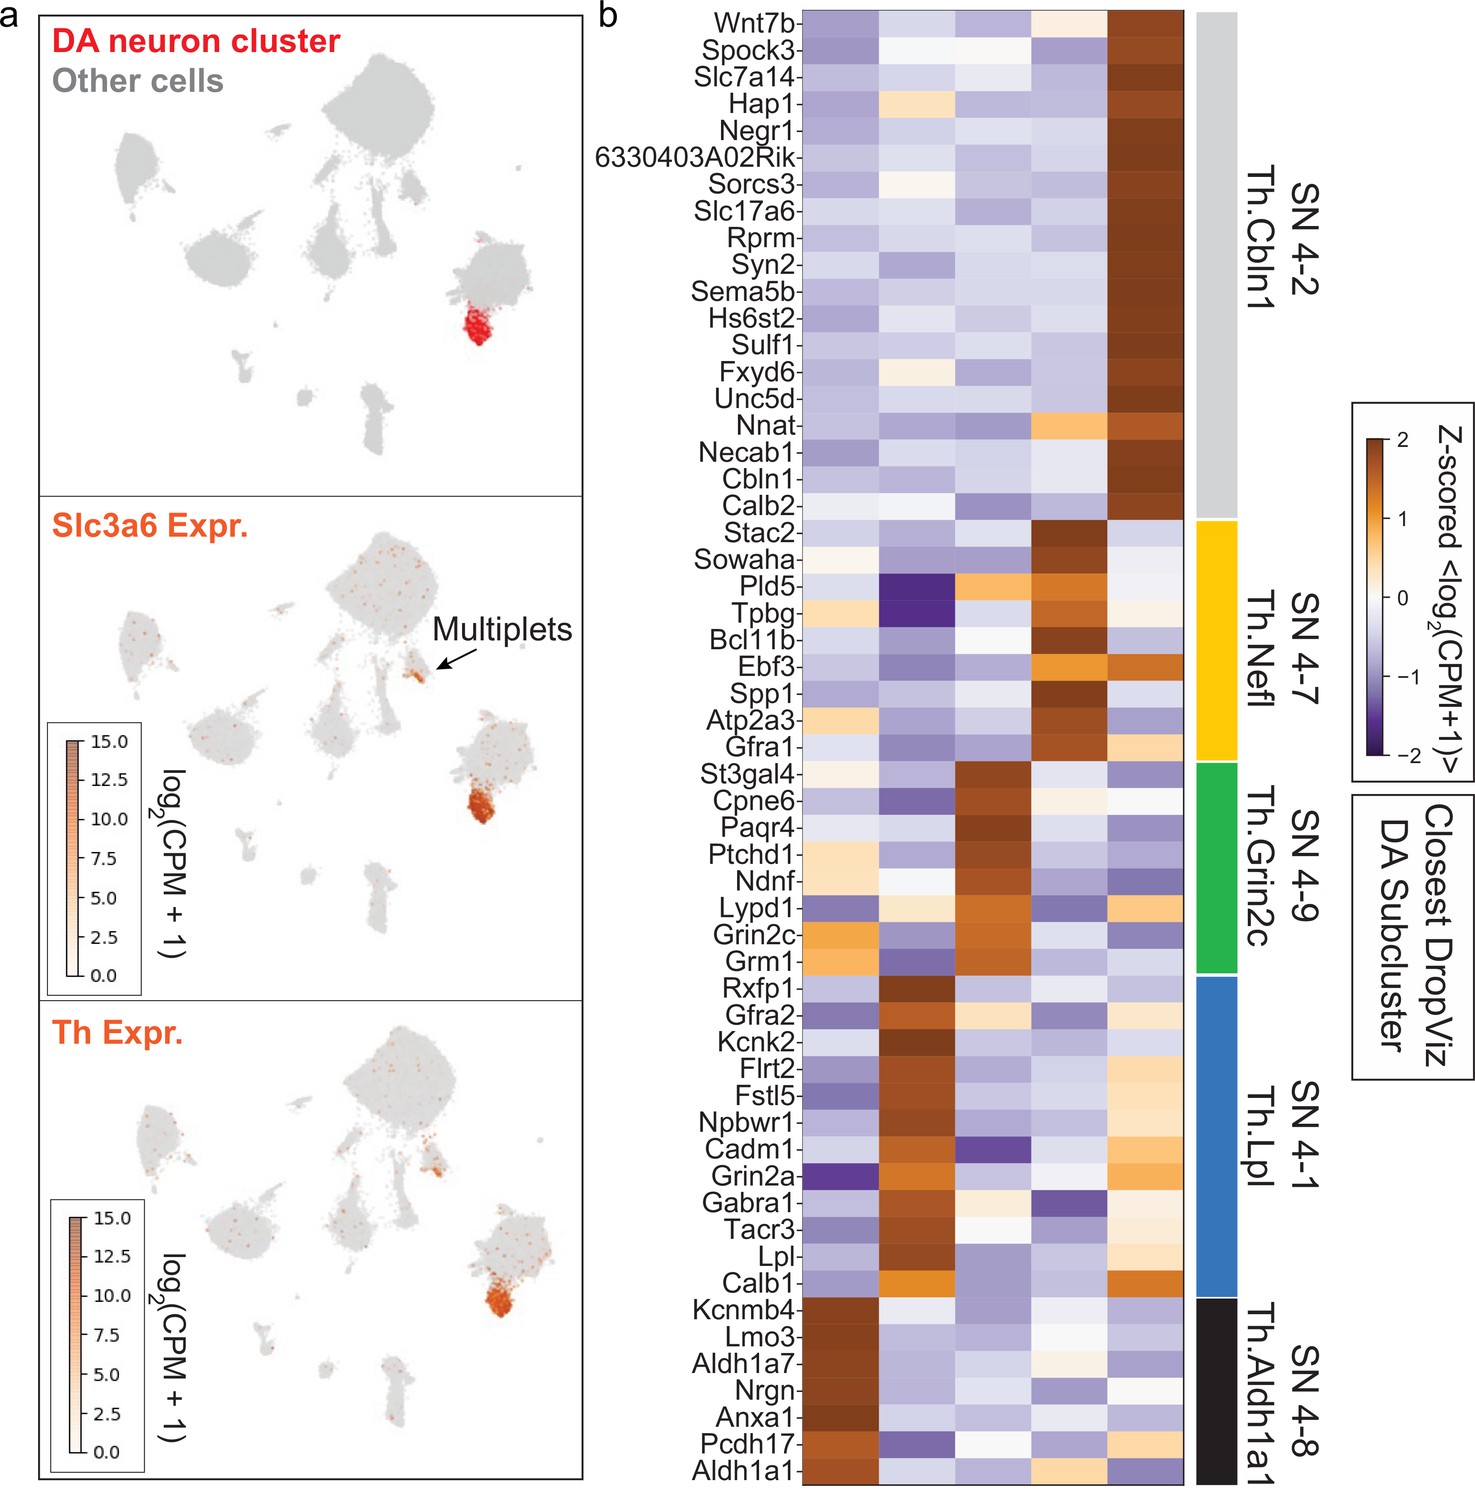
Identification of midbrain dopaminergic (mDA) neuron cluster and subclusters for downstream analysis.
(a) Uniform Manifold Approximation and Projection (UMAP) embedding of single-cell RNA-sequencing (scRNA-seq) data from Saunders et al., 2018. A single cluster with statistically significant coenrichment of dopamine neuron markers such as Th and Slc6a3, based on the binomial test for expression specificity, was identified. After subclustering the putative dopamine neurons, we identified a small subcluster with statistical enrichment of astrocyte markers such as Agt, Gja1, Glul, and Slc1a3. for pan-mDA neuronal expression analysis. This subcluster was discarded due to likely astrocyte contamination. After removal of low-quality cells, we retained the remaining subclusters as high-confidence mDA neuron profiles (see Materials and methods). mDA neuron profiles used in this study are found in Figure 6—source data 2. (b) Subclustering of high-confidence mDA neurons identified five transcriptionally distinct mDA neuron subsets. Markers determined using the binomial test are shown in the heatmap, and were used to identify the closest corresponding cluster present in the DropViz data (Saunders et al., 2018).
Figure 6—figure supplement 2
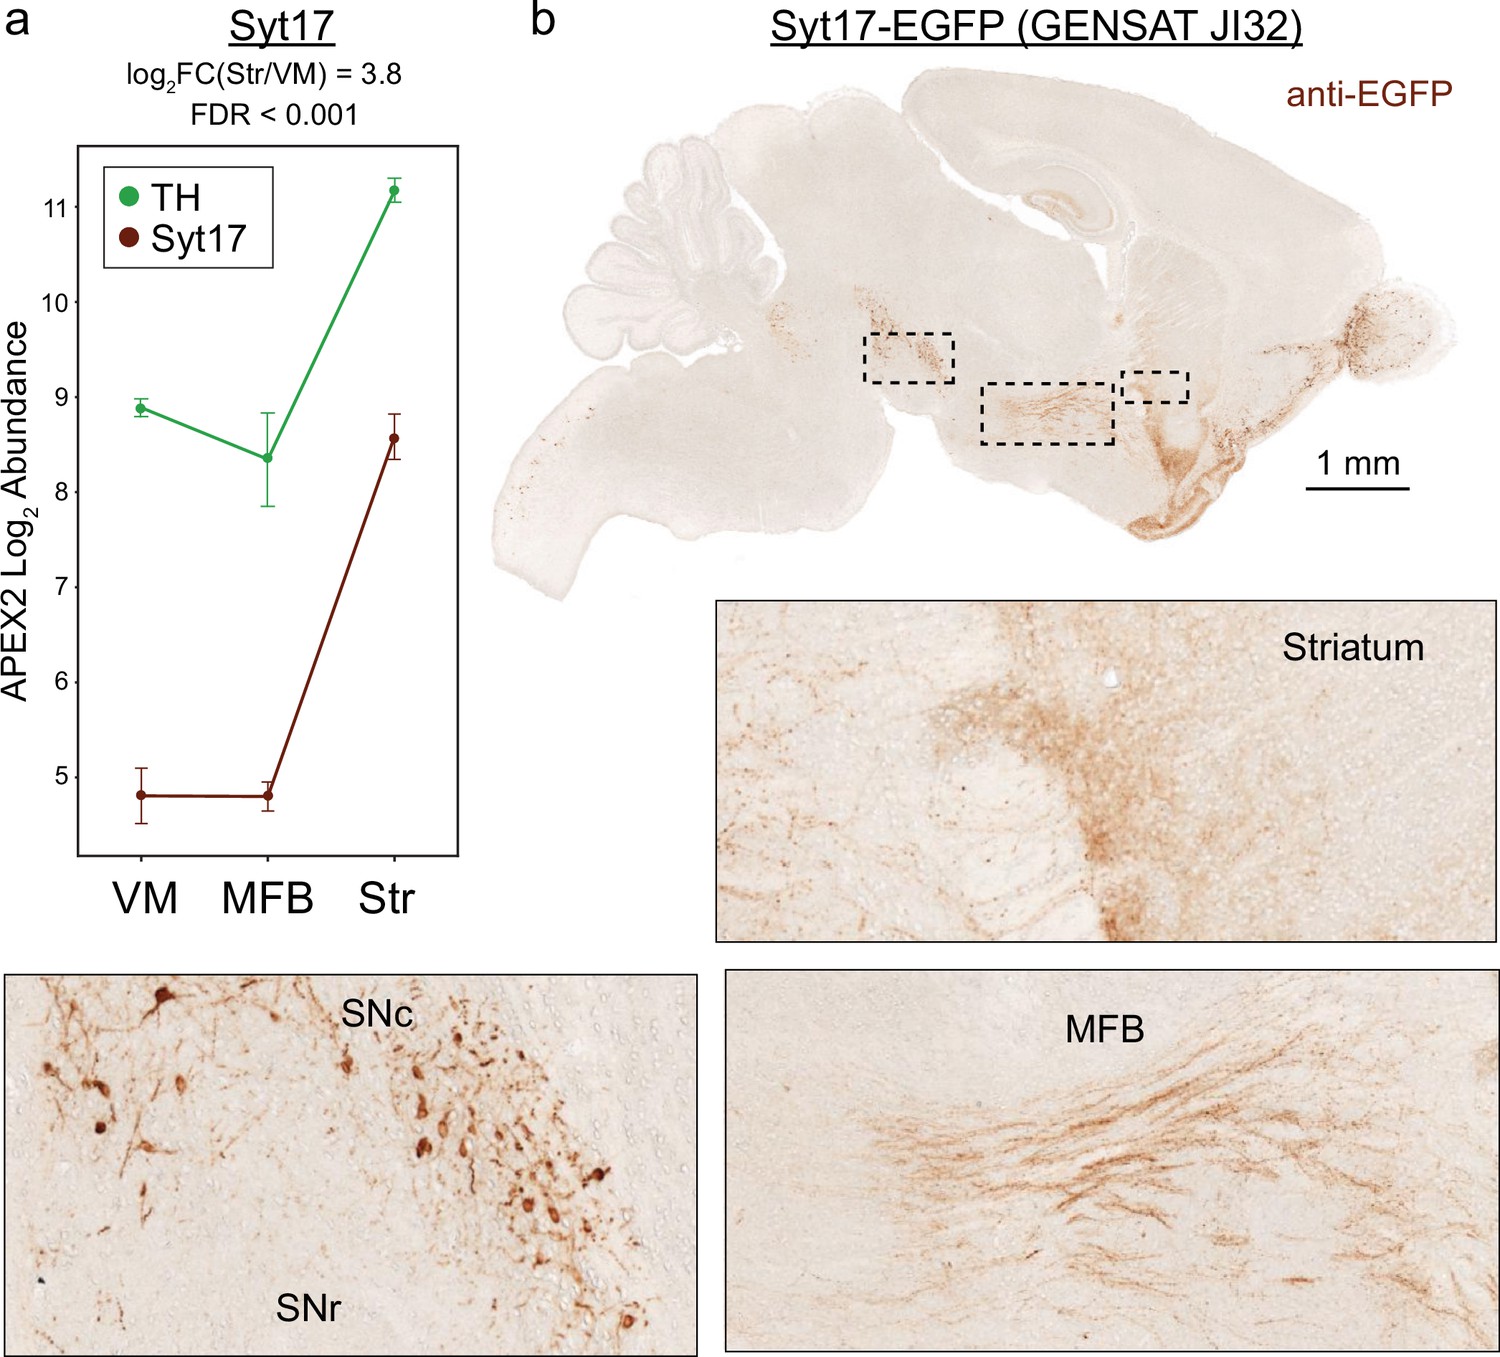
Midbrain dopaminergic (mDA) neuron enrichment and axonal localization of Syt-17 confirmed via GENSAT mouse JI32.
(a) APEX2 proteomics data for tyrosine hydroxylase (TH) and Syt-17. Mean ± standard error of the mean (SEM) of the protein abundances, as log2(total intensity normalized abundance + 1), are shown for n = 4 biological replicates of APEX2+ streptavidin pulldown samples in the indicated regions. (b) Images of anti-EGFP staining from GENSAT mouse line JI32 (Heintz, 2004) which expresses Syt-17-EGFP fusion protein. Insets are indicated in black dashed lines. Intense staining of mDA neurons and axons is observed in the ventral midbrain, medial forebrain bundle, and striatum.
Author response image 1

Comparison of proteomic normalization methods.
(A-B) Intragroup coefficient of variation (CV) for APEX2+ samples after normalization to total intensity vs. Pcca or APEX2 abundance. (C-D) Log2 Fold Changes and FDR q-values for VM vs. Str APEX2+ comparisons after normalization to total intensity or APEX2 abundance.
Additional files
Download links
A two-part list of links to download the article, or parts of the article, in various formats.
Downloads (link to download the article as PDF)
Open citations (links to open the citations from this article in various online reference manager services)
Cite this article (links to download the citations from this article in formats compatible with various reference manager tools)
Subcellular proteomics of dopamine neurons in the mouse brain
eLife 11:e70921.
https://doi.org/10.7554/eLife.70921


