Adaptation and compensation in a bacterial gene regulatory network evolving under antibiotic selection
- Dr. Vikram Sarabhai Institute of Cell and Molecular Biology, The Maharaja Sayajirao University of Baroda, India
- Department of Microbiology and Cell Biology, Indian Institute of Science, India
- Indian Institute of Science Education and Research (IISER), India
Figures
Figure 1 with 1 supplement
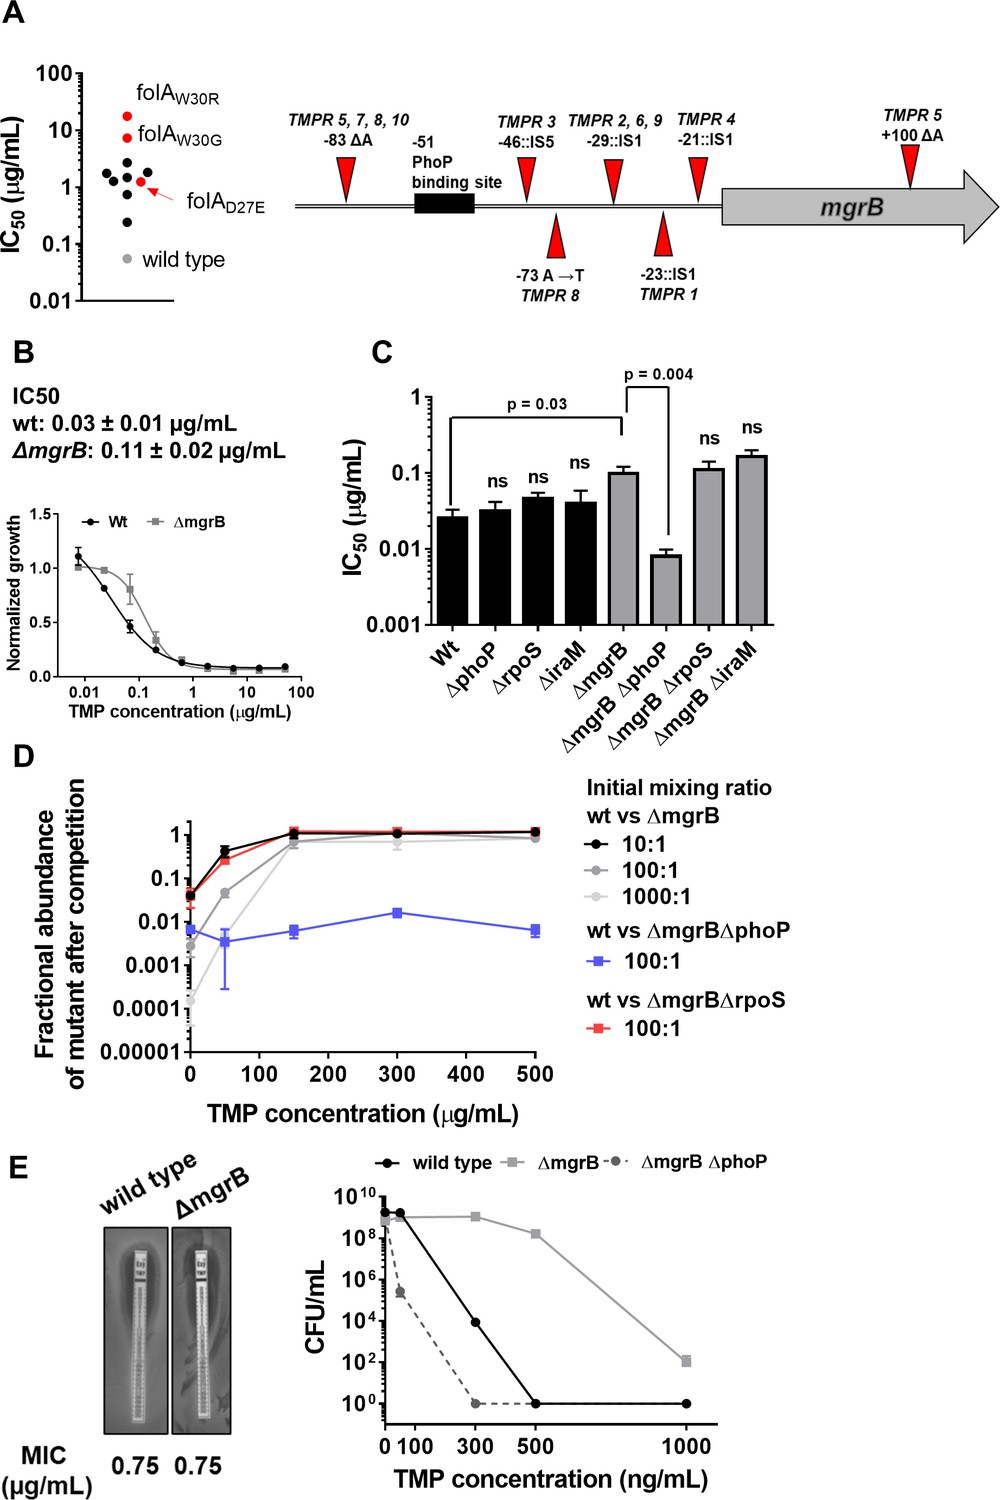
Loss of mgrB confers trimethoprim tolerance to Escherichia coli.
(A) Left panel. Trimethoprim IC50 values of resistant isolates derived from E. coli K-12 MG1655 (wild-type, gray) by laboratory evolution. Mean IC50 values from three independent measurements are plotted. Isolates without mutations in the folA locus are represented by black circles. Isolates with mutations in folA are represented as red circles, and the identified mutation is indicated. Right panel. Diagrammatic representation of the mgrB gene and its promoter showing mutations identified in trimethoprim resistant isolates TMPR1–5 by genome sequencing or Sanger sequencing from TMPR6–10. The PhoP-binding site in the mgrB promoter is shown as a black box. Location of each mutation is calculated as base pairs from the translation start site. (B) Growth of wild-type (black) and ΔmgrB (gray) E. coli in varying concentrations of trimethoprim, normalized to growth in drug-free medium. Each data point represents mean± SD from three independent experiments. IC50 values represent mean± SEM obtained after curve fitting. (C) IC50 values of trimethoprim for wild-type or mutant E. coli. Each bar represents mean± SEM from three independent measurements. Statistical significance was tested using a Student’s t-test. A p-value<0.05 was considered significant (shown), while p-values≥0.05 were considered non-significant (ns). (D) Competition between E. coli wild-type and ΔmgrB in increasing concentrations of trimethoprim starting at the indicated mixing ratios. The fraction of mutant bacteria (CFUs of mutant/total CFUs) in each mixed culture after ~9 generations of competition are plotted (mean± SD from three independent experiments). Results of competition between wild-type and ΔmgrBΔrpoS or ΔmgrBΔphoP strains at an initial mixing ratio of 100:1 are also shown. (E) Left panel. MIC values of trimethoprim for wild-type and E. coli ΔmgrB calculated from E-tests. Right panel. Colony formation of wild-type and ΔmgrB on solid media supplemented with indicated concentrations of trimethoprim. Each point represents mean± SD from three independent experiments.
Figure 1—figure supplement 1
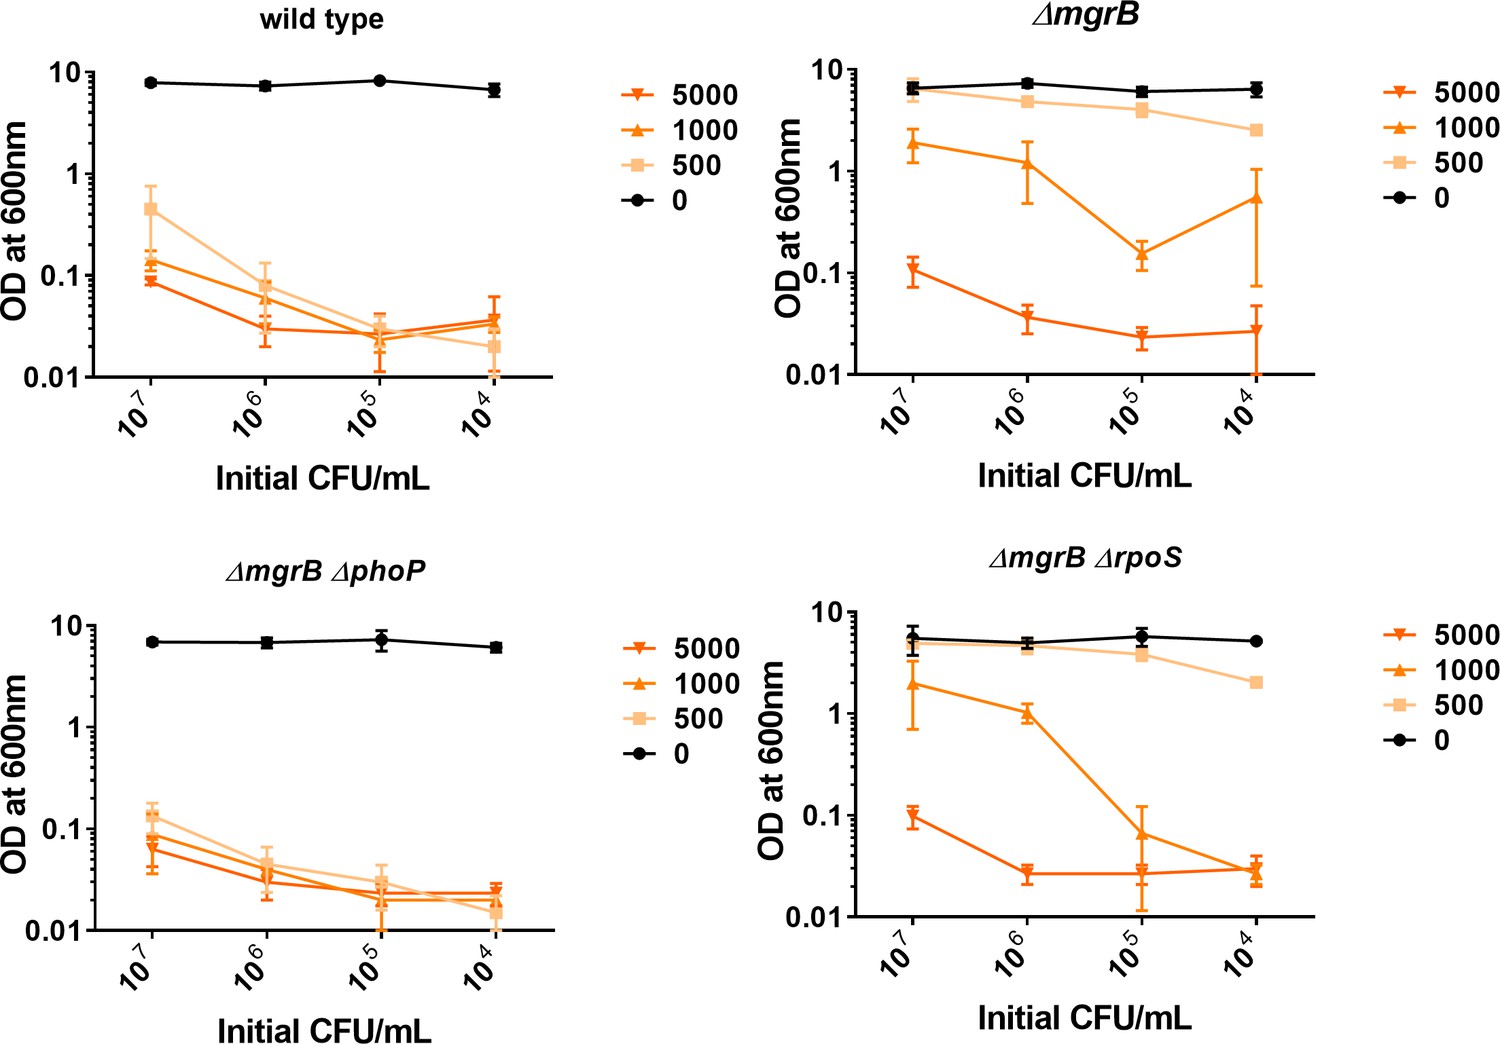
Colonization of indicated Escherichia coli strains in growth media supplemented with increasing trimethoprim concentrations (5, 1, 0.5 and 0 μg/mL) starting at the indicated cell densities (X-axis). Optical density of cultures was measured after 24 hr of growth. Mean± SD is plotted.
Figure 2 with 3 supplements
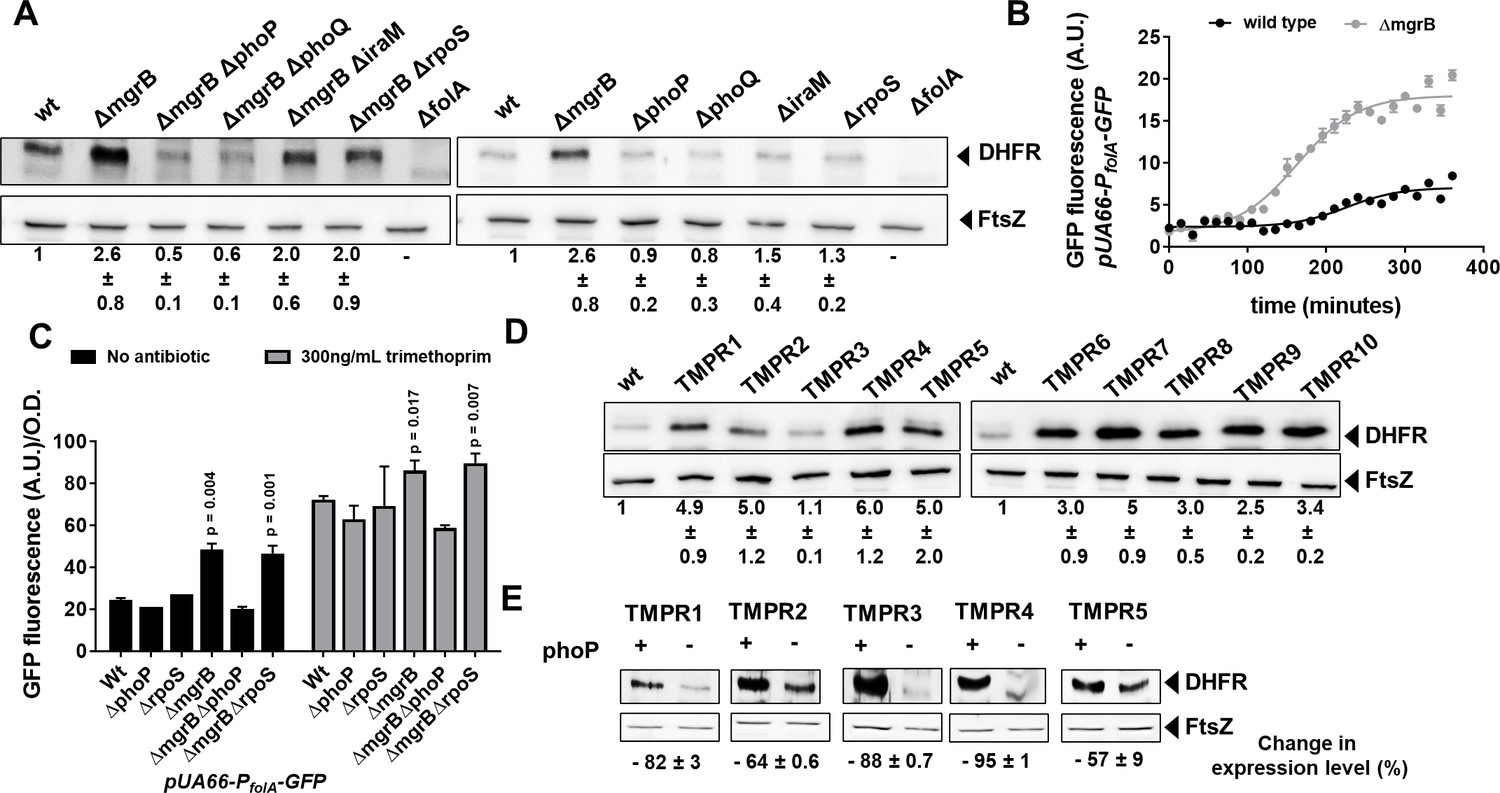
Enhanced expression of DHFR in mgrB-deficient Escherichia coli.
(A) Lysates (5 µg total protein) of wild-type or mutant E. coli were subjected to immunoblotting using anti-DHFR polyclonal antibody. FtsZ was used as a loading control. Data shown are representative of three independent replicates. Fold change in expression level of DHFR relative to wild-type (normalized to 1) was calculated by quantitating band intensities and normalizing to FtsZ. Values shown are mean± SD from three independent experiments. (B) Activity of the folA promoter (PfolA) in E. coli wild-type or ΔmgrB monitored over growth using a GFP reporter gene (arbitrary units, A.U.). Each point represents mean± SD from three replicates. (C) Peak fluorescence normalized to optical density for indicated strains harboring the Pfol-GFP reporter plasmid. Mean± SD from three independent experiments is plotted. Statistical significance was tested using the Student’s t-test and a p-value of <0.05 was considered significant (p-value indicated). Promoter activity was measured in drug-free medium or in the presence of 300 ng/ml trimethoprim. (D) Lysates (5 µg total protein) of E. coli wild-type or trimethoprim resistant isolates (TMPR1–10) were subjected to immunoblotting using anti-DHFR polyclonal antibody. FtsZ was used as a loading control. Data shown are representative of three independent replicates. Fold change in expression level of DHFR relative to wild-type (normalized to 1) was calculated by quantitating band intensities and normalizing to FtsZ. Values shown are mean± SD from three independent experiments. (E) Lysates (5 µg total protein) of trimethoprim-resistant isolates (TMPR1–5) and their ΔphoP derivatives were subjected to immunoblotting using anti-DHFR polyclonal antibody. FtsZ was used as a loading control. Data shown are representative of three independent replicates. Reduction in expression level of DHFR upon deletion of phoP was calculated by quantitating band intensities and normalizing to FtsZ. Percent reduction value shown is mean± SD from three independent experiments. DHFR, dihydrofolate reductase.
Figure 2—figure supplement 1
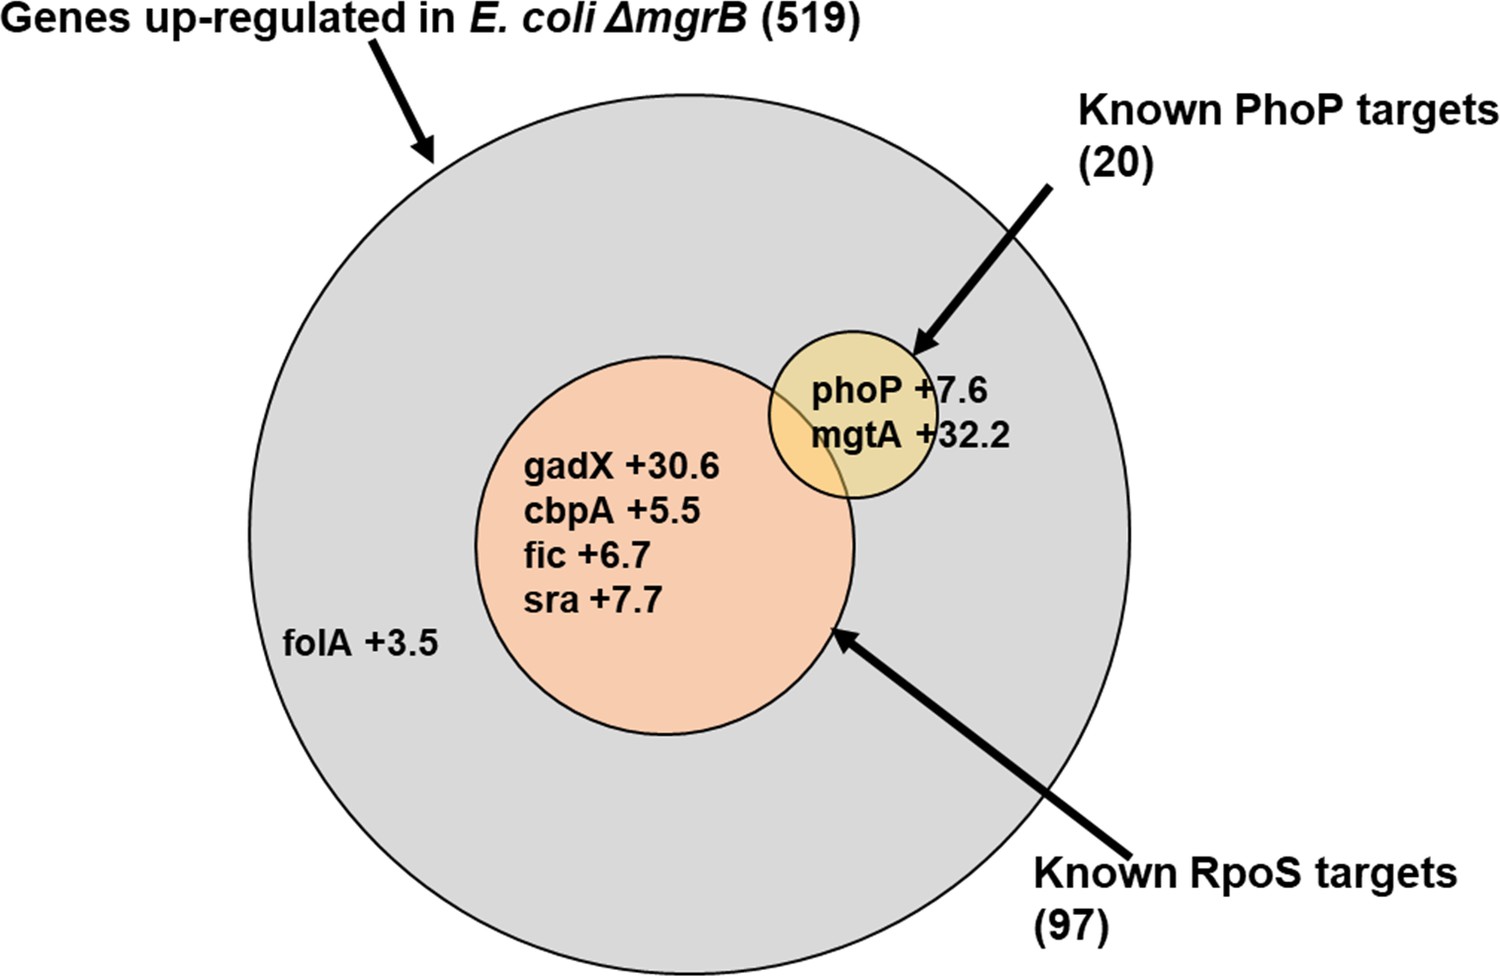
Diagrammatic representation of upregulated genes in Escherichia coli ΔmgrB.
Transcriptomic data for E. coli ΔmgrB was taken from Xu et al., 2019. Area of each of the circles in the Venn diagram is proportional to the number of genes in that set. PhoP and RpoS regulated genes were determined using RegulonDB (Gama-Castro et al., 2016). Representative genes or those relevant to this study and their level of upregulation are shown.
Figure 2—figure supplement 2
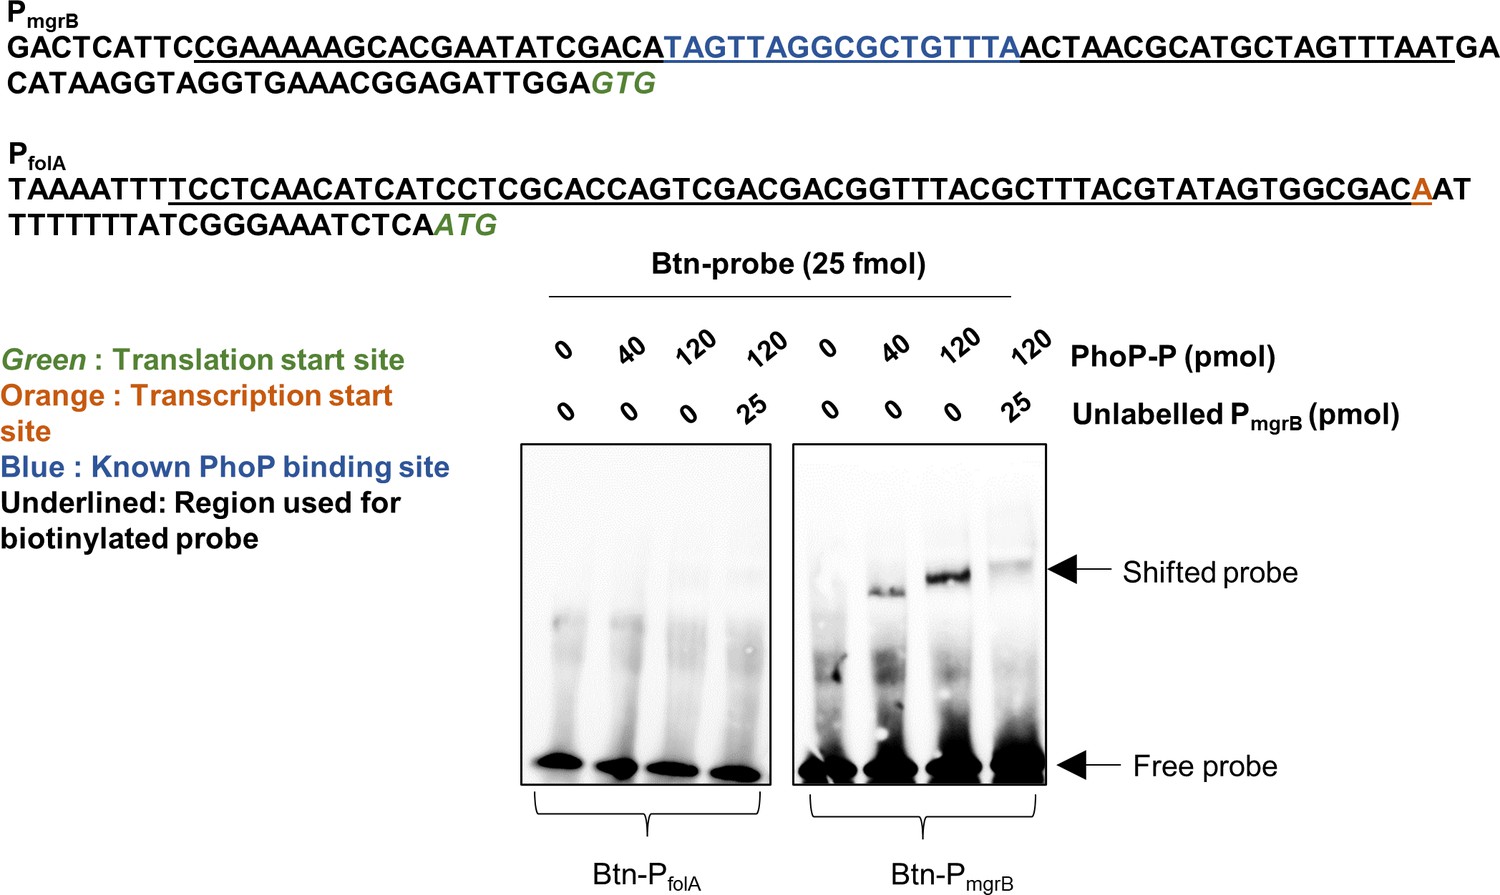
Electrophoretic mobility shift assay (EMSA) to test in vitro binding of phosphorylated PhoP (PhoP-P) to the promoter of folA (PfolA).
Promoter of mgrB (PmgrB) was used as positive control (Yamamoto et al., 2002). Sequences of the two promoters are shown. The probe consisted of 60-mer oligonucleotides (underlined) with biotinylation at the 5′-end. The amounts of purified PhoP-P, labeled and unlabeled competitor used for each reaction are indicated. Positions of free and shifted probes are indicated. No shift was detectable for PfolA.
Figure 2—figure supplement 3
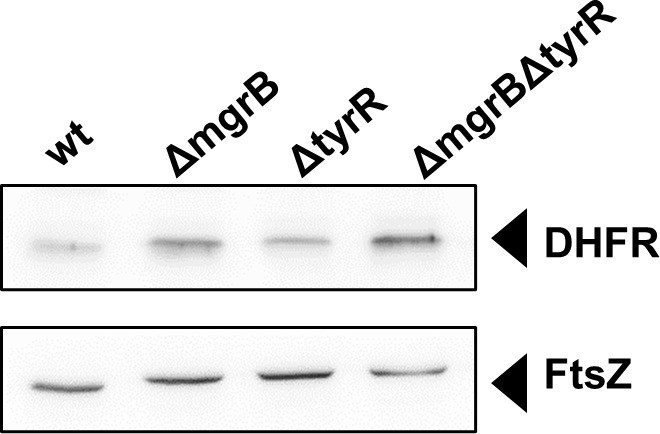
DHFR protein levels measured in wild-type and mutant strains (indicated) by immunoblotting with anti-DHFR antibody.
Anti-FtsZ was used as a loading control. DHFR, dihydrofolate reductase.
Figure 3
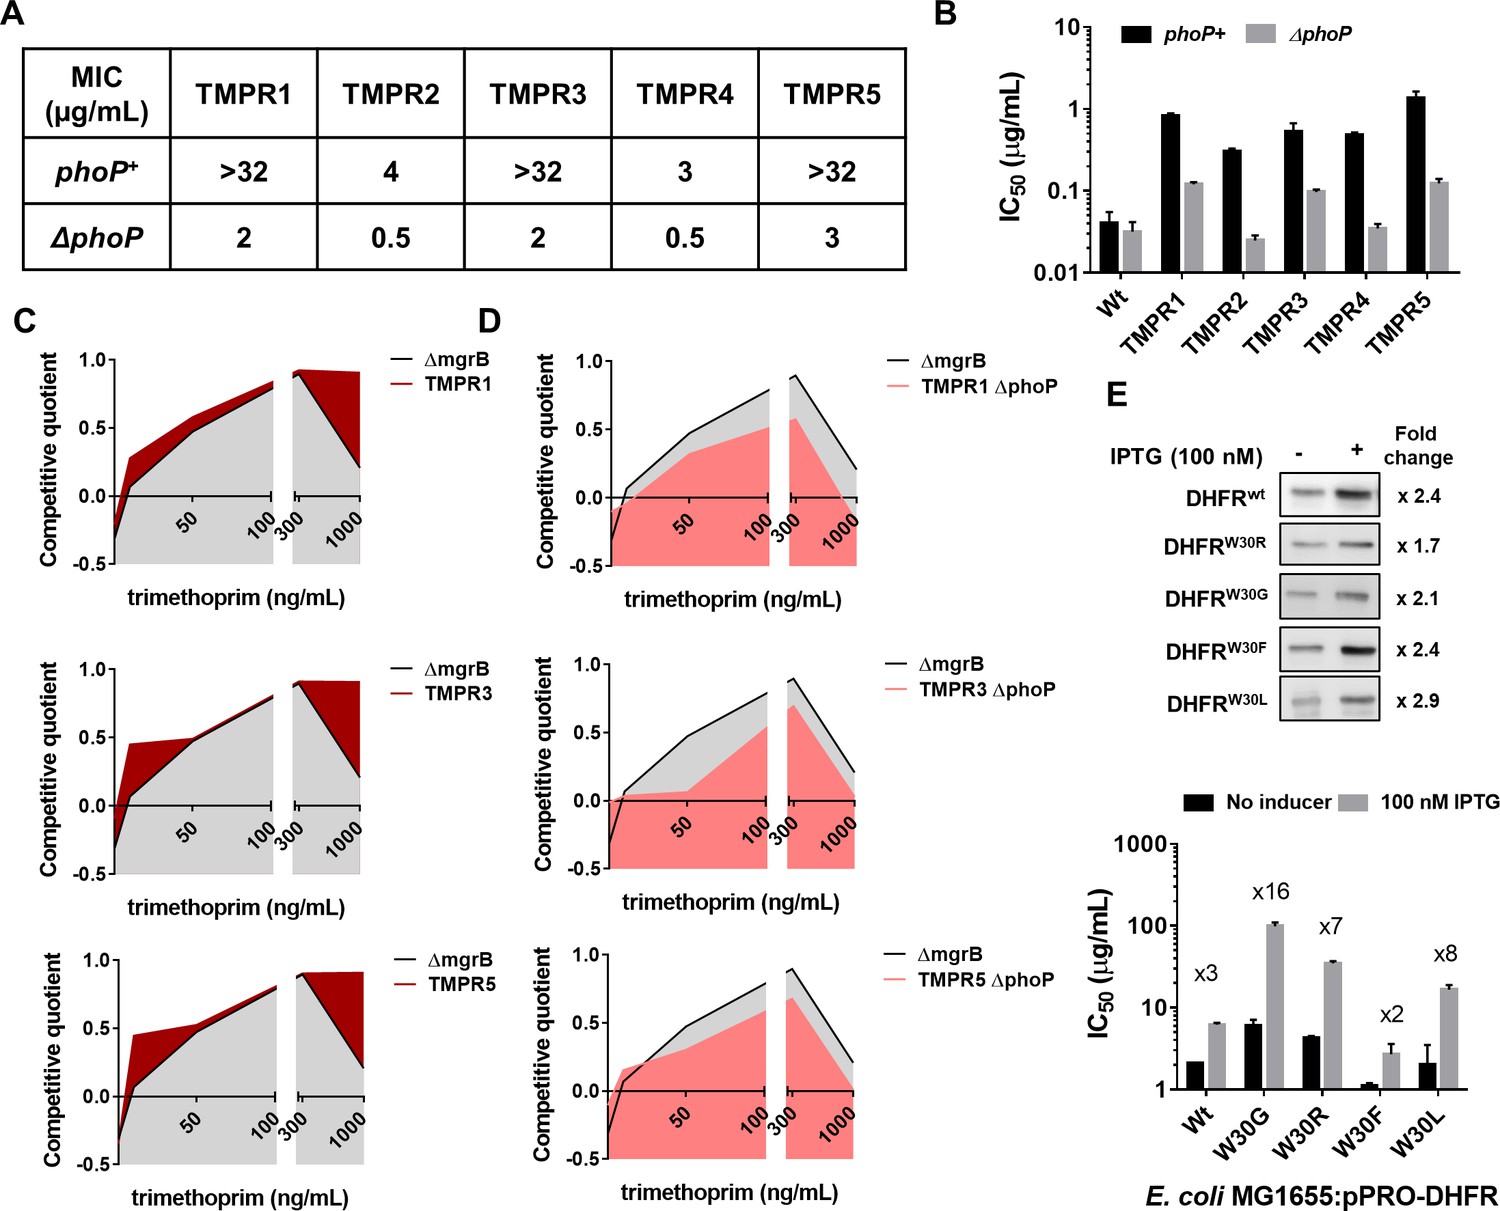
Synergy between mgrB and folA mutations alters the fitness landscape of trimethoprim resistant Escherichia coli.
(A) MIC values of trimethoprim for resistant isolates (TMPR1–5) and their ΔphoP derivatives calculated from E-tests. (B) IC50 values of trimethoprim from resistant isolates (TMPR1–5) and their ΔphoP derivatives. Mean± SEM from three independent experiments is plotted. (C, D) Fitness landscape of trimethoprim resistant isolates TMPR1, 3, and 5 (C) or their ΔphoP derivatives (D) compared with trimethoprim tolerant E. coli ΔmgrB. Competitive quotients were calculated by competition with E. coli-GFP (wild-type E. coli expressing GFP) in varying concentrations of trimethoprim. Higher values indicate higher fitness relative to wild-type. Representative data from three replicates are shown. (E) Effect of overexpression of DHFR on IC50 of trimethoprim monitored by expression of wild-type or mutant DHFR from an IPTG-inducible promoter. Upper panel. Immunoblots showing overexpression of all DHFR alleles tested. The fold increase in DHFR expression level upon addition of IPTG was calculated based on band intensities. Lower panel. IC50 values of trimethoprim for various mutants with and without inducer are plotted (mean± SD from three replicates). The fold increase in IC50 in the presence of inducer is indicated for each mutant. DHFR, dihydrofolate reductase; MIC, minimum inhibitory concentration.
Figure 4 with 1 supplement
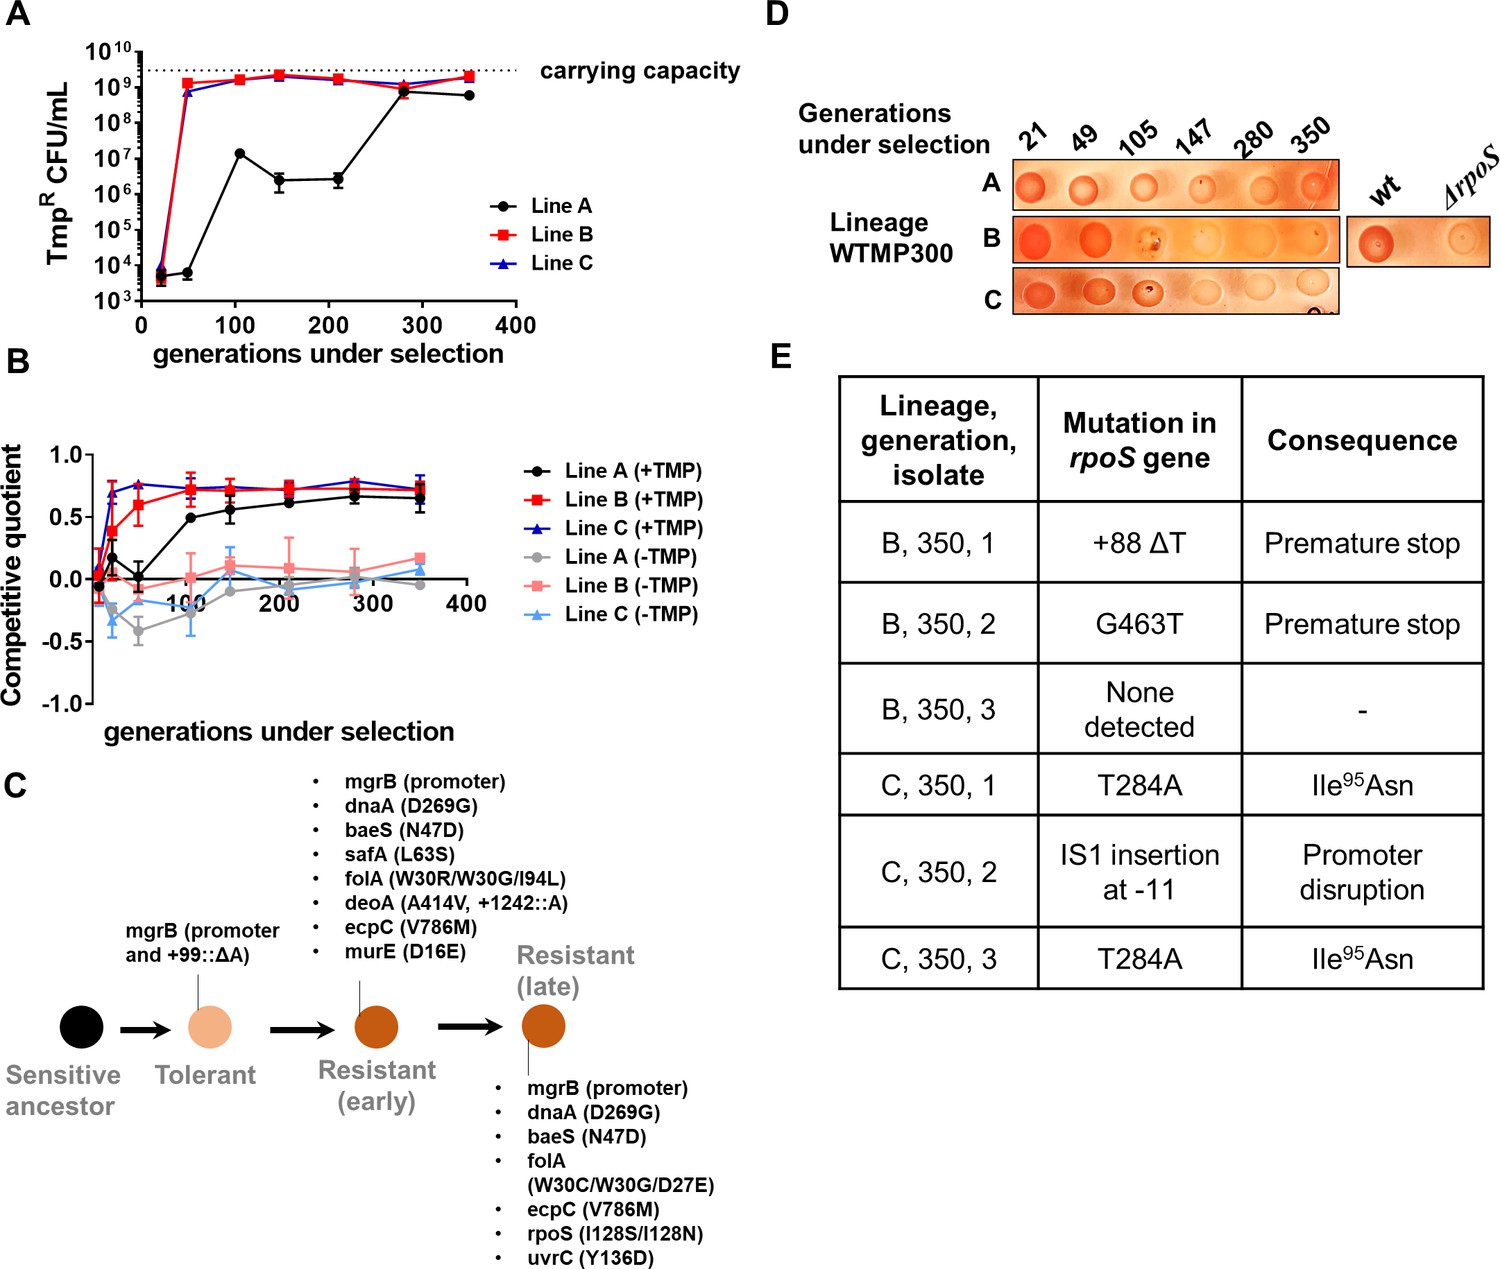
Genomic changes in Escherichia coli adapting to high trimethoprim concentrations.
(A) Titre of trimethoprim-resistant bacteria in WTMP300 lineages A, B and C during the course of evolution. Each data point represents mean± SD from two to three measurements. The typical carrying capacity of E. coli growing in drug-free medium (2–3×10⁹ CFU/ml) is indicated with a dotted line. (B) Competitive quotient of WTMP300 lineages (A–C) in drug-free or trimethoprim supplemented media was monitored by competition with E. coli-GFP (wild-type E. coli expressing GFP). Higher values of competitive quotient indicate higher fitness relative to the wild-type ancestor. Trimethoprim was used at 300 ng/ml. Each point represents mean± SD from two to three measurements. (C) Schematic representation of genomic changes associated with early and late adaptation to trimethoprim in WTMP300 lineage A (see Supplementary file 1 for complete list). (D) Congo red staining of WTMP300 lineages A, B, and C to verify loss of active RpoS. Controls (wild-type and E. coli ΔrpoS) are shown for reference. Representative data from three replicates are shown. (E) Sanger sequencing of resistant isolates from lineages B and C confirming the accumulation of mutations in the rpoS gene.
Figure 4—figure supplement 1
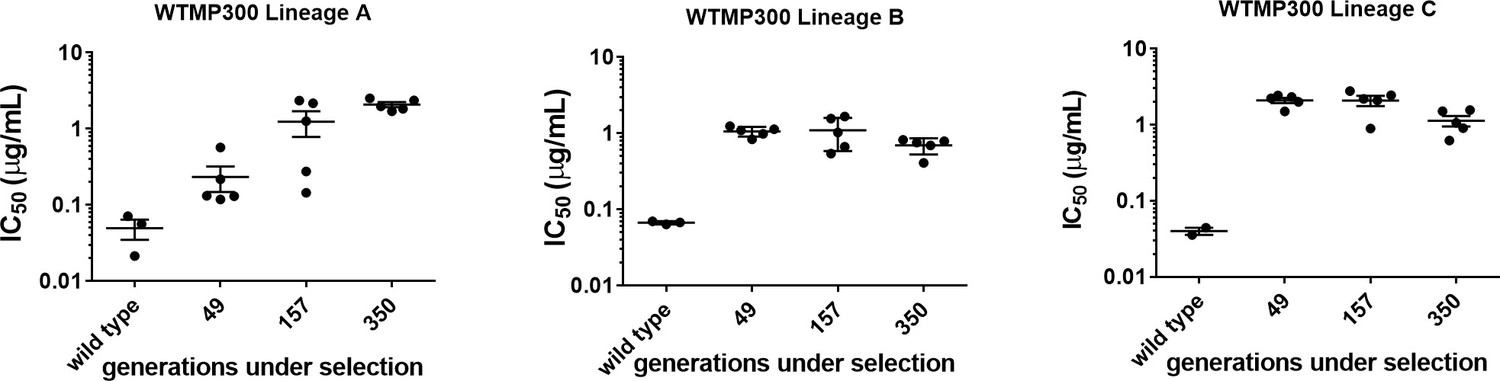
IC50 values of trimethoprim for resistant isolates from WTMP300 lineages at 47, 157, and 350 generations.
Each spot represents mean IC50 from two independent measurements for an individual isolate. Mean and SEM of 4–6 isolates from each time point are shown. Ancestral IC50 (wild-type) from three replicate measurements and mean± SEM are shown.
Figure 5
Compensation of fitness costs of mgrB-deficiency by loss of RpoS.
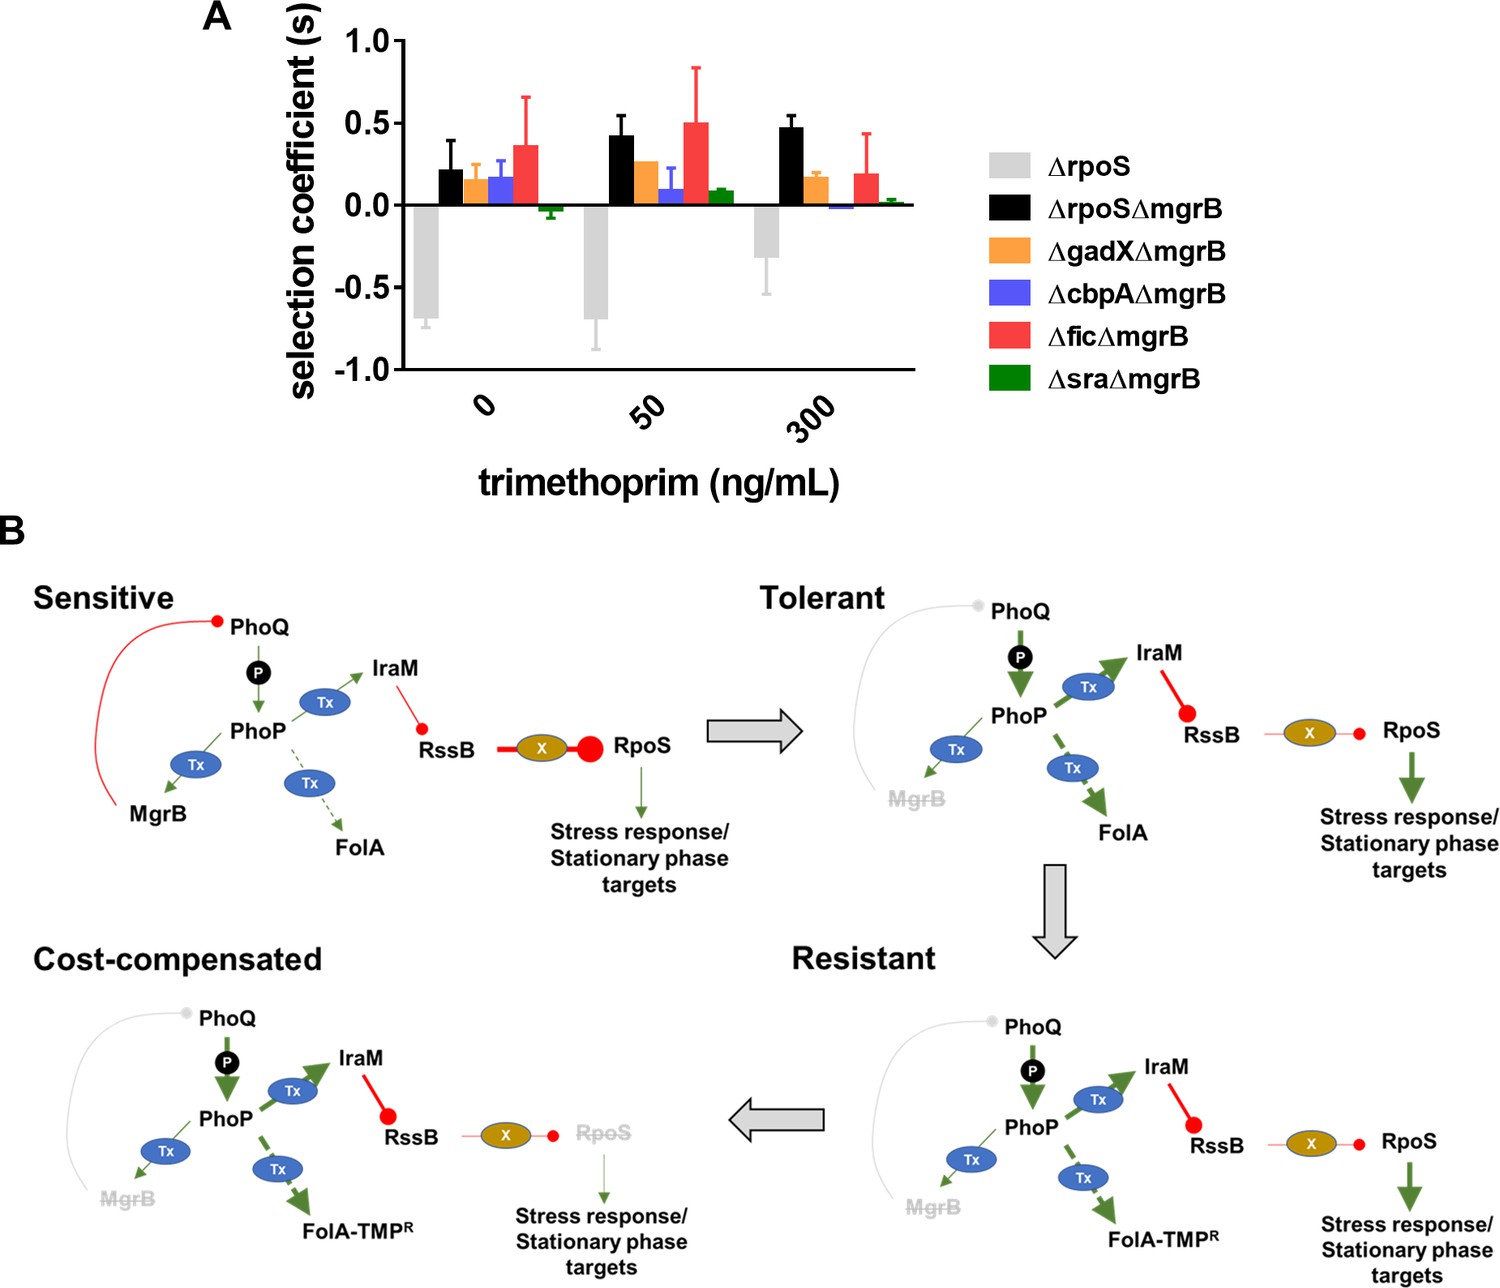
(A) Selection coefficient of Escherichia coli ΔrpoS relative to wild-type (gray bars), E. coli ΔmgrBΔrpoS relative to E. coli ΔmgrB (black bars), or indicated mutants in the ΔmgrB background relative to E. coli ΔmgrB (colored bars). Appropriate strains were allowed to compete in the absence or presence of trimethoprim at the indicated concentrations for ~9 generations. Data represent mean± SEM from three independent measurements. (B) Schematic representation of adaptation of E. coli to high trimethoprim over long-term evolution. Genetic changes and mechanisms associated with sensitive, tolerant, resistant, and cost-compensated phenotypes are shown. The evolutionary sequence is indicated by the direction of arrows. Activating interactions are shown by green arrows, while inhibitory interactions are shown by red lines. Strength of each interaction is qualitatively represented by the thickness of arrows. Indirect interactions are shown as discontinuous lines. Phosphorylation is indicated by ‘P.’ Transcriptional changes are indicated by ‘Tx.’ Proteolytic degradation is indicated by ‘X.’ Inactivating mutations are represented by gray text with strikethrough.
Figure 6
Genomic changes in Escherichia coli adapting to low trimethoprim concentrations.
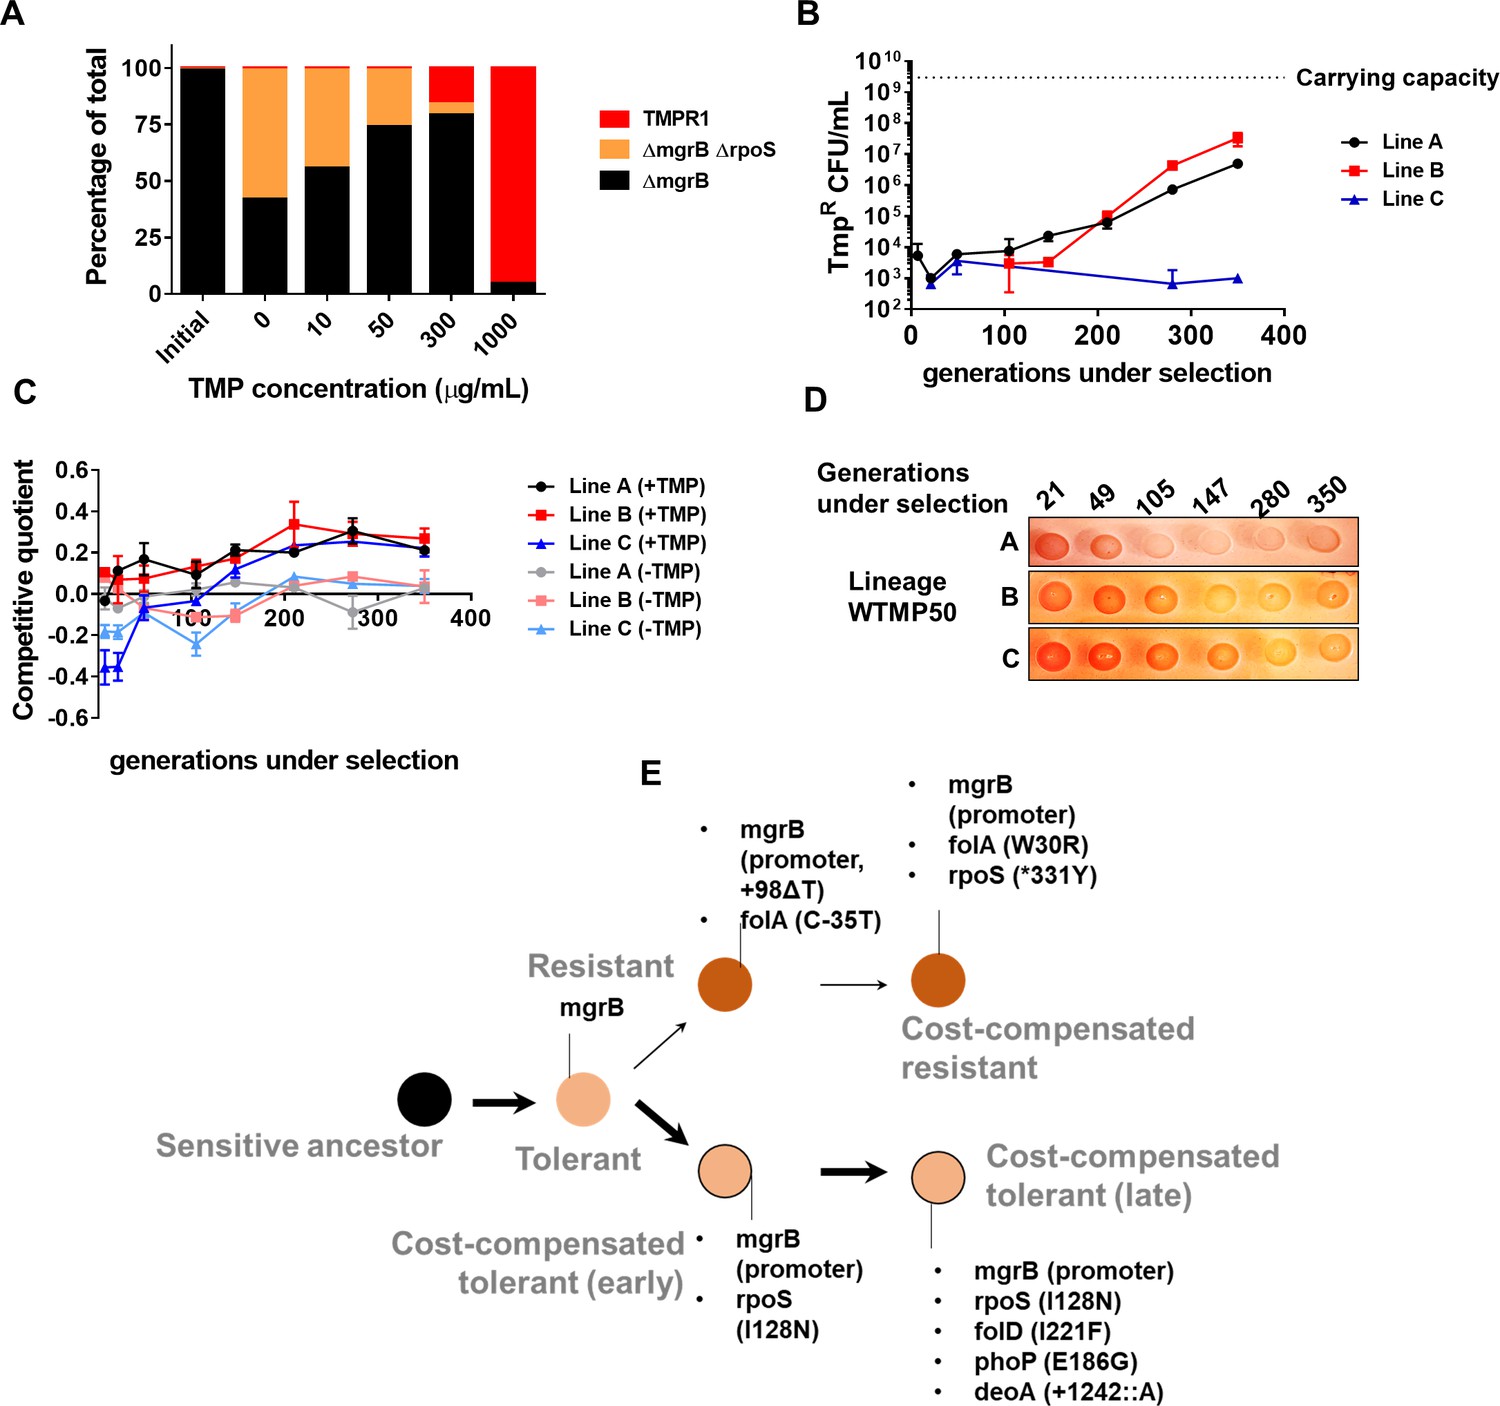
(A) Three-strain competition between E. coli ΔmgrB (tolerant), E. coli ΔmgrBΔrpoS (cost-compensated tolerant) and E. coli TMPR1 (resistant). Initial mixing ratio of strains was 98:1:1, respectively. Ratios of strains after ~9 generations of competition at the indicated concentration of trimethoprim are shown. Data are representative of three replicates. (B) Titre of trimethoprim-resistant bacteria in WTMP50 lineages A, B, and C during the course of evolution. Each data point represents mean± SD from two to three measurements. The typical carrying capacity of E. coli growing in drug-free medium (2–3×10⁹ CFU/ml) is indicated with a dotted line. (C) Competitive quotient of WTMP50 lineages A, B, and C in drug-free or trimethoprim supplemented media was monitored by competition with E. coli-GFP (wild-type E. coli expressing GFP). Higher values of competitive quotient indicate higher fitness relative to the wild-type ancestor. Trimethoprim was used at 50 ng/ml. Each point represents mean± SD from two to three measurements. (D) Congo red staining of WTMP50 lineages A, B, and C to verify loss of active RpoS in all lines. Representative data from three replicates are shown. (E) Schematic representation of genomic changes associated with early and late adaptation to trimethoprim in WTMP50 lineage A (see Supplementary file 2 for complete list). Two parallel lineages branching out from tolerant bacteria in the WTMP50 lines are shown.
Figure 7 with 2 supplements
Genomic changes in Escherichia coli Δlon adapting to high trimethoprim concentrations.
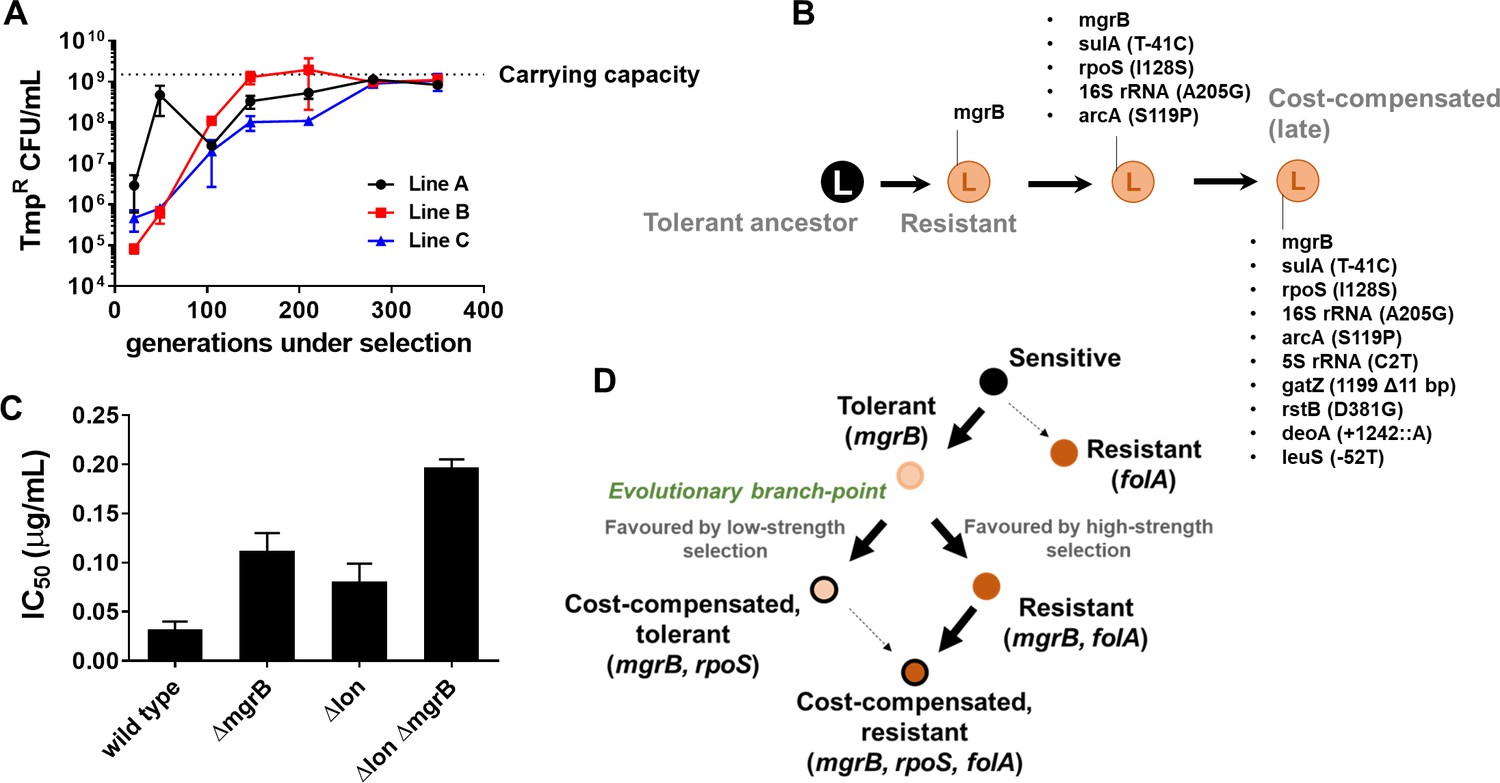
(A) Titre of trimethoprim-resistant bacteria in LTMP300 lineages A, B, and C during the course of evolution. Each data point represents mean± SD from two to three measurements. The typical carrying capacity of E. coli Δlon growing in drug-free medium (1–2×10⁹ CFU/ml) is indicated with a dotted line. (B) Schematic representation of genomic changes associated with early and late adaptation to trimethoprim in LTMP300 lineage A (see Supplementary file 3 for complete list). (C) Additive effect of Δlon and ΔmgrB mutations on IC50 of trimethoprim for E. coli. Mean± SD values of IC50 from three independent experiments are plotted. (D) Model of adaptation in the PhoPQ-folA-RpoS axis showing dependency of genetic changes and associated phenotypes on drug pressure. Implicated genetic loci are indicated in parentheses. Evolutionary transitions identified in this study are shown as solid black arrows. Possible transitions that are unlikely to occur based on the results from this study are shown as dotted arrows.
Figure 7—figure supplement 1
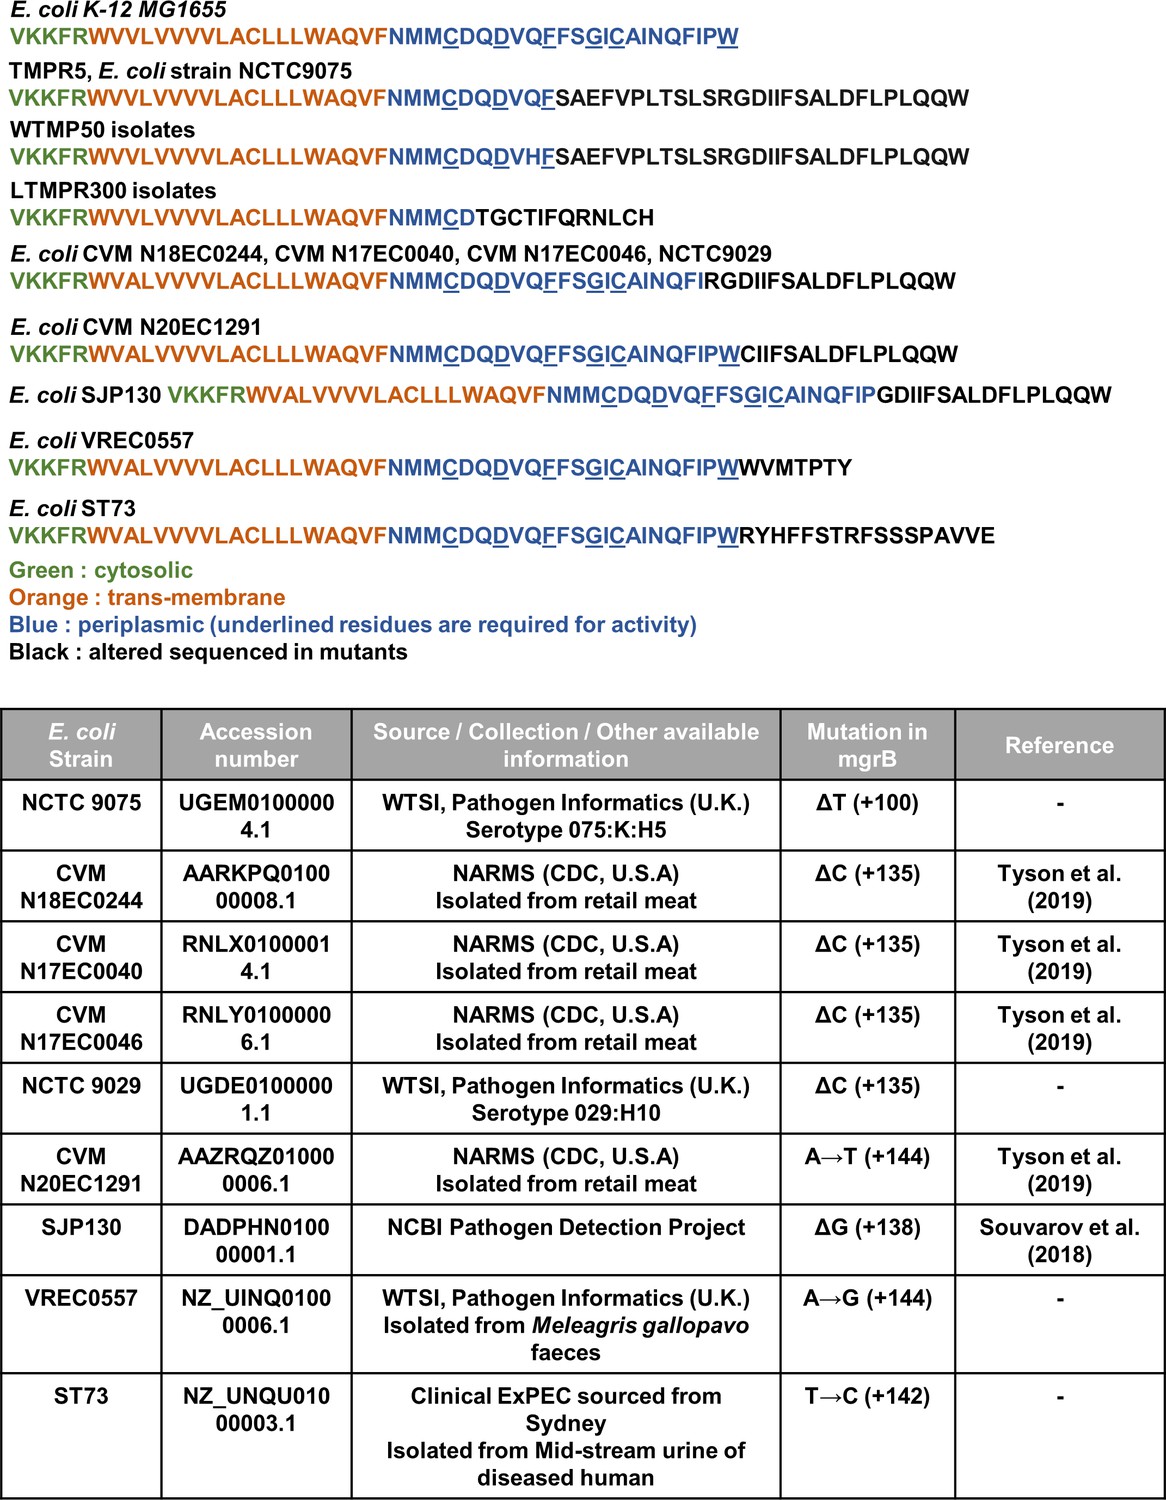
Predicted protein sequences of mutant MgrB alleles identified in this study, and from publicly available sequences of pathogenic and environmental Escherichia coli strains identified by BLAST analysis. Each sequence is colored based on the functional annotation of MgrB. Accession numbers and source of strain (Souvorov et al., 2018; Tyson et al., 2019) are indicated in the table.
Figure 7—figure supplement 2
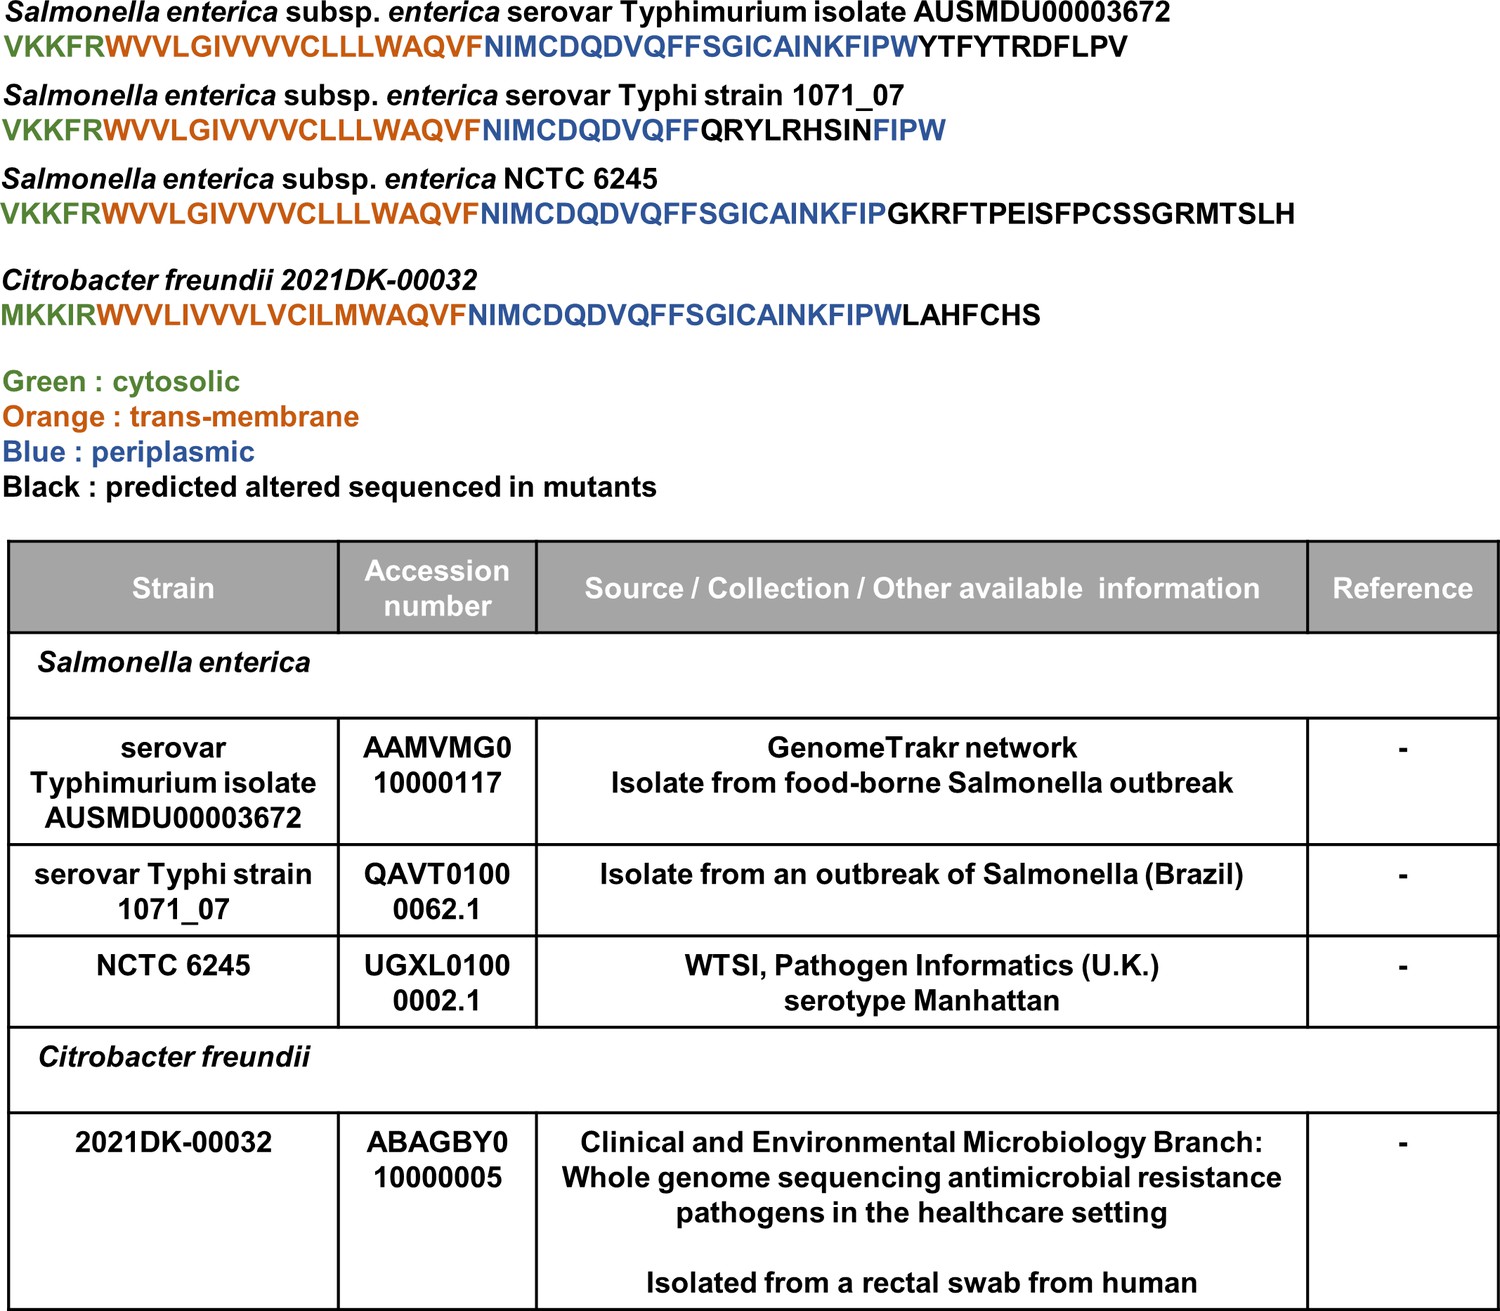
Predicted protein sequences of MgrB alleles from publicly available sequences of pathogenic and environmental Salmonella typhimurium and Citrobacter freundii strains identified by BLAST analysis. Each sequence is colored based on the functional annotation of MgrB for Escherichia coli. Accession numbers and source of strain are indicated in the table.
Tables
Table 1
Summary of mutations in trimethoprim resistant isolates TMPR1–5 identified by genome sequencing.
| Locus | Description | TMPR1 | TMPR2 | TMPR3 | TMPR4 | TMPR5 |
|---|---|---|---|---|---|---|
| Single nucleotide changes | ||||||
| folA | Dihydrofolate reductase | Asp27Glu | – | Trp30Gly | – | Trp30Arg |
| ycaQ | Inter-strand DNA crosslink repair glycosylase | – | – | Trp71* | – | – |
| yagF | D-xylonate dehydratase | – | – | – | – | Ser557Pro |
| yagH | Putative xylosidase/arabinosidase | – | – | – | – | Val397Met |
| mgrB | PhoQ kinase inhibitor | – | – | – | – | Deletion+ 100::ΔA |
| hexR | DNA-binding transcriptional repressor | – | – | – | – | Ala143Val |
| deoA | Thymidine phosphorylase | Insertion+ 359::A | – | Insertion+ 375::A | - | - |
| dnaA | Chromosomal replication initiator protein | – | – | – | Asp280Gly | – |
| Insertion elements and large rearrangements | ||||||
| mcrC | 5-methylcytosine-specific restriction enzyme subunit | – | – | + 969::IS1A | – | – |
| ybcM | Putative DNA-binding transcriptional regulator | + 493::IS1A | – | – | – | – |
| mgrB | PhoQ kinase inhibitor | –23::IS1A(772 bp insertion) | –29::IS1A(772 bp insertion) | –46::IS5( ~ 1100 bp insertion) | –21::IS1A(772 bp insertion) | – |
| Partial genome duplication | – | – | – | – | 2×(~1–7,00,000) | – |
Table 2
List of strains and plasmids used in this study.
| Strain | Description | Source |
|---|---|---|
| Escherichia coli wild-type | E. coli K-12 MG1655 | – |
| TMPR1–10 | Trimethoprim resistant derivatives of E. coli wild-type obtained by short term laboratory selection with 300 ng/ml of trimethoprim | Matange et al., 2018 |
| TMPR1–5 ΔphoP::Kan | Derivatives of TMPR1–5 in which phoP is replaced with a Kanamycin resistance cassette | This study.Mutation moved from BW25113 background (Keio collection) to TMPR1–5 by P1 transduction |
| E. coli ΔmgrB::Kan | Derivative of E. coli wild-type in which mgrB is replaced with a Kanamycin resistance cassette | This study.Mutation moved from BW25113 background (Keio collection) to MG1655 by P1 transduction |
| E. coli ΔmgrB (unmarked) | Derivative of E. coli ΔmgrB::Kan without Kanamycin resistance marker | This study.Kanamycin cassette removed using Flp-recombinase |
| E. coli ΔphoP::Kan | Derivative of E. coli wild-type in which phoP is replaced with a Kanamycin resistance cassette | This study.Mutation moved from BW25113 background (Keio collection) to MG1655 by P1 transduction |
| E. coli ΔmgrB ΔphoP::Kan | Derivative of E. coli ΔmgrB (unmarked) in which phoP is replaced with a Kanamycin resistance cassette | This study.Mutation moved from BW25113 background (Keio collection) to MG1655 by P1 transduction |
| E. coli ΔphoQ::Kan | Derivative of E. coli wild-type in which phoQ is replaced with a Kanamycin resistance cassette | This study.Mutation moved from BW25113 background (Keio collection) to MG1655 by P1 transduction |
| E. coli ΔmgrB ΔphoQ::Kan | Derivative of E. coli ΔmgrB (unmarked) in which phoQ is replaced with a Kanamycin resistance cassette | This study.Mutation moved from BW25113 background (Keio collection) to MG1655 by P1 transduction |
| E. coli ΔiraM::Kan | Derivative of E. coli wild-type in which iraM is replaced with a Kanamycin resistance cassette | This study.Mutation moved from BW25113 background (Keio collection) to MG1655 by P1 transduction |
| E. coli ΔmgrB ΔiraM::Kan | Derivative of E. coli ΔmgrB (unmarked) in which iraM is replaced with a Kanamycin resistance cassette | This study.Mutation moved from BW25113 background (Keio collection) to MG1655 by P1 transduction |
| E. coli ΔrpoS::Kan | Derivative of E. coli wild-type in which rpoS is replaced with a Kanamycin resistance cassette | This study.Mutation moved from BW25113 background (Keio collection) to MG1655 by P1 transduction |
| E. coli ΔmgrB ΔrpoS::Kan | Derivative of E. coli ΔmgrB (unmarked) in which rpoS is replaced with a Kanamycin resistance cassette | This study.Mutation moved from BW25113 background (Keio collection) to MG1655 by P1 transduction |
| E. coli-GFP | Derivative of E. coli wild-type in which gene coding for GFP is integrated into the genome downstream of the aidB locus | Kind gift from Dr. Amrita Hazra (Indian Institute of Science Education and Research, Pune, India) |
| E. coli ΔgadX::Kan | Derivative of E. coli wild-type in which gadX is replaced with a Kanamycin resistance cassette | This study.Mutation moved from BW25113 background (Keio collection) to MG1655 by P1 transduction |
| E. coli ΔmgrB ΔgadX::Kan | Derivative of E. coli ΔmgrB (unmarked) in which gadX is replaced with a Kanamycin resistance cassette | This study.Mutation moved from BW25113 background (Keio collection) to MG1655 by P1 transduction |
| E. coli ΔcbpA::Kan | Derivative of E. coli wild-type in which cpbA is replaced with a Kanamycin resistance cassette | This study.Mutation moved from BW25113 background (Keio collection) to MG1655 by P1 transduction |
| E. coli ΔmgrB ΔcbpA::Kan | Derivative of E. coli ΔmgrB (unmarked) in which cbpA is replaced with a Kanamycin resistance cassette | This study.Mutation moved from BW25113 background (Keio collection) to MG1655 by P1 transduction |
| E. coli Δsra::Kan | Derivative of E. coli wild-type in which sra is replaced with a Kanamycin resistance cassette | This study.Mutation moved from BW25113 background (Keio collection) to MG1655 by P1 transduction |
| E. coli ΔmgrB Δsra::Kan | Derivative of E. coli ΔmgrB (unmarked) in which sra is replaced with a Kanamycin resistance cassette | This study.Mutation moved from BW25113 background (Keio collection) to MG1655 by P1 transduction |
| E. coli Δfic::Kan | Derivative of E. coli wild-type in which fic is replaced with a Kanamycin resistance cassette | This study.Mutation moved from BW25113 background (Keio collection) to MG1655 by P1 transduction |
| E. coli ΔmgrB Δfic::Kan | Derivative of E. coli ΔmgrB (unmarked) in which fic is replaced with a Kanamycin resistance cassette | This study.Mutation moved from BW25113 background (Keio collection) to MG1655 by P1 transduction |
| E. coli Δlon::Kan | Derivative of E. coli wild-type in which lon is replaced with a Kanamycin resistance cassette | Matange, 2020 |
| E. coli Δlon::Cmp | Derivative of E. coli wild-type in which lon is replaced with a Chloramphenicol resistance cassette | Matange, 2020 |
| E. coli Δlon::Cmp ΔmgrB::Kan | Derivative of E. coli ΔmgrB::Kan in which lon is replaced with a Chloramphenicol resistance cassette | This study.Mutation moved from E. coli Δlon::Cmp to E. coli ΔmgrB::Kan by P1 transduction |
| E. coli ΔtyrR::Kan | Derivative of E. coli wild-type in which tyrR is replaced with a Kanamycin resistance cassette | This study.Mutation moved from BW25113 background (Keio collection) to MG1655 by P1 transduction |
| E. coli ΔmgrB ΔtyrR::Kan | Derivative of E. coli ΔmgrB (unmarked) in which tyrR is replaced with a Kanamycin resistance cassette | This study.Mutation moved from BW25113 background (Keio collection) to MG1655 by P1 transduction |
| Plasmid | Description | Source |
| pCP20-flp | Temperature sensitive plasmid for expression of Flp recombinase | Coli Genetic Stock Center (CGSC), Yale University, USA |
| pUA66-PfolA-GFP | Plasmid harboring GFP under the folA gene promoter. Reporter plasmid for activity of PfolA. | Kind gift from Dr. Sanchari Bhattachrya (Harvard University, USA) |
| pPRO-DHFR wild-type/W30G/W30R/W30F/W30L | Plasmids for overexpression of HexaHis-DHFR and its mutants. DHFR is downstream of an IPTG-inducible promoter. | Matange et al., 2018 |
| pCA24N-PhoP | Plasmid for overexpression of HexaHis-PhoP | ASKA(−) collection (Kitagawa et al., 2005), NBRP Resource, National Institute of Genetics, Japan |
Additional files
-
Supplementary file 1
Summary of genetic changes in trimethoprim resistant isolates from WTMP300 Lineage A identified by genome sequencing.
- https://cdn.elifesciences.org/articles/70931/elife-70931-supp1-v1.xlsx
-
Supplementary file 2
Summary of genetic changes in trimethoprim resistant and tolerant isolates from WTMP50 Lineage A by genome sequencing.
- https://cdn.elifesciences.org/articles/70931/elife-70931-supp2-v1.xlsx
-
Supplementary file 3
Summary of genetic changes in trimethoprim resistant isolates from LTMP300 Lineage A by genome sequencing.
- https://cdn.elifesciences.org/articles/70931/elife-70931-supp3-v1.xlsx
-
Transparent reporting form
- https://cdn.elifesciences.org/articles/70931/elife-70931-transrepform1-v1.docx
-
Source data 1
Source data for Figure 2A,D,E; Figure 3E and Figure 2—figure supplement 3.
Figure 2. Uncropped, annotated immunoblot (Source data 1) and raw image files (Source data 2, 3) for DHFR and FtsZ in various E. coli mutants. Specific bands were identified based on molecular weight and absence from lysate from E. coli ΔfolA. Figure 2D. Uncropped, annotated immunoblot (Source data 1) and raw image files (Source data 2, 3, 4) for DHFR and FtsZ in various trimethoprim resistant E. coli mutants. Specific bands were identified based on molecular weight and absence from lysate from E. coli ΔfolA. Figure 2E. Uncropped, annotated immunoblot (Source data 1) and raw image files (Source data 2, 3, 4) for DHFR and FtsZ in various trimethoprim resistant E. coli mutants (TMPR1-5) and their ΔphoP derivatives. Specific bands were identified based on molecular weight and absence from lysate from E. coli ΔfolA. Figure 3E. Uncropped, annotated immunoblot (Source data 1) and raw image files (Source data 2, 3) for plasmid-expressed His-tagged DHFR or its mutant alleles in E. coli in the presence of indicated concentrations of inducer (IPTG). Figure 2—figure supplement 3. Uncropped, annotated immunoblot (Source data 1) and raw image files (Source data 2, 3) for DHFR and FtsZ in indicated E. coli mutants. Specific bands were identified based on molecular weight and absence from lysate from E. coli ΔfolA.
- https://cdn.elifesciences.org/articles/70931/elife-70931-supp4-v1.zip
Download links
A two-part list of links to download the article, or parts of the article, in various formats.
Downloads (link to download the article as PDF)
Open citations (links to open the citations from this article in various online reference manager services)
Cite this article (links to download the citations from this article in formats compatible with various reference manager tools)
Adaptation and compensation in a bacterial gene regulatory network evolving under antibiotic selection
eLife 10:e70931.
https://doi.org/10.7554/eLife.70931


