Ten months of temporal variation in the clinical journey of hospitalised patients with COVID-19: An observational cohort
- Big Data Institute, Nuffield Department of Medicine, University of Oxford, United Kingdom
- ISARIC Global Support Centre, Centre for Tropical Medicine and Global Health, Nuffield Department of Medicine, University of Oxford, United Kingdom
- Department of Statistics, University of Oxford, United Kingdom
- MRC Centre for Global Infectious Disease Analysis, Abdul Latif Jameel Institute for Disease and Emergency Analytics and Department of Infectious Disease Epidemiology, Imperial College London, United Kingdom
- MRC Population Health Research Unit, Clinical Trials Service Unit and Epidemiological Studies Unit, Nuffield Department of Population Health, University of Oxford, United Kingdom
- Infectious Diseases Data Observatory, Centre for Tropical Medicine and Global Health, University of Oxford, United Kingdom
- Royal Melbourne Hospital, Melbourne, Australia Centre for Integrated Critical Care, University of Melbourne, Australia
Figures
Figure 1
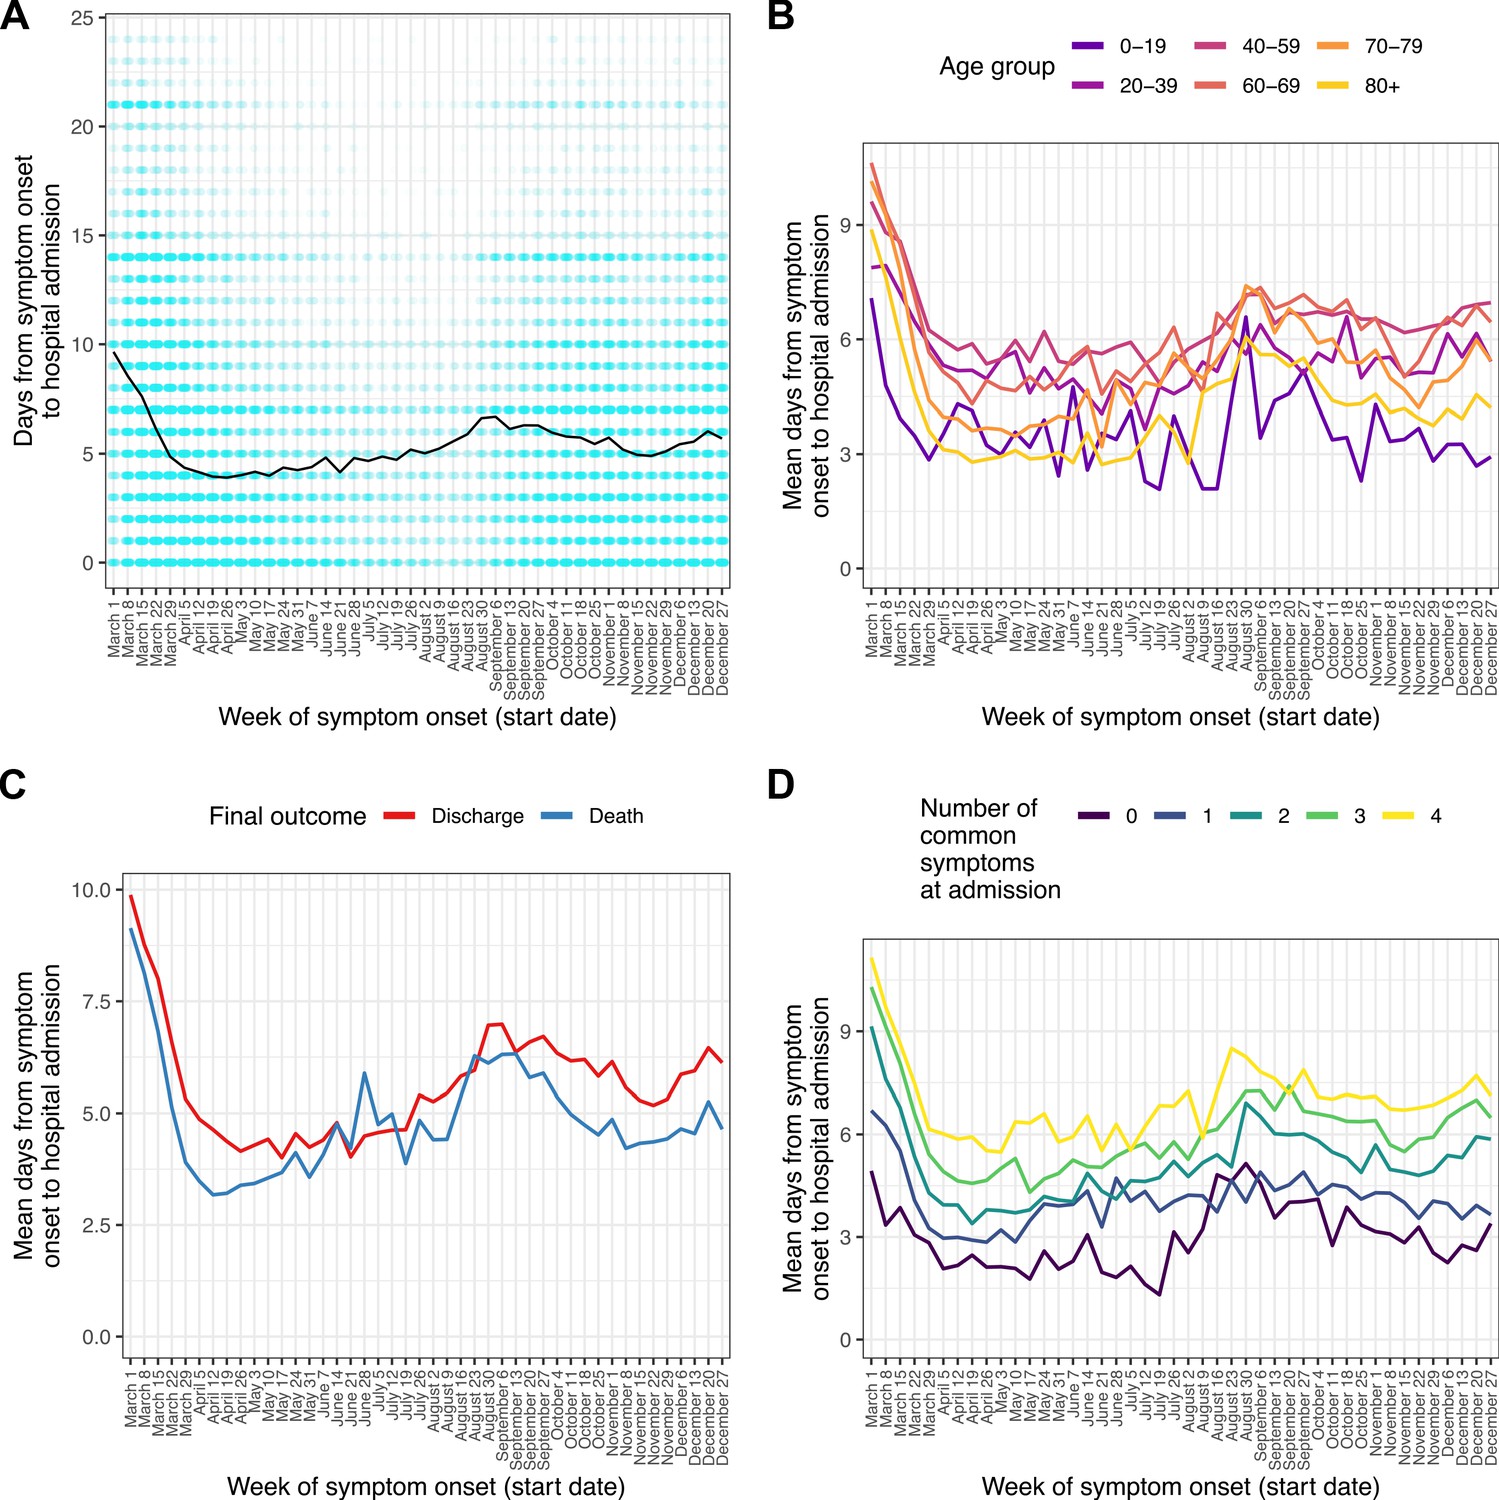
Time from reported symptom onset to hospital admission, by week of reported symptom onset.
(A) Blue cells represent binned patients, with darker colours corresponding to more individuals. The black line represents the mean. (B)-(D) Mean time to admission plotted by patient characteristics: (B) age group, (C) final outcome, (D) number of the four most common symptoms (cough, fatigue, fever, and shortness of breath) present upon admission.
-
Figure 1—source data 1
Number of individuals for each combination of week of symptom onset and count of days from symptom onset to admission.
- https://cdn.elifesciences.org/articles/70970/elife-70970-fig1-data1-v3.zip
-
Figure 1—source data 2
Mean number of days from symptom onset to admission by week of symptom onset.
- https://cdn.elifesciences.org/articles/70970/elife-70970-fig1-data2-v3.zip
-
Figure 1—source data 3
Mean number of days from symptom onset to admission by week of symptom onset, by age group.
- https://cdn.elifesciences.org/articles/70970/elife-70970-fig1-data3-v3.zip
-
Figure 1—source data 4
Mean number of days from symptom onset to admission by week of symptom onset, by final outcome (death or discharge).
- https://cdn.elifesciences.org/articles/70970/elife-70970-fig1-data4-v3.zip
-
Figure 1—source data 5
Mean number of days from symptom onset to admission by week of symptom onset, by number of common symptoms recorded at admission.
- https://cdn.elifesciences.org/articles/70970/elife-70970-fig1-data5-v3.zip
Figure 2
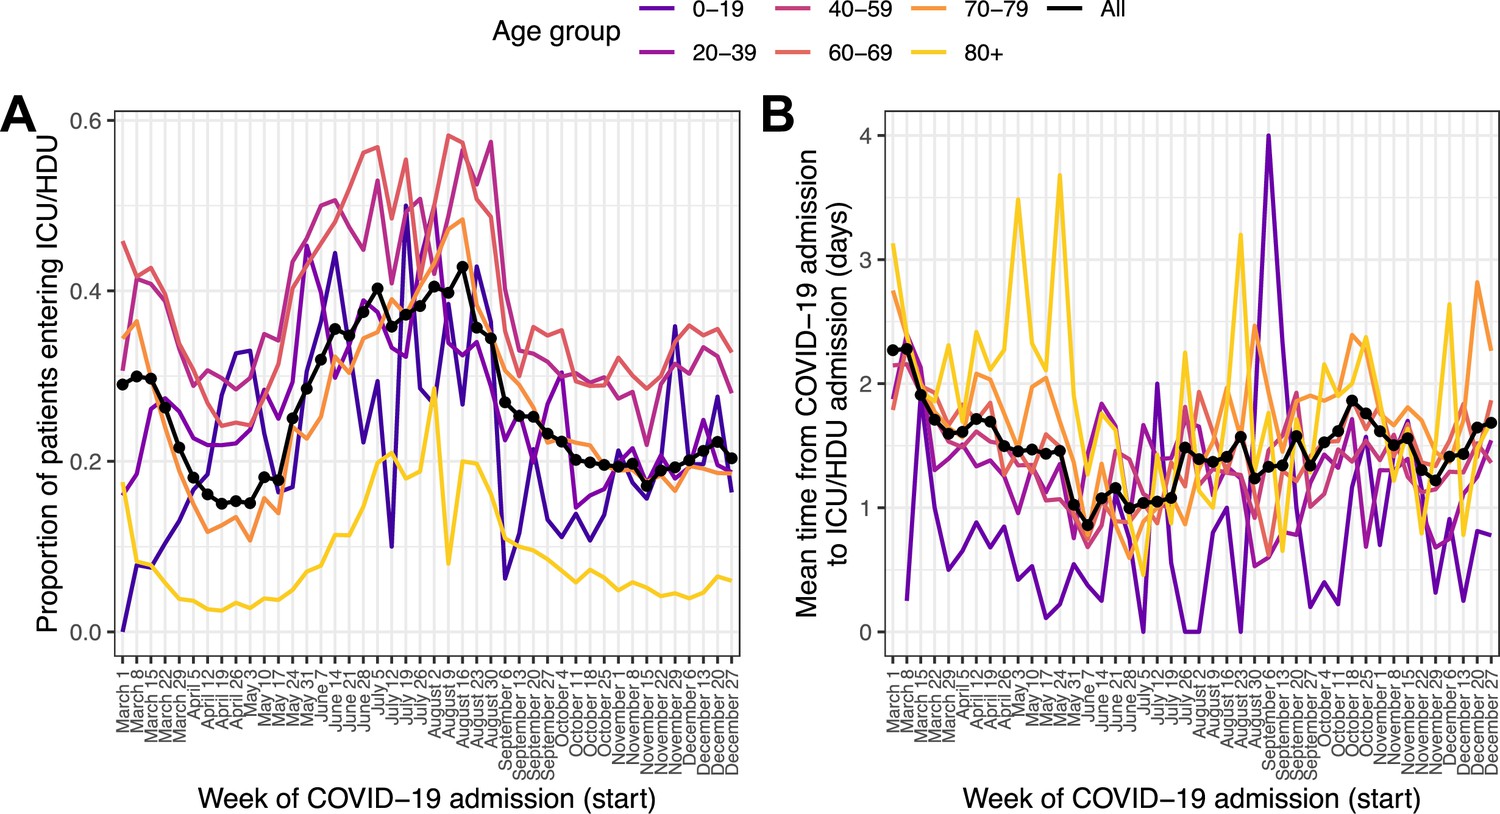
Patients entering ICU/HDU within 13 days of COVID-19 admission (A) and time from COVID-19 admission to ICU/HDU admission (B) over time.
Each line is the proportion (A) or mean value (B) amongst all patients (black, dotted) or patients in each age group (coloured).
-
Figure 2—source data 1
Proportion of individuals entering ICU by week of COVID-19 admission, according to age group and overall.
- https://cdn.elifesciences.org/articles/70970/elife-70970-fig2-data1-v3.zip
-
Figure 2—source data 2
Mean time in days from COVID-19 admission to ICU admission by week of COVID-19 admission, according to age group and overall.
- https://cdn.elifesciences.org/articles/70970/elife-70970-fig2-data2-v3.zip
Figure 3 with 4 supplements
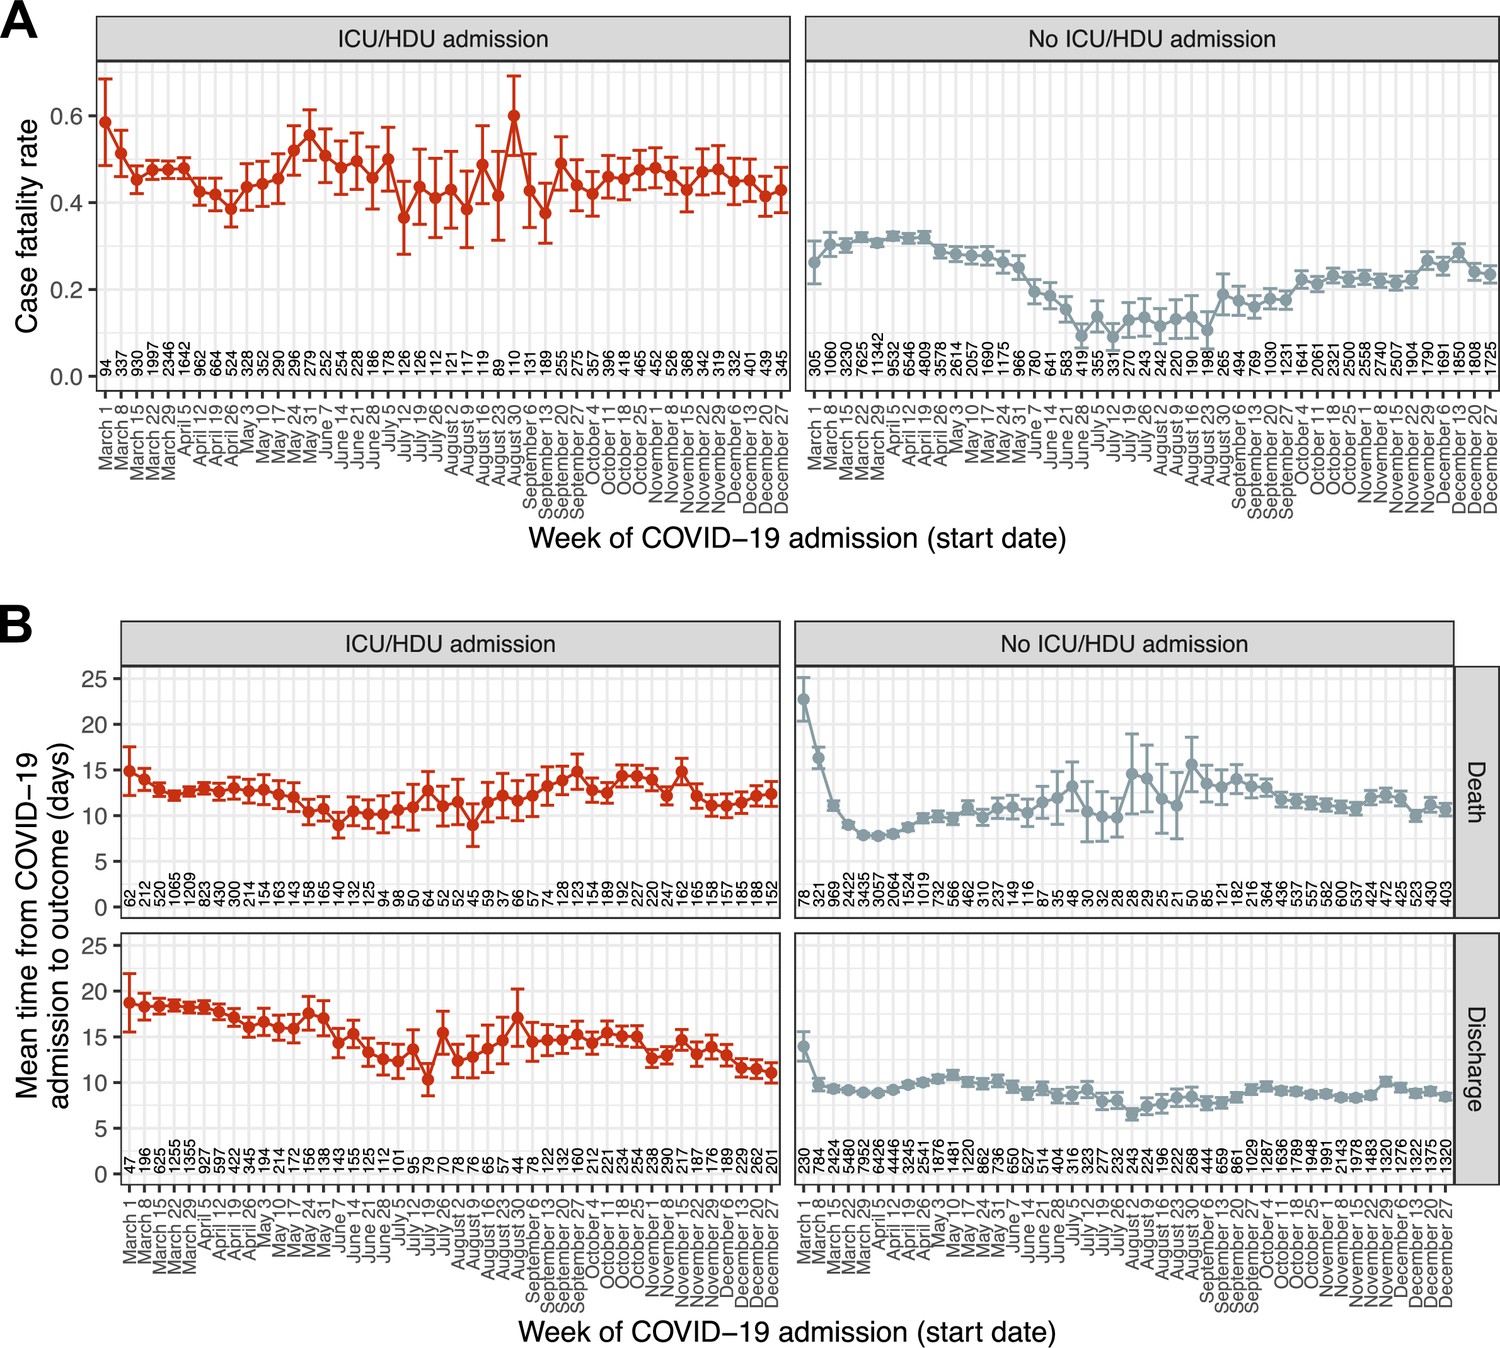
Temporal trends in outcome and time to outcome.
(A) Case fatality ratio in patients experiencing death or discharge within 45 days of COVID-19 admission, by recorded ICU/HDU admission. (B) Mean time from COVID-19 admission to the outcome of death or discharge, further faceted by ICU/HDU admission. Error bars represent 95 % confidence intervals. Numbers along the x-axis indicate the numbers of patients involved in each category.
-
Figure 3—source data 1
Estimate and 95 % confidence interval for hCFR by week of COVID-19 admission, according to ICU/HDU admission status.
- https://cdn.elifesciences.org/articles/70970/elife-70970-fig3-data1-v3.zip
-
Figure 3—source data 2
Estimate and 95 % confidence interval for time from COVID-19 admission to outcome by week of COVID-19 admission, according to ICU/HDU admission status and outcome.
- https://cdn.elifesciences.org/articles/70970/elife-70970-fig3-data2-v3.zip
-
Figure 3—source data 3
Estimated overall hCFR by week of COVID-19 admission.
- https://cdn.elifesciences.org/articles/70970/elife-70970-fig3-data3-v3.zip
-
Figure 3—source data 4
Estimated mean time from COVID-19 admission to outcome by week of COVID-19 admission.
- https://cdn.elifesciences.org/articles/70970/elife-70970-fig3-data4-v3.zip
-
Figure 3—source data 5
Estimate and 95 % confidence interval for hCFR by week of COVID-19 admission, according to ICU/HDU admission status and age group.
- https://cdn.elifesciences.org/articles/70970/elife-70970-fig3-data5-v3.zip
-
Figure 3—source data 6
Estimate and 95 % confidence interval for time from COVID-19 admission to outcome by week of COVID-19 admission, according to ICU/HDU admission status and outcome, and age group.
- https://cdn.elifesciences.org/articles/70970/elife-70970-fig3-data6-v3.zip
Figure 3—figure supplement 1
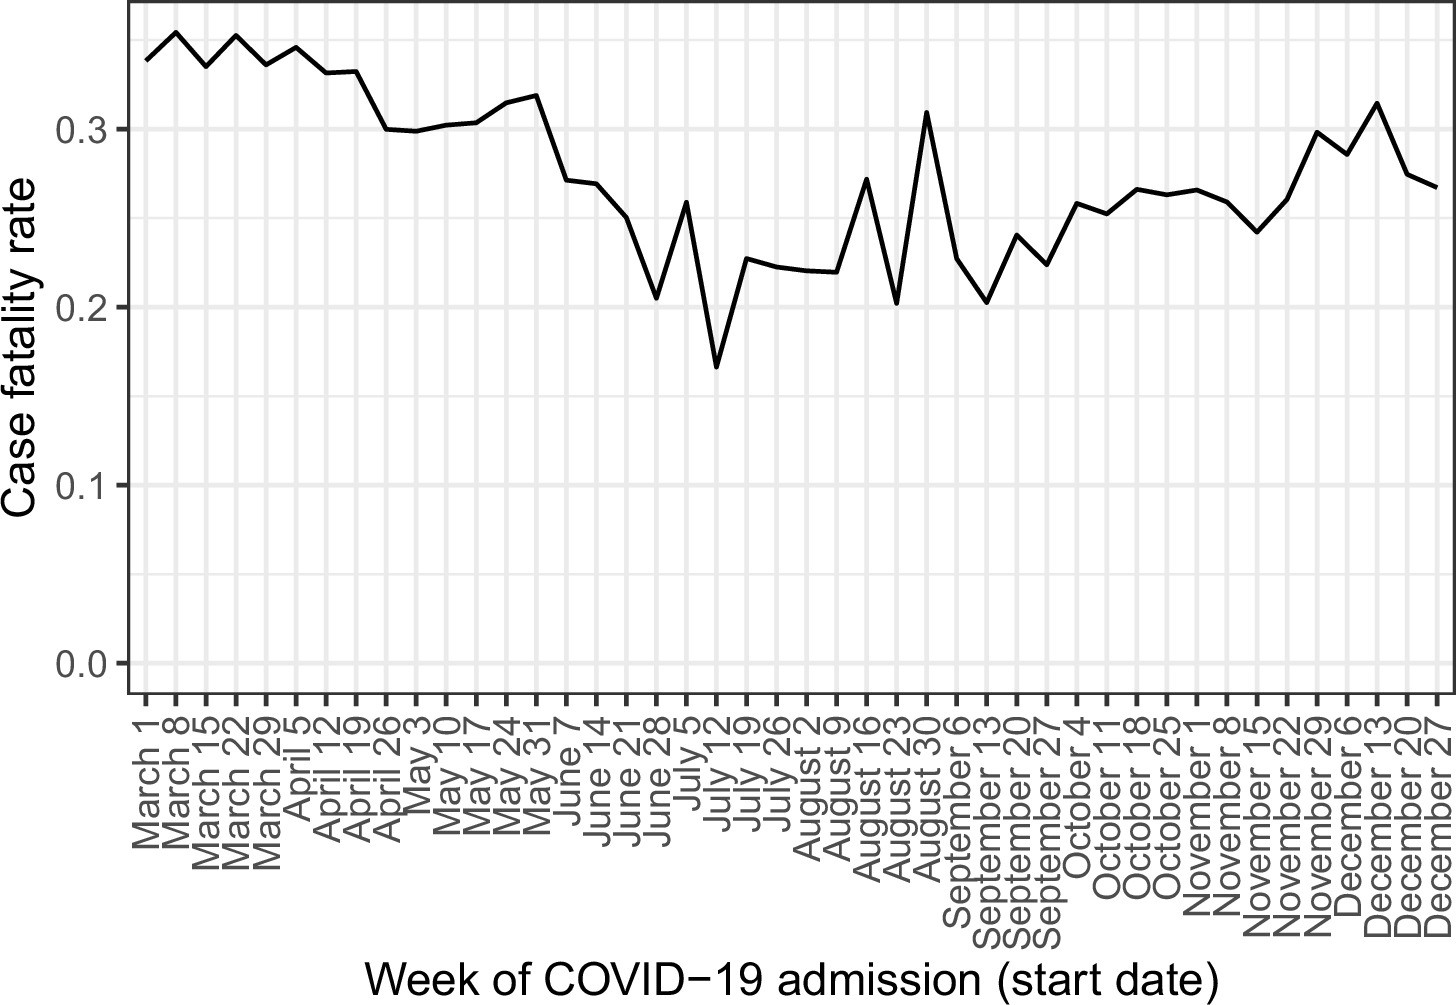
Temporal trends in case fatality rate amongst all patients.
Figure 3—figure supplement 2
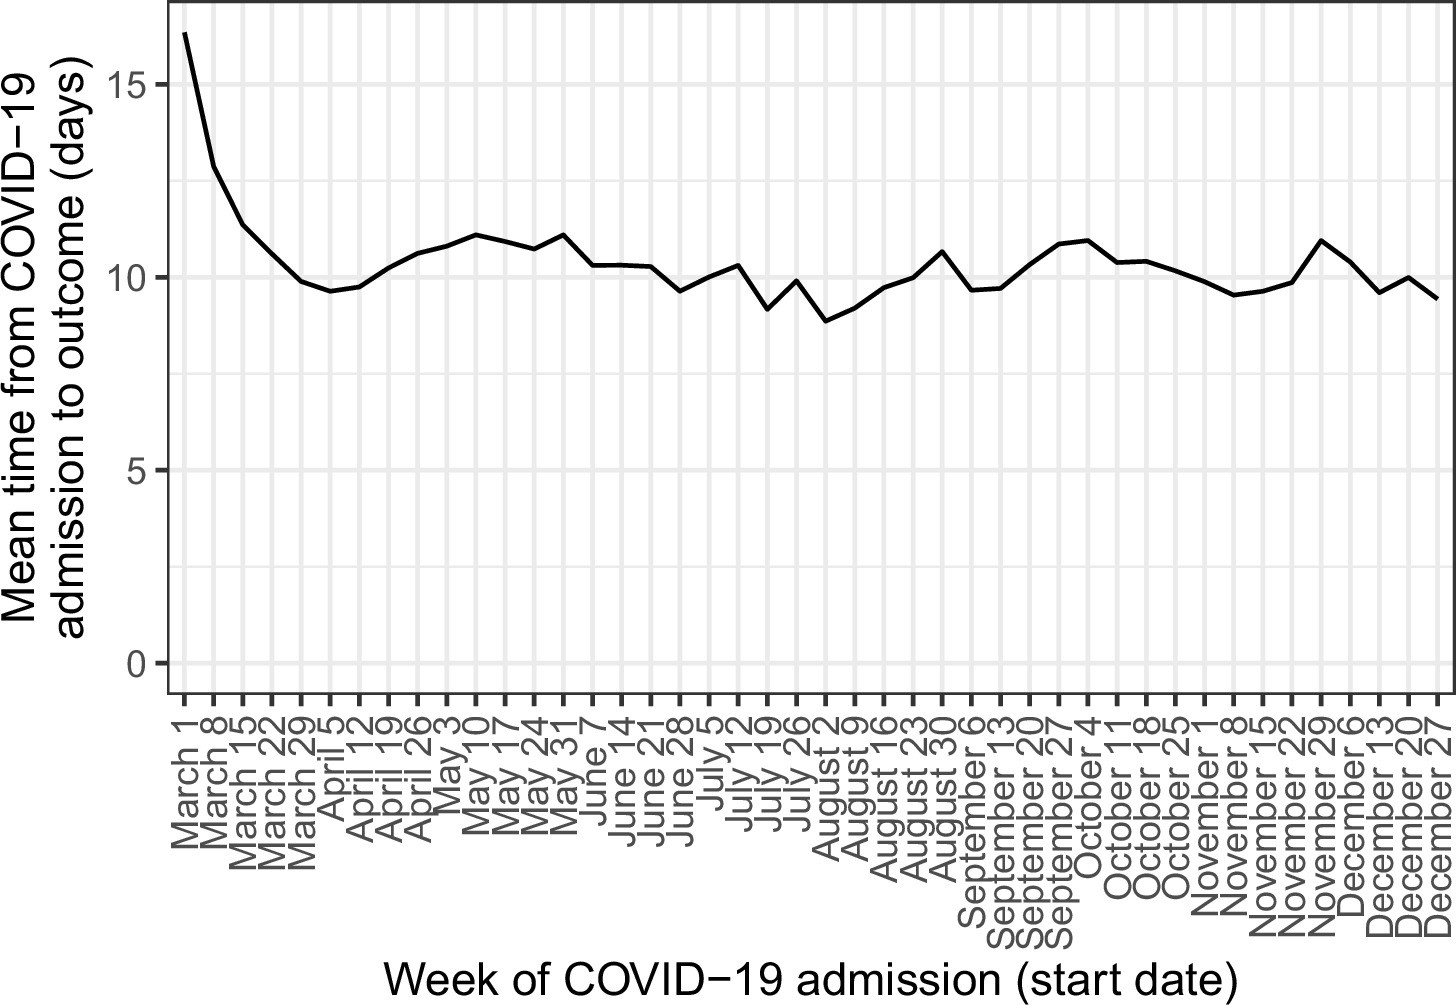
Temporal trends in mean time from COVID-19 admission to final outcome (death or discharge).
Figure 3—figure supplement 3
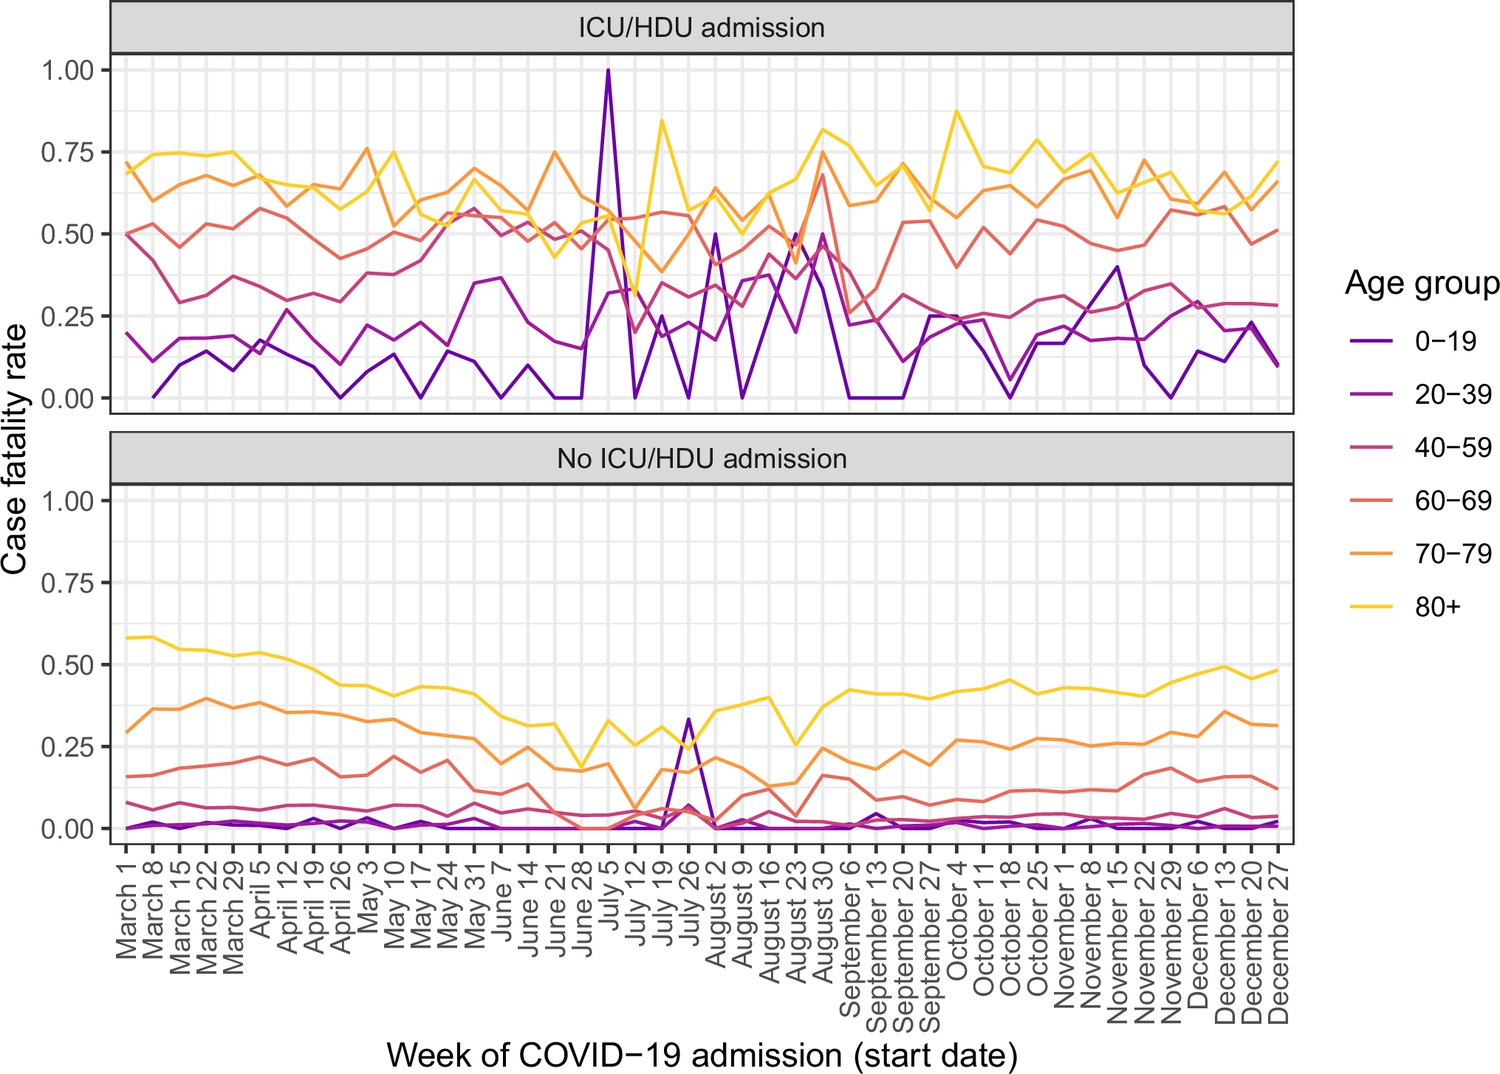
Temporal trends in case fatality rate, faceted by ICU/HDU admission and further separated by age group.
Figure 3—figure supplement 4
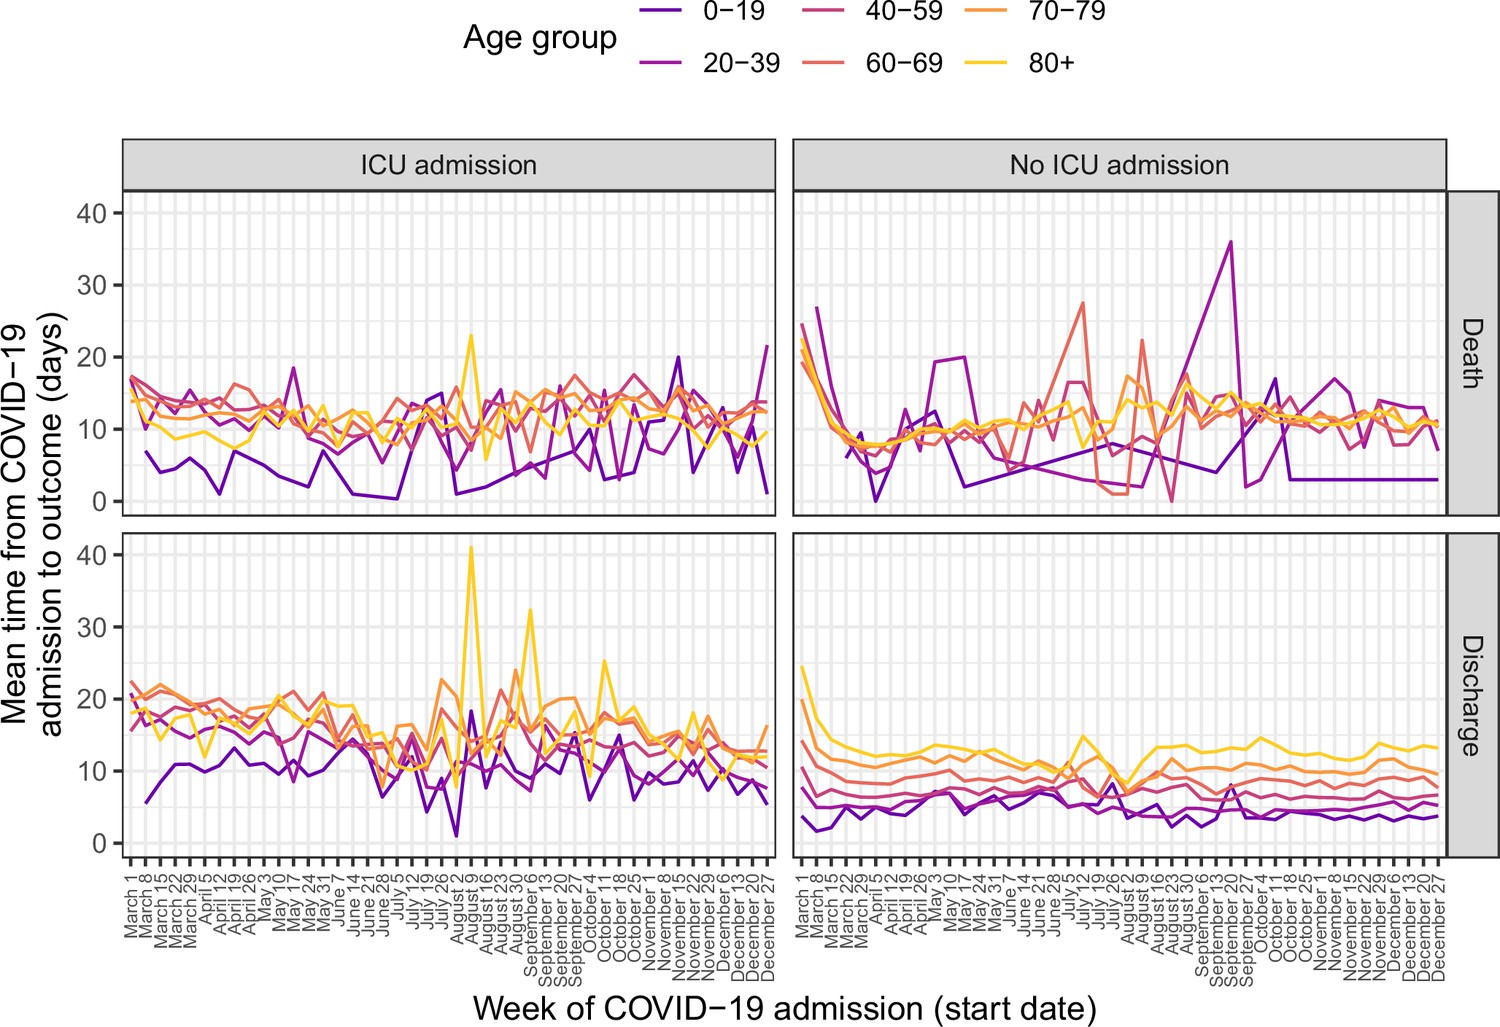
Temporal trends in mean time from COVID-19 admission to final outcome, faceted by outcome and ICU/HDU admission and further separated by age group.
Figure 4
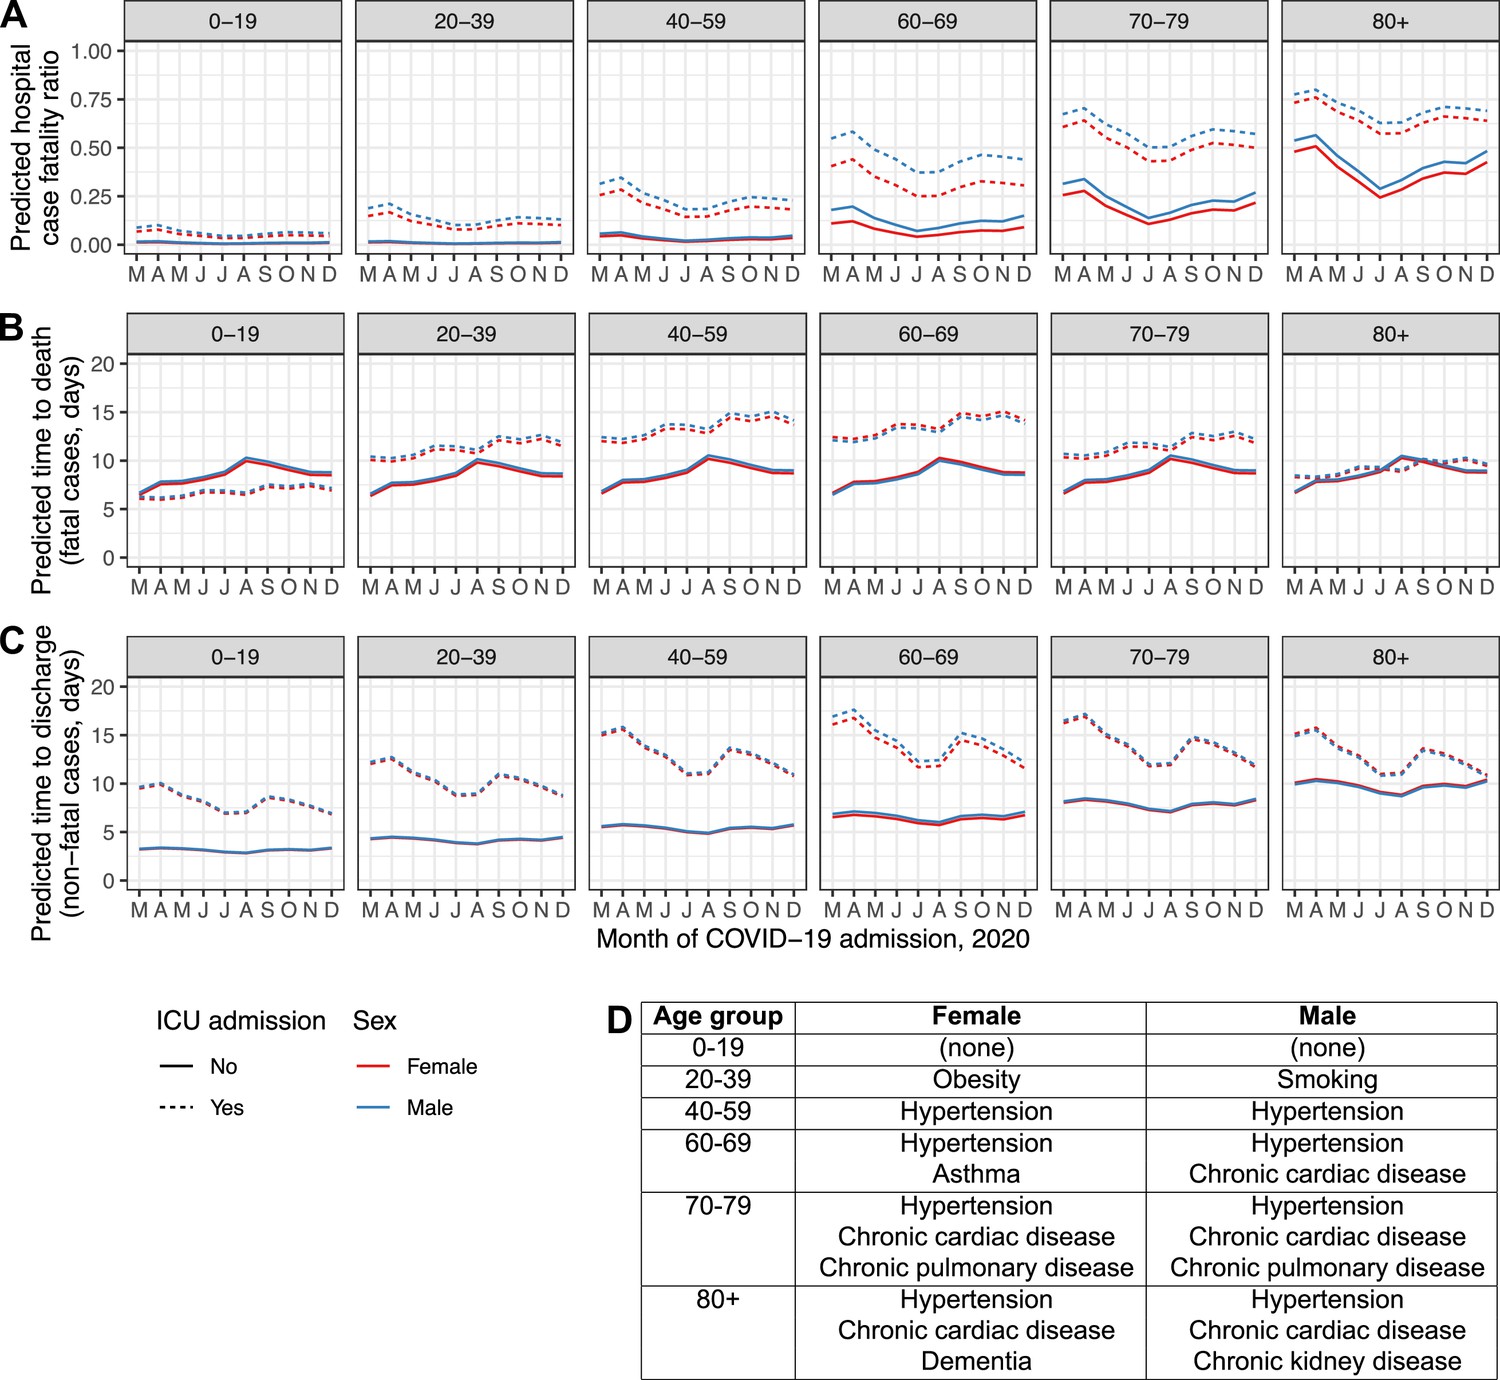
Regression model predictions for hospital CFR (A), predicted time to death in fatal cases (B) and predicted time to discharge in non-fatal cases (C) in a set of hypothetical typical patients.
Lines are plotted by month of COVID-19 admission (y-axis), age group (facets, left to right), sex (red: female, blue: male), and ICU admission (solid lines: at least once, dotted lines: never). The inset table (D) lists the comorbidities assigned to the individuals in each combination of sex and age group.
-
Figure 4—source data 1
Predicted hCFR, time to death and time to discharge for all hypothetical patients.
- https://cdn.elifesciences.org/articles/70970/elife-70970-fig4-data1-v3.zip
Figure 5 with 1 supplement
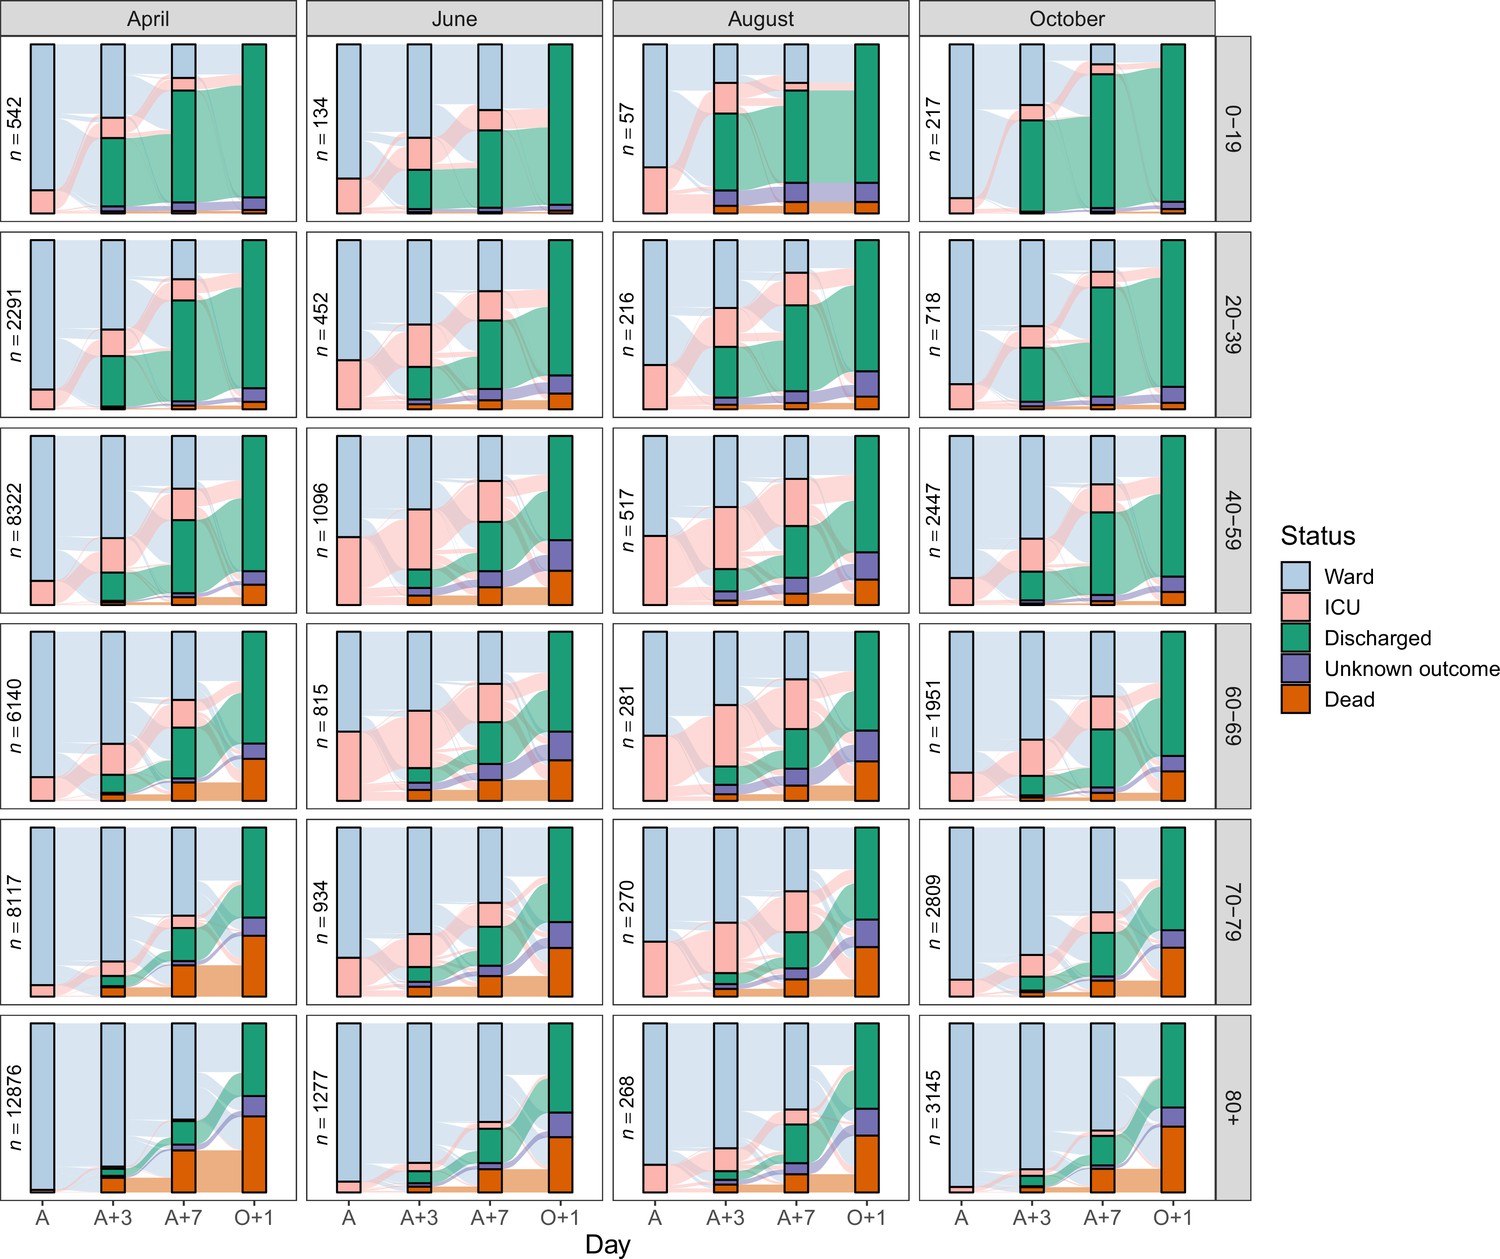
Sankey diagrams depicting the progress through the inpatient journey for patients with COVID-19 admission in April, June, August and October 2020, and subdivided by age.
Bars are presented for the day of admission (A), 3 and 7 days later (A + 3 and A + 7), and the day after final outcome (O + 1).
-
Figure 5—source data 1
Number of patients occupying a ward bed, occupying an ICU/HDU bed, dead, discharged and with unknown outcome on the day of admission (A), 3 and 7 days later (A + 3 and A + 7), and the day after final outcome (O + 1), by age group and month of COVID-19 admission.
- https://cdn.elifesciences.org/articles/70970/elife-70970-fig5-data1-v3.zip
Figure 5—figure supplement 1
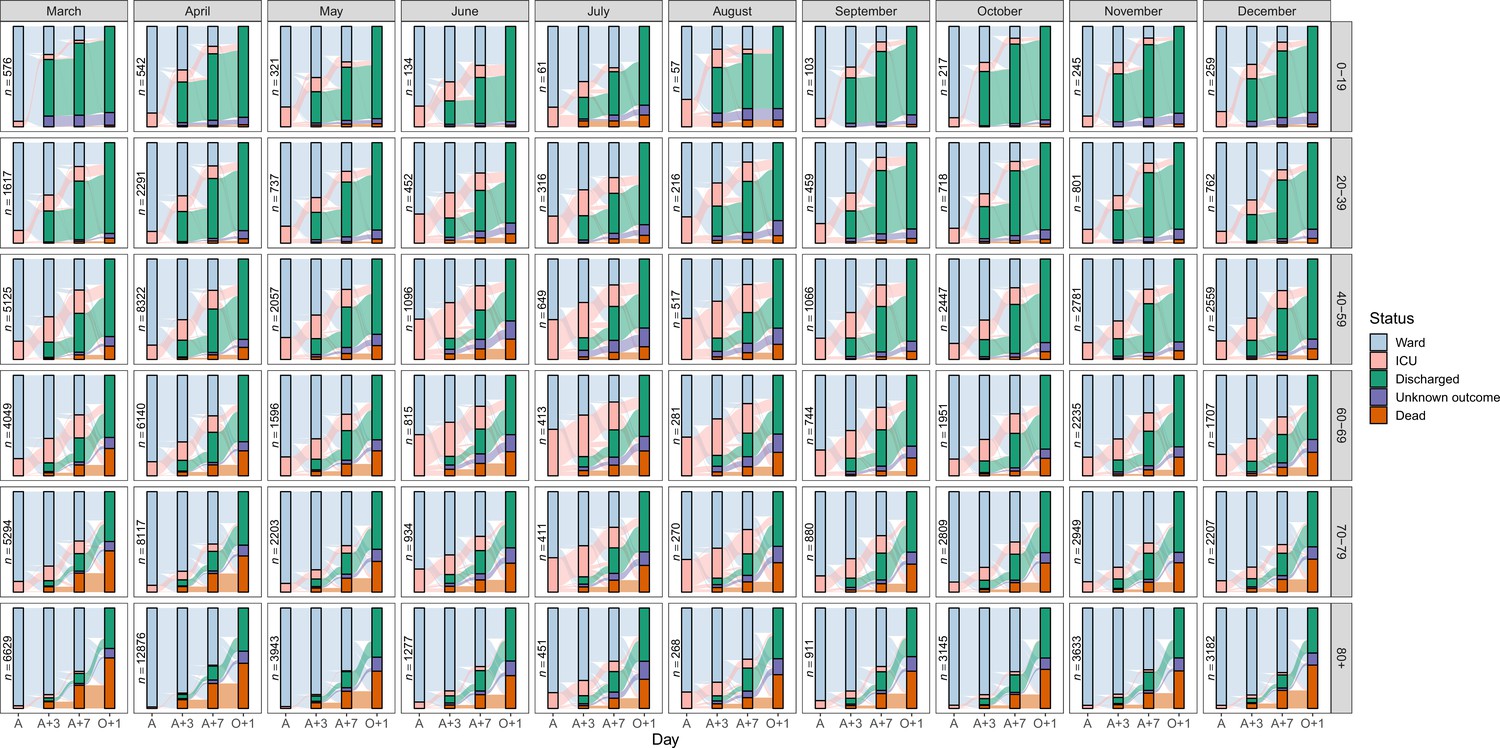
Expanded version of Figure 5, showing Sankey diagrams for all months.
Tables
Table 1
Baseline characteristics of the included patients.
*Some patients admitted in early 2021 are included in order to fully represent patients with symptom onset in December 2020.
| Variable | Value | Count | % |
|---|---|---|---|
| Month of admission | March | 27,108 | 19.4 |
| April | 42,267 | 30.3 | |
| May | 12,311 | 8.82 | |
| June | 5,342 | 3.83 | |
| July | 2,811 | 2.01 | |
| August | 2,218 | 1.59 | |
| September | 5,265 | 3.77 | |
| October | 13,822 | 9.91 | |
| November | 15,155 | 10.9 | |
| December | 13,205 | 9.47 | |
| Sex | Female | 59,719 | 42.8 |
| Male | 79,550 | 57 | |
| Unknown | 235 | 0.168 | |
| Age group | 0–19 | 2,697 | 1.93 |
| 20–39 | 9,302 | 6.67 | |
| 40–59 | 30,399 | 21.8 | |
| 60–69 | 22,815 | 16.4 | |
| 70–79 | 29,901 | 21.4 | |
| 80+ | 41,571 | 29.8 | |
| Unknown | 2,819 | 2.02 | |
| Symptom onset post-admission | No | 118,874 | 85.2 |
| Yes | 11,695 | 8.38 | |
| Unknown | 8,935 | 6.4 |
Table 2
Prevalence of symptoms at hospital admission and comorbidities.
The final column gives the number of times the condition is recorded as present over the number of times its presence or absence is recorded (i.e. the data is non-missing). Designated “common” symptoms are indicated with a (C); the number and percentages of patients presenting with combinations of these are separately presented.
| Name | % present | N (present)/n (data recorded) | |
|---|---|---|---|
| Symptoms at admission | Cough (C) | 66.6 | (87218/131002) |
| Shortness of breath (C) | 64.4 | (89611/139244) | |
| Fever (C) | 63.4 | (84665/133494) | |
| Fatigue (C) | 44.7 | (52837/118184) | |
| Confusion | 24.9 | (31167/125123) | |
| Vomiting | 19.9 | (24577/123625) | |
| Myalgia | 18.8 | (20921/111419) | |
| Diarrhoea | 18.2 | (22375/123121) | |
| Headache | 12 | (13424/112069) | |
| Abdominal pain | 11.1 | (13294/120175) | |
| Ageusia | 8.8 | (6758/76396) | |
| Wheezing | 7.7 | (8846/115511) | |
| Anosmia | 6.8 | (5281/77751) | |
| Runny nose | 3.4 | (3704/108623) | |
| Ulcers | 2.2 | (2291/105394) | |
| Bleeding | 1.8 | (2093/119266) | |
| Rash | 1.5 | (1713/113636) | |
| Seizures | 1.5 | (1801/120755) | |
| Lymphadenopathy | 0.7 | (774/112245) | |
| Conjunctivitis | 0.5 | (553/113083) | |
| Ear pain | 0.5 | (484/94873) | |
| Number of recorded ‘common’ symptoms (C) | 0 | 7.6 | (10836/142540) |
| 1 | 20.5 | (29257/142540) | |
| 2 | 26.4 | (37681/142540) | |
| 3 | 29 | (41359/142540) | |
| 4 | 16.4 | (23407/142540) | |
| Comorbidities | Hypertension | 47.6 | (50174/105433) |
| Chronic cardiac disease | 29.7 | (38175/128374) | |
| Diabetes | 16.8 | (20037/119155) | |
| Chronic pulmonary disease | 16.5 | (22040/133662) | |
| Chronic kidney disease | 15.7 | (20894/133256) | |
| Obesity | 14.4 | (16624/115463) | |
| Asthma | 13.2 | (17656/133341) | |
| Dementia | 12.9 | (16404/127239) | |
| Smoking | 12.8 | (7299/57164) | |
| Chronic neurological disorder | 11.5 | (15248/132789) | |
| Rheumatological disorder | 11.2 | (13814/123453) | |
| Malignant neoplasm | 9.3 | (12343/132537) | |
| Chronic haemotologic disease | 4.1 | (5117/123739) | |
| Liver disease | 3.5 | (4443/128733) | |
| Malnutrition | 2.6 | (3094/119518) | |
| HIV/AIDS | 0.4 | (515/119235) |
Table 3
Summary of the components of the inpatient journey and their variation over the course of 2020.
All time periods are in days. Patients are categorised by month of symptom onset for onset to admission, and by month of COVID admission in all other cases. Patients with COVID admission in 2021, who are included in the analysis of time from onset to admission if their onset date was in 2020, are not listed here as they are excluded from any analysis where the outcome variable is not time from onset to admission. “Outcome” is either death or discharge, and the ‘admission to outcome’ column gives the total length of hospital stay. For all durations, the top 2.5 % of values are excluded as potentially mis-entered.
| Month | Onset to hospital admission | Proportion entering ICU/HDU | COVID-19 admission to ICU/HDU | hCFR | COVID-19 admission to death | COVID-19 admission to discharge | COVID-19 admission to outcome | |||||
|---|---|---|---|---|---|---|---|---|---|---|---|---|
| Mean | SD | Mean | SD | Mean | SD | Mean | SD | Mean | SD | |||
| March | 6.82 | 5.15 | 0.25 | 1.78 | 2.34 | 0.33 | 11 | 8.41 | 10.9 | 9.71 | 10.8 | 9.29 |
| April | 4.27 | 4.53 | 0.16 | 1.63 | 2.36 | 0.33 | 9.1 | 7.96 | 10.3 | 9.14 | 9.91 | 8.78 |
| May | 4.09 | 4.58 | 0.17 | 1.45 | 2.45 | 0.3 | 10 | 8.41 | 11 | 9.62 | 10.9 | 9.28 |
| June | 4.4 | 4.51 | 0.3 | 1.04 | 2.12 | 0.27 | 10 | 8.65 | 10.5 | 8.83 | 10.5 | 8.78 |
| July | 4.77 | 4.22 | 0.35 | 1.1 | 2.29 | 0.21 | 11 | 8.68 | 9.53 | 8.37 | 9.88 | 8.46 |
| August | 5.49 | 4.6 | 0.36 | 1.41 | 2.49 | 0.22 | 12 | 8.82 | 8.88 | 7.88 | 9.44 | 8.16 |
| September | 6.3 | 5.01 | 0.24 | 1.38 | 2.21 | 0.22 | 14 | 9.81 | 9.25 | 8.64 | 10.2 | 9.08 |
| October | 5.72 | 4.89 | 0.19 | 1.69 | 2.59 | 0.26 | 12 | 8.69 | 9.78 | 8.75 | 10.5 | 8.81 |
| November | 5.17 | 4.75 | 0.18 | 1.48 | 2.49 | 0.26 | 12 | 8.38 | 9.1 | 8.08 | 9.78 | 8.24 |
| December | 4.42 | 4.21 | 0.22 | 1.51 | 2.48 | 0.29 | 11 | 8 | 9.52 | 8.16 | 10 | 8.15 |
Table 4
Combined results of a logistic regression analysis identifying predictors of death as an outcome, and two linear regression analyses identifying correlates of time to death and time to discharge.
All analyses are multivariable. For brevity, the country variable, as well as the ‘unknown’ class for each comorbidity (representing patients with missing data for that condition) are omitted here; see Supplementary file 7 for a version with them included. The p-values of Wald tests for the inclusion of each variable in each regression are included as a separate column; these were calculated including the ‘unknown’ class for comorbidities.
| Odds ratio (death v discharge) | Time to death (% change, days) | Time to discharge (% change, days) | |||||||
|---|---|---|---|---|---|---|---|---|---|
| Estimate | 95 % confidence interval | Wald test p-value | Estimate | 95 % confidence interval | Wald test p-value | Estimate | 95 % confidence interval | Wald test p-value | |
| Month of COVID admission (ref: April) | < 0.001 | < 0.001 | < 0.001 | ||||||
| March | 1.1 | (1.1, 1.2) | 14.7 | (12.2, 17.3) | 3.7 | (2.1, 5.2) | |||
| May | 0.7 | (0.7, 0.8) | 15.5 | (12.1, 19.1) | 1.3 | (–0.6, 3.3) | |||
| June | 0.5 | (0.5, 0.6) | 20.8 | (14.2, 27.7) | –2.8 | (−5.6,–0.02) | |||
| July | 0.3 | (0.3, 0.4) | 28.1 | (14.9, 42.8) | –8.5 | (−12.2,–4.7) | |||
| August | 0.4 | (0.3, 0.5) | 47.2 | (29.5, 67.3) | –10.8 | (−15.0,–6.4) | |||
| September | 0.6 | (0.5, 0.6) | 40.7 | (32.6, 49.3) | –3.2 | (−5.8,–0.5) | |||
| October | 0.6 | (0.6, 0.7) | 33.2 | (28.9, 37.7) | –1.4 | (–3.2, 0.4) | |||
| November | 0.6 | (0.6, 0.7) | 26.7 | (22.8, 30.8) | –3.5 | (−5.2,–1.8) | |||
| December | 0.8 | (0.8, 0.9) | 26.3 | (22.3, 30.4) | 2.2 | (0.2, 4.2) | |||
| Age group (ref: 40–59) | < 0.001 | < 0.001 | < 0.001 | ||||||
| 10–19 | 0.3 | (0.2, 0.4) | –0.5 | (–24.3, 30.6) | –33.6 | (−35.7,–31.4) | |||
| 20–39 | 0.3 | (0.2, 0.3) | –1.7 | (–15.9, 14.8) | –16.9 | (−18.5,–15.3) | |||
| 60–69 | 2.9 | (2.7, 3.2) | –2.1 | (–6.8, 3.0) | 17.4 | (15.6, 19.2) | |||
| 70–79 | 6.1 | (5.7, 6.6) | 1.9 | (–2.6, 6.6) | 36.4 | (34.3, 38.6) | |||
| 80+ | 10.9 | (10.1, 11.8) | 4.3 | (–0.3, 9.0) | 52.9 | (50.4, 55.4) | |||
| ICU/HDU admission | 7.6 | (6.8, 8.4) | < 0.001 | 68.3 | (59.1, 78.0) | < 0.001 | 140.1 | (133.0, 147.3) | < 0.001 |
| Sex (ref: female) | < 0.001 | < 0.001 | 0.0059 | ||||||
| Male | 1.3 | (1.3, 1.4) | 2.9 | (1.4, 4.5) | 1.2 | (0.2, 2.1) | |||
| Pregnant (ref: female, no) | 0.097 | 0.069 | < 0.001 | ||||||
| Female, yes | 0.6 | (0.4, 1.0) | –5.4 | (–27.4, 23.3) | –18.6 | (−22.3,–14.6) | |||
| Days from symptom onset to hospital admission (ref: 0–6) | < 0.001 | < 0.001 | < 0.001 | ||||||
| Symptom onset post-admission | 1.3 | (1.2, 1.3) | 20.7 | (17.9, 23.5) | 45.7 | (42.9, 48.6) | |||
| 7–13 | 0.7 | (0.7, 0.8) | –1.7 | (–3.5, 0.1) | –3.6 | (−4.6,–2.5) | |||
| 14+ | 0.7 | (0.7, 0.8) | –0.2 | (–2.9, 2.5) | –6.1 | (−7.6,–4.5) | |||
| Comorbidities | |||||||||
| Asthma | 0.9 | (0.9, 1.0) | < 0.001 | 2.5 | (0.2, 4.9) | 0.11 | –1.6 | (−2.9,–0.3) | 0.048 |
| Chronic cardiac disease | 1.2 | (1.2, 1.3) | < 0.001 | –2.8 | (−4.4,–1.3) | < 0.001 | 1.3 | (0.1, 2.6) | 0.075 |
| Chronic haemotologic disease | 1.2 | (1.1, 1.3) | < 0.001 | 0.2 | (–3.1, 3.6) | 0.62 | 5.8 | (3.1, 8.6) | < 0.001 |
| Chronic kidney disease | 1.4 | (1.4, 1.5) | < 0.001 | –2.4 | (−4.1,–0.6) | 0.012 | 5.8 | (4.2, 7.4) | < 0.001 |
| Chronic neurological disorder | 1.4 | (1.3, 1.4) | < 0.001 | –0.7 | (–2.7, 1.4) | 0.61 | 15.3 | (13.4, 17.2) | < 0.001 |
| Chronic pulmonary disease | 1.4 | (1.3, 1.4) | < 0.001 | –2.2 | (−3.9,–0.5) | 0.034 | 3.9 | (2.4, 5.3) | < 0.001 |
| Dementia | 1.5 | (1.4, 1.6) | < 0.001 | –1.2 | (–3.1, 0.8) | 0.43 | 9 | (7.0, 11.0) | < 0.001 |
| Diabetes | 1.1 | (1.1, 1.2) | < 0.001 | –4.2 | (−6.0,–2.3) | < 0.001 | 1.8 | (0.4, 3.2) | < 0.001 |
| HIV/AIDS | 1.2 | (1.0, 1.6) | 0.005 | 4 | (–8.2, 17.8) | 0.58 | 2.2 | (–5.1, 10.1) | 0.0025 |
| Hypertension | 1 | (0.9, 1.0) | < 0.001 | 0.2 | (–1.5, 1.9) | 0.14 | 2 | (0.8, 3.2) | < 0.001 |
| Liver disease | 1.4 | (1.3, 1.6) | < 0.001 | 5.2 | (1.1, 9.5) | < 0.001 | 12 | (9.0, 15.1) | < 0.001 |
| Malignant neoplasm | 1.4 | (1.4, 1.5) | < 0.001 | 3.5 | (1.2, 5.8) | 0.0059 | 2.2 | (0.3, 4.1) | < 0.001 |
| Malnutrition | 1.3 | (1.2, 1.5) | < 0.001 | 0.6 | (–3.6, 5.0) | 0.81 | 11.5 | (7.5, 15.7) | < 0.001 |
| Obesity | 1.1 | (1.1, 1.2) | < 0.001 | –5.5 | (−7.7,–3.2) | < 0.001 | 6.3 | (4.8, 7.9) | < 0.001 |
| Rheumatological disorder | 1 | (0.9, 1.0) | 0.045 | 2.3 | (0.1, 4.7) | 0.052 | 0.6 | (–1.0, 2.2) | 0.44 |
| Smoking | 1.1 | (1.1, 1.2) | < 0.001 | 4.2 | (0.5, 8.0) | 0.1 | 2.2 | (0.04, 4.4) | 0.034 |
| Interaction: ICU/HDU admission _ month of admission (ref: April) | < 0.001 | < 0.001 | < 0.001 | ||||||
| March | 1 | (0.9, 1.1) | –14.3 | (−18.1,–10.4) | 0.6 | (–3.1, 4.5) | |||
| May | 1.1 | (0.9, 1.3) | –12 | (−17.6,–6.1) | -9 | (−13.9,–3.9) | |||
| June | 1.2 | (1.0, 1.5) | –9.1 | (−16.8,–0.8) | –11.3 | (−17.1,–5.1) | |||
| July | 1.4 | (1.1, 1.9) | –14.8 | (−25.8,–2.1) | –18.8 | (−25.2,–11.8) | |||
| August | 1.1 | (0.8, 1.6) | –27.9 | (−38.4,–15.6) | –15.6 | (−23.2,–7.3) | |||
| September | 1.1 | (0.9, 1.4) | –16.6 | (−24.1,–8.4) | –6.9 | (−13.0,–0.3) | |||
| October | 1.1 | (1.0, 1.3) | –13.7 | (−18.9,–8.2) | –11.6 | (−15.9,–7.0) | |||
| November | 1.1 | (1.0, 1.3) | –6.6 | (−12.1,–0.7) | –15.9 | (−20.0,–11.6) | |||
| December | 0.8 | (0.7, 0.9) | –11.6 | (−17.0,–5.8) | –27.9 | (−31.4,–24.2) | |||
| Interaction: ICU/HDU admission _ age group (ref: 40–59) | < 0.001 | < 0.001 | < 0.00 | ||||||
| 10–19 | 0.8 | (0.4, 1.4) | –42.8 | (−59.3,–19.6) | 1.7 | (–6.0, 10.2) | |||
| 20–39 | 1.8 | (1.4, 2.4) | –11.8 | (–25.9, 4.9) | 0.8 | (–3.6, 5.4) | |||
| 60–69 | 0.7 | (0.7, 0.8) | 2.5 | (–3.7, 9.0) | –7.2 | (−10.4,–3.9) | |||
| 70–79 | 0.6 | (0.5, 0.7) | –11.8 | (−16.8,–6.6) | –21.8 | (−24.9,–18.5) | |||
| 80+ | 0.4 | (0.3, 0.5) | –28.4 | (−32.9,–23.6) | –40.1 | (−43.6,–36.4) | |||
| Observations | 102,147 | 31,250 | 70,897 | ||||||
Additional files
-
Supplementary file 1
Description of variables used in regression analyses.
- https://cdn.elifesciences.org/articles/70970/elife-70970-supp1-v3.docx
-
Supplementary file 2
Extended demographics table for the complete dataset, by month of COVID-19 admission and overall.
Numbers are raw counts with column-wise percentages in brackets.
- https://cdn.elifesciences.org/articles/70970/elife-70970-supp2-v3.zip
-
Supplementary file 3
Prevalence of symptoms at admission amongst individuals with no reported “common” symptoms (cough, fatigue, fever or shortness of breath), by age group.
Numbers are percentages with fractions in brackets.
- https://cdn.elifesciences.org/articles/70970/elife-70970-supp3-v3.zip
-
Supplementary file 4
Full results of the multivariable linear regression analysis identifying correlates of time from symptom onset to hospital admission (question 1).
Given are percentage predicted increased in time to admission (in days), 95 % confidence intervals, and the p-values of Wald tests for the inclusion of each variable in each regression.
- https://cdn.elifesciences.org/articles/70970/elife-70970-supp4-v3.zip
-
Supplementary file 5
Full results of the multivariable logistic regression analysis identifying predictors of ICU/HDU admission (question 2).
The p-values of Wald tests for the inclusion of each variable in each regression are included as a separate column. Given are odds ratios for admission, 95 % confidence intervals, and the p-values of Wald tests for the inclusion of each variable in each regression.
- https://cdn.elifesciences.org/articles/70970/elife-70970-supp5-v3.zip
-
Supplementary file 6
Full results of the multivariable logistic regression analysis identifying correlates of time to ICU/HDU admission amongst patients so admitted (question 3).
Given are percentage predicted increased in time to admission (in days), 95 % confidence intervals, and the p-values of Wald tests for the inclusion of each variable in each regression.
- https://cdn.elifesciences.org/articles/70970/elife-70970-supp6-v3.zip
-
Supplementary file 7
Extended version of Table 4, including the country variable and the “unknown” class for comorbidities.
- https://cdn.elifesciences.org/articles/70970/elife-70970-supp7-v3.zip
-
Supplementary file 8
Full details for the ISARIC Clinical Characterisation Group.
- https://cdn.elifesciences.org/articles/70970/elife-70970-supp8-v3.docx
-
Transparent reporting form
- https://cdn.elifesciences.org/articles/70970/elife-70970-transrepform1-v3.docx
-
Reporting standard 1
Strobe statement.
- https://cdn.elifesciences.org/articles/70970/elife-70970-repstand1-v3.docx
Download links
A two-part list of links to download the article, or parts of the article, in various formats.
Downloads (link to download the article as PDF)
Open citations (links to open the citations from this article in various online reference manager services)
Cite this article (links to download the citations from this article in formats compatible with various reference manager tools)
Ten months of temporal variation in the clinical journey of hospitalised patients with COVID-19: An observational cohort
eLife 10:e70970.
https://doi.org/10.7554/eLife.70970


