Sepsis leads to lasting changes in phenotype and function of memory CD8 T cells
- Department of Pathology, University of Iowa, United States
- Department of Physics, The George Washington University, United States
- Department of Surgery, University of Iowa, United States
- Center for Discovery and Innovation, Hackensack University Medical Center, United States
- Interdisciplinary Graduate Program in Molecular Medicine, University of Iowa, United States
- Microbiology, Immunology, and Cancer Biology PhD Program, University of Minnesota, United States
- Department of Urology, University of Minnesota, United States
- Center for Immunology, University of Minnesota, United States
- Masonic Cancer Center, University of Minnesota, United States
- Minneapolis VA Health Care System, United States
Figures
Figure 1 with 1 supplement
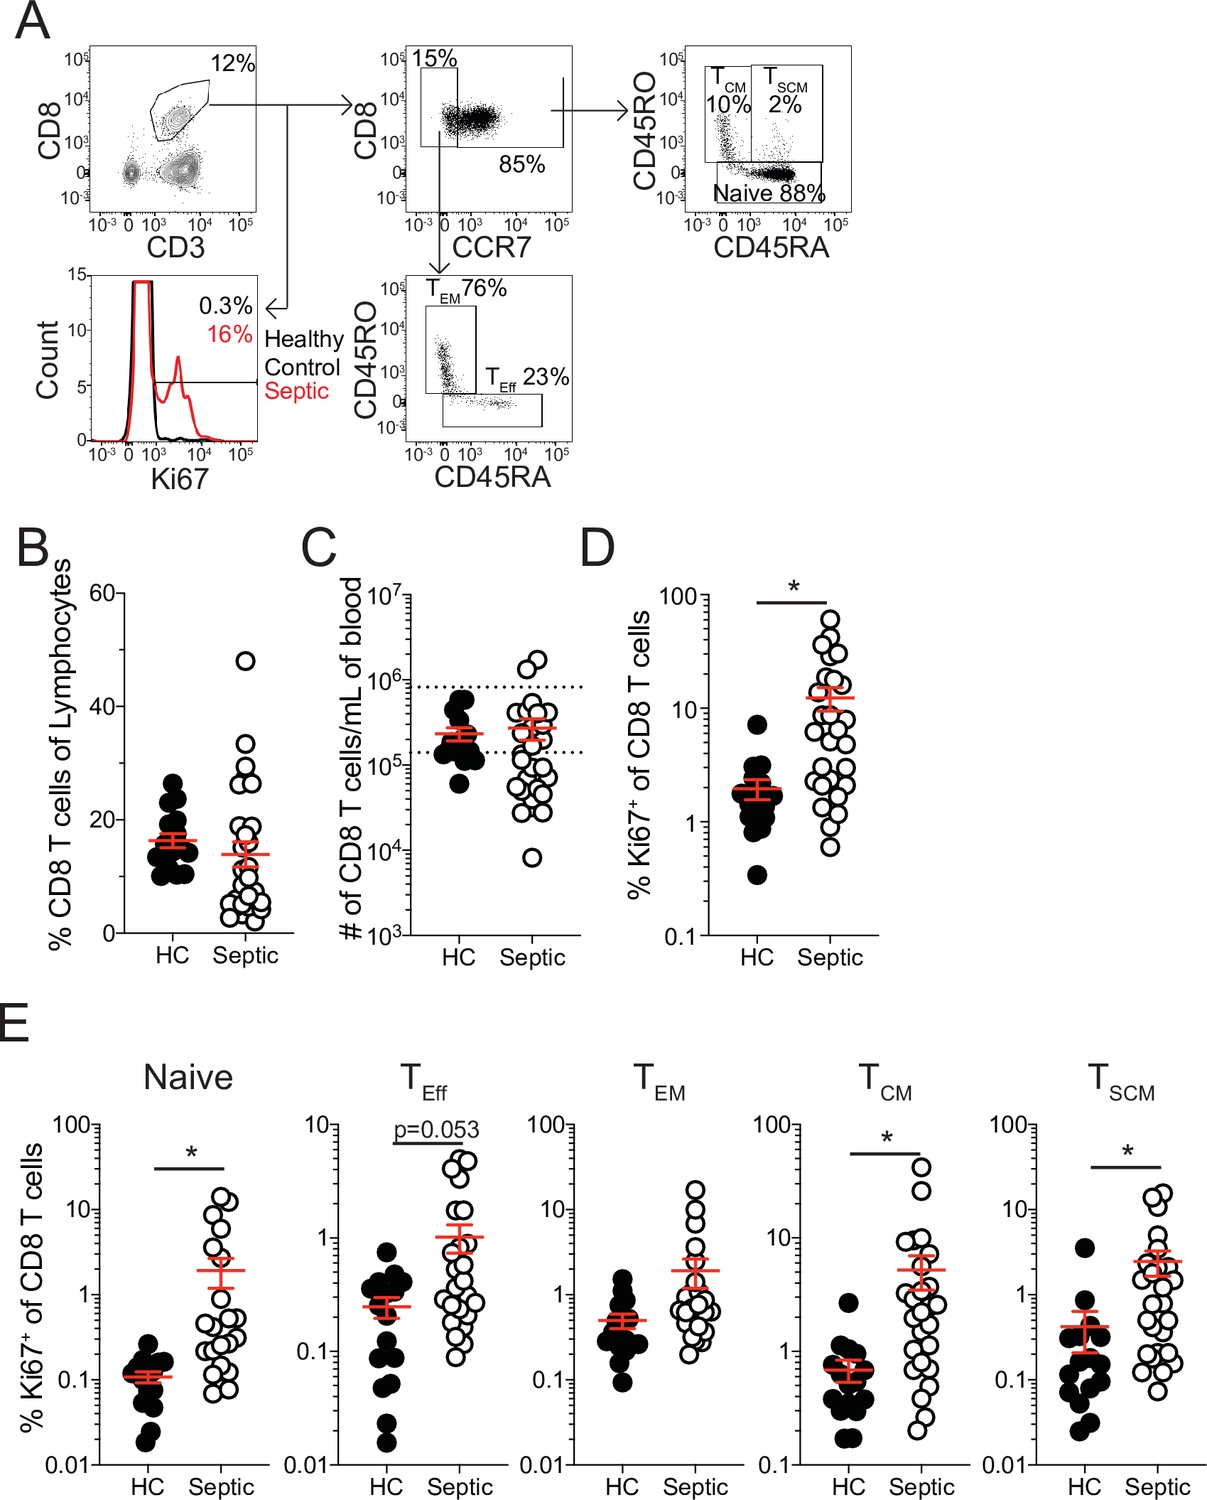
Increased proliferation among CD8 T cells of septic patients.
(A) Representative gating for CD8 T cell subsets and Ki67 expression from healthy controls and septic patients (within 24 hr of hospital admission). (B) Frequency and (C) number of CD8 T cells among lymphocytes in healthy controls and septic patients. Dashed lines indicate the normal range for the number of CD8 T cells per mL of blood. (D) Frequency of Ki67 expressing CD8 T cells in healthy controls and septic patients. (E) Frequency Ki67 expressing cells among Naïve, Effector (TEff), Effector Memory (TEM), Central Memory (TCM), and Stem Cell Memory (TSCM) CD8 T cells from healthy controls and septic patients. Data are representative of 2 independent experiments with 16–27 patients per group. *=p < 0.05. Error bars in represent standard error of the mean.
-
Figure 1—source data 1
Source data for Figure 1.
- https://cdn.elifesciences.org/articles/70989/elife-70989-fig1-data1-v2.xlsx
Figure 1—figure supplement 1
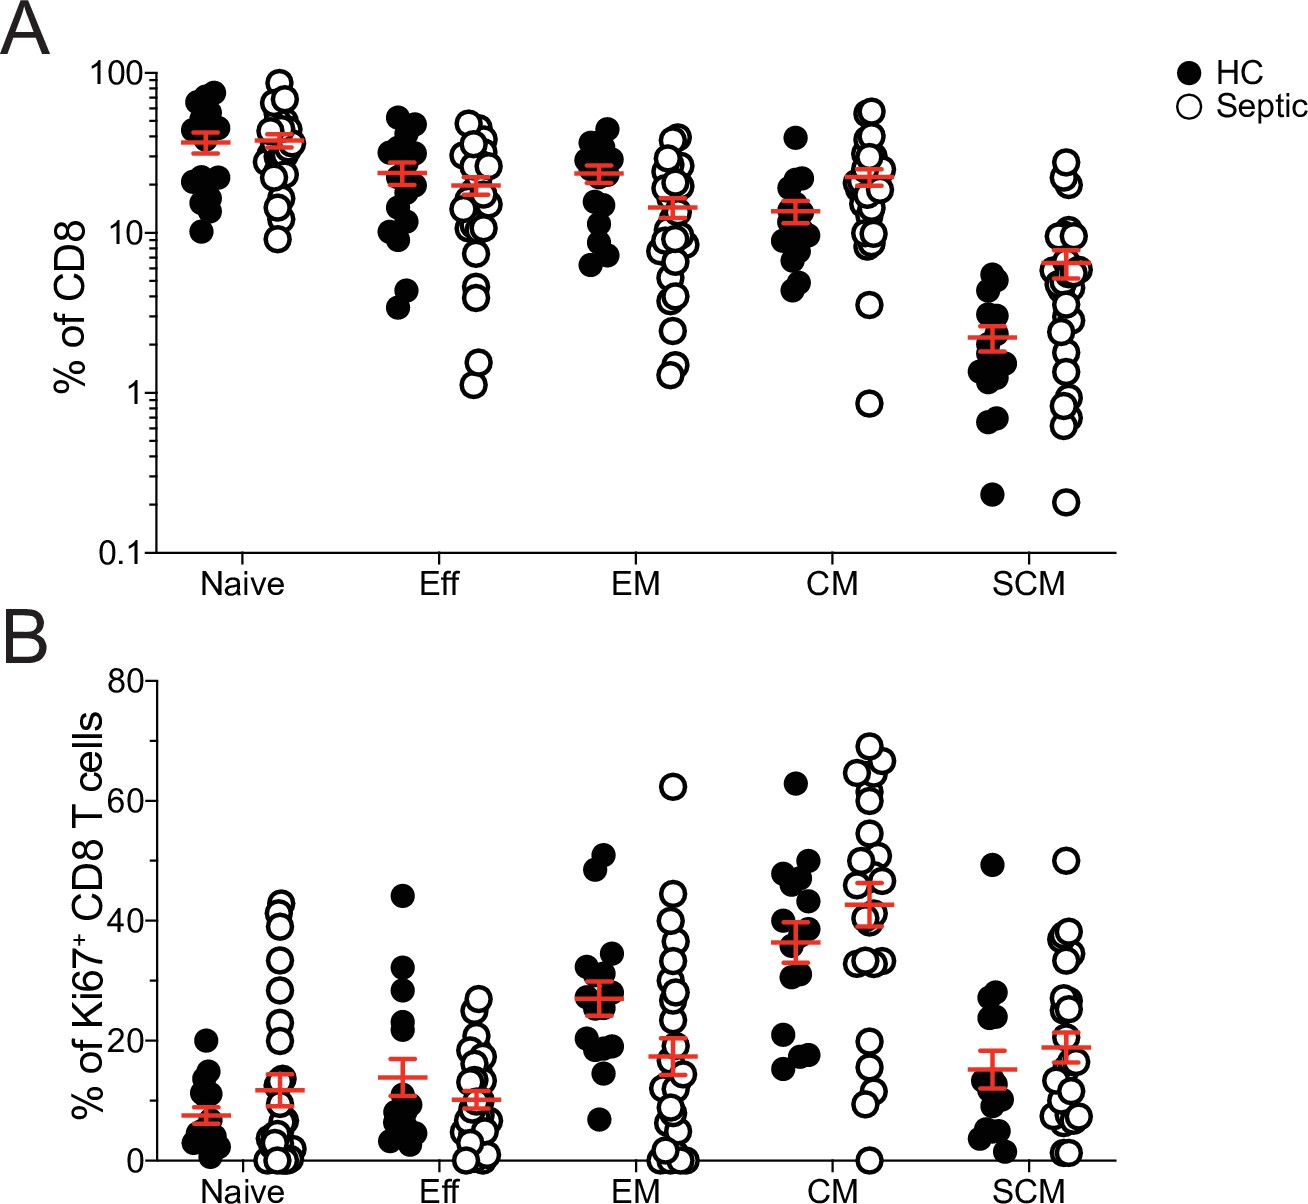
Composition of total and proliferating CD8 T cells in healthy controls and septic hosts.
(A) Frequency of Naïve, Effector (TEff), Effector Memory (TEM), Central Memory (TCM), and Stem Cell Memory (TSCM) among CD8 T cells. (B) Frequency of Ki67-expressing cells among Naïve, Effector (TEff), Effector Memory (TEM), Central Memory (TCM), and Stem Cell Memory (TSCM) CD8 T cells. Data are representative of two independent experiments with 16–27 patients per group. Error bars in represent standard error of the mean.
-
Figure 1—figure supplement 1—source data 1
Source data for Figure 1—figure supplement 1.
- https://cdn.elifesciences.org/articles/70989/elife-70989-fig1-figsupp1-data1-v2.xlsx
Figure 2
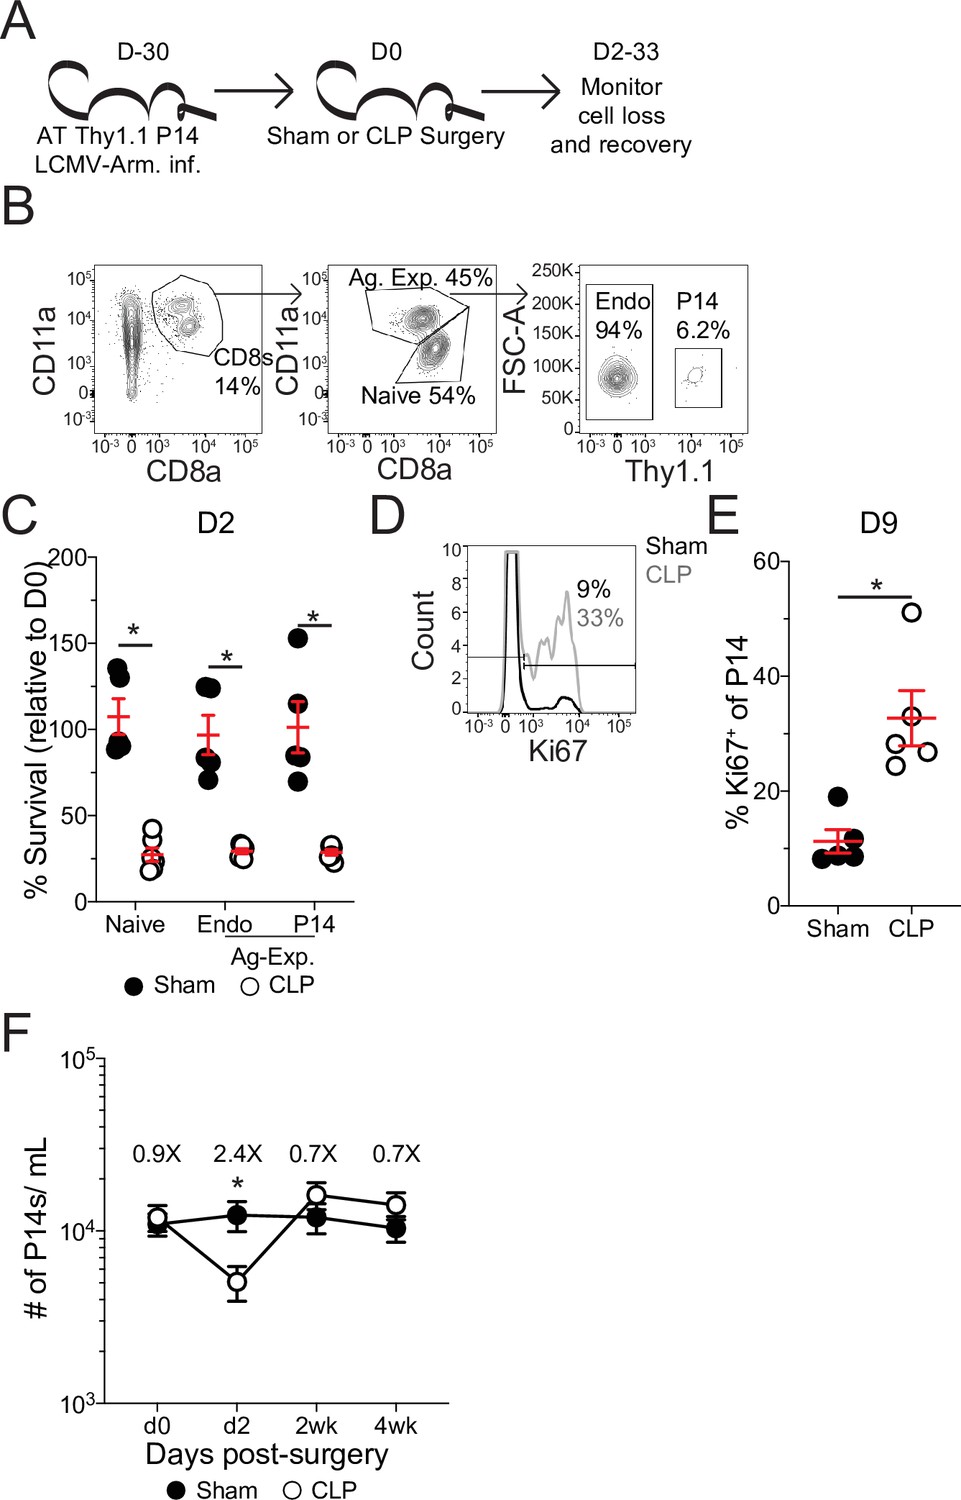
Pre-existing memory CD8 T cells numerically recover with time after sepsis.
(A) Experimental Design: Antigen-experienced P14 chimeric mice were generated by adoptive transfer of 5 × 10³ naïve Thy1.1+ TCR-transgenic P14 CD8 T cells to Thy1.2+ C57Bl/6 mice that were subsequently infected with LCMV-Armstrong (LCMV-Arm). Mice underwent Sham or CLP surgery 30 days after infection. The number of endogenous naïve, endogenous antigen-experienced, and antigen-experienced P14 CD8 T cells was monitored in the blood. (B) Representative gating for endogenous naïve, endogenous antigen-experienced, and antigen-experienced P14 CD8 T cells. (C) Percent survival of endogenous naïve, endogenous antigen-experienced, and antigen-experienced P14 CD8 T cells in the blood 2 days after either Sham or CLP surgery, relative to a pre-surgery bleed. (D) Representative gating of Ki67 on P14 CD8 T cells. (E) Frequency of Ki67-expressing P14 CD8 T cells in the blood of Sham and CLP hosts 9 days post-surgery. (F) The number of P14 CD8 T cells per mL of blood in Sham and CLP hosts prior to (d0), or 2 days (d2), 2 weeks (2 wk), and 4 weeks (4 wk) after surgery. Values above the bars indicate the fold difference (Sham/CLP) in the number of P14 CD8 T cells. (C–E) Are representative of 3 independent experiments with 5–6 mice per group. (F) Is cumulative from two independent experiments with 10–12 mice per group. *=p < 0.05. Error bars represent standard error of the mean.
-
Figure 2—source data 1
Source data for Figure 2C.
- https://cdn.elifesciences.org/articles/70989/elife-70989-fig2-data1-v2.xlsx
-
Figure 2—source data 2
Source data for Figure 2E.
- https://cdn.elifesciences.org/articles/70989/elife-70989-fig2-data2-v2.xlsx
-
Figure 2—source data 3
Source data for Figure 2F.
- https://cdn.elifesciences.org/articles/70989/elife-70989-fig2-data3-v2.xlsx
Figure 3
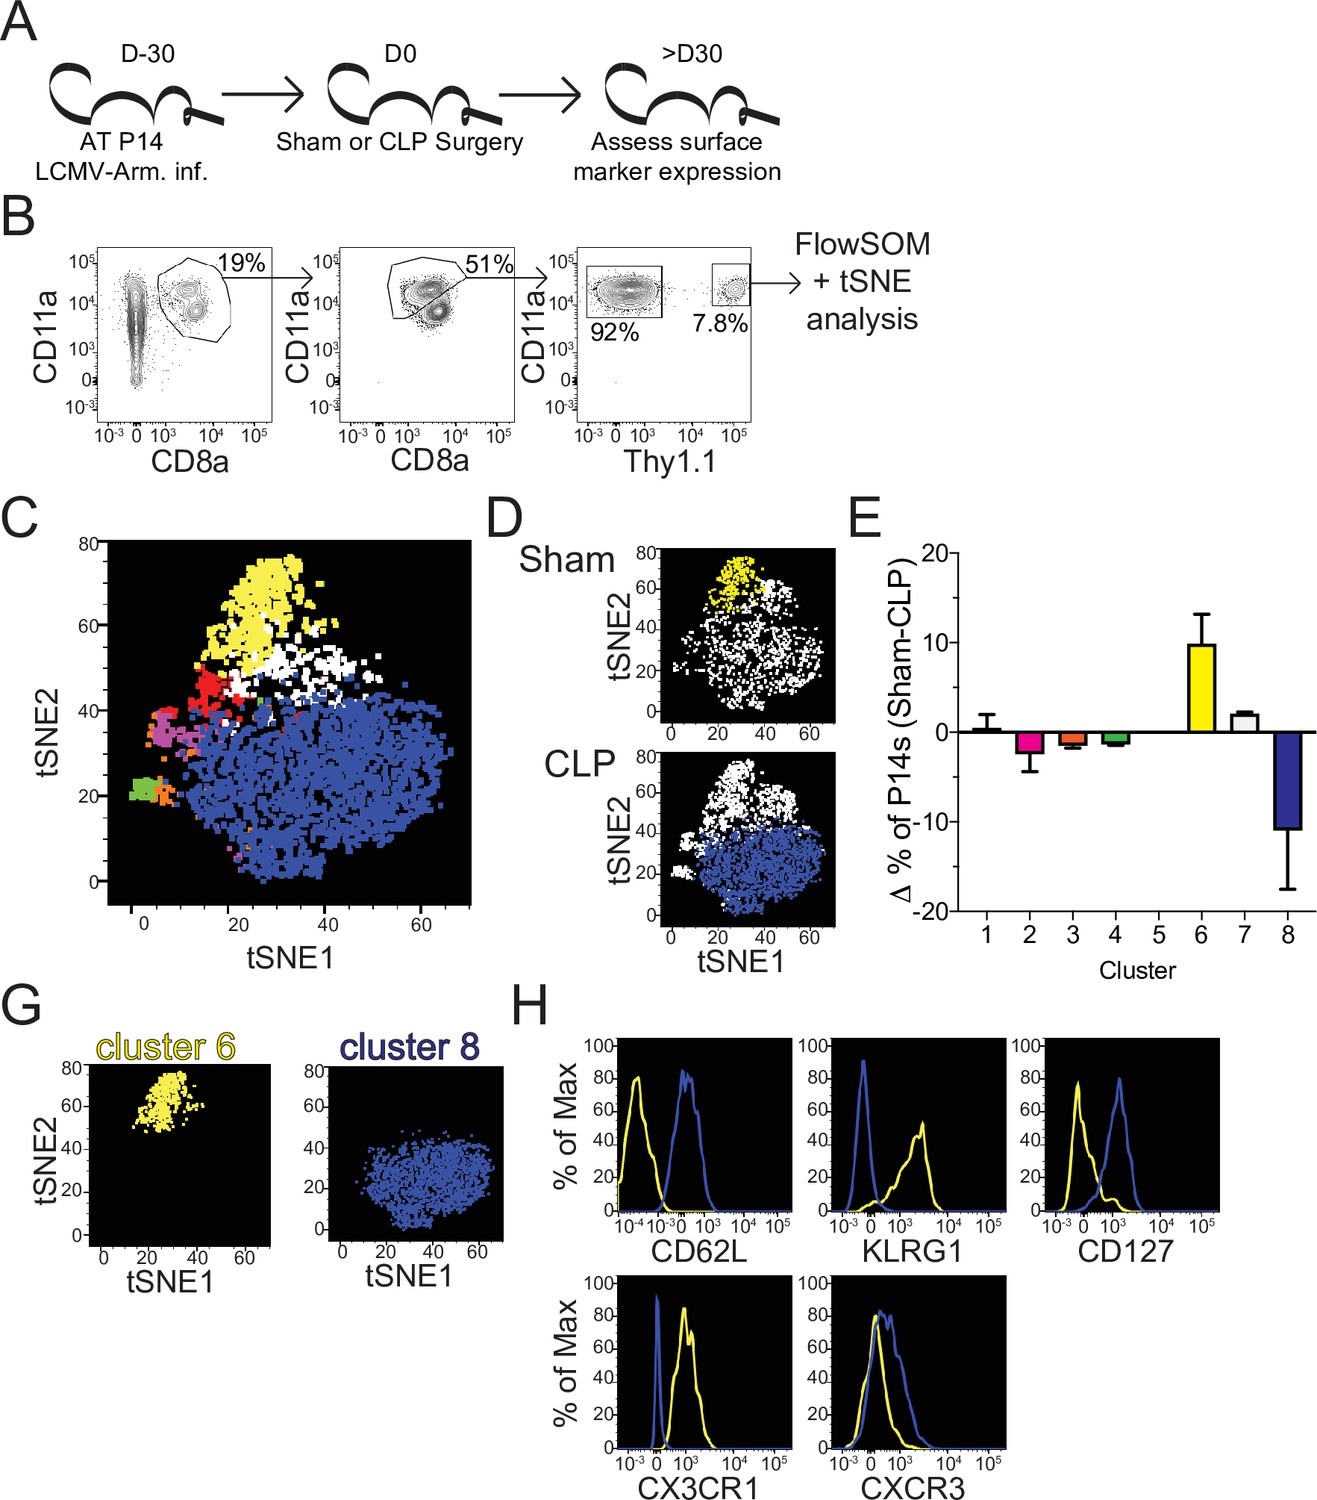
Sepsis alters the phenotypic composition of pre-existing memory CD8 T cells.
(A) Experimental Design: Antigen-experienced P14 chimeric mice were generated by adoptive transfer of 5 × 10³ naive Thy1.1+ TCR-transgenic P14 CD8 T cells to Thy1.2+ CD57Bl/6 mice that were subsequently infected with LCMV-Armstrong (LCMV-Arm). Mice underwent Sham or CLP surgery 30 days after infection. Phenotypic marker expression on P14 CD8 T cells was then assessed 30 days after surgery. (B) Representative antigen-experienced P14 CD8 T cells used in FlowSOM and tSNE analyses. (C) tSNE displaying FlowSOM defined clusters among P14 CD8 T cells based on surface marker expression of CD8a, CD11a, Thy1.1, CD62L, KLRG1, CD127, CX3CR1, CXCR3, CD25, CD27, CD69, CD103, and CD122. (D) Sham and CLP tSNE plots displaying clusters most robustly enriched in corresponding group. (E) Change (Δ) in the frequency of P14 CD8 T cells in each cluster (Sham-CLP); clusters biased toward Sham are >0, clusters biased toward CLP are <0. (G) tSNE plots displaying the clusters 6 (enriched in Sham hosts) and 8 (enriched in CLP hosts). (H) Surface expression of CD62L, KLRG1, CD127, CX3CR1, and CXCR3 comparing clusters 6 and 8. Data are representative of two independent experiments with 2–3 mice per group. Error bars indicate standard error of the mean.
-
Figure 3—source data 1
Source data for Figure 3.
- https://cdn.elifesciences.org/articles/70989/elife-70989-fig3-data1-v2.xlsx
Figure 4
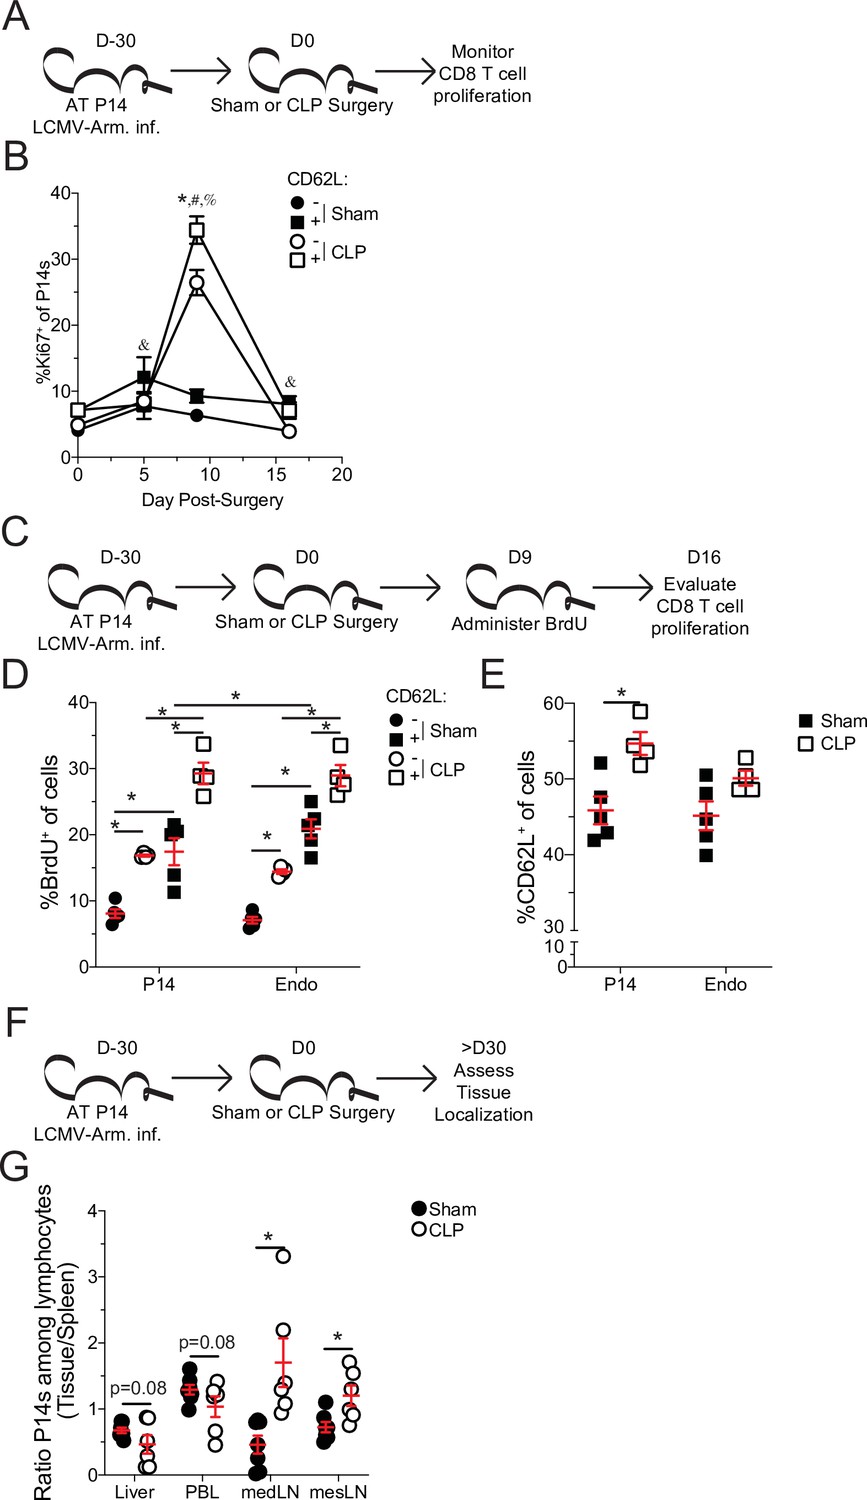
Central memory CD8 T cells more robustly proliferate after sepsis.
(A) Experimental Design: Antigen-experienced P14 chimeric mice were generated by adoptive transfer of 5 × 10³ naive Thy1.1+ TCR-transgenic P14 CD8 T cells to Thy1.2+ C57Bl/6 mice that were subsequently infected with LCMV-Armstrong (LCMV-Arm). Mice underwent Sham or CLP surgery 30 days after infection. The frequency of Ki67 expressing central and effector memory P14 CD8 T cells was monitored in the spleen after surgery. (B) Frequency of Ki67 expressing cells among central (CD62L+) and effector (CD62L-) memory P14 CD8 T cells in Sham and CLP hosts prior to (d0) or 5-, 9-, and 16 days after surgery. *=p < 0.05 CD62L+ v CD62L- CLP P14 CD8 T cells; &=p < 0.05 CD62L+ v CD62L- Sham P14 CD8 T cells; #=p < 0.05 Sham v CLP CD62L+ P14 CD8 T cells; %=p < 0.05 Sham v CLP CD62L- P14 CD8 T cells (C) Experimental Design: Antigen-experienced P14 chimeric mice were generated by adoptive transfer of 5 × 10³ naïve Thy1.1+ TCR-transgenic P14 CD8 T cells to Thy1.2+ C57Bl/6 mice that were subsequently infected with LCMV-Arm. Mice underwent Sham or CLP surgery 30 days after infection followed by BrdU administration 9 days later. BrdU incorporation by central and effector memory endogenous and P14 CD8 T cells was assessed 7 days later. (D) Frequency of CD62L+ and CD62L- memory P14 CD8 T cells and endogenous CD8 T cells that have incorporated BrdU. (E) Frequency of CD62L+ P14 CD8 T cells and endogenous CD8 T cells 16 days after surgery. (F) Experimental Design: Antigen-experienced P14 chimeric mice were generated by adoptive transfer of 5 × 10³ naive Thy1.1+ TCR-transgenic P14CD8 T cells to Thy1.2+ C57Bl/6 mice that were subsequently infected with LCMV-Arm. Mice underwent Sham or CLP surgery 30 days after infection. The frequency of P14 CD8 T cells among lymphocytes in the spleen, liver, PBL, mediastinal lymph node (medLN), and mesenteric lymph node (mesLN) was then determined 30 days after surgery. Preferential localization was determined by the ratio of P14 CD8 T cells in the tissues compared relative to the spleen. (G) Ratio of the frequency of P14 CD8 T cells among lymphocytes in the liver, PBL, medLN, and mesLN relative to the spleen. All data are representative of at least two independent experiments with 4–8 mice per group. *=p < 0.05. Error bars represent standard error of the mean.
-
Figure 4—source data 1
Source data for Figure 4B.
- https://cdn.elifesciences.org/articles/70989/elife-70989-fig4-data1-v2.xlsx
-
Figure 4—source data 2
Source data for Figure 4D and E.
- https://cdn.elifesciences.org/articles/70989/elife-70989-fig4-data2-v2.xlsx
-
Figure 4—source data 3
Source data for Figure 4G.
- https://cdn.elifesciences.org/articles/70989/elife-70989-fig4-data3-v2.xlsx
Figure 5
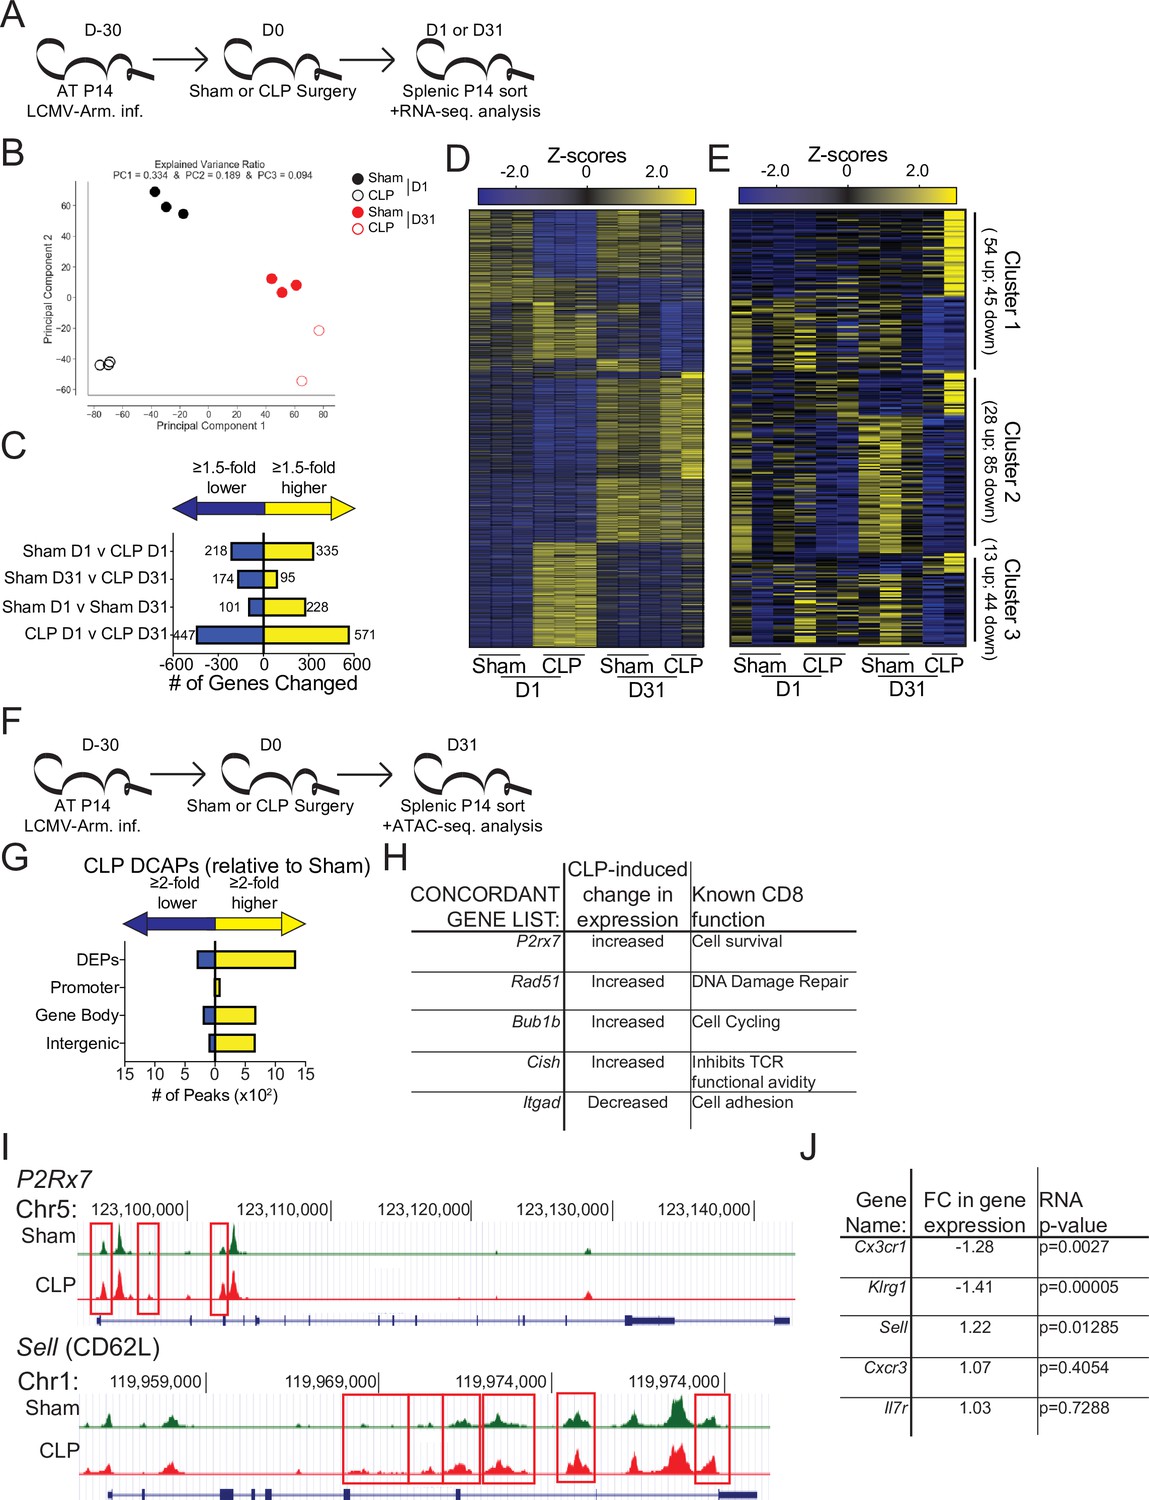
Sepsis alters the gene expression and chromatin accessibility of pre-existing memory CD8 T cells.
(A) Experimental Design: Antigen-experienced P14 chimeric mice were generated by adoptive transfer of 5 × 10³ naive Thy1.1+ TCR-transgenic P14 CD8 T cells to Thy1.2+ C57Bl/6 mice that were subsequently infected with LCMV-Arm. Mice underwent Sham or CLP surgery 30 days after infection. Splenic P14 CD8 T cells were FACS-sorted one or 31 after surgery for RNA extraction. P14 CD8 T cells were isolated from 3 D1-Sham hosts, 3 D1-CLP hosts, 3 D31-Sham hosts, and 2 D31-CLP hosts. (B) Principal Component analysis of P14 CD8 T cells from Sham and CLP hosts either 1- or 31 days post-surgery. (C) Number of statistically significant gene changes as a result of indicated comparisons. (D) Gene expression heatmap of genes with statistically significant changes (fold change >1.5, p < 0.05) as a result of any comparison. (E) Gene expression heatmap of genes with statistically significant changes (fold change >1.5, p < 0.05) between D31 Sham and CLP P14 CD8 T cells. Clusters were consecutively defined by similar expressional changes in: D1 to D31 Sham P14 CD8 T cells and D31 Sham to CLP P14 CD8 T cells [Cluster 1], D1 Sham to CLP P14 CD8 T cells and D31 Sham to CLP P14 CD8 T cells [Cluster 2], and non-defined by prior categorization [Cluster 3] (F) Experimental Design: Antigen-experienced P14 chimeric mice were generated by adoptive transfer of 5 × 10³ naive Thy1.1+ TCR-transgenic P14 CD8 T cells to Thy1.2+ C57Bl/6 mice that were subsequently infected with LCMV-Arm. Mice underwent Sham or CLP surgery 30 days after infection. Splenic P14 CD8 T cells were FACS-sorted 31 days after surgery for assessment of chromatin accessibility. P14 CD8 T cells were isolated from 2 D31-Sham hosts and 3 D31-CLP hosts. (G) Total number of differential chromatin accessibility peaks (DCAPs, fold change >2 p < 0.05) and delineation of those within either a promoter, gene body, or intergenic regions assigned to the most proximal to a transcription start site. (H) List of genes whose change in transcript is concordant with changes in chromatin accessibility along with the relative change and known function in CD8 T cells. (I) Example of differentially expressed peaks (indicated by the red box) within the P2R×7 and Sell gene loci from representative Sham and CLP P14s. (J) List of genes whose expression defined the phenotypically distinct populations between Sham and CLP P14 CD8 T cells in Figure 3 alongside their fold change in transcript and the p-value associated with that fold-change.
-
Figure 5—source data 1
Source data for Figure 5C and D.
- https://cdn.elifesciences.org/articles/70989/elife-70989-fig5-data1-v2.xlsx
-
Figure 5—source data 2
Source data for Figure 5E.
- https://cdn.elifesciences.org/articles/70989/elife-70989-fig5-data2-v2.xlsx
Figure 6 with 1 supplement
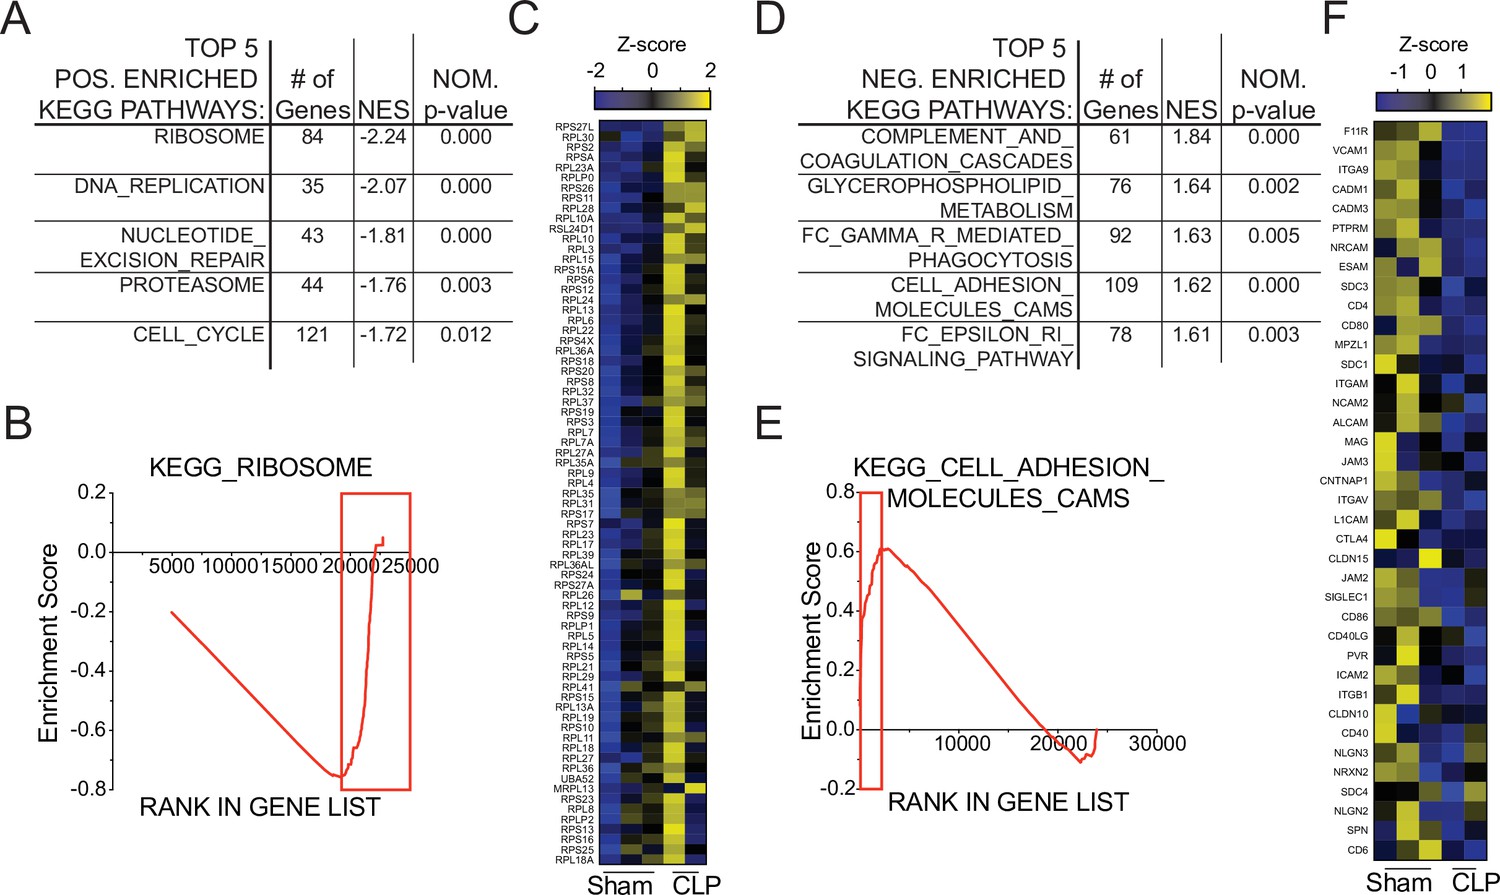
Gene set enrichment analysis (GSEA) reveals long-term sepsis-induced differences in molecular pathways of pre-existing memory CD8 T cells.
Top 5 KEGG pathways positively- (A) and negatively- (D) enriched in CLP hosts. Enrichment scores for Ribosomal- (B) and Adhesion- (E) associated genes. Red box indicates leading edge of enriched region; genes enriched in CLP - box to right, genes enriched in Sham – box to left. Gene expression heatmap of core enriched genes for Ribosomal (C) and Adhesion (F) associated genes.
-
Figure 6—source data 1
Source data for Figure 6.
- https://cdn.elifesciences.org/articles/70989/elife-70989-fig6-data1-v2.xlsx
Figure 6—figure supplement 1
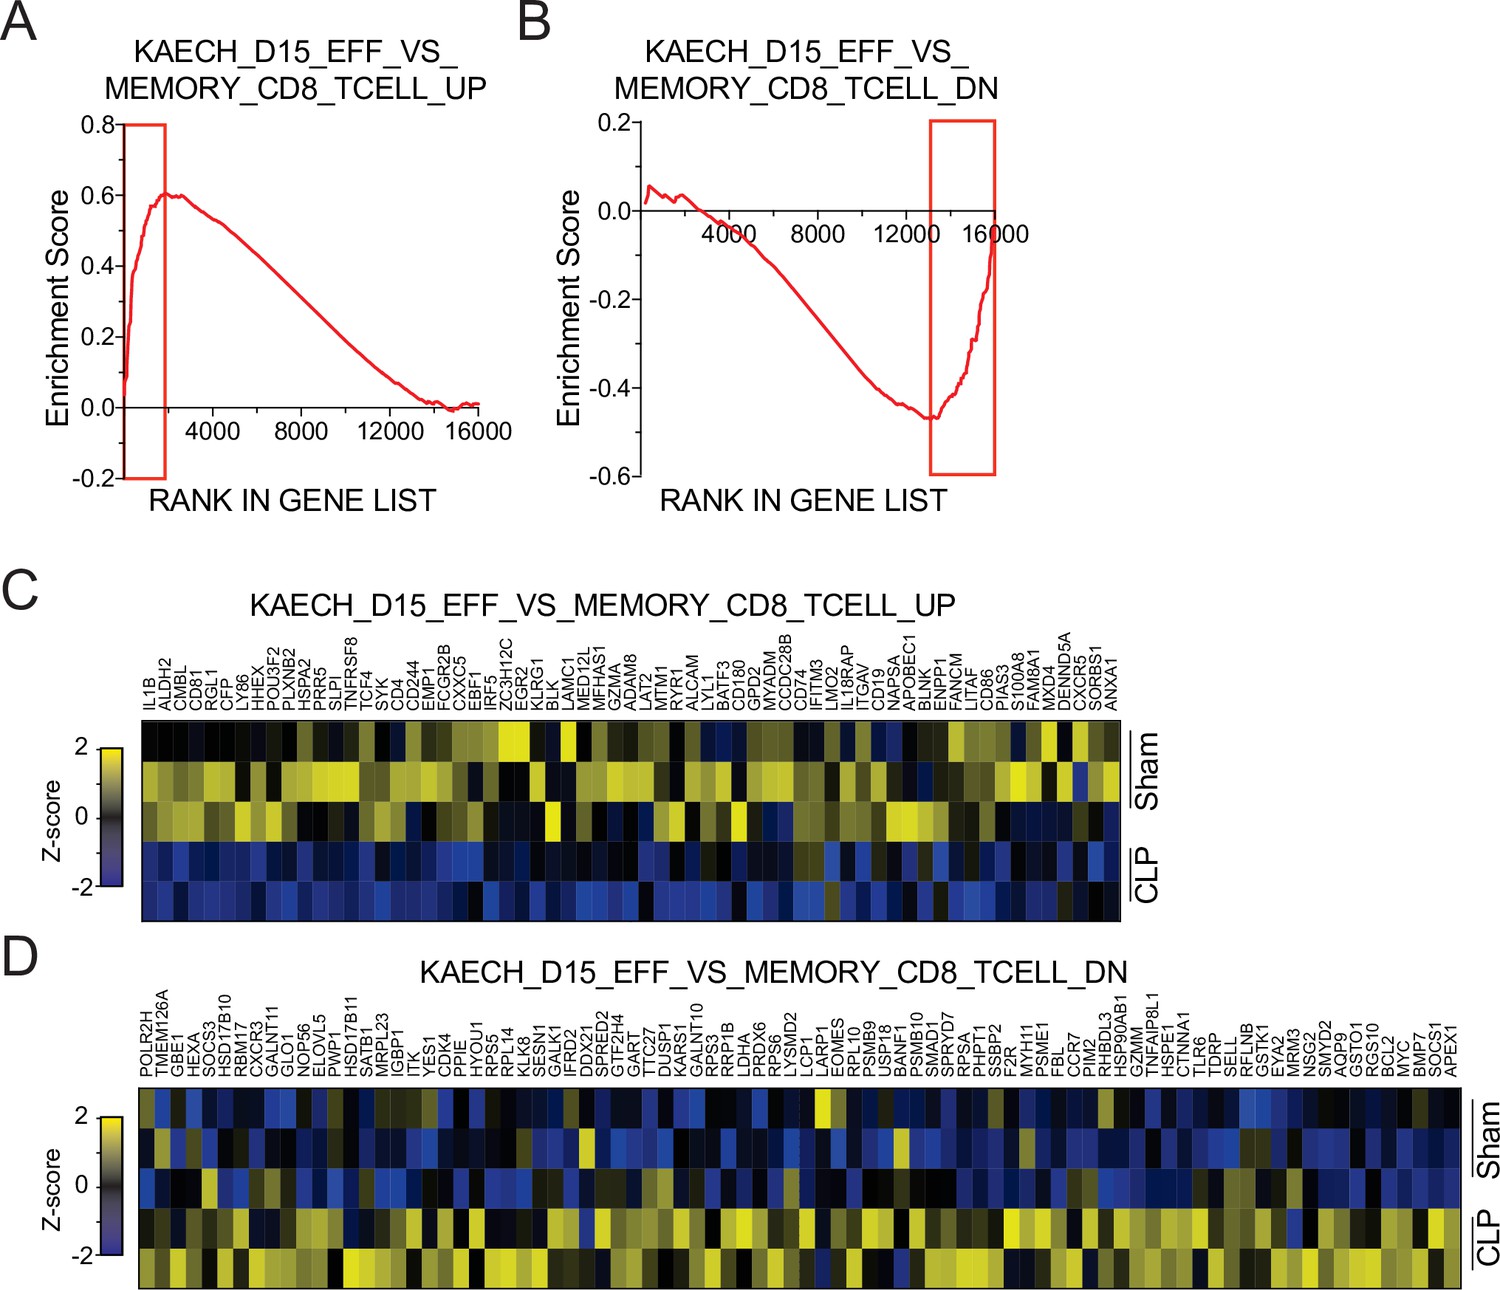
Gene set enrichment analysis (GSEA) reinforces that sepsis promotes a shift to TCM at transcriptional level.
The KAECH_DAY15_EFF_VS_MEMORY_CD8_TCELL was used for evaluation. KAECH_DAY15_EFF_VS_MEMORY_CD8_TCELL _UP represents genes enriched in effector CD8 T cells relative to memory CD8 T cells. KAECH_DAY15_EFF_VS_MEMORY_CD8_TCELL _DN represents genes enriched in memory CD8 T cells relative to efector CD8 T cells. Enrichment scores for KAECH_DAY15_EFF_VS_MEMORY_CD8_TCELL _UP- (A) and KAECH_DAY15_EFF_VS_MEMORY_CD8_TCELL _DN- (C) associated genes. Red box indicates leading edge of enriched region; genes enriched in CLP - box to right, genes enriched in Sham – box to left. Gene expression heatmap of core enriched genes for Ribosomal (B) and Adhesion (D) associated genes.
-
Figure 6—figure supplement 1—source data 1
Source data for Figure 6—figure supplement 1A-D.
- https://cdn.elifesciences.org/articles/70989/elife-70989-fig6-figsupp1-data1-v2.xlsx
Figure 7 with 2 supplements

Sepsis leads to lasting changes in pre-existing memory CD8 T cell function and Listeria control.
(A) Experimental Design: Antigen-experienced P14 chimeric mice were generated by adoptive transfer of 5 × 10³ naive Thy1.1+ TCR-transgenic P14 CD8 T cells to Thy1.2+ C57Bl/6 mice that were subsequently infected with LCMV-Arm. Mice underwent Sham or CLP surgery 30 days after infection. Splenocytes from Sham and CLP mice were isolated 30 days after surgery and disparately labeled with CFSE, mixed, and then placed in media alone (i.e. unstimulated) or stimulated GP33 peptide. Representative profiles (B) and quantification of the frequency of IFNγ- (C) and IL-2- (D) producing P14s stimulated with either media control or GP33. Data are representative of two independent experiments with 5 mice per group. (E) Experimental Design: Antigen-experienced P14 chimeric mice were generated by adoptive transfer of 5 × 10³ naive Thy1.1+ TCR-transgenic P14 CD8 T cells to Thy1.2+ C57Bl/6 mice that were subsequently infected with LCMV-Arm. Mice underwent Sham or CLP surgery 30 days after infection. Splenic P14 CD8 T cells were enriched from Sham and CLP mice 30 days after surgery and then transferred into naïve mice. Mice that received either Sham or CLP P14 CD8 T cells, or did not receive any cell transfer (i.e. naïve) were then infected with 105 CFU of Listeria monocytogenes expressing GP33 (L.m.-GP33) 1 day later. CFU of L.m.-GP33 per gram of liver (F) and spleen (G) was assessed 5 days after infection. Data are cumulative of two independent experiments with 5–9 mice per group. *=p < 0.05. Error bars indicate standard error of the mean.
-
Figure 7—source data 1
Source data for Figure 7C and D.
- https://cdn.elifesciences.org/articles/70989/elife-70989-fig7-data1-v2.xlsx
-
Figure 7—source data 2
Source data for Figure 7F and G.
- https://cdn.elifesciences.org/articles/70989/elife-70989-fig7-data2-v2.xlsx
Figure 7—figure supplement 1
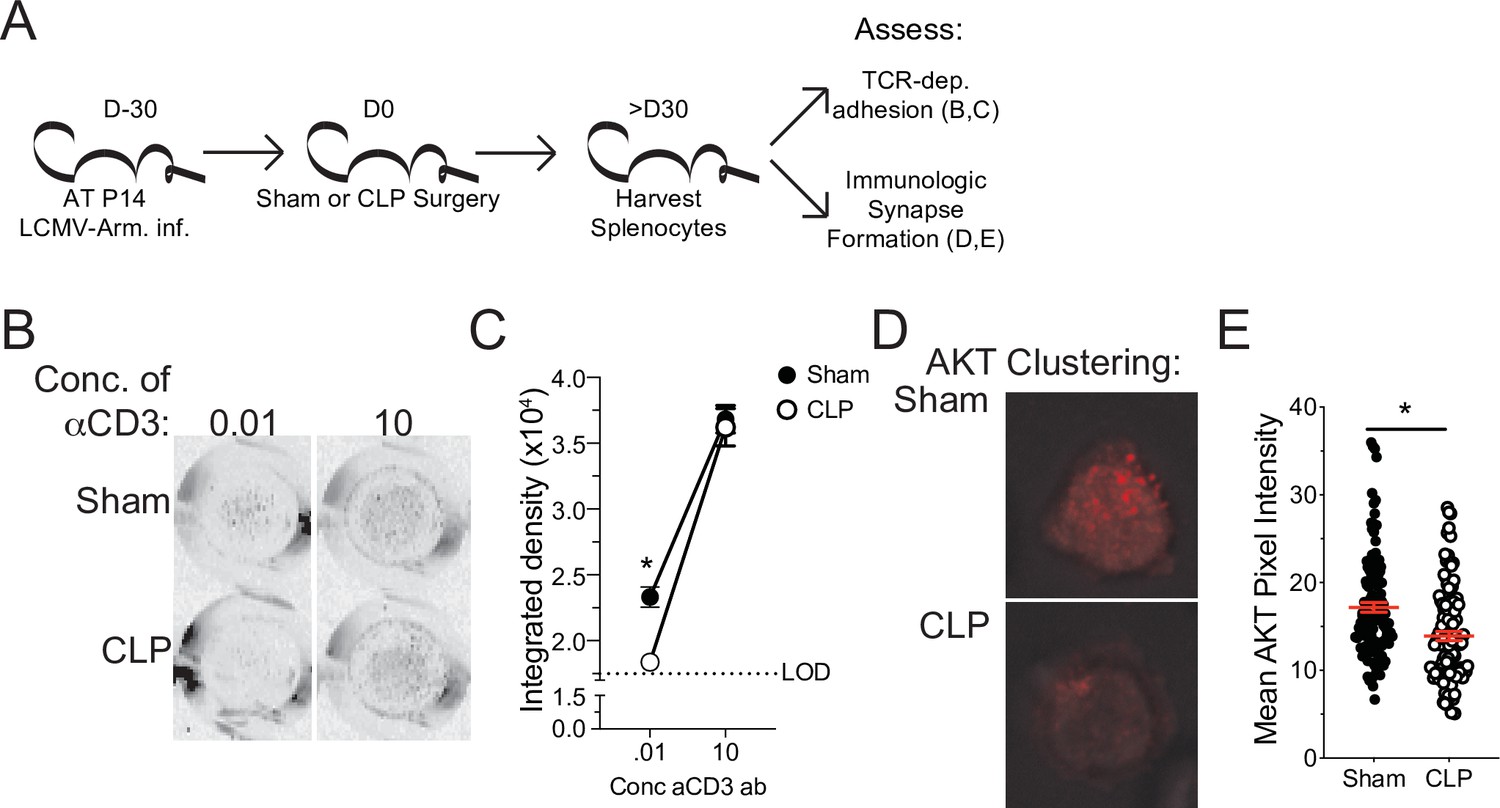
Sepsis leads to lasting deficit in pre-existing memory CD8 T cell TCR-dependent adhesion and immunologic synapse formation.
(A) Experimental design: Antigen-experienced P14 chimeric mice were generated by adoptive transfer of 5 × 10³ naive Thy1.1+ TCR-transgenic P14 CD8 T cells to Thy1.2+ C57Bl/6 mice that were subsequently infected with LCMV-Arm. Mice underwent Sham or CLP surgery 30 days after infection. Splenic P14 CD8 T cells were enriched 30 days after surgery and evaluated for TCR-dependent adherence or AKT clustering, as an indicator of immunologic synapse formation. (B) Representative images of P14 CD8 T cell adherence to αCD3 mAb-coated plates. (C) Quantification of Sham and CLP P14 CD8 T cell adherence to plates at indicated concentration of αCD3 mAb. LOD is defined by adherence to wells lacking αCD3 mAb. (D) Representative images of AKT staining by TIRF microscopy. (E) Mean AKT pixel intensity of adhered cells. Data are of a single experiment with (B, C) 3–4 mice per group or (C, D) 109–120 cells analyzed per group. *=p < 0.05. Error bars indicate standard error of the mean.
-
Figure 7—figure supplement 1—source data 1
Source data for Figure 7—figure supplement 1c.
- https://cdn.elifesciences.org/articles/70989/elife-70989-fig7-figsupp1-data1-v2.xlsx
-
Figure 7—figure supplement 1—source data 2
Source data for Figure 7—figure supplement 1e.
- https://cdn.elifesciences.org/articles/70989/elife-70989-fig7-figsupp1-data2-v2.xlsx
Figure 7—figure supplement 2
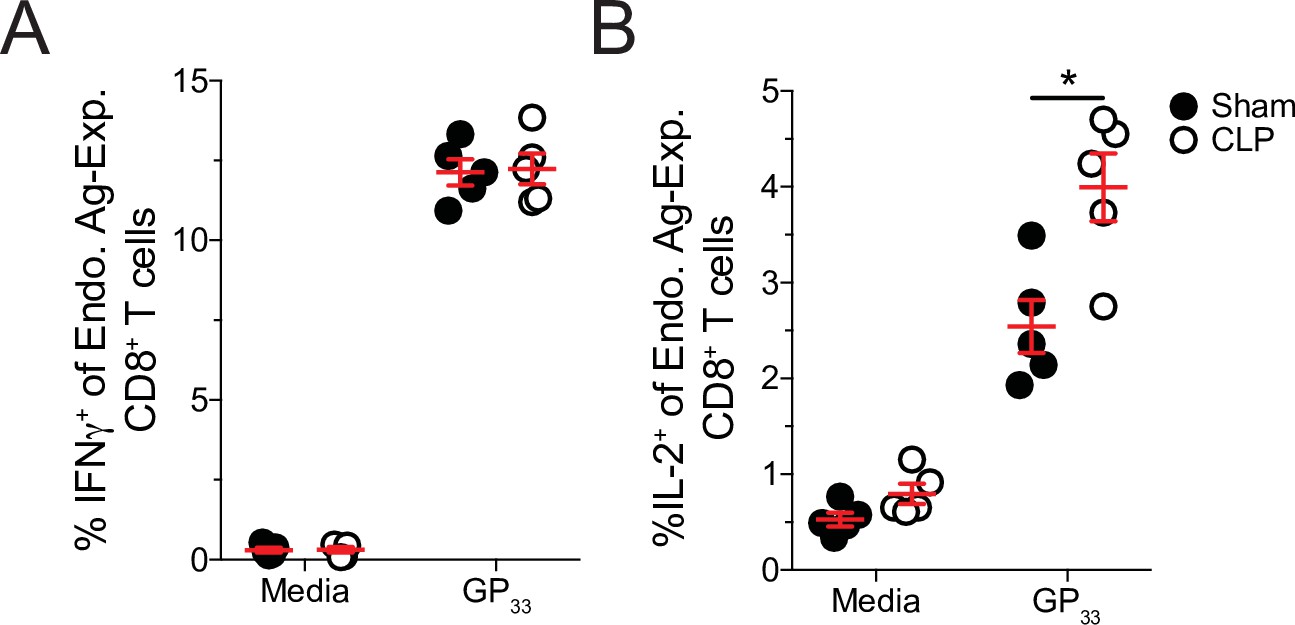
Sepsis leads to lasting changes in pre-existing polyclonal memory CD8 T cell function.
Antigen-experienced P14 chimeric mice were generated by adoptive transfer of 5 × 10³ naive Thy1.1+ TCR-transgenic P14 CD8 T cells to Thy1.2+ C57Bl/6 mice that were subsequently infected with LCMV-Arm. Mice underwent Sham or CLP surgery 30 days after infection. Splenocytes from Sham and CLP mice were isolated 30 days after surgery and disparately labeled with CFSE, mixed, and then placed in media alone (i.e. unstimulated) or stimulated GP33 peptide. Quantification of the frequency of IFNγ- (A) and IL-2- (B) producing P14s stimulated with either media control or GP33. Data are representative of two independent experiments with 5 mice per group.
-
Figure 7—figure supplement 2—source data 1
Source data for Figure 7—figure supplement 1.
- https://cdn.elifesciences.org/articles/70989/elife-70989-fig7-figsupp2-data1-v2.xlsx
Tables
Table 1
Patient demographics.
| Patients | Septic (n = 27) | Control (n = 16) | p-value |
|---|---|---|---|
| Age (mean ± SD) | 59.3±16.3 | 51.6±13.2 | ns |
| Male (%) | 40.7% | 37.5% | ns |
| Caucasian (%) | 100% | 81.3% | 0.0454 |
| APACHE II Score (mean ± SD) | 11.1±5.9 | ||
| SOFA Score (mean ± SD) | 4.6±4.3 | ||
| % in Septic Shock | 55.6% | ||
| Time Post-Admission (hrs) | 6.1±5.6 |
Table 2
Gene clusters.
| gene_id | Relative FC D32 sham vs CLP | p_value_ | Cluster # |
|---|---|---|---|
| Cdc6 | 4.03064298 | 0.00005 | Cluster 1 |
| Tppp3 | 4.88825654 | 0.00005 | Cluster 1 |
| Neil3 | 3.66496647 | 0.00005 | Cluster 1 |
| Hist1h1e | 3.76231332 | 0.00005 | Cluster 1 |
| Mcm10 | 3.47460746 | 0.00005 | Cluster 1 |
| Ttc8 | 3.38918878 | 0.00005 | Cluster 1 |
| Stmn1 | 2.06406728 | 0.0508 | Cluster 1 |
| Gpr34 | 3.41697573 | 0.00005 | Cluster 1 |
| Ppp2r2c | 1.83454208 | 0.0437 | Cluster 1 |
| Kntc1 | 2.99415727 | 0.00005 | Cluster 1 |
| Bfsp1 | 1.60516322 | 0.03045 | Cluster 1 |
| Birc5 | 2.8137029 | 0.00005 | Cluster 1 |
| Ccdc136 | 2.28917856 | 0.0344 | Cluster 1 |
| Gm5124 | 1.60472157 | 0.03095 | Cluster 1 |
| Ccnb2 | 2.49461988 | 0.00005 | Cluster 1 |
| Apol7b | 2.6692603 | 0.00005 | Cluster 1 |
| Tktl1 | 1.9334132 | 0.02895 | Cluster 1 |
| Dtl | 2.59828557 | 0.00005 | Cluster 1 |
| Pask | 2.7640812 | 0.00005 | Cluster 1 |
| Crip2 | 2.52029044 | 0.0004 | Cluster 1 |
| Clspn | 2.45116907 | 0.00015 | Cluster 1 |
| Mki67 | 2.61164716 | 0.00005 | Cluster 1 |
| Fam64a | 2.65731637 | 0.0006 | Cluster 1 |
| 2810408I11Rik | 1.5215239 | 0.06725 | Cluster 1 |
| Rad51ap1 | 1.63064417 | 0.00235 | Cluster 1 |
| Tnfsf4 | 2.37518519 | 0.0009 | Cluster 1 |
| E2f1 | 2.34354094 | 0.031 | Cluster 1 |
| Cep55 | 2.4930123 | 0.0004 | Cluster 1 |
| Morn3 | 2.12074329 | 0.00035 | Cluster 1 |
| Aurkb | 2.4030389 | 0.00005 | Cluster 1 |
| Hist2h2bb | 2.02820011 | 0.0464 | Cluster 1 |
| Exo1 | 2.36813282 | 0.00005 | Cluster 1 |
| Fcrlb | 1.52457593 | 0.04225 | Cluster 1 |
| Tmem176a | 1.59714799 | 0.0361 | Cluster 1 |
| Socs2 | 2.02128114 | 0.00155 | Cluster 1 |
| Ncapg2 | 1.97320931 | 0.00745 | Cluster 1 |
| Klra9 | 2.11296665 | 0.00005 | Cluster 1 |
| Chek1 | 1.59507471 | 0.05475 | Cluster 1 |
| Rad51 | 1.58587164 | 0.00005 | Cluster 1 |
| Dscc1 | 1.74867599 | 0.00015 | Cluster 1 |
| Bzrap1 | 1.61419626 | 0.00005 | Cluster 1 |
| Cd300e | 1.519849 | 0.07755 | Cluster 1 |
| Gm1720 | 1.94574412 | 0.0019 | Cluster 1 |
| Brca1 | 1.5604888 | 0.05435 | Cluster 1 |
| Gm14124 | 1.64708499 | 0.03685 | Cluster 1 |
| Shcbp1 | 1.79205262 | 0.00005 | Cluster 1 |
| Nebl | 1.8053468 | 0.04325 | Cluster 1 |
| Ckap2l | 1.73019782 | 0.0003 | Cluster 1 |
| Cdkn2a | 1.82961741 | 0.00085 | Cluster 1 |
| Phlda3 | 1.63185741 | 0.03825 | Cluster 1 |
| Adgre4 | 1.57646266 | 0.00005 | Cluster 1 |
| Klri2 | 1.56007674 | 0.0011 | Cluster 1 |
| Mmp25 | 1.54571785 | 0.04745 | Cluster 1 |
| Nenf | 1.5307705 | 0.0182 | Cluster 1 |
| Igf1 | –1.524316 | 0.01 | Cluster 1 |
| Rac3 | –1.5034855 | 0.07065 | Cluster 1 |
| Trf | –1.6496992 | 0.00015 | Cluster 1 |
| Chaf1a | –1.6002474 | 0.0011 | Cluster 1 |
| Orc1 | –1.6245667 | 0.04185 | Cluster 1 |
| Fignl1 | –1.7257028 | 0.0216 | Cluster 1 |
| D430020J02Rik | –1.6263897 | 0.0051 | Cluster 1 |
| Cenph | –1.8078839 | 0.0047 | Cluster 1 |
| Blvrb | –1.8434164 | 0.0457 | Cluster 1 |
| Cpne7 | –1.5149666 | 0.02655 | Cluster 1 |
| Psrc1 | –1.7535019 | 0.00145 | Cluster 1 |
| Uhrf1 | –1.5739852 | 0.0013 | Cluster 1 |
| Plbd1 | –1.7851892 | 0.0021 | Cluster 1 |
| Rgs12 | –1.8455643 | 0.01885 | Cluster 1 |
| Hpgd | –1.8522078 | 0.06025 | Cluster 1 |
| P2r×7 | –2.0648257 | 0.01595 | Cluster 1 |
| Bub1b | –2.2247142 | 0.0223 | Cluster 1 |
| 4833418N02Rik | –2.3048295 | 0.011 | Cluster 1 |
| Ube2c | –1.621509 | 0.0124 | Cluster 1 |
| Cadm1 | –2.3409109 | 0.00015 | Cluster 1 |
| Tyrobp | –2.4355709 | 0.00335 | Cluster 1 |
| Jup | –2.4842838 | 0.0023 | Cluster 1 |
| Pyroxd2 | –2.2264265 | 0.0282 | Cluster 1 |
| Gins1 | –1.8339216 | 0.00005 | Cluster 1 |
| Gm4013 | –2.7505116 | 0.01255 | Cluster 1 |
| Axl | –2.6625156 | 0.00005 | Cluster 1 |
| Nr6a1 | –2.729109 | 0.00125 | Cluster 1 |
| Hspa2 | –2.796573 | 0.00005 | Cluster 1 |
| Spry2 | –2.7405966 | 0.00005 | Cluster 1 |
| Mpeg1 | –2.8281527 | 0.00005 | Cluster 1 |
| Ticrr | –2.9418017 | 0.00005 | Cluster 1 |
| Plxdc1 | –2.9468017 | 0.00005 | Cluster 1 |
| Ly86 | –3.2898687 | 0.0019 | Cluster 1 |
| Cd302 | –3.3417875 | 0.00005 | Cluster 1 |
| C6 | –3.3367417 | 0.0003 | Cluster 1 |
| Slc37a2 | –3.3489759 | 0.00005 | Cluster 1 |
| Gm2011 | –3.4732831 | 0.00005 | Cluster 1 |
| H2-T3 | –2.0828371 | 0.00935 | Cluster 1 |
| Wnt2b | –3.5079301 | 0.0004 | Cluster 1 |
| Clec12a | –3.0562022 | 0.00895 | Cluster 1 |
| Mmp17 | –4.1251312 | 0.00005 | Cluster 1 |
| Ncaph | –4.1603359 | 0.0417 | Cluster 1 |
| Kcnj10 | –4.2878368 | 0.00005 | Cluster 1 |
| Cd163 | –4.2866184 | 0.0001 | Cluster 1 |
| Il11 | –5.666901 | 0.0001 | Cluster 1 |
| Syk | 4.80557812 | 0.0603 | Cluster 2 |
| 9030619P08Rik | 2.73623094 | 0.0353 | Cluster 2 |
| Prss16 | 2.57604894 | 0.00005 | Cluster 2 |
| Tcf4 | 2.52783097 | 0.0069 | Cluster 2 |
| Itgad | 2.32061951 | 0.00005 | Cluster 2 |
| Abcc3 | 2.47441931 | 0.0143 | Cluster 2 |
| Hfe | 1.91152093 | 0.00065 | Cluster 2 |
| Fcgr3 | 1.94948898 | 0.00005 | Cluster 2 |
| Rab3il1 | 2.00253853 | 0.00255 | Cluster 2 |
| Lrp1 | 2.06172226 | 0.06585 | Cluster 2 |
| Cd5l | 1.6117422 | 0.0645 | Cluster 2 |
| Mir2861 | 1.93355795 | 0.0162 | Cluster 2 |
| Il18 | 1.64165162 | 0.07875 | Cluster 2 |
| Mir155hg | 1.9632828 | 0.0003 | Cluster 2 |
| Irf4 | 1.83011207 | 0.00085 | Cluster 2 |
| Cmklr1 | 1.71253206 | 0.00655 | Cluster 2 |
| Mt3 | 1.61299839 | 0.00005 | Cluster 2 |
| Cd163l1 | 1.68200967 | 0.0028 | Cluster 2 |
| Palm | 1.69858804 | 0.0309 | Cluster 2 |
| Hmox1 | 1.8719138 | 0.0014 | Cluster 2 |
| Mertk | 1.69725108 | 0.05425 | Cluster 2 |
| Esm1 | 1.55538421 | 0.08875 | Cluster 2 |
| Lrrc25 | 1.53588266 | 0.01125 | Cluster 2 |
| Lgmn | 1.53366352 | 0.0421 | Cluster 2 |
| Mafb | 1.59909428 | 0.00005 | Cluster 2 |
| Havcr2 | 1.61859719 | 0.00005 | Cluster 2 |
| Epb4.1l3 | 1.64271249 | 0.0257 | Cluster 2 |
| Siglece | 1.58382507 | 0.0091 | Cluster 2 |
| Prr5 | –1.5418463 | 0.05615 | Cluster 2 |
| Pla2g7 | –1.5675528 | 0.00005 | Cluster 2 |
| Dusp14 | –1.6724627 | 0.02015 | Cluster 2 |
| Tgm2 | –1.6678575 | 0.04595 | Cluster 2 |
| Riiad1 | –1.5429946 | 0.00005 | Cluster 2 |
| Lilrb4a | –1.6883324 | 0.00685 | Cluster 2 |
| Ninj2 | –1.5669531 | 0.08315 | Cluster 2 |
| Cish | –1.6443416 | 0.0508 | Cluster 2 |
| Cenpe | –1.8650444 | 0.07995 | Cluster 2 |
| Cenpm | –1.5922104 | 0.00155 | Cluster 2 |
| Tpx2 | –1.5558403 | 0.05695 | Cluster 2 |
| Oip5 | –1.7861225 | 0.00005 | Cluster 2 |
| Cdca7 | –1.5875434 | 0.04035 | Cluster 2 |
| Ckap2 | –1.6603956 | 0.00425 | Cluster 2 |
| Ncapg | –1.8932803 | 0.019 | Cluster 2 |
| Ssc4d | –1.9973193 | 0.0063 | Cluster 2 |
| Stkld1 | –1.8746276 | 0.04135 | Cluster 2 |
| Cdca8 | –1.6650517 | 0.0087 | Cluster 2 |
| Cdc45 | –1.9715619 | 0.00405 | Cluster 2 |
| Lrp11 | –1.9542283 | 0.0003 | Cluster 2 |
| Mcm5 | –1.965633 | 0.012 | Cluster 2 |
| Cks1b | –2.0197826 | 0.0137 | Cluster 2 |
| Apitd1 | –1.614175 | 0.01045 | Cluster 2 |
| Spc24 | –2.1192151 | 0.00145 | Cluster 2 |
| Serpine2 | –2.0231734 | 0.00005 | Cluster 2 |
| Brip1 | –1.6461742 | 0.092 | Cluster 2 |
| Pole | –2.2240204 | 0.0253 | Cluster 2 |
| Lig1 | –1.7583399 | 0.0015 | Cluster 2 |
| Cenpn | –1.7057202 | 0.00005 | Cluster 2 |
| Gm19434 | –2.012432 | 0.0005 | Cluster 2 |
| Carns1 | –2.0274411 | 0.0205 | Cluster 2 |
| Mpp2 | –1.5418367 | 0.00775 | Cluster 2 |
| Mustn1 | –2.061708 | 0.0017 | Cluster 2 |
| Rn45s | –2.10963 | 0.07705 | Cluster 2 |
| Sema6b | –2.2547383 | 0.0119 | Cluster 2 |
| Cfp | –2.0456935 | 0.0001 | Cluster 2 |
| App | –2.211262 | 0.00935 | Cluster 2 |
| Car9 | –2.0062063 | 0.02255 | Cluster 2 |
| 1700102P08Rik | –2.4325509 | 0.0268 | Cluster 2 |
| Snhg10 | –2.345361 | 0.00015 | Cluster 2 |
| Lima1 | –2.3391753 | 0.07585 | Cluster 2 |
| Selm | –2.0294095 | 0.00265 | Cluster 2 |
| Slc41a3 | –2.1887998 | 0.0001 | Cluster 2 |
| Src | –2.6392902 | 0.00015 | Cluster 2 |
| Miat | –2.5487856 | 0.0109 | Cluster 2 |
| Cd79a | –2.5900501 | 0.00055 | Cluster 2 |
| Plxnb2 | –2.9874612 | 0.00005 | Cluster 2 |
| Pla2g2d | –1.529167 | 0.0268 | Cluster 2 |
| Lyz2 | –2.9362402 | 0.04775 | Cluster 2 |
| Cdk3-ps | –3.0692156 | 0.00265 | Cluster 2 |
| Mir6236 | –2.5029162 | 0.0004 | Cluster 2 |
| Smagp | –1.9662967 | 0.00005 | Cluster 2 |
| AF251705 | –2.8636993 | 0.0226 | Cluster 2 |
| Gfra2 | –2.8780666 | 0.00005 | Cluster 2 |
| Tmem91 | –3.2171875 | 0.00005 | Cluster 2 |
| Pld4 | –1.5079912 | 0.02785 | Cluster 2 |
| Itgb5 | –1.6713455 | 0.00225 | Cluster 2 |
| Treml4 | –3.2826024 | 0.0001 | Cluster 2 |
| Cd14 | –2.7112347 | 0.00005 | Cluster 2 |
| Marcks | –3.1963602 | 0.00005 | Cluster 2 |
| Cmbl | –2.6693158 | 0.00005 | Cluster 2 |
| Klra3 | –2.5417462 | 0.03455 | Cluster 2 |
| Ctsh | –3.5891694 | 0.00565 | Cluster 2 |
| Klra8 | –3.3087585 | 0.0001 | Cluster 2 |
| Cd81 | –3.3276415 | 0.00005 | Cluster 2 |
| C1qb | –3.7316146 | 0.00005 | Cluster 2 |
| Aif1 | –3.2695906 | 0.01525 | Cluster 2 |
| Bank1 | –3.0876517 | 0.002 | Cluster 2 |
| C1qc | –3.0727492 | 0.0001 | Cluster 2 |
| Apoe | –3.5282676 | 0.00005 | Cluster 2 |
| Clec4a3 | –2.9215824 | 0.00015 | Cluster 2 |
| Tgfbi | –3.5641054 | 0.00005 | Cluster 2 |
| Mrc1 | –3.6479097 | 0.03025 | Cluster 2 |
| Sirpa | –4.0829446 | 0.00005 | Cluster 2 |
| Clec1b | –1.7537681 | 0.0004 | Cluster 2 |
| Klra14-ps | –3.8984753 | 0.00005 | Cluster 2 |
| Ccr3 | –2.5323907 | 0.06515 | Cluster 2 |
| C1qa | –3.5880749 | 0.00005 | Cluster 2 |
| Vcam1 | –3.6726209 | 0.0011 | Cluster 2 |
| Tbxas1 | –4.4023688 | 0.00005 | Cluster 2 |
| Csf1r | –4.0805398 | 0.00005 | Cluster 2 |
| Fcna | –3.3668046 | 0.00005 | Cluster 2 |
| Adgre1 | –3.7926073 | 0.00005 | Cluster 2 |
| Adamdec1 | –4.9789792 | 0.00005 | Cluster 2 |
| Tnfrsf8 | –2.2700751 | 0.0008 | Cluster 2 |
| Aldh2 | 2.4260512 | 0.00025 | Cluster 3 |
| Slc40a1 | 2.40044187 | 0.0057 | Cluster 3 |
| Zfp385a | 2.16534965 | 0.06435 | Cluster 3 |
| Spag5 | 1.88610893 | 0.00005 | Cluster 3 |
| Nusap1 | 1.84390075 | 0.09965 | Cluster 3 |
| B9d1 | 1.78604818 | 0.0031 | Cluster 3 |
| Top2a | 1.74249558 | 0.0044 | Cluster 3 |
| Alox5ap | 1.64982614 | 0.09075 | Cluster 3 |
| Sgol2a | 1.61420186 | 0.05365 | Cluster 3 |
| Cdk1 | 1.59276453 | 0.0489 | Cluster 3 |
| Pla2g4b | 1.58954405 | 0.04465 | Cluster 3 |
| Fam174b | 1.54600394 | 0.00895 | Cluster 3 |
| Spc25 | 1.51665085 | 0.0962 | Cluster 3 |
| Ppp1r13l | –1.5091602 | 0.0399 | Cluster 3 |
| Neto2 | –1.5160875 | 0.0106 | Cluster 3 |
| Eif3j2 | –1.5188243 | 0.03625 | Cluster 3 |
| Gm28042 | –1.5257346 | 0.02945 | Cluster 3 |
| Gm4532 | –1.5651414 | 0.05395 | Cluster 3 |
| Sowahc | –1.5972355 | 0.09105 | Cluster 3 |
| Tnfrsf21 | –1.6215854 | 0.04005 | Cluster 3 |
| Gm3435 | –1.6321142 | 0.01435 | Cluster 3 |
| Zfp112 | –1.6371301 | 0.04985 | Cluster 3 |
| Nr1h3 | –1.6602966 | 0.07725 | Cluster 3 |
| 2810468N07Rik | –1.6797191 | 0.0173 | Cluster 3 |
| Hck | –1.6894024 | 0.04875 | Cluster 3 |
| Pth1r | –1.7203976 | 0.06865 | Cluster 3 |
| Tagln3 | –1.7598763 | 0.05825 | Cluster 3 |
| Hist1h4d | –1.7606181 | 0.0688 | Cluster 3 |
| Tubb3 | –1.803737 | 0.00005 | Cluster 3 |
| Klre1 | –1.8122236 | 0.02795 | Cluster 3 |
| Spi1 | –1.8248628 | 0.0498 | Cluster 3 |
| Fcgr4 | –1.8961012 | 0.01005 | Cluster 3 |
| Mrgpre | –1.9259777 | 0.00455 | Cluster 3 |
| Chrne | –1.9429018 | 0.03985 | Cluster 3 |
| Tctex1d2 | –1.9516374 | 0.00005 | Cluster 3 |
| Sdc3 | –1.9572554 | 0.0026 | Cluster 3 |
| Tlr7 | –1.9874423 | 0.0019 | Cluster 3 |
| Slc11a1 | –2.0856253 | 0.001 | Cluster 3 |
| Gzma | –2.102273 | 0.00005 | Cluster 3 |
| Cpsf4l | –2.1529279 | 0.0146 | Cluster 3 |
| Clec4a1 | –2.2106337 | 0.0132 | Cluster 3 |
| Fcer1g | –2.2631622 | 0.0002 | Cluster 3 |
| Ncf2 | –2.2765987 | 0.00205 | Cluster 3 |
| Slpi | –2.2838533 | 0.00005 | Cluster 3 |
| Cd244 | –2.4303599 | 0.0011 | Cluster 3 |
| Ptgs1 | –2.5181601 | 0.0003 | Cluster 3 |
| Cybb | –2.7556258 | 0.0001 | Cluster 3 |
| Matk | –3.0595087 | 0.00005 | Cluster 3 |
| Ifitm2 | –3.1387932 | 0.01575 | Cluster 3 |
| Cdc20b | –3.2338662 | 0.00705 | Cluster 3 |
| Msc | –3.4433671 | 0.01 | Cluster 3 |
| Clec4n | –3.4851723 | 0.00015 | Cluster 3 |
| Rgl1 | –3.5597601 | 0.0001 | Cluster 3 |
| Spic | –3.6767727 | 0.00005 | Cluster 3 |
| Hebp1 | –3.7616875 | 0.00025 | Cluster 3 |
| Hist1h3e | –4.1043962 | 0.04245 | Cluster 3 |
| Lrg1 | –5.383073 | 0.0033 | Cluster 3 |
Key resources table
| Reagent type (species) or resource | Designation | Source or reference | Identifiers | Additional information |
|---|---|---|---|---|
| Strain, strain background (Mus musculus) | C57BL6/J | Jackson Laboratory | Stock No: 000664(RRID:IMSR_JAX:000664) | |
| Strain, strain background (Mus musculus) | B6.PL(84NS)/Cy | Jackson Laboratory | Stock No: 000983(RRID:IMSR_JAX:000406) | C57BL6/JThy1.1 |
| Strain, strain background (Mus musculus) | B6.Cg-Tcratm1Mom Tg(TcrLCMV)327Sdz(P14) | Jackson Laboratory | Stock No: 37394-JAX(RRID:IMSR_TAC:4138) | |
| Strain, strain background (Mus musculus) | Thy1.1/1.1- B6.Cg-Tcratm1Mom Tg(TcrLCMV)327Sdz | This paper | Thy1.1/1.1 P14 | Can be acquired through lab contact or breeding of above commercially available strains |
| Strain, strain background (Lymphocytic choriomeningitis virus) | Lymphocytic choriomeningitis virus Armstrong strain(LCMV-Arm) | Armstrong, C. and Lillie, R.D. Experimental lymphocytic choriomeningitis of monkeys and mice produced by a virus encountered in studies of the 1933 St Louis encephalitis epidemic. Public Health Reports 49, 1019–1027 (1934) | LCMV-Arm | Can be acquired through lab contact. |
| Strain, strain background (virulent Listeria monocytogenes) | Virulent recombinant Listeria monocytogenes expressing GP33-41(XFL203 L.m.-GP33) | Shen et al. Recombinant Listeria monocytogenes as a live vaccine vehicle for the induction of protective anti-viral cell-mediated immunity. PNAS 92(9) 3987–3991 (1995) | L.m.-GP33 | Can be acquired through lab contact. |
| Peptide, recombinant protein | GP33-44 | AnaSpec | Catalog #:AS-61296 | |
| Antibody | CD8a(Rat monoclonal) | Biolegend | 5H10-1(RRID:AB_312762) | FACs(1:400) |
| Antibody | CD11a(Rat monoclonal) | Biolegend | M17/4(RRID:AB_312776) | FACs(1:300) |
| Antibody | Thy1.1(Mouse monoclonal) | eBioscience | HIS51(RRID:AB_1257173) | FACs(1:1000) |
| Antibody | KLRG1(Mouse monoclonal) | eBioscience | 2F1(RRID:AB_540279) | FACs(1:100) |
| Antibody | CD127(Rat monoclonal) | eBioscience | eBioSB/199 | FACs(1:100) |
| Antibody | CD62L(Rat monoclonal) | Biolegend | MEL-14(RRID:AB_1853103) | FACs(1:100) |
| Antibody | CX3CR1(Mouse monoclonal) | eBioscience | SA011F11(RRID:AB_2565701) | FACs(1:100) |
| Antibody | CXCR3(Armenian Hamster monoclonal) | eBioscience | CXCR3-173(RRID:AB_1210593) | FACs(1:100) |
| Antibody | CD27(Armenian Hamster monoclonal) | eBioscience | LG.7F9 | FACs(1:100) |
| Antibody | CD69(Hamster monoclonal) | Biolegend | H1.2F3(RRID:AB_1853105) | FACs(1:100) |
| Antibody | CD103(Hamster monoclonal) | Biolegend | 2E7(RRID:AB_469040) | FACs(1:100) |
| Antibody | CD25(Mouse monoclonal) | Biolegend | PC61.5 | FACs(1:100) |
| Antibody | CD122(Rat monoclonal) | Biolegend | TM-b1 | FACs(1:100) |
| Antibody | IFNγ(Rat monoclonal) | eBioscience | XMG1.2(RRID:AB_465410) | FACs(1:100) |
| Antibody | IL-2(Rat monoclonal) | Biolegend | JES6-5H4(RRID:AB_315298) | FACs(1:100) |
| Antibody | Ki67(Mouse monoclonal) | BD Pharmingen | B56(RRID:AB_2858243) | FACs(1:100) |
| Antibody | BrdU(Mouse monoclonal) | Biolegend | Bu20a(RRID:AB_1595472) | FACs(1:100) |
| Antibody | CD45RA(Mouse monoclonal) | Tonbo | HI100 | FACs(1:100) |
| Antibody | CD45RO(Mouse monoclonal) | Tonbo | UCHL1 | FACs(1:100) |
| Antibody | CD3(Mouse monoclonal) | Biolegend | HIT3a | FACs(1:100) |
| Antibody | CD8a(Mouse monoclonal) | Biolegend | HIT8a | FACs(1:100) |
| Antibody | CCR7(Mouse monoclonal) | Biolegend | G043H7 | FACs(1:100) |
| Antibody | CD3(Mouse monoclonal) | Biolegend | OKT3 | Plate coating(0–10 μg) |
| Antibody | CD8a(Rat monoclonal) | Biolegend | 53–6.7 | FACs(1:100) |
| Antibody | AKT(rabbit monoclonal) | Cell Signaling Technology | 11E7 | TIRF microscopy(1:20) |
| Antibody | Anti-rabbit IgG(donkey monoclonal) | Biolegend | Poly4064 | TIRF microscopy(1:100) |
| Commercial assay or kit | Foxp3/ Transcription Factor Staining Buffer Set | Invitrogen | 00-5523-00 | |
| Software, algorithm | GraphPad Prism | GraphPad Prism 8 | Version 8.4.2 (464)(RRID:SCR_002798) |
Additional files
Download links
A two-part list of links to download the article, or parts of the article, in various formats.
Downloads (link to download the article as PDF)
Open citations (links to open the citations from this article in various online reference manager services)
Cite this article (links to download the citations from this article in formats compatible with various reference manager tools)
Sepsis leads to lasting changes in phenotype and function of memory CD8 T cells
eLife 10:e70989.
https://doi.org/10.7554/eLife.70989


