Intracellular functions and motile properties of bi-directional kinesin-5 Cin8 are regulated by neck linker docking
- Department of Chemistry, Ben-Gurion University of the Negev, Israel
- InterX LTD, Israel
Figures
Figure 1 with 1 supplement
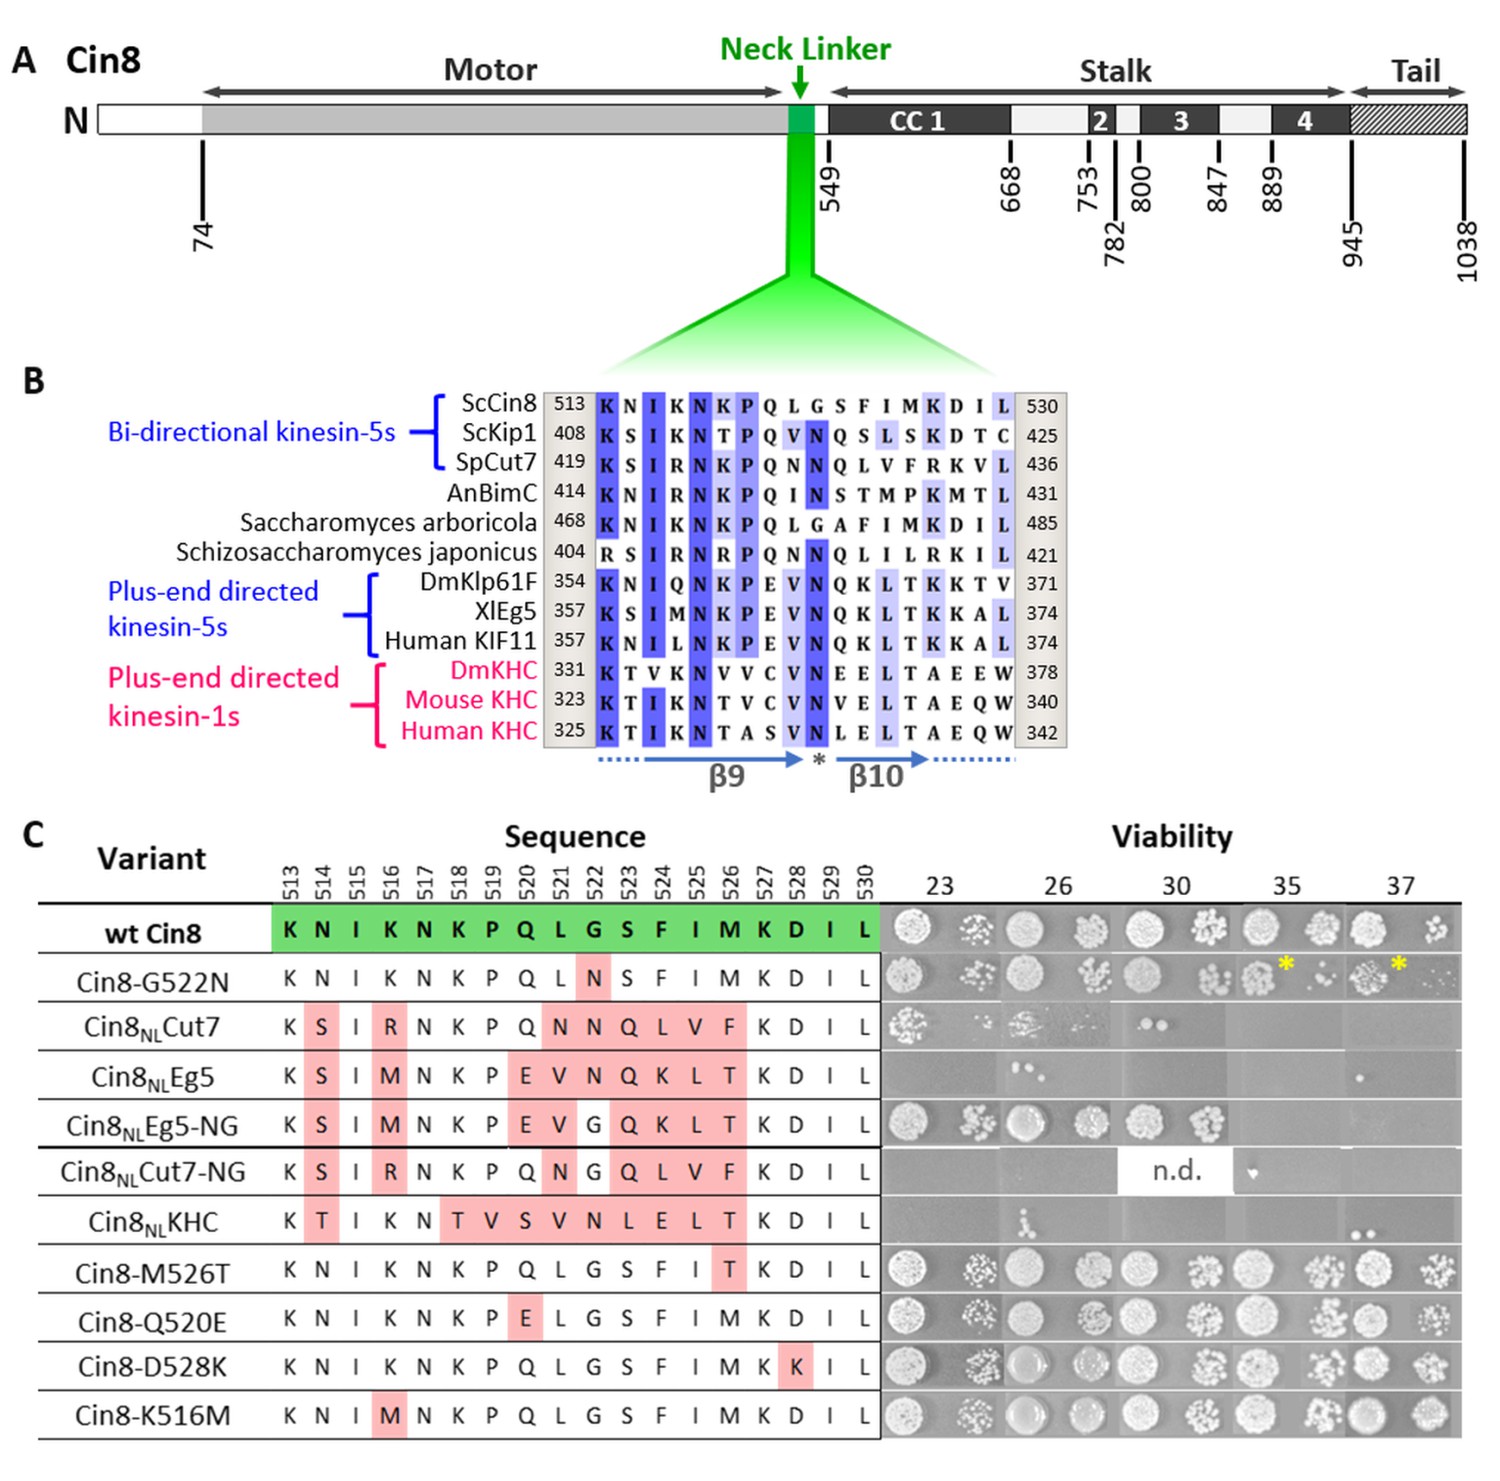
Viability of Saccharomyces cerevisiae cells expressing NL variants of Cin8.
(A) Schematic representation of the Cin8 sequence with amino acid numbers at the bottom flanking the main structural elements of Cin8, indicated on the top; CC: coiled coil. The NL region (green) is expanded in B. (B) Multiple sequence alignment (MSA) of the NL region of members of the kinesin-5 (black) and kinesin-1 (magenta) families. Known directionality of kinesin motors, that is, either bi-directional or exclusively plus end directed, is annotated in blue on the left. The positions flanking the presented sequence of each kinesin motor are annotated on the right and on the left of each sequence. The MSA was calculated by the MUSCLE algorithm (Edgar, 2004) via Unipro UGENE program (UGENE team et al., 2012). The amino acids are color coded by percentage identity with a 55% threshold. β9 and β10 of the NL are indicated at the bottom of the panel. Asterisk indicates the N-latch position. (C) Viability of S. cerevisiae cells expressing NL variants of Cin8, indicated on the left, as a sole source of kinesin-5. Temperatures (℃) at which cell growth was examined are indicated on the top. Amino acids of the NL are indicated in the middle; positions in the sequence of Cin8 are indicated on the top. The amino acids highlighted in green are those of the wt Cin8 sequence. Amino acids in the NL of Cin8 that were mutated to amino acids from other kinesin motors are highlighted in pink. Asterisks indicate the reduced growth of cells expressing the Cin8-G522N variant at 35°C and 37°C. n.d. – not determined.
Figure 1—figure supplement 1
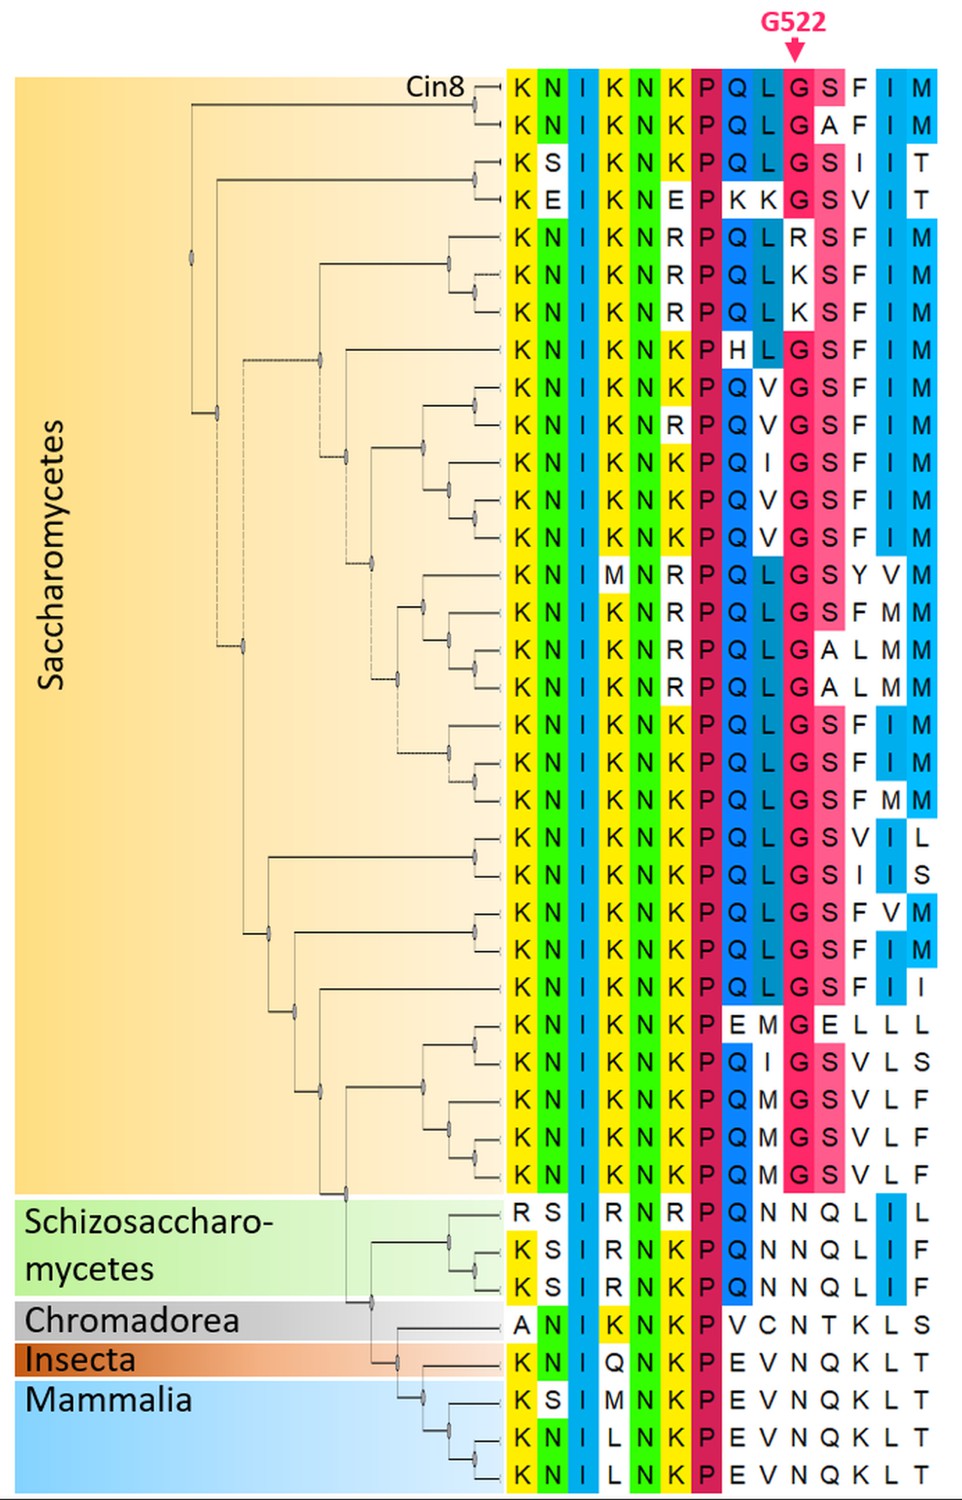
Multiple sequence alignment (MSA) of the NL region (right) and a phylogenetic tree (left) of kinesin-5 motors.
The different clades are color coded; Saccharomycetes (orange); Schizosaccharomycetes (green); Chromadorea (gray); Insecta (brown) and Mammalia (blue). The MSA was calculated by the MUSCLE algorithm (Edgar, 2004) via Unipro UGENE program (UGENE team et al., 2012). The amino acids are color coded by percentage identity with a 50% threshold. The phylogenetic tree was generated by the Jones Taylor Thornton model (Jones et al., 1992) via the UGENE program (UGENE team et al., 2012). Cin8 is the top first sequence and G522 is indicated in pink on the top of the figure.
Figure 2

Intracellular phenotypes of the NL variants.
The examined cells were deleted for the chromosomal copy of CIN8 (in the presence of KIP1) and express tdTomato-tagged SPB component Spc42 and the 3GFP-tagged NL variants. (A and B) Spindle length distribution of cells expressing NL variants of Cin8. (A) The average percentage (± SEM) of budded cells in the different spindle length categories is shown for monopolar, short <2 µm and long >2 µm spindles. Since in S. cerevisiae cells the bipolar spindle is formed during the S-phase, budded cells with a short spindle can be either in S-phase or in metaphase. In each experiment, 113–411 cells were examined, and spindles were categorized according to their shapes and lengths (see Materials and methods and Source data 2). For each NL variant, three experiments were performed. *p < 0.05; **p < 0.01, compared to wt Cin8. (B) Live cell images (left) and schematic representation of cells and spindles (right) for each spindle category, as in (A). BF: bright field; Bar: 2 µm. (C-E) Localization of NL variants of Cin8 in cells with monopolar spindles. (C) Representative images of cells with small buds and monopolar spindles expressing 3GFP-tagged NL variants of Cin8 (indicated on the top of each panel). Cells were imaged in bright field (BF), red (Spc42) and green (Cin8) fluorescence channels. The insets show a 200% magnification of the localization of Cin8-3GFP. Yellow arrows indicate co-localization of Cin8-3GFP and Spc42-tdTomato, and white arrows indicate localization of Cin8, which is diffusive in the nucleus and is associated with nuclear MTs. Bar: 5 µm. (D) Schematic representation of small budded cells with monopolar spindles showing Cin8-3GFP co-localization with the SPBs (top, as in wt Cin8, Cin8-G522N, Cin8NLCut7 and Cin8NLEg5-NG) and diffusive Cin8-3GFP localization in the nucleus and in association with nuclear MTs (bottom, as in Cin8NLEg5 and Cin8NLCut7-NG). (E) Average area (± SEM) of Cin8-3GFP localization in the nucleus of each variant, indicated on the x-axis, was calculated by the particle analysis function in ImageJ software (see Materials and methods and Source data 3). Numbers of examined cells for each variant are indicated in the graph columns. **p < 0.01, compared to wt Cin8.
-
Figure 2—source data 1
Cell cycle analysis of cells expressing NL variants of Cin8.
- https://cdn.elifesciences.org/articles/71036/elife-71036-fig2-data1-v2.xlsx
-
Figure 2—source data 2
Area of localization of NL variants of Cin8 at the poles in cells with monopolar spindles.
- https://cdn.elifesciences.org/articles/71036/elife-71036-fig2-data2-v2.xlsx
Figure 3 with 1 supplement
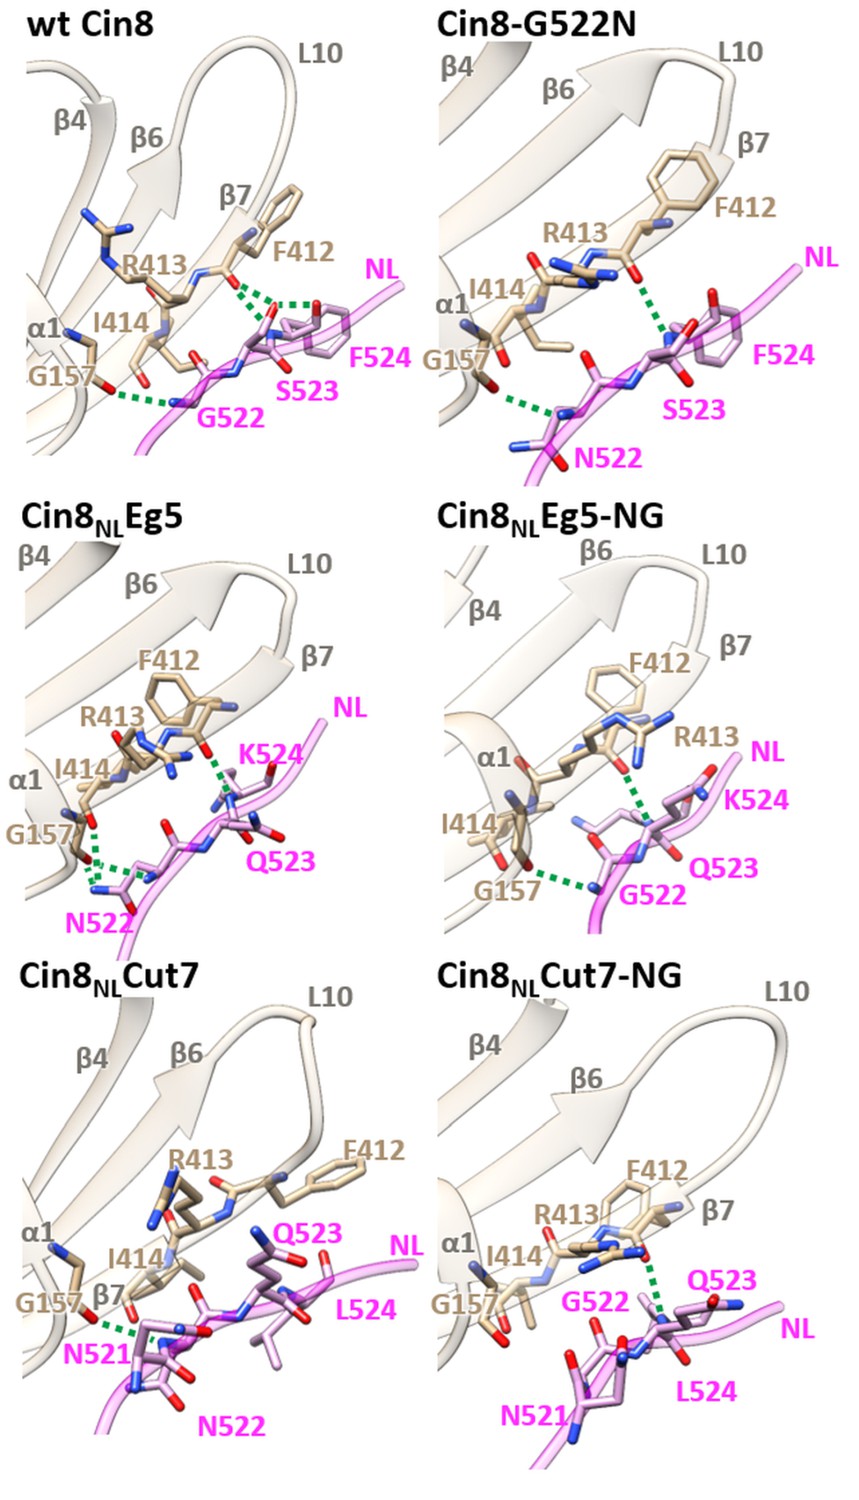
Structural analysis of NL/β7 in different variants of Cin8.
3D homology models of Cin8 NL variants were generated on the basis of four PDB structures of kinesin motors published previously, all in the presence of AMP-PNP. Structural elements of the motor domain (gray) and NL (magenta) are depicted in ribbon representation; residue elements such as oxygen and nitrogen are shown in red and blue respectively; H-bonds formed between NL residues (magenta) and motor-domain residues (tan) according to the calculated donor-acceptor distances and the donor-acceptor-hydrogen angles deduced from the models are shown as green dashed lines.
Figure 3—figure supplement 1

Analysis of H-bond interactions between β9 of the NL and the motor domain of Cin8.
3D homology models of Cin8 NL variants, indicated above each panel, were generated based on four PDB structures of kinesin motors published previously, all in the presence of AMP-PNP. Structural elements of the motor domain (gray), NL (magenta) and the cover strand (CS) (purple) are shown in ribbon representation; oxygen, nitrogen and sulfur atoms are shown in red, blue and yellow, respectively. H-bonds are indicated by dashed lines, according to the calculated donor-acceptor distances and the donor-acceptor-hydrogen angles deduced from the models. H-bonds formed between NL residues (magenta) and the non-motor N-terminal CS residues (purple) are indicated by red dashed lines; H-bonds between the NL residues and motor-domain residues (green) are indicated by black dashed lines.
Figure 4 with 2 supplements
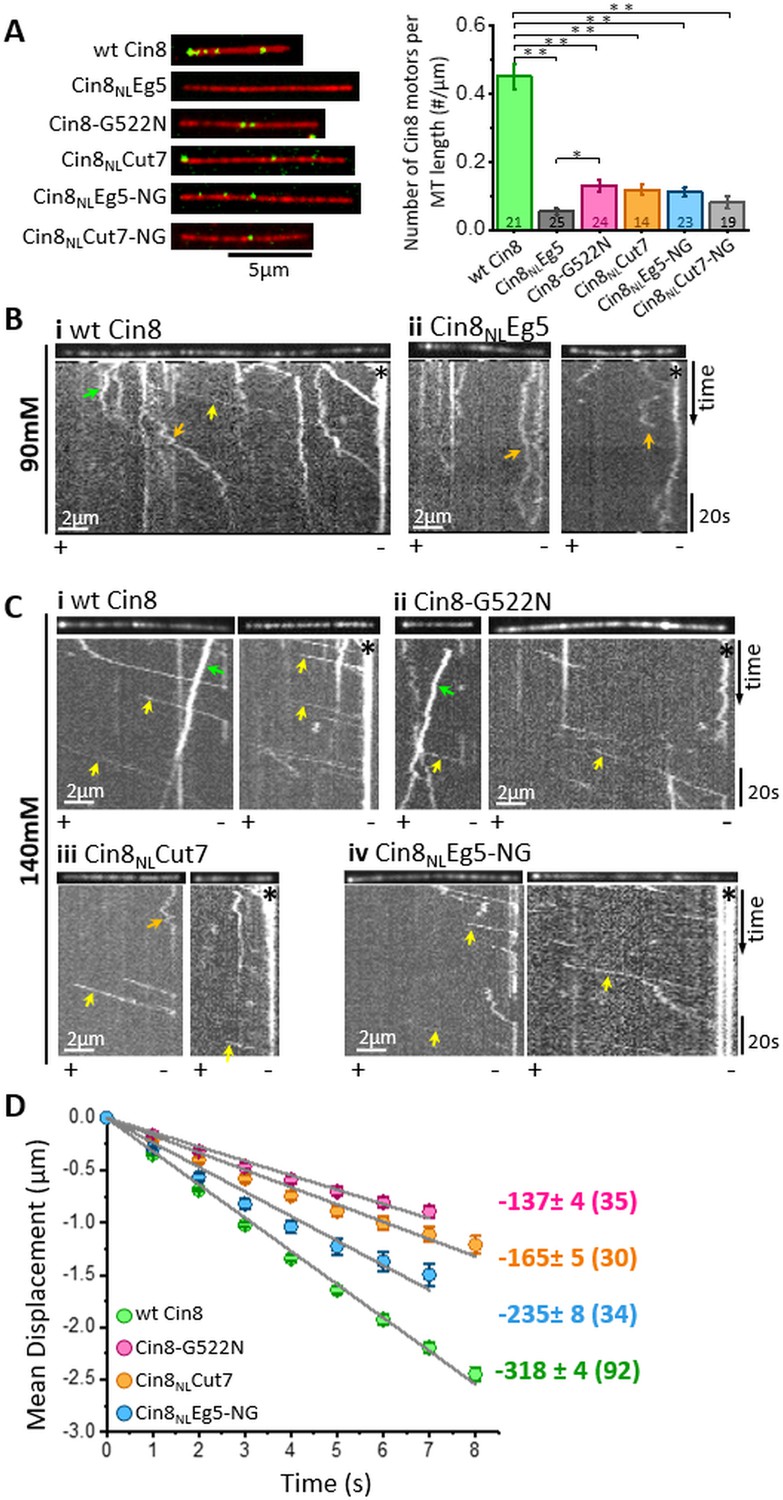
In vitro MT binding and single molecule motility assay of NL variants of Cin8.
(A) MT-binding assay of GFP-tagged NL Cin8 variants in the presence of 1 mM ATP and 140 mM KCl. Left: Representative images of motors (green) bound to fluorescently labeled MTs (red) of the variants; bar: 5 µm. Right: Average number (± SEM) of Cin8 motors per MT length. The total number of MT-bound Cin8 motors was divided by the total MT length and averaged over 14–25 observation areas, indicated in the graph columns for each NL variant of 346 µm2 (see Materials and methods and Source data 4); NL variants are indicated on the X-axis. *p < 0.05; **p < 0.005. (B, C) Representative kymographs of single molecule motility assay of NL variants at (B) 90 mM KCl and (C) 140 mM KCl. The MTs are shown on the top of the kymographs. The directionality of the MTs, indicated at the bottom of each kymograph, was assigned according to the bright plus-end label and/or by the directionality of fast Cin8 minus-end directed movements (Gerson-Gurwitz et al., 2011; Shapira et al., 2017). Yellow, orange, and green arrows indicate fast minus-end directed, bi-directional, and plus-end directed movements, respectively; asterisks indicate Cin8 clustering at the minus-end of MTs. (D) Plots of mean displacement (MD) (± SEM) of single molecules of Cin8 NL variants as a function of time. The solid lines represent linear fits of the mean displacement (MD = v.t, where v is the velocity, and t is time). Numbers on the right indicate mean velocity (nm/s ± SD), calculated from the linear fits of the MD plots as a function of time. Numbers of analyzed trajectories are indicated in parentheses (see Materials and methods and Source data 5).
-
Figure 4—source data 1
Affinity of NL variants of Cin8 to the MTs.
- https://cdn.elifesciences.org/articles/71036/elife-71036-fig4-data1-v2.xlsx
-
Figure 4—source data 2
MD analysis of NL variants of Cin8.
- https://cdn.elifesciences.org/articles/71036/elife-71036-fig4-data2-v2.xlsx
Figure 4—figure supplement 1
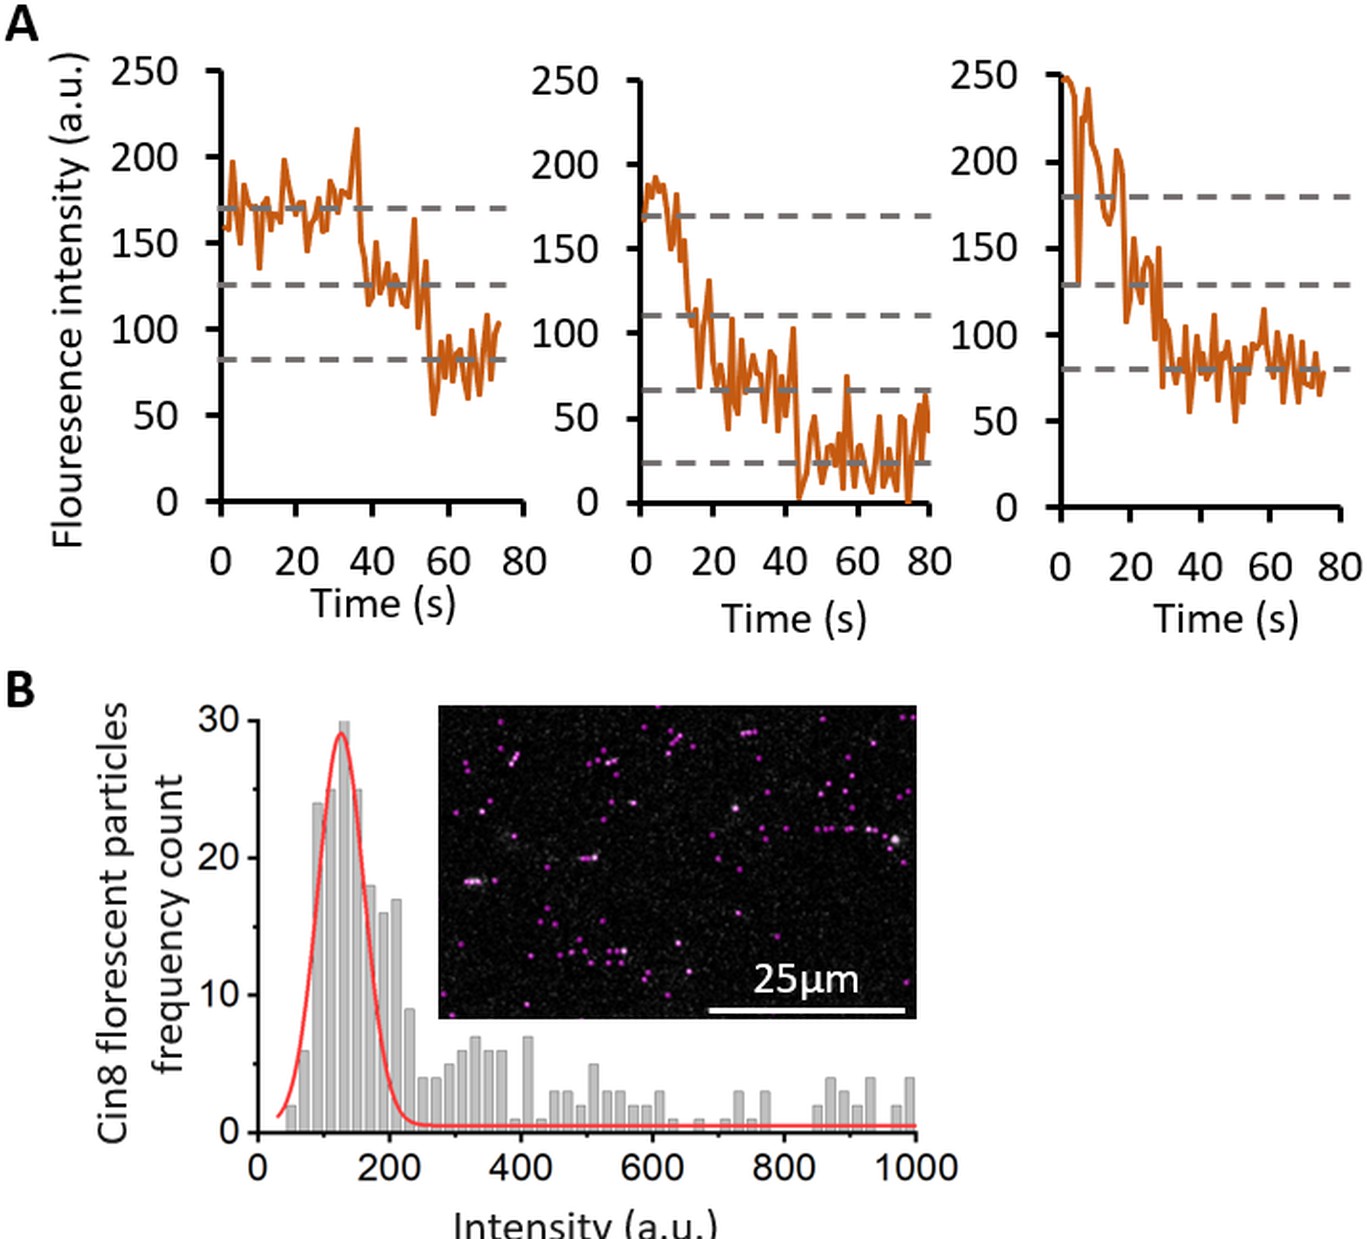
Fluorescence intensity bleaching and distribution, of Cin8-GFP molecules.
(A) Fluorescence intensity as a function of time for selected Cin8-GFP particles. Dashed lines represent the fluorescence intensity levels between photobleaching steps. The intensity of the bleaching steps was found to be 45±1 (SEM) a.u. (n = 37). (B) Fluorescence intensity distribution histogram of Cin8-GFP particles in the first frame of time-lapse imaging. The red line represents a Gaussian fit of an intensity peak with a center at ~120 a.u. by OriginLab software. This peak contains 64% of the molecules and represents the intensity peak of single Cin8-GFP tetramers. Since the average intensity of a single GFP molecules is ~45 a.u., the average intensity of single Cin8-GFP tetramers is the average fluorescence intensity of one, two, three and four fluorescent GFP molecules, which is ~112 a.u. Detection of particles and their fluorescence intensity determination were performed following background subtraction (see Materials and methods). The inset is a representative image of a field in which the purple circles are particles recognized by the TrackMate plugin in ImageJ (Tinevez et al., 2017).
Figure 4—figure supplement 2
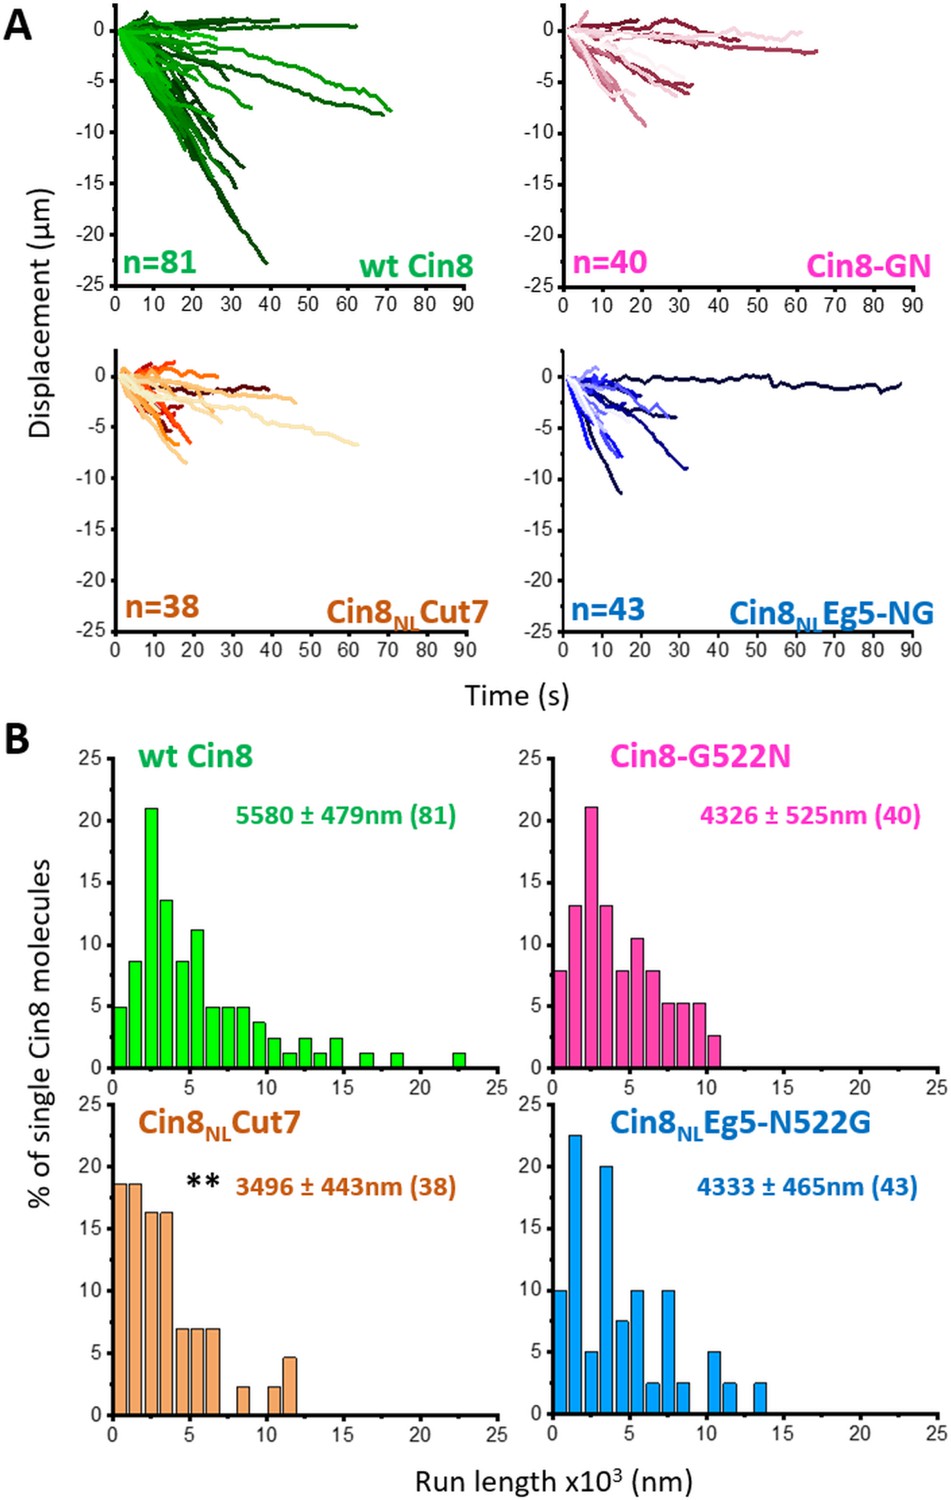
Motility trajectories and run length of NL variants.
(A) Displacement trajectories of single molecule motility of NL variants at 140 mM KCl. Number of trajectories (n) is indicated at the bottom left of each plot. (B) Distributions of run lengths of single molecule motility of the different variants, indicated at the top of each plot. Run lengths of molecules exceeding the imaging time (90 s) or with either starting or ending points outside the imaging window were excluded. Average run length ± S.E.M (n) is indicated for each variant. **p < 0.01, compared to wt Cin8 according to Dunnett’s method Dunnett, 1955 (see Materials and methods and Source data 6).
Figure 5

In vitro MT bundling by NL variants of Cin8.
(A) Schematic representation of MTs (red) cross-linked by Cin8 (green). The left panel represents a single MT with a low fluorescence intensity; the right panel represents a high-fluorescence intensity MT-bundle induced by Cin8. (B) Representative images of rhodamine-labeled GMPCPP-stabilized MTs (red) in the absence (left) and presence (right) of Cin8-GFP (green). The MT-bundle presented on the right was induced by wt Cin8-GFP, which was co-localized with the bright section of the MT-bundle. (C) Representative images of MT-bundles induced by NL variants of Cin8, indicated on the top. Arrows indicate the bright MT bundles. (D) Average intensity (± SEM) of MT bundles as a function of the concentration of Cin8 variants, measured by particle analysis using ImageJ (see Materials and methods Source data 7). Numbers of particles analyzed for each variant are indicated in parentheses; black: MTs only without motors. Color-coded asterisks for each NL variant indicate comparison to average MT intensity in the absence of motors. *p < 0.05; **p < 0.005.
-
Figure 5—source data 1
MT bundling by NL variants of Cin8.
- https://cdn.elifesciences.org/articles/71036/elife-71036-fig5-data1-v2.xlsx
Figure 6 with 7 supplements

Cin8 induced MT sliding of NL variants.
(A) Representative time-lapse of a plus-end directed MT sliding event for each NL variant. Yellow arrow indicates a bi-directional movement of the MT during Cin8-induced sliding. In the schematic representations of the first frame of the MT sliding event presented on the top of the panel; rhodamine-labeled MTs are shown as red tubes; plus-end labeling is indicated by dark red or green coloring of the MT; surface binding of the MTs via an avidin-biotin bond is indicated by ‘B’; GFP-labeled Cin8 motors are shown as green vertical dumbbell shapes; MT polarities are indicated (for Cin8NLCut7, the stationary MT lacks a polarity label); gray arrows indicate motor directionality; and blue arrows indicate the directionality of moving MT. (B) Characteristic MT sliding induced by the NL variants. Motor concentrations are indicated in parentheses on the left. Mean velocities of plus-end directed MT sliding (± SEM (n)) are indicated on the right, see materials and methods and Source data 8 for definition. Statistical analysis performed by Dunnett’s test for comparing plus-end directed movements of the variants compared to wt Cin8; *p < 0.05, **p < 0.01.
-
Figure 6—source data 1
MT sliding by NL variants of Cin8.
- https://cdn.elifesciences.org/articles/71036/elife-71036-fig6-data1-v2.xlsx
Figure 6—figure supplement 1

Examples of bi-directional and minus-end directed MT sliding.
Top: Schematic representation of the first frame of the MT sliding event presented in the bottom panel. Rhodamine-labeled MTs are depicted by red tubes; plus-end labeling, by dark red or green coloring of the MT; surface bound MTs, by ‘B’; and GFP labeled Cin8, green dumbbell shapes between the MTs. Directionality of moving MTs is indicated by the blue arrows. Bottom: Representative time-lapse of MT sliding events. Rhodamine-labeled GMPCPP stabilized MTs are polarity marked with either bright HyLite488 green cap or bright rhodamine cap at their plus-end. MTs with green caps are immobilized to the surface via biotin NeutrAvidin interaction and red capped MTs are free in solution. In the presence of Cin8, the free MTs are captured to the stationary MTs by Cin8 and undergo Cin8-induced MT sliding (see Materials and methods). Time interval between frames is 20 s for bi-directional sliding and 10 s for minus-end directed sliding. Left: bi-directional MT sliding induced by Cin8-G522N (movie M5); Right: minus-end directed MT sliding, with the plus-end of the moving MT leading, induced by Cin8NLCut7 (Figure 6—video 6).
Figure 6—video 1
Plus-end directed MT sliding induced by GFP-tagged wt Cin8, presented in Figure 6A.
The plus ends of the stationary rhodamine labeled MTs are labeled with bright rhodamine red caps. The free polarity-labeled MT slides with its minus-end leading along a stationary MT in an anti-parallel fashion. Frame rate 0.1 f/s; Video speedup 100X.
Figure 6—video 2
Plus-end directed MT sliding induced by GFP-tagged Cin8-G522N, presented in Figure 6A.
The plus ends of the stationary rhodamine-labeled MTs are labeled with HyLite488 green caps and the plus ends of the free-in-solution rhodamine-labeled MTs are labeled with bright rhodamine red caps. The free polarity-labeled MT slides with its minus-end leading along a stationary MT in an anti-parallel fashion. Frame rate 0.1 f/s; Video speedup 100X.
Figure 6—video 3
Plus-end directed MT sliding induced by GFP-tagged Cin8NLCut7, presented in Figure 6A.
The stationary rhodamine-labeled MTs are not polarity-labeled, and the plus ends of the free-in-solution rhodamine-labeled MTs are labeled with bright rhodamine red caps. The free polarity-labeled MT slides with its minus-end leading along a stationary MT in an anti-parallel fashion, probably mediated by Cin8NLCut7 (green) at the minus end of the free-in-solution MT. Frame rate 0.1 f/s; Video speedup 100X.
Figure 6—video 4
Plus-end directed MT sliding induced by GFP-tagged Cin8NLEg5-NG, presented in Figure 6A.
The plus ends of rhodamine-labeled MTs are labeled with bright rhodamine red caps. The free polarity-labeled MT slides with its minus-end leading along a stationary MT in an anti-parallel fashion, probably mediated by Cin8NLCut7 (green) and visible between the two MTs. Frame rate 0.1 f/s; Video speedup 100X.
Figure 6—video 5
Bi-directional sliding event induced by GFP-tagged Cin8-G522N, presented in Figure 6—figure supplement 1.
The plus ends of the stationary rhodamine-labeled MTs are labeled with bright HyLite488 green caps and the plus ends of the free-in-solution rhodamine-labeled MTs are labeled with bright rhodamine red caps. The free polarity-labeled MT slides in a bi-directional manner along a stationary MT. Frame rate 0.1 f/s; Video speedup 100X.
Figure 6—video 6
Minus-end directed MT sliding event induced by GFP-tagged Cin8NLCut7, presented in Figure 6—figure supplement 1.
The plus ends of the stationary rhodamine-labeled MTs are labeled with bright HyLite488 green caps, and the plus ends of the free-in-solution rhodamine-labeled MTs are labeled with bright rhodamine red caps. The free polarity-labeled MT slides with the plus-end leading along a plus-end labeled stationary MT. Frame rate 0.1 f/s; Video speedup 100X.
Tables
Table 1
Doubling time of S. cerevisiae cells expressing wt and NL variants of Cin8.
| cin8Δkip1Δa† | cin8Δa | |
|---|---|---|
| wt Cin8 | 152 ± 1 (3) | 127 ± 4 (3) |
| Cin8-G522N | 175 ± 2 (3)* | n.d. |
| Cin8NLCut7 | 210 ± 7 (3)** | 143 ± 3 (4)* |
| Cin8NLEg5-NG | 191 ± 6 (4)** | n.d. |
| Cin8NLEg5 | n.d. | 167 ± 4 (4)** |
-
aAverage doubling times ± SEM (min). The number of experiments is shown in parentheses (see also the Source data 1). 3HA-tagged Cin8 variants were expressed in the kip1Δcin8Δ and cin8Δ strains.
†In the cin8Δkip1Δ strain, NL variants and wt Cin8 were examined following shuffling-out of the parental pMA1208 plasmid (see Materials and methods).
-
*p < 0.05, **p < 0.01, compared to wt Cin8.
-
Table 1—source data 1
Source data for Table 1 .
- https://cdn.elifesciences.org/articles/71036/elife-71036-table1-data1-v2.xlsx
Table 2
H-bond array in the modeled 3D structures of Cin8 variants between the N-latch position and β10 of the NL and motor domain.
| Protein | Residue i | Atom | Residue J | Atom |
|---|---|---|---|---|
| wt Cin8 | F412 | O | F524 | N |
| F412 | O | S523 | Oγ | |
| F524 | N | S523 | Oγ | |
| G157 | O | G522 | N | |
| Cin8NLEg5 | F412 | O | K524 | N |
| G157 | O | N522 | Nδ | |
| G157 | O | N522 | N | |
| I414 | O | N522 | Nδ | |
| Cin8-G522N | F412 | O | F524 | N |
| G157 | O | N522 | N | |
| Cin8NLEg5-NG | F412 | O | K524 | N |
| G157 | O | G522 | N | |
| Cin8NLCut7 | G157 | O | N522 | N |
| Cin8NLCut7-NG | F412 | O | L524 | N |
-
H-bonds are based on geometric criteria. Here, we used stringent criteria: the distance between the donor and acceptor heavy atoms must be <0.36 nm, and the acceptor-donor hydrogen angle must be <30°.
Additional files
-
Source data 1
Doubling time (average ± SEM, min) for S. cerevisiae cells expressing wt and NL variants of Cin8, presented in Table 1.
- https://cdn.elifesciences.org/articles/71036/elife-71036-data1-v2.xlsx
-
Source data 2
Data of three independent experiments for spindle morphology and length distribution of cells expressing NL variants of Cin8.
The number of cells and percentage of cells in each category are presented for each Cin8 variant. The average of percentages (± SEM) are presented in Figure 2A.
- https://cdn.elifesciences.org/articles/71036/elife-71036-data2-v2.xlsx
-
Source data 3
Area (pixel2) of nuclear localization of 3GFP-tagged wt and NL variants of Cin8.
The average area (± SEM) for the number of cells analyzed is presented in Figure 2E.
- https://cdn.elifesciences.org/articles/71036/elife-71036-data3-v2.xlsx
-
Source data 4
Data for average (± SEM) number of 3GFP-tagged motors bound per MT length, for wt and NL Cin8 variants, presented in Figure 4A.
- https://cdn.elifesciences.org/articles/71036/elife-71036-data4-v2.xlsx
-
Source data 5
Mean displacement (MD), with 1 s time interval, for motility of GFP-tagged Cin8 variants.
The plot of MD vs. time interval is presented in Figure 4D and the average velocities are obtained from linear fitting the plot to MD = ν · t. The tab ‘Data MD’ presents the average MD for each 1 s time interval, up to 8 s, for the indicated Cin8-GFP variants. The tabs ‘wt Cin8’, ‘Cin8-G522N’, ‘Cin8NLCut7’, and ‘Cin8NLEg5-N522G’ present raw MD data for motility of the corresponding variants.
- https://cdn.elifesciences.org/articles/71036/elife-71036-data5-v2.xlsx
-
Source data 6
Run length (nm) determined for individual GFP-tagged wt and NL variants of Cin8, in the single molecule motility assay.
The distribution and average (± SEM) of run lengths are presented in Figure 4—figure supplement 2B.
- https://cdn.elifesciences.org/articles/71036/elife-71036-data6-v2.xlsx
-
Source data 7
Intensity of MT bundles (a.u.) as a function of the concentration of Cin8 variants.
Average intensities (± SEM) are presented in Figure 5D.
- https://cdn.elifesciences.org/articles/71036/elife-71036-data7-v2.xlsx
-
Source data 8
Data for average (± SEM) velocities (µm/min) of MT sliding induced by the different Cin8 variants.
MT sliding velocities in plus- and minus-end directions are indicated, data are presented in Figure 6B.
- https://cdn.elifesciences.org/articles/71036/elife-71036-data8-v2.xlsx
-
Supplementary file 1
List of plasmids used in this study.
- https://cdn.elifesciences.org/articles/71036/elife-71036-supp1-v2.docx
-
Supplementary file 2
Saccharomyces cerevisiae strains used in this study.
- https://cdn.elifesciences.org/articles/71036/elife-71036-supp2-v2.docx
-
Transparent reporting form
- https://cdn.elifesciences.org/articles/71036/elife-71036-transrepform-v2.docx
Download links
A two-part list of links to download the article, or parts of the article, in various formats.
Downloads (link to download the article as PDF)
Open citations (links to open the citations from this article in various online reference manager services)
Cite this article (links to download the citations from this article in formats compatible with various reference manager tools)
Intracellular functions and motile properties of bi-directional kinesin-5 Cin8 are regulated by neck linker docking
eLife 10:e71036.
https://doi.org/10.7554/eLife.71036


