Endomembrane targeting of human OAS1 p46 augments antiviral activity
- Department of Immunology, School of Medicine, University of Washington, United States
- Center for Innate Immunity and Immune Disease, University of Washington, United States
- Benaroya Research Institute at Virginia Mason, United States
- Roslin Institute, University of Edinburgh, United Kingdom
- Department of Molecular Genetics and Microbiology, School of Medicine, University of New Mexico, United States
- Department of Microbial Infection and Immunity, College of Medicine, The Ohio State University, United States
- Department of Microbiology, School of Medicine, University of Washington, United States
- Department of Microbiology and Immunology, University of Texas Medical Center, United States
- Department of Basic Sciences, College of Osteopathic Medicine, Touro University Nevada, United States
- Department of Infectious Disease, Virginia Mason Medical Center, United States
- Department of Medicine, Section of Infectious Diseases, University of Washington, United States
- Cancer Virology Program, University of Pittsburgh Cancer Institute, University of Pittsburgh, United States
- Center for Immunity and Immunotherapies, Seattle Children's Research Institute, United States
- MRC Human Genetics Unit, Institute of Genetics and Molecular Medicine, University of Edinburgh, Western General Hospital, United Kingdom
Figures
Figure 1 with 2 supplements
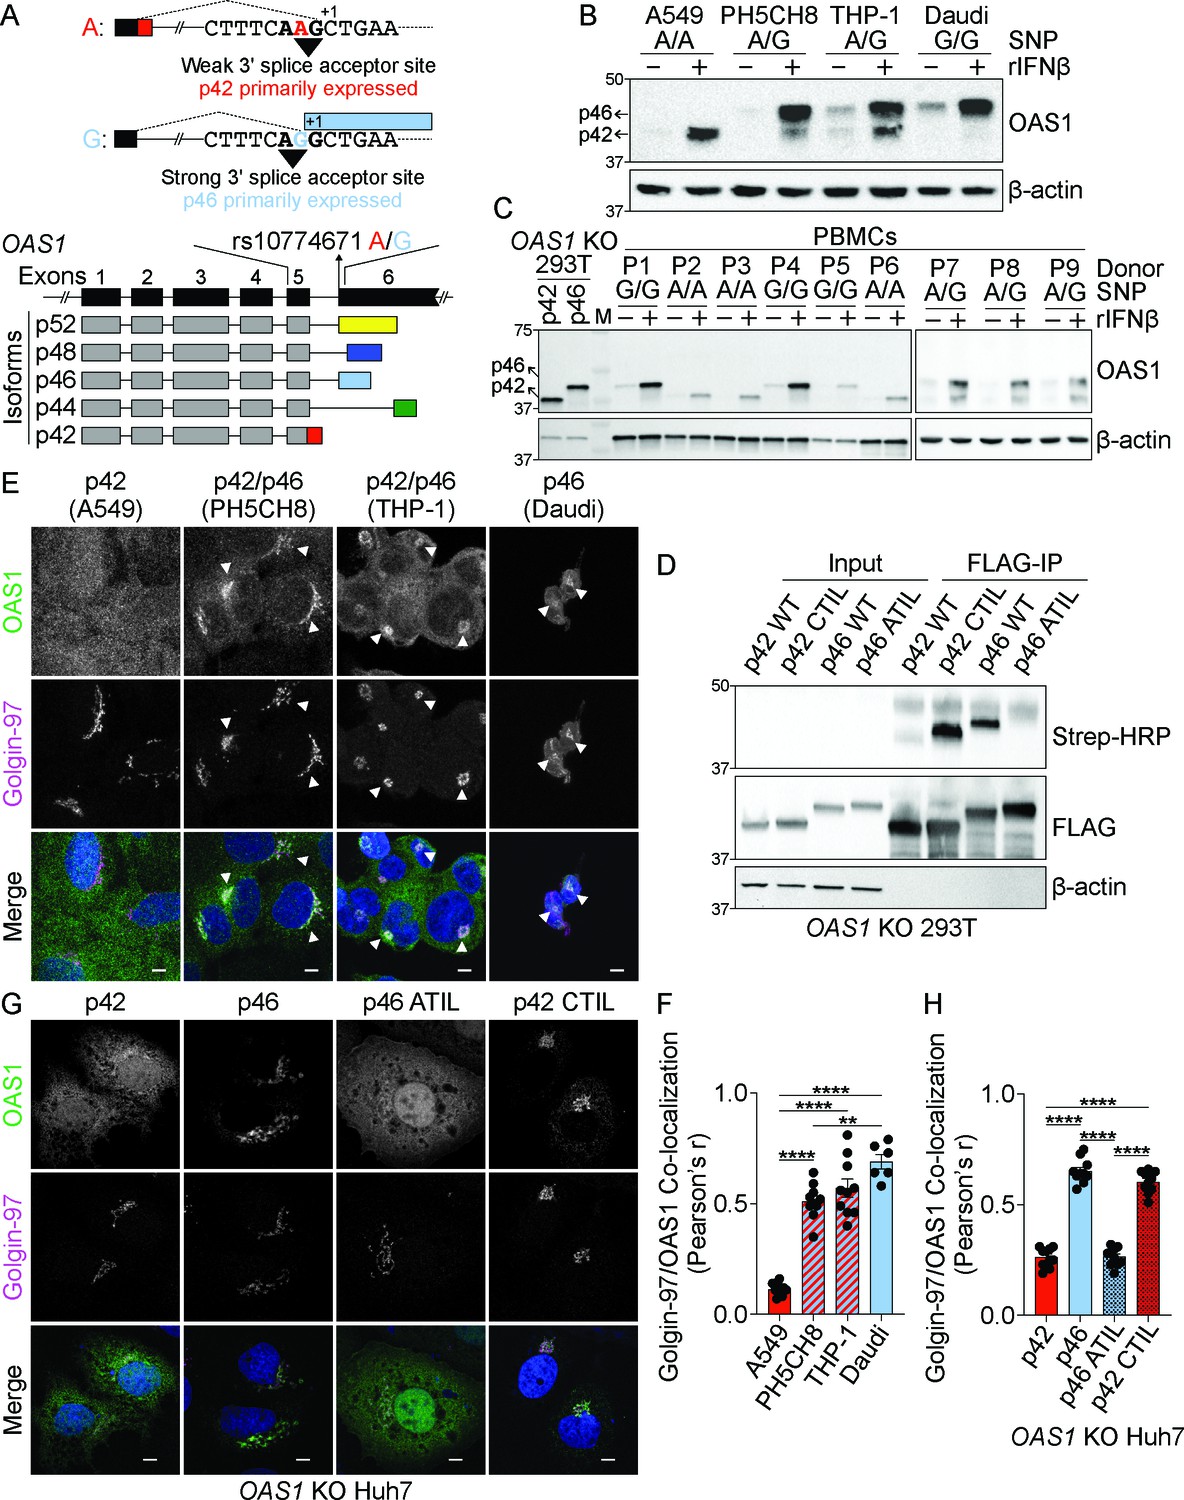
The p46 isoform of OAS1 is targeted to the endomembrane system.
(A) Differential C-terminal splicing of OAS1 creates isoform diversity. (B) Immunoblot analysis of OAS1 isoform expression across cell lines treated with 1000 U/mL rIFNβ for 24 hr (n=3). (C) Immunoblot analysis of OAS1 isoform expression in PBMCs from donors with indicated genotype at rs10774671 treated with 1000 U/mL rIFNβ for 24 hr. Ectopic expression of OAS1 p42 and p46 in OAS1 KO 293 T cells serves as control (three independent donors of each genotype depicted). (D) Immunoblot of OAS1 KO 293T whole cell lysate (left) and immunoprecipitated (right) FLAG-tagged p42, p46, p42CTIL, or p46ATIL constructs subjected to Click-chemistry reaction with geranylgeranyl azide and alkyne biotin; representative immunoblot of two independent experiments is shown. (E) Representative maximum intensity projections of the indicated cell lines treated with 1000 U/mL with rIFNβ for 24 hr followed by staining with anti-OAS1 antibody (green), anti-Golgin-97 (magenta), and DAPI (blue); representative cells from one out of three independently performed experiments are depicted. (F) Pearson’s correlation of OAS1 and Golgin-97 in individual cells from the indicated cell lines; each data point represents an individual cell from one representative experiment. (G) Representative confocal micrographs of OAS1 KO Huh7 transfected with constructs encoding p42, p46, p42CTIL, or p46ATIL stained with anti-OAS1 (green) and Golgin-97 (magenta) antibodies and DAPI (blue); (n=2). (H) Pearson’s correlation of OAS1 and Golgin-97 in OAS1 KO Huh7 cells expressing p42, p46, p42CTIL, or p46ATIL; each data point represents an individual cell of one representative experiment. Scale on micrographs in (E) and (G) = 5 μm. (F, H) Data were analyzed using one-way ANOVA with Tukey’s multiple comparisons test where **p<0.01, ****p<0001.
-
Figure 1—source data 1
Uncropped gels for the associated panels in Figure 1 and Figure 1—figure suppleent 2.
- https://cdn.elifesciences.org/articles/71047/elife-71047-fig1-data1-v2.zip
Figure 1—figure supplement 1
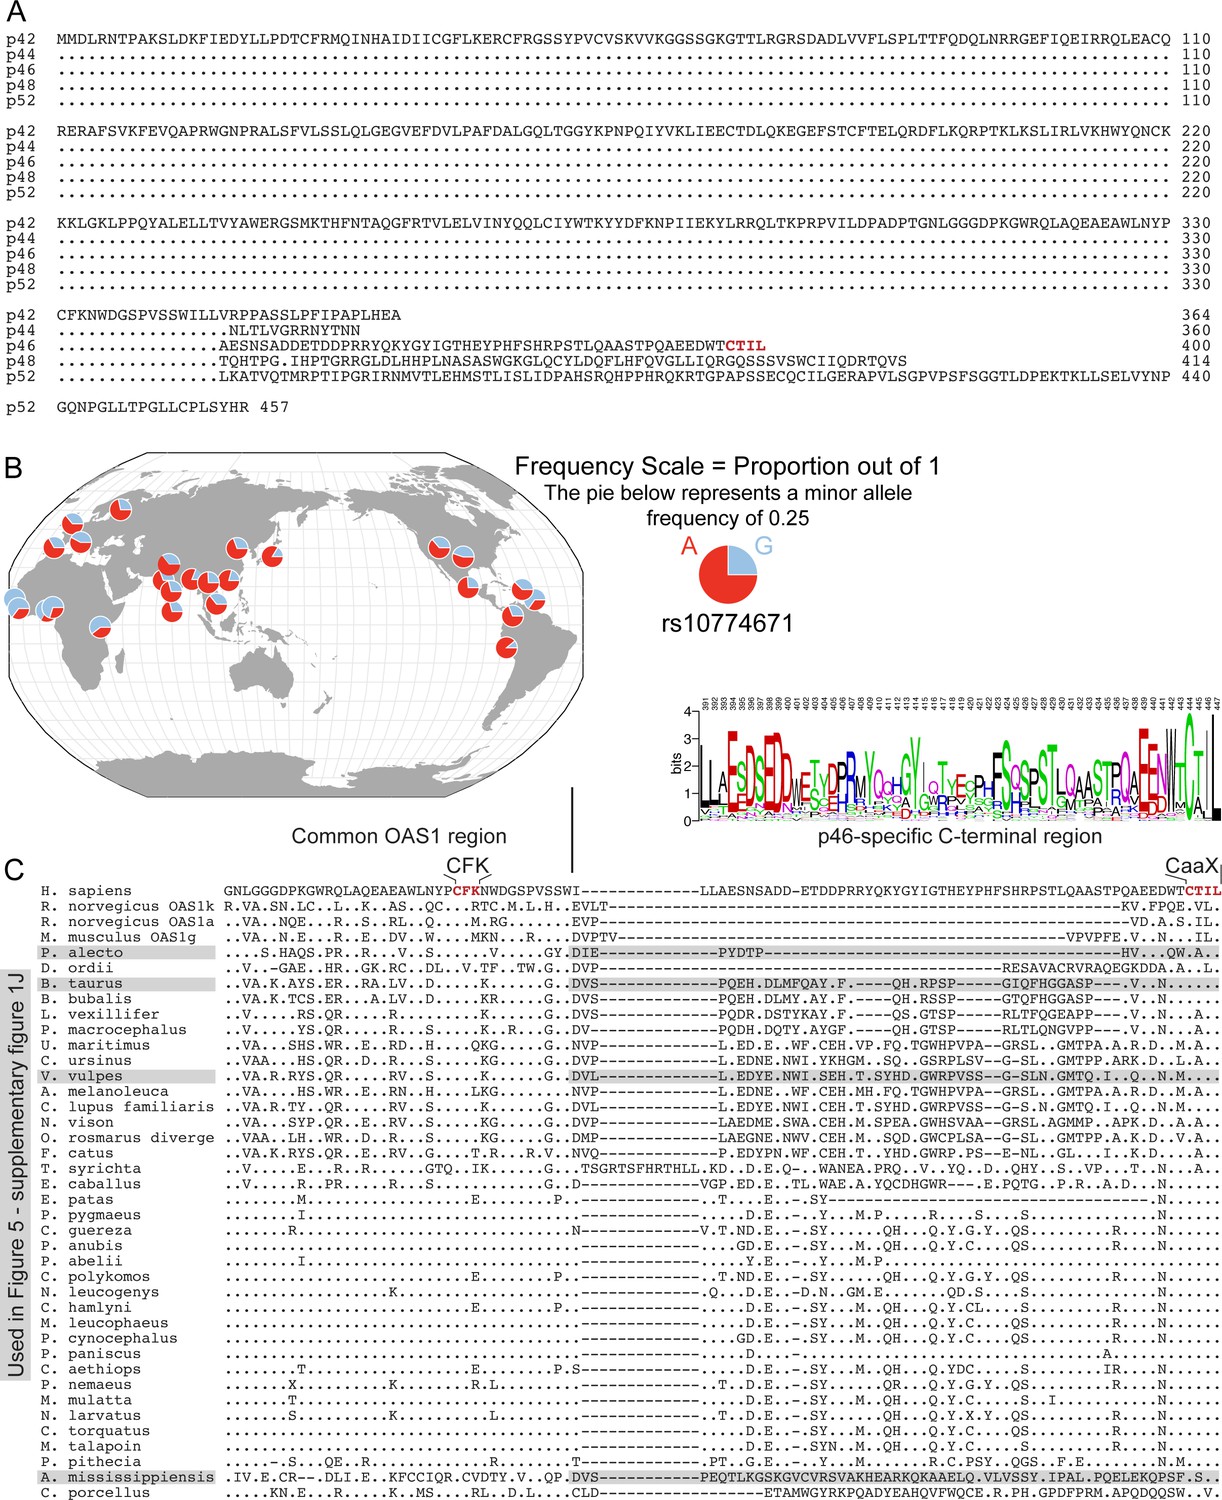
Alignment and sequence analysis of OAS1.
(A) Sequence alignment of human OAS1 isoforms. (B) Distribution of allelic frequency of rs10774671 (A/G) in the human population (http://popgen.uchicago.edu/ggv/) (Marcus and Novembre, 2017). (C) Sequence alignment of OAS1 p46 orthologous isoforms from different species. Homo sapiens P00973; Bos taurus F1MV66; Rattus norvegicus A0A0G2JU81; Rattus norvegicus Q05961; Mus musculus Q8K469; Ursus maritimus A0A384BY08; Pteropus alecto L5KWW0; Colobus guereza A0A3S7SJJ2; Papio anubis A0A3Q8HNT1; Pongo abelii B6RC73; Physeter macrocephalus A0A2Y9EML2; Pongo pygmaeus A0A3Q8HG13; Vulpes vulpes A0A3Q7TBS2; Colobus polykomos A0A1B1M0U9; Ailuropoda melanoleuca G1LPZ0; Equus caballus A0A3Q2L9T1; Neovison vison U6CVG6; Bubalus bubalis A0A2S1PHI8; Nomascus leucogenys A0A2I3H3E5; Cercopithecus hamlyni A0A1B1M0T4; Mandrillus leucophaeus A0A1B1M0W1; Felis catus M3VUI8; Papio cynocephalus A0A1B1M0W8; Pan paniscus B6RC68; Chlorocebus aethiops A0A3Q8HG02; Pygathrix nemaeus A0A1B1M0V1; Callorhinus ursinus A0A3Q7QFP7; Lipotes vexillifer A0A340Y9X3; Erythrocebus patas A0A1B1M0V2; Tarsius syrichta A0A1U7TU37; Macaca mulatta A4LAA0; Odobenus rosmarus divergens A0A2U3WN15; Nasalis larvatus A0A1B1M0T6; Cercocebus torquatus A0A1B1M0U1; Alligator mississippiensis A0A151NE69; Cavia porcellus A0A286X8S4; Dipodomys ordii A0A1S3FQL6; Canis lupus familiaris F1PLW6; Miopithecus talapoin A0A3S7SJS6; Pithecia pithecia A0A3Q8HGF7; Papio hamadryas A0A1B1M0W2.
Figure 1—figure supplement 2
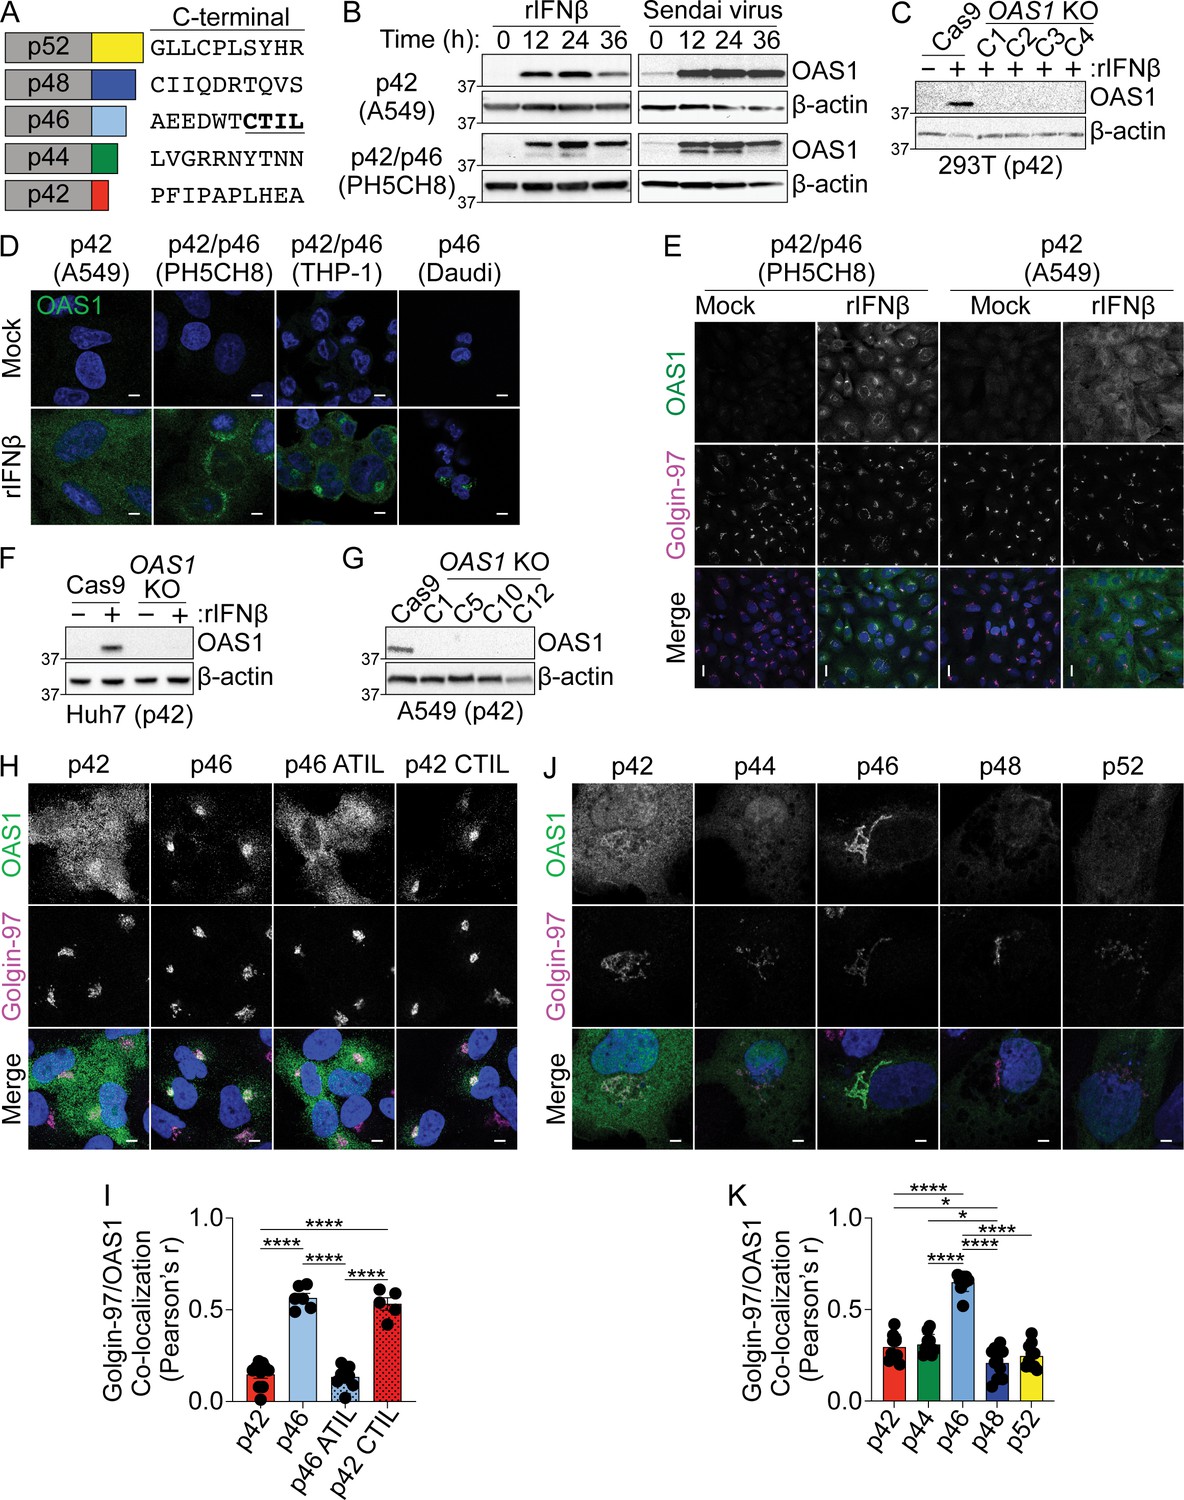
Biochemical and confocal analysis of human OAS1 isoforms.
(A) Human OAS1 isoforms with last 10 amino acids. (B) Immunoblot analysis of OAS1 expression in A549 and PH5CH8 cells following treatment with rIFNβ (1000 U/mL) or Sendai virus (100 HAU/mL) for the indicated times. (C) Immunoblot analysis of OAS1 expression in Cas9 and clonal OAS1 KO 293 T cells treated with rIFNβ (1000 U/mL) for 24 hr. (D) Confocal micrographs of the indicated cell lines treated with rIFNβ (1000 U/mL) for 24 hr followed by staining with anti-OAS1 antibody (green) and DAPI dye (blue). (E) Representative maximum intensity projections from the indicated cell lines treated with rIFNβ for 24 hr followed by staining with anti-OAS1 antibody (green), anti-Golgin-97 (magenta), and DAPI (blue). (F) Immunoblot analysis of OAS1 expression in Cas9 and polyclonal OAS1 KO Huh7 cells treated with rIFNβ (1000 U/mL) for 24 hr. (G) Immunoblot analysis of OAS1 expression in Cas9 and clonal OAS1 KO A549 cells treated with rIFNβ (1000 U/mL) for 24 hr. (H) Representative confocal micrographs of OAS1 KO A549 cells expressing dox-inducible p42, p46, p42CTIL, or p46ATIL stained with anti-OAS1 (green) and Golgin-97 (magenta) antibodies and DAPI (blue). (I) Pearson’s correlation of OAS1 and Golgin-97 in OAS1 KO A549 cells expressing p42, p46, p42CTIL, or p46ATIL. (J) Representative confocal micrographs of OAS1 KO Huh7 cells expressing p42, p44 p46, p48, or p52 stained with anti-OAS1 (green) and Golgin-97 (magenta) antibodies and DAPI (blue). (K) Pearson’s correlation of OAS1 and Golgin-97 in OAS1 KO Huh7 cells expressing p42, p44 p46, p48, or p52. Scale = 5 μm (D, H, J) and 20 µm (E). (I) and (K) Each data point represents an individual cell from one experiment. Data were analyzed using one-way ANOVA with Tukey’s multiple comparisons test where *p<0.05 and ****p<0.0001. (D, E, H) and (J) Representative cells from one out of three (D, E), two (H), and one (J) independently performed experiments are depicted.
Figure 2 with 1 supplement
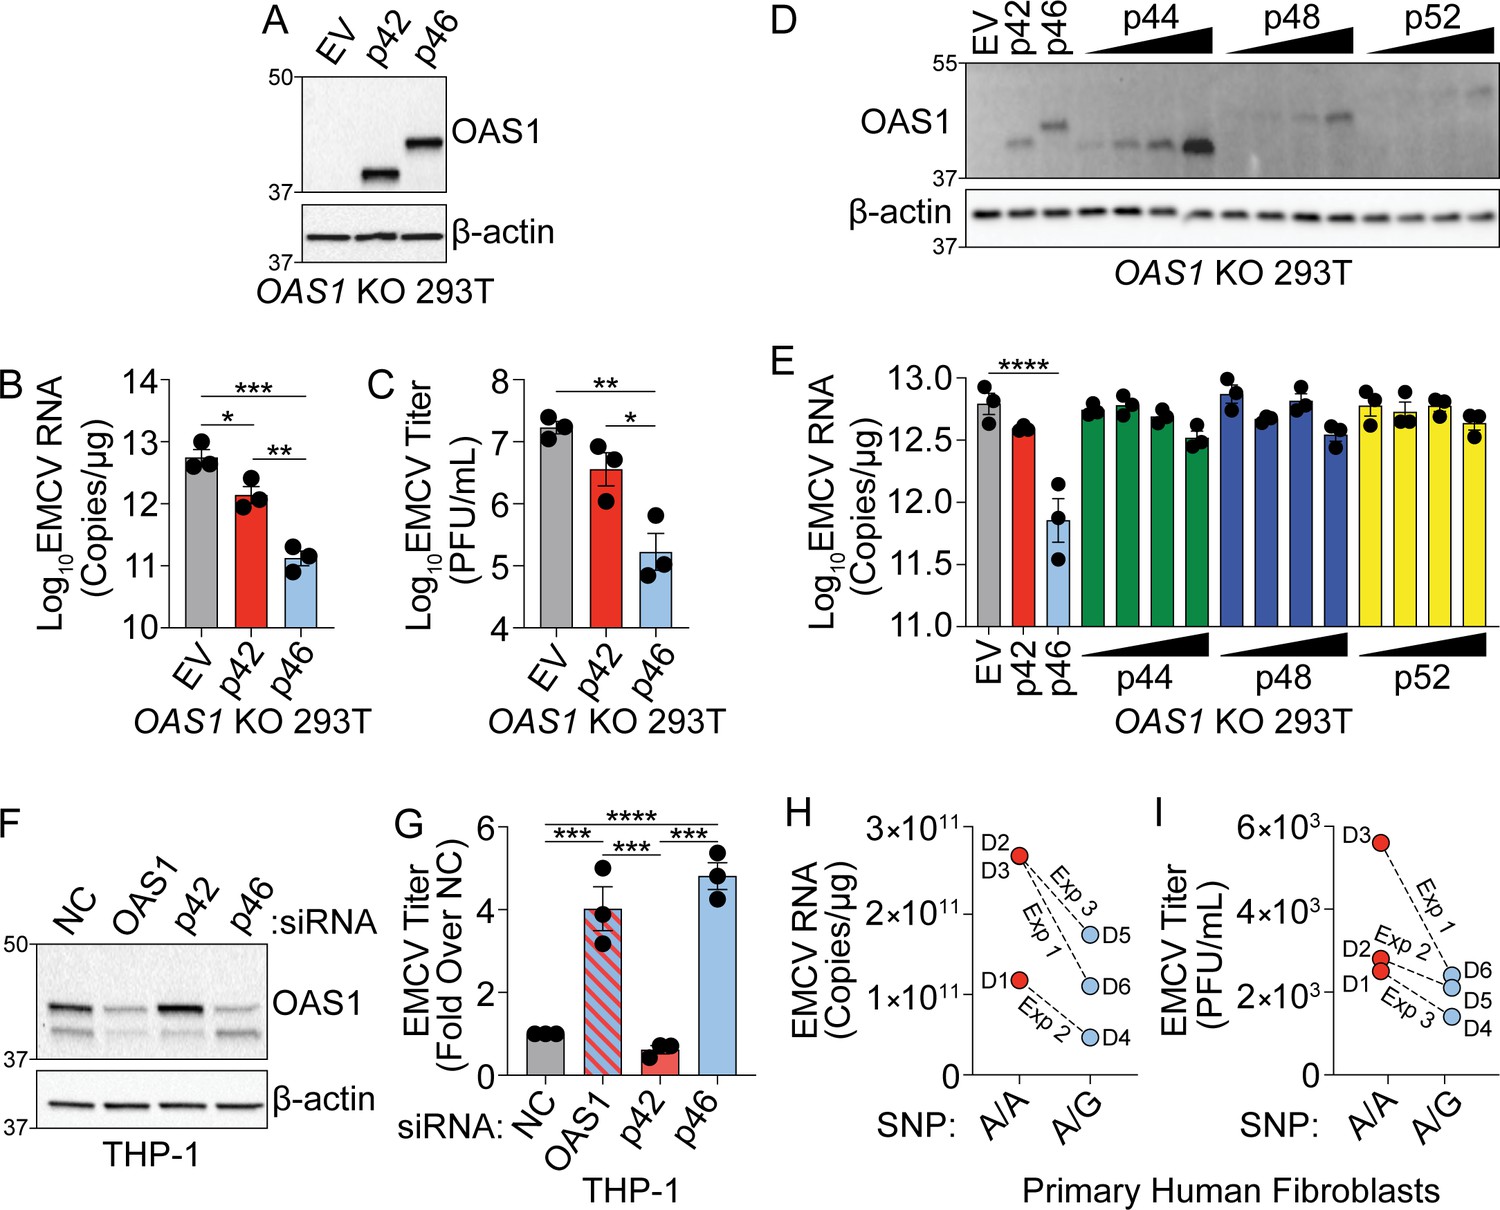
OAS1 isoforms are differentially antiviral.
(A) Immunoblot analysis of p42 and p46 in OAS1 KO 293 T cells at 24 hr post transfection. (B) Quantification of EMCV 5′UTR by RT-qPCR at 24 hr post-infection with EMCV (MOI=0.001) in OAS1 KO 293 T cells transfected with a control EV, p42, and p46. (C) Viral titers at 24 hr post-infection with EMCV (MOI=0.001) in OAS1 KO 293 T cells transfected with a control EV, p42, and p46. (D) Immunoblot analysis of OAS1 expression in OAS1 KO 293 T cells at 24 hr post transfection with EV (500 ng), p42 (100 ng), p46 (100 ng), or 200, 350, or 500 ng of the corresponding catalytic mutant (500 ng DNA total in each transfection). (E) Quantification of EMCV 5′UTR in OAS1 KO 293T transfected as in (A) for 24 hr followed by EMCV infection for 24 hr (MOI=0.001). (F) Immunoblot of OAS1 in PMA-differentiated THP-1 macrophages infected with EMCV (MOI=1, 24 hr) 24 hr post transfection with a non-targeting control siRNA (siNC) or siRNAs against total OAS1, p42, or p46. (G) Viral titers at 24 hr post EMCV infection (MOI=1) taken from PMA-differentiated THP-1 macrophages transfected with siNC, siOAS, sip42, or sip46. (H) Quantification of EMCV 5′UTR by RT-qPCR and (I) viral titers from primary human fibroblasts pre-treated with 25 U/mL rIFNβ for 24 hr prior to EMCV infection (MOI=0.01) for 24 hr; three independent experiments with paired donors of each genotype (A/A vs. A/G) are shown. (B, C), and (G) Data were analyzed using one-way ANOVA with Tukey’s multiple comparisons test where *p<0.05, **p<0.01, ***p<0.001, ****p<0.0001. For (E) data were analyzed using a one-way ANOVA with Dunnett’s multiple comparisons test (vs. EV) where ****p<0.0001. (A, D) and (F) Representative immunoblots of three independent experiments are shown. (B, C, E) and (G) Each data point represents an independently performed experiment. (H) and (I) Each data point represents an individual donor from three independently performed experiments (one donor pair per experiment).
-
Figure 2—source data 1
Uncropped gels for the associated panels in Figure 2.
- https://cdn.elifesciences.org/articles/71047/elife-71047-fig2-data1-v2.zip
Figure 2—figure supplement 1
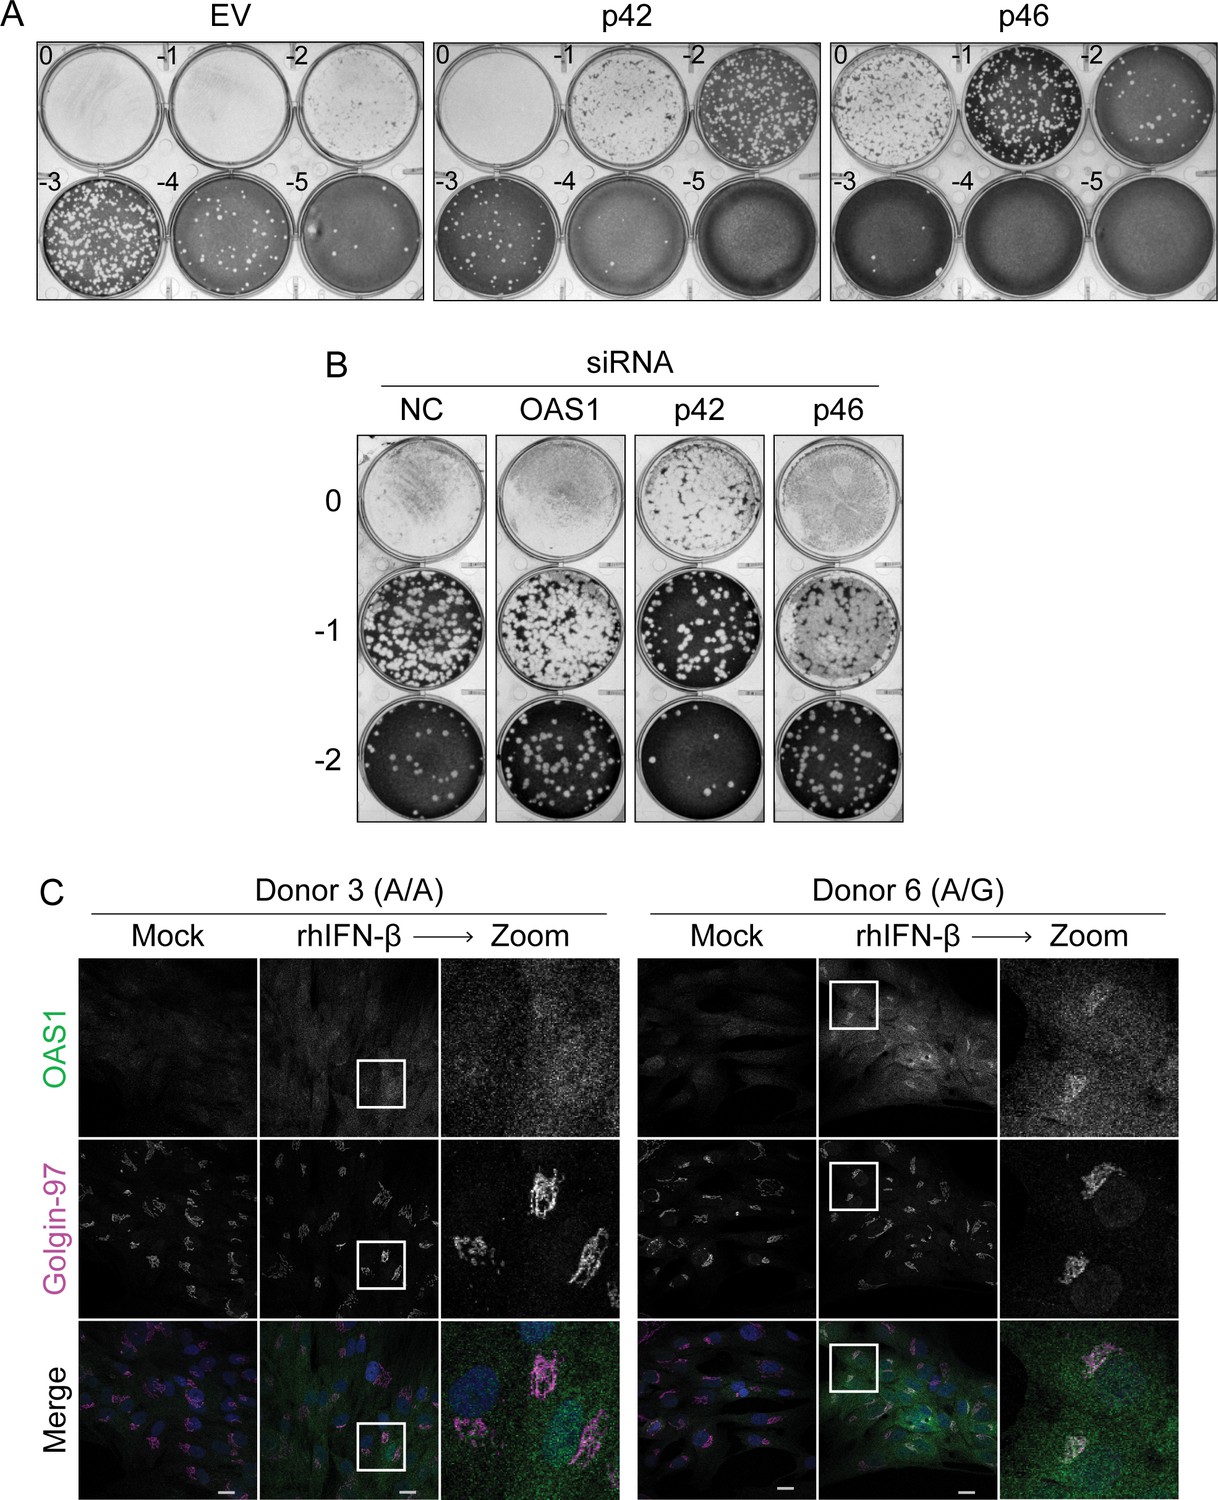
Antiviral activity of human OAS1 isoforms.
(A) Representative plaque assay plates from the data in shown in Figure 2C. (B) Representative plaque assay plates from data shown in Figure 2G. (C) Representative confocal micrographs of primary human fibroblasts (donor 3, A/A; donor 6, A/G) treated with 1000 U/mL rIFNβ for 24 hr followed by staining with anti-OAS1 antibody (green), anti-Golgin-97 (magenta), and DAPI (blue). Scale = 20 μm.
Figure 3 with 1 supplement

OAS1 isoforms require catalytic and RNase L activity.
(A) Expression of OAS1 p42 and p46 along with their corresponding catalytic mutants (250 ng) at 24 hr post transfection in OAS1 KO 293 T cells. (B) Quantification of EMCV 5′UTR by RT-qPCR in OAS1 KO 293 T cells expressing a control EV, p42, p46, or their corresponding catalytic mutants (250 ng) at 24 hr post EMCV infection (MOI=0.001). (C) Viral titers at 24 hr post EMCV infection (MOI=0.001) taken from OAS1 KO 293 T cells transfected with a control EV, p42, p46, or their corresponding catalytic mutants. (D) Immunoblot analysis of OAS1 and RNase L at 24 hr post transfection in Cas9 or RNASEL KO 293 T cells. (E) Quantification of EMCV 5′UTR by RT-qPCR in Cas9 and RNASEL KO 293 T cells expressing a control EV, p42, or p46 at 24 hr post EMCV infection (MOI=0.001). (F) Viral titers at 24 hr post-infection with EMCV (MOI=0.001) taken from Cas9 or RNASEL KO 293 T cells transfected with control EV, p42, or p46. (G) In vitro 2′−5′A synthesis assay of OAS1 p42 and p46 isoforms and their CaaX motif mutants; a representative blot of two independently performed experiments is depicted. (H) Immunoblot analysis of OAS1 and IRF3 in WT or IRF3 KO 293FT cells at 24 hr post transfection. (I) Quantification of EMCV 5′UTR 24 hr post EMCV infection (MOI=0.001) in WT or IRF3 KO 293FT cells transfected with a control EV, p42, or p46. (B, C, E, F) and (I) each data point represents an independently performed experiment. Data were analyzed using one-way ANOVA with Tukey’s multiple comparisons test where *p<0.05, **p<0.01, ***p<0.001, ****p<0.0001. (A, D) and (H) Representative immunoblots of three (A, H) and five (D) independent experiments are shown.
-
Figure 3—source data 1
Uncropped gels for the associated panels in Figure 3 and Figure 3—figure supplement 1.
- https://cdn.elifesciences.org/articles/71047/elife-71047-fig3-data1-v2.zip
Figure 3—figure supplement 1
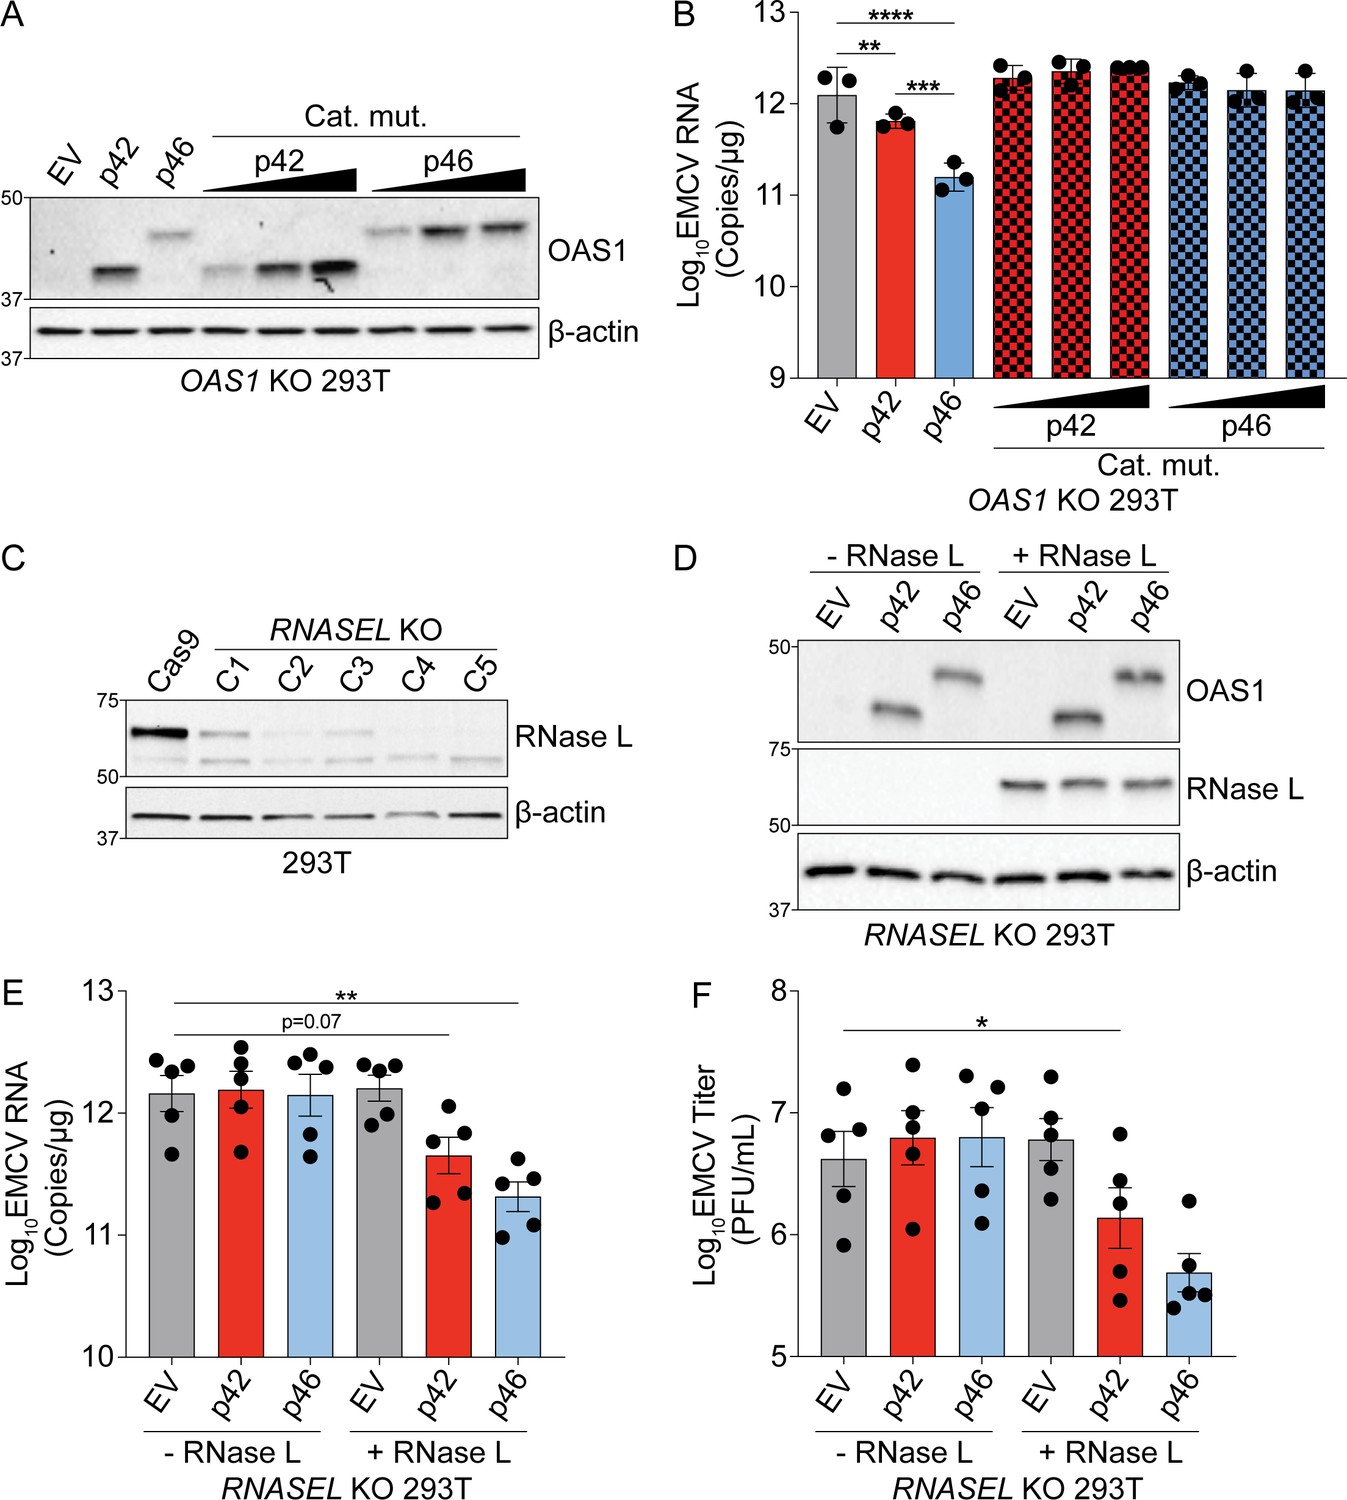
RNase L-dependent activity of OAS1 isoforms.
(A) Expression of OAS1 p42 and p46 along with their corresponding catalytic mutants at 24 hr post transfection in OAS1 KO 293 T cells. (B) Quantification of EMCV 5′UTR by RT-qPCR from OAS1 KO 293 T cells expressing a control EV, p42, p46, or their corresponding catalytic mutants at 24 hr post EMCV infection (MOI=0.001). (C) Immunoblot analysis of RNase L expression in Cas9 and clonal RNASEL KO 293 T cells. Clone five was used for subsequent experiments. (D) Immunoblot analysis of OAS1 and RNase L expression in RNASEL KO 293 T cells at 24 hr post transfection with EV, p42, p46 with or without an RNase L expression plasmid. (E) Quantification of EMCV 5′UTR or (F) EMCV titers from RNASEL KO 293 T cells transfected as in (D) followed by infection with EMCV for 24 hr (MOI=0.001). (E) and (F) Data were analyzed using a one-way ANOVA with Dunnett’s multiple comparisons test where *p<0.05, **p<0.01, ***p<0.001, ****p<0.0001. (A) and (D) Representative immunoblots of (A) three and (D) five independently performed experiments are shown. (B, E) and (F) Each data point represents an independently performed experiment.
Figure 4 with 1 supplement
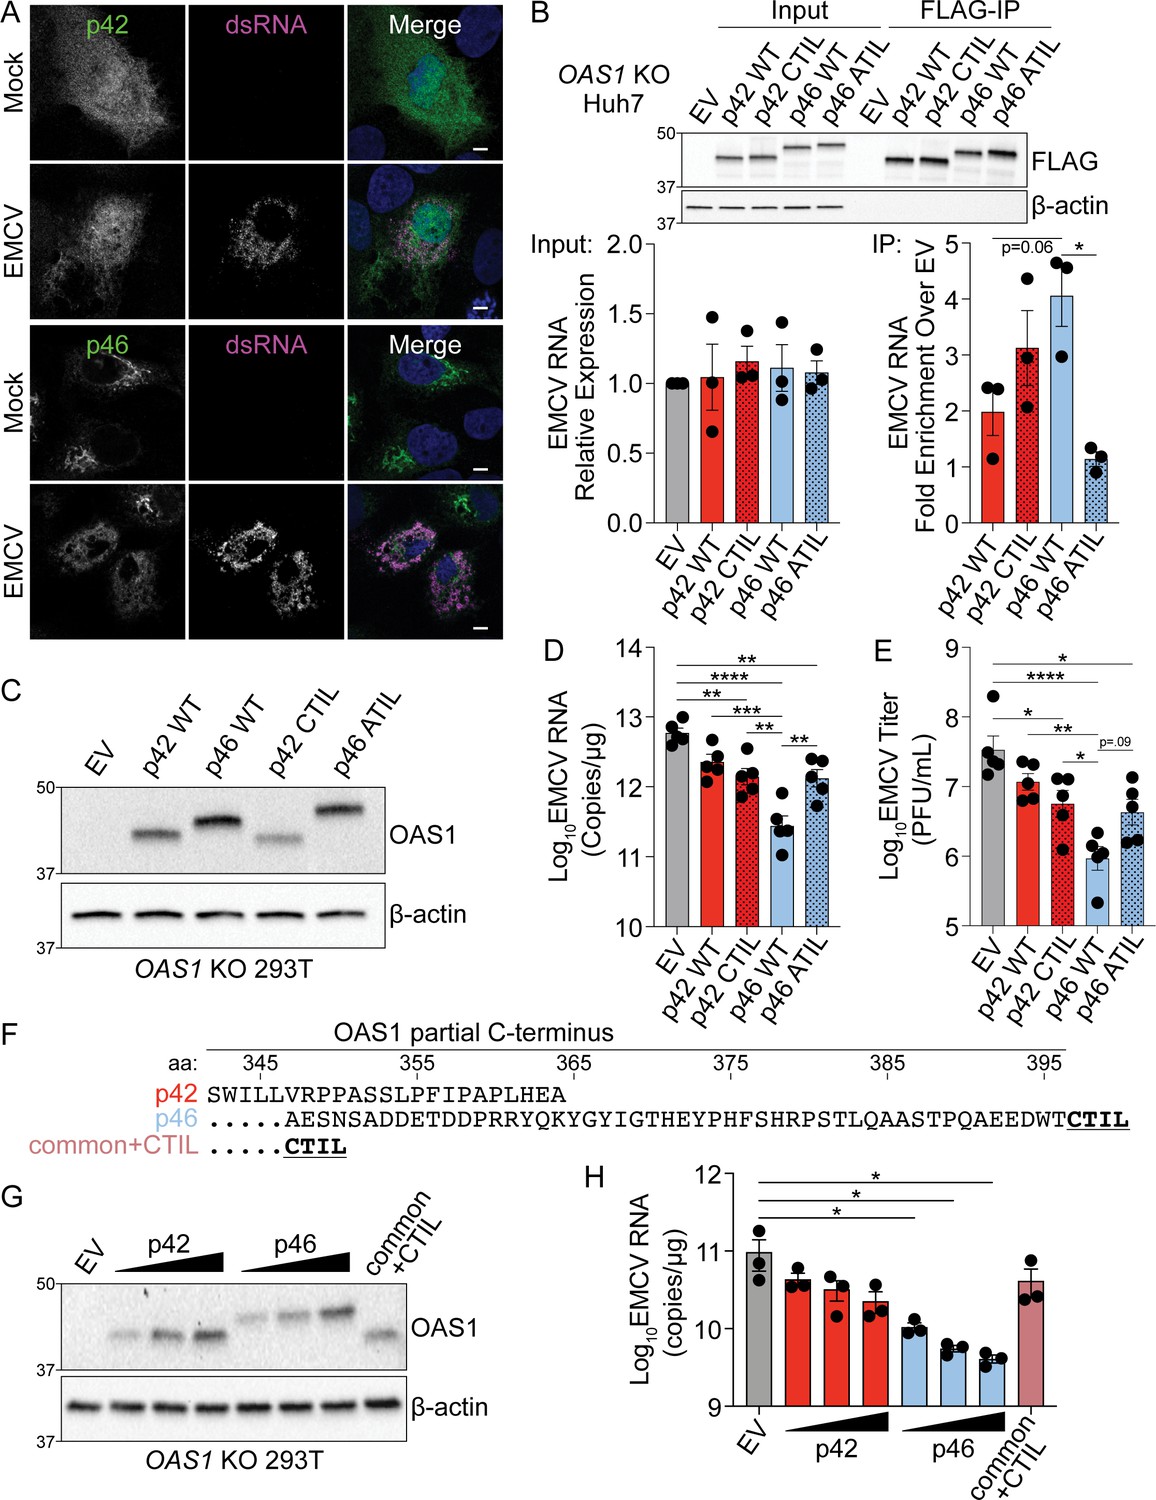
Endomembrane targeting of OAS1 p46 through the CaaX motif enhances access to viral RNA.
(A) Confocal micrographs from mock or EMCV infected (MOI=0.001, 12 hr) OAS1 KO Huh7 cells ectopically expressing p42 or p46 and stained with anti-OAS1 (green) and anti-dsRNA (magenta) antibodies and DAPI (blue); representative cells from one out of two independently performed experiments are depicted. (B) Immunoblot of FLAG immunoprecipitation performed on OAS1 KO Huh7 cells expressing control EV, FLAG-p42, FLAG-p42CTIL, FLAG-p46, and FLAG-p46ATIL. Quantification of EMCV 5′UTR via RT-qPCR in the input or after RNA immunoprecipitation performed on OAS1 KO Huh7 cells transfected with control EV, FLAG-p42, FLAG-p42CTIL, FLAG-p46, and FLAG-p46ATIL infected with EMCV (MOI=0.001, 12 hr). (C) Immunoblot analysis of p42, p46, p42CTIL, and p46ATIL in OAS1 KO 293 T cells at 24 hr post transfection. (D) Quantification of EMCV 5′UTR by RT-qPCR from OAS1 KO 293T expressing a control EV, p42, p46, p42CTIL, or p46ATIL at 24 hr post EMCV infection (MOI=0.001). (E) Viral titers quantified at 24 hr post-infection with EMCV at an MOI of 0.001 in OAS1 KO 293 T cells transfected with control EV, p42, p46, p42CTIL, or p46ATIL. (F) Alignment of C-termini of expression constructs used in (G) and (H). (G) Immunoblot analysis of p42 (50 ng, 100 ng, 200 ng), p46 (50 ng, 100 ng, 200 ng) and common +CTIL (500 ng) in OAS1 KO 293 T cells at 24 hr post transfection. (H) Quantification of EMCV 5′UTR by RT-qPCR from OAS1 KO 293 T cells transfected as in (G) at 24 hr post EMCV infection (MOI=0.001). Scale = 5 μm. (B, D), and (E) Data were analyzed using one-way ANOVA with Tukey’s multiple comparisons test where *p<0.05, **p<0.01, ***p<0.001, ****p<000.1. (H) Data were analyzed using a one-way ANOVA with Dunnett’s multiple comparisons test (vs. EV) where *p<0.05. (B, C) and (G) Representative immunoblots of three (B, G) and five (C) independent experiments are shown. (B, D) and (H) Each data point represents an independently performed experiment.
-
Figure 4—source data 1
Uncropped gels for the associated panels in Figure 4 and Figure 4—figure suppleent 1.
- https://cdn.elifesciences.org/articles/71047/elife-71047-fig4-data1-v2.zip
Figure 4—figure supplement 1
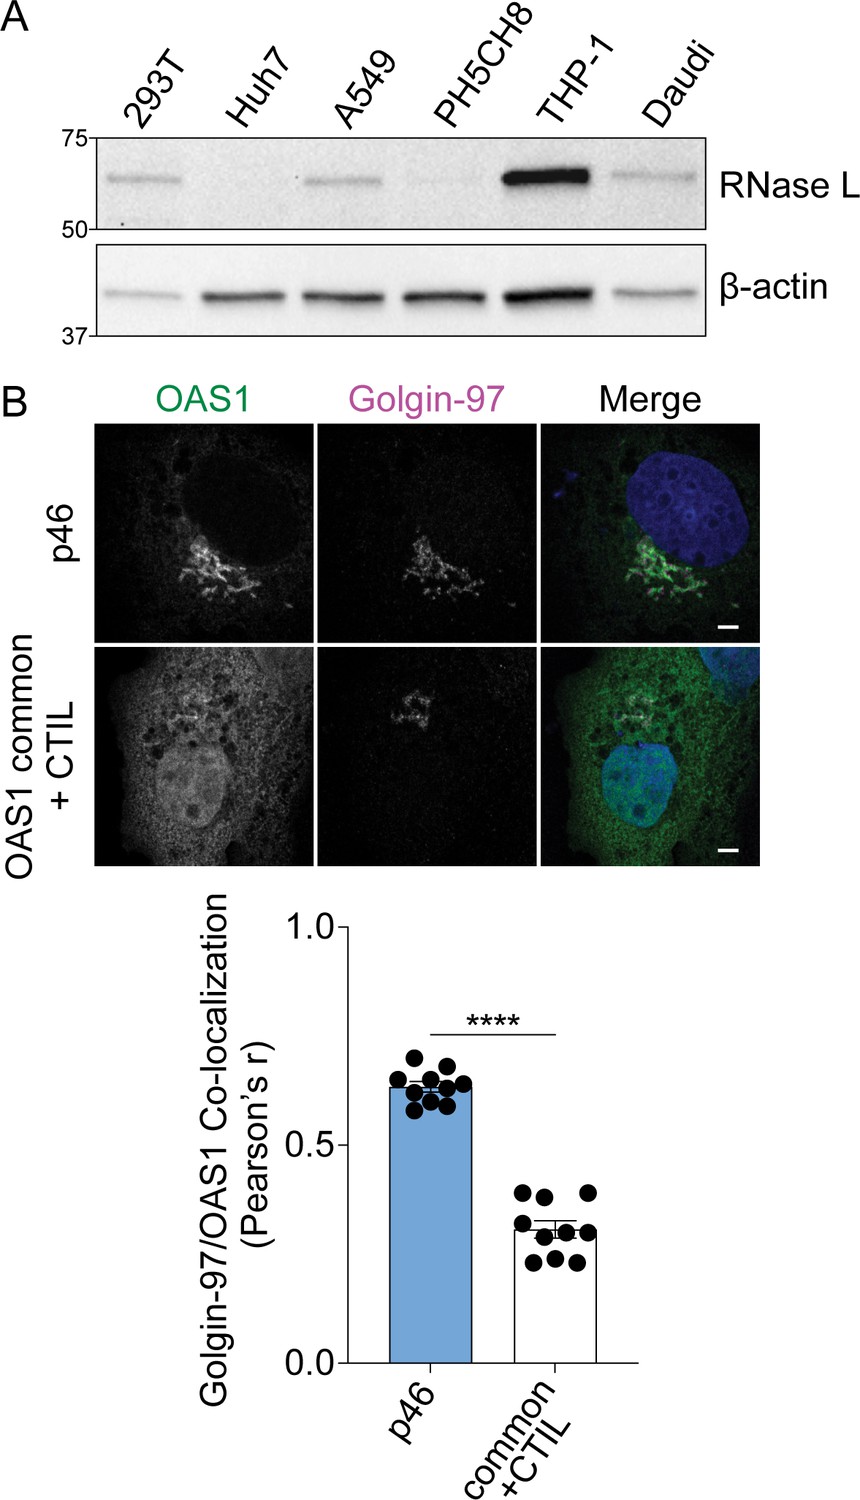
Role of CaaX motif in OAS1 localization.
(A) Immunoblot of RNase L expression in untreated cell lines. (B) Representative confocal micrographs of OAS1 KO Huh7 cells expressing OAS1 p46 and OAS1 common +CTIL stained with anti-OAS1 (green) and Golgin-97 (magenta) antibodies and DAPI (blue). Co-localization of OAS1 and Golgin-97 is shown as Pearson’s correlation. Scale = 5 μm. Data were analyzed by unpaired t test where ****p<0.0001. Each data point represents an individual cells of one experiment.
Figure 5 with 1 supplement

Combined effects of CaaX motif, C-terminus length and oligomerization domain confer differential antiviral activity of OAS1 isoforms.
(A) C-termini of OAS1 p46 alanine substitution mutants 1–9. (B) Immunoblot of control EV, p46, p46ATIL, and p46 alanine substitution mutants 1–9 in OAS1 KO 293 T cells at 24 hr post transfection. (C) Quantification of EMCV 5´UTR by RT-qPCR from OAS1 KO 293 T cells expressing a control EV, p46, p46ATIL, and p46 alanine substitution mutants 1–9 at 24 hr post EMCV infection (MOI=0.001). (D) Immunoblot of control EV, p42, p42 CFK mutant, p46, and p46 CFK mutant in OAS1 KO 293 T cells at 24 hr post transfection. (E) Quantification of EMCV 5´UTR by RT-qPCR from OAS1 KO 293 T cells expressing a control EV, p42, p42 CFK mutant, p46, and p46 CFK mutant at 24 hr post EMCV infection (MOI=0.001). (F) Alignment of C-termini of OAS1 p46, p46 truncation mutants Δ12aa, Δ22aa, and Δ32aa, and p42CTIL. (G) Immunoblot of control EV, p46, p46 truncation mutants Δ12aa, Δ22aa, and Δ32aa, and p42CTIL in OAS1 KO 293 T cells at 24 hr post transfection. (H) Quantification of EMCV 5´UTR by RT-qPCR from OAS1 KO 293 T cells expressing EV, p46, p46 truncation mutants Δ12aa, Δ22aa, and Δ32aa, and p42CTIL at 24 hr post EMCV infection (MOI=0.001). (C) and (H) Data were analyzed by one-way ANOVA with Dunnett’s multiple comparisons test (vs. p46) where *p<0.05, and **p<0.01. (D). For (E) data were analyzed using one-way ANOVA with Tukey’s multiple comparisons test where **p<0.01, and ***p<0.001 and ****p<0.001. (B, D) and (G) Representative immunoblots of three independently performed experiments are shown. (C, E) and (H) Each data point represents an independently performed experiment.
-
Figure 5—source data 1
Uncropped gels for the associated panels in Figure 5 and Figure 5—figure suppleent 1.
- https://cdn.elifesciences.org/articles/71047/elife-71047-fig5-data1-v2.zip
Figure 5—figure supplement 1
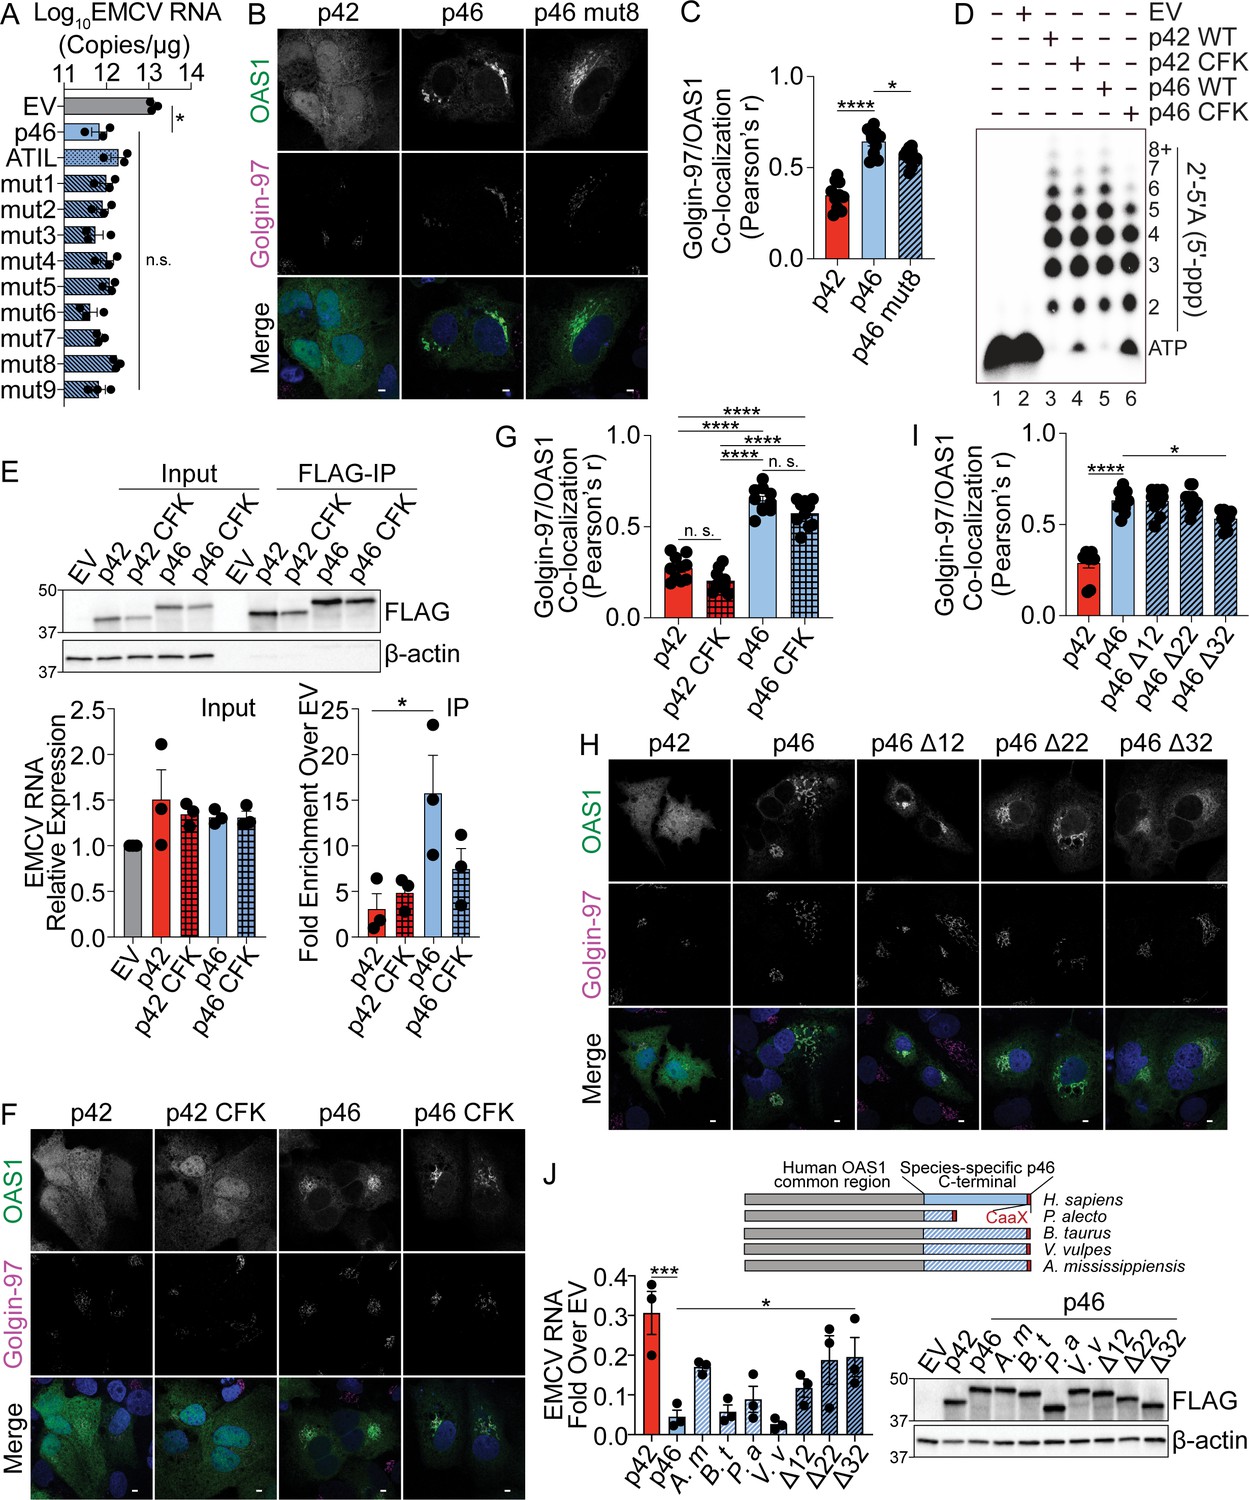
Enhanced antiviral activity of OAS1 p46 is mediated by p46-specific coding region.
(A) Quantification of EMCV 5´UTR copies by RT-qPCR from OAS1 KO 293 T cells expressing control EV, p46, p46ATIL, and p46 alanine substitution mutants 1–9 at 24 hr post EMCV infection (MOI=0.001). (B) Representative confocal micrographs of OAS1 KO Huh7 cells expressing p42, p46, or p46 mut8 stained with anti-OAS1 (green) and Golgin-97 (magenta) antibodies and DAPI (blue). (C) OAS1 and Golgin-97 co-localization from (B) expressed as Pearson’s correlation. (D) In vitro 2′−5′A synthesis assay of OAS1 p42 and p46 isoforms and their CFK motif mutants; a representative blot of two independently performed experiments is depicted. (E) Representative immunoblot of FLAG immunoprecipitation performed on OAS1 KO Huh7 cells expressing control FLAG-EV, FLAG-p42, FLAG-p42CFK, FLAG-p46, and FLAG-p46CFK. Quantification of EMCV 5′UTR via RT-qPCR in the input or after RNA immunoprecipitation performed on OAS1 KO Huh7 cells expressing FLAG-EV, FLAG-p42, FLAG-p42CFK, FLAG-p46, and FLAG-p46CFK infected with EMCV (MOI=0.001, 12 hr). (F) Representative confocal micrographs of OAS1 KO Huh7 cells expressing p42, p42 CFK, p46, or p46 CFK stained with anti-OAS1 (green) and Golgin-97 (magenta) antibodies and DAPI (blue). (G) OAS1 and Golgin-97 co-localization from (F) expressed as Pearson’s correlation. (H) Representative confocal micrographs of OAS1 KO Huh7 cells expressing OAS1 p42, p46, p46 Δ12, p46 Δ22, or p46 Δ32 stained with anti-OAS1 (green) and Golgin-97 (magenta) antibodies and DAPI (blue). (I) OAS1 and Golgin-97 co-localization from (H) expressed as Pearson’s correlation. (J) Alignment of OAS1 p46 chimeric isoforms with C-termini from different species. OAS1 KO 293 T cells expressing chimeric OAS1 p46 isoforms were infected with EMCV (MOI=0.001) and EMCV RNA was quantified at 24 hr post-infection. Equal expression of chimeric p46 proteins was confirmed by Western blot. (A, C, I) and (J) Data were analyzed by one-way ANOVA with Dunnett’s multiple comparisons test (vs. p46). (E) and (G) Data were analyzed by one-way ANOVA with Tukey’s multiple comparisons test. *p<0.05, **p<0.01 and ****p<0.0001. n.s. = not significant. Scale = 5 μm. (A, E), and (J) Each data point represents an independently performed experiment. (C, G), and (I) Each data point represents an individual cell from one experiment depicted in (B, F, H).
Figure 6 with 1 supplement
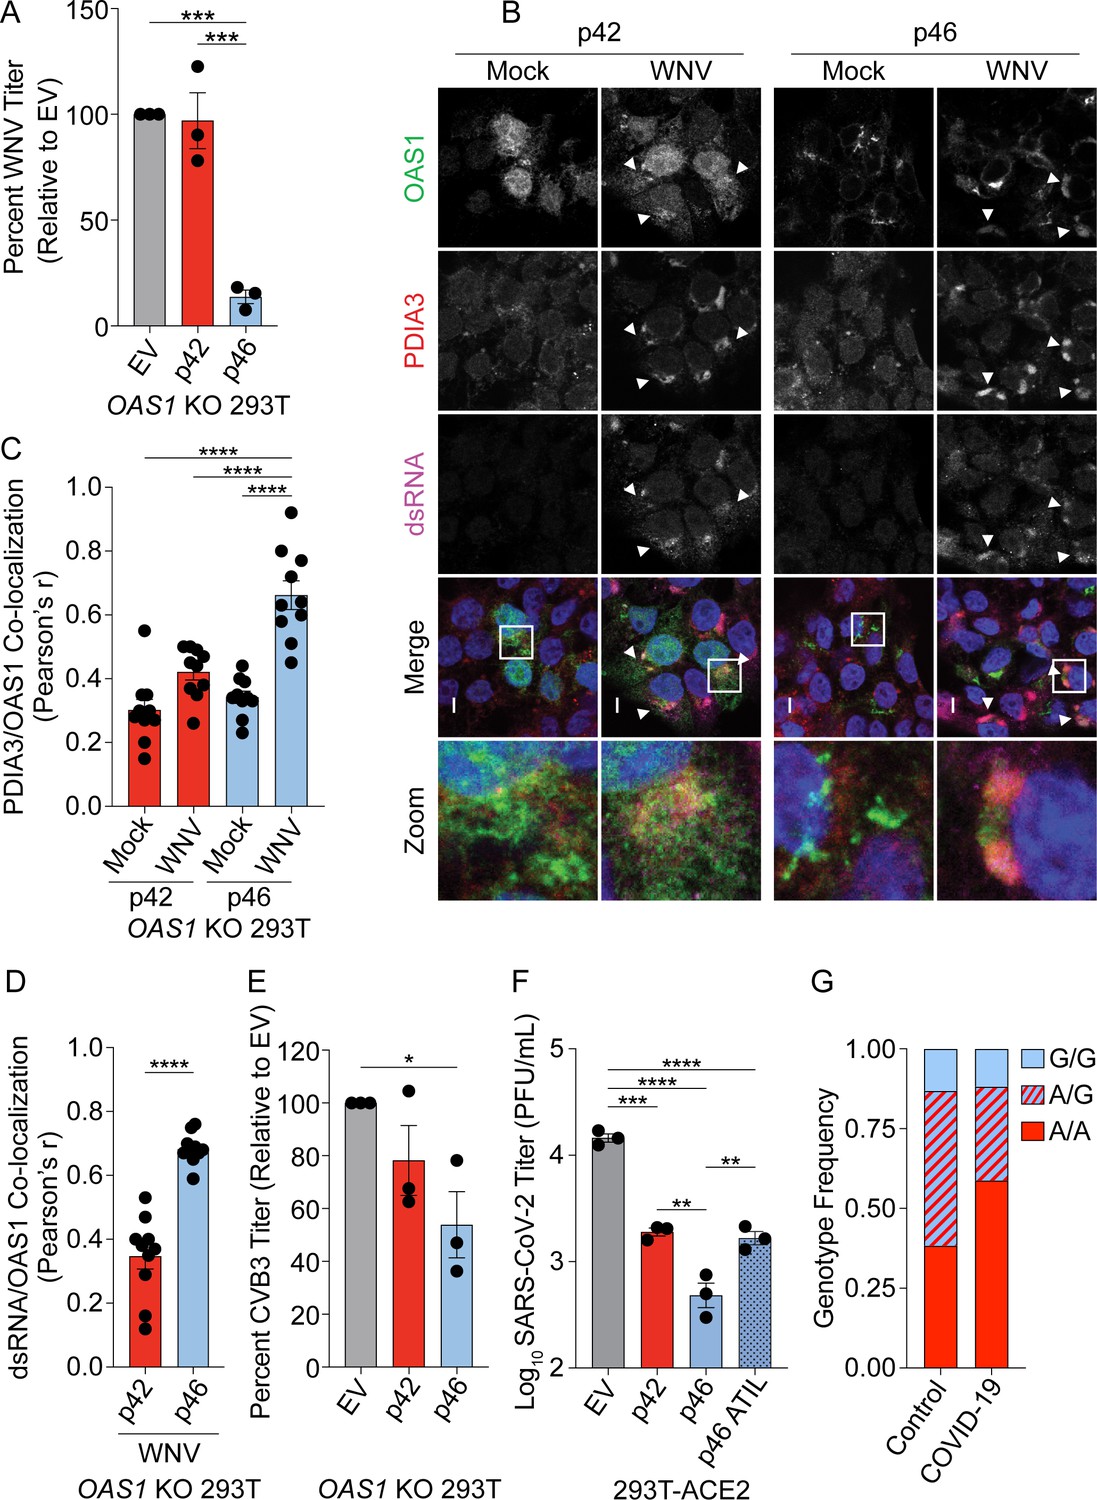
OAS1 p46 has broad antiviral activity against viruses that use the endomembrane system for replication.
(A) WNV Texas titers (percent titer normalized to EV) 48 hr post WNV infection (MOI=0.001) taken from OAS1 KO 293 T cells transfected with control EV, p42, and p46. (B) Representative confocal micrographs from mock or WNV Texas (MOI=1, 24 hr) infected OAS1 KO 293 T cells expressing p42 or p46 and stained with DAPI (blue) and anti-OAS1 (green), PDIA3 (red), and dsRNA (magenta) antibodies; scale = 5 μm. (C, D) Pearson’s correlation of OAS1 and (C) PDIA3 and (D) dsRNA; each data point represents an individual cell of one representative experiment. (E) CVB3 titers (percent titer normalized to EV) 48 hr post CVB3 infection (MOI=0.001) in OAS1 KO 293 T cells transfected with a control EV, p42, or p46. (F) SARS-CoV-2 titers taken at 48 hr post-infection (MOI=0.1) from ACE2 293 T cells expressing EV, p42, p46, or p46ATIL for 24 hr. (G) OAS1 rs10774671 genotype frequency in severe COVID-19 cohort and matched healthy control subjects. (A) (C) (E) and (F) Data were analyzed using one-way ANOVA with Tukey’s multiple comparisons test where *p<0.05, **p<0.01, ***p<0.001, ****p<000.1 (B) Representative cells from one of two independently performed experiments are depicted. (D) Data were analyzed by unpaired t test where ****p<0.0001. (A), (E) and (F) Each data point represents an independently performed experiment.
-
Figure 6—source data 1
Excel file with the summary statistics for the association analysis for Figure 6G.
- https://cdn.elifesciences.org/articles/71047/elife-71047-fig6-data1-v2.xlsx
Figure 6—figure supplement 1
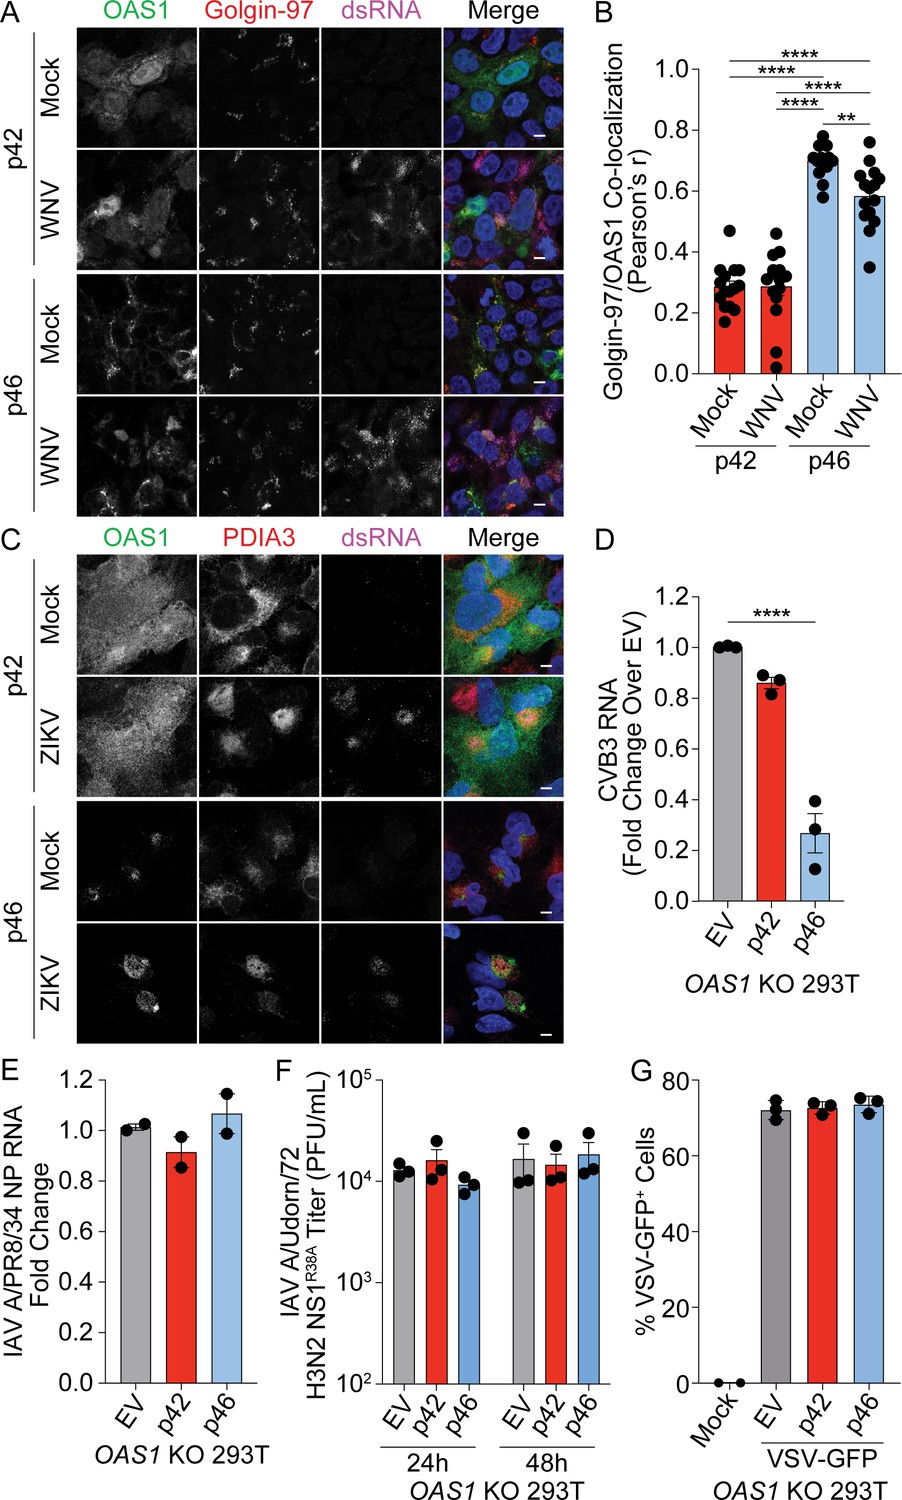
Endomembrane targeting of OAS1 p46 confers its enhanced antiviral activity.
(A) Representative confocal micrographs from mock or WNV Texas (MOI=1, 24 hr) infected OAS1 KO 293 T cells expressing p42 or p46 and stained with DAPI (blue) and anti-OAS1 (green), Golgin-97 (red), and dsRNA (magenta) antibodies. (B) Pearson’s correlation of OAS1 and Golgin-97; each data point represents an individual cells of one experiment. (C) Representative confocal micrographs from mock or ZIKV MR766 (MOI=5, 24 hr) infected OAS1 KO A549 cells expressing p42 or p46 and stained with DAPI (blue) and anti-OAS1 (green), PDIA3 (red), and dsRNA (magenta) antibodies. (D) Relative quantification of CVB3 RNA in EV, p42, or p46 expressing OAS1 KO 293 T cells infected with CVB3 (MOI=0.001, 24 hr). (E) Relative quantification of influenza A virus A/PR/8/34 NP RNA in EV, p42, or p46 expressing OAS1 KO 293 T cells infected with IAV A/PR/8/34 (MOI=0.01, 24 hr). (F) Viral titers from OAS1 KO 293 T cells expressing EV, p42, or p46, infected with IAV A/Udorn/72 H3N2 R38A (MOI=0.01). (G) Quantification of VSV-GFP+ OAS1 KO 293 T cells expressing EV, p42, or p46 (MOI=0.1, 6 hr). Scale = 5 μm. (B, D, E, F) and (G) Data were analyzed using one-way ANOVA with Tukey’s multiple comparisons test where **p<0.01 and ****p<0.0001. (A and C) Representative cells from one experiment are depicted. (D, E, F) and (G) Each data point represents an independently performed experiment.
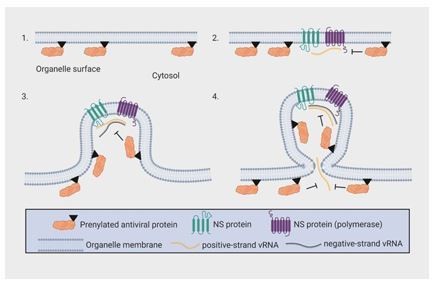
Figure 7
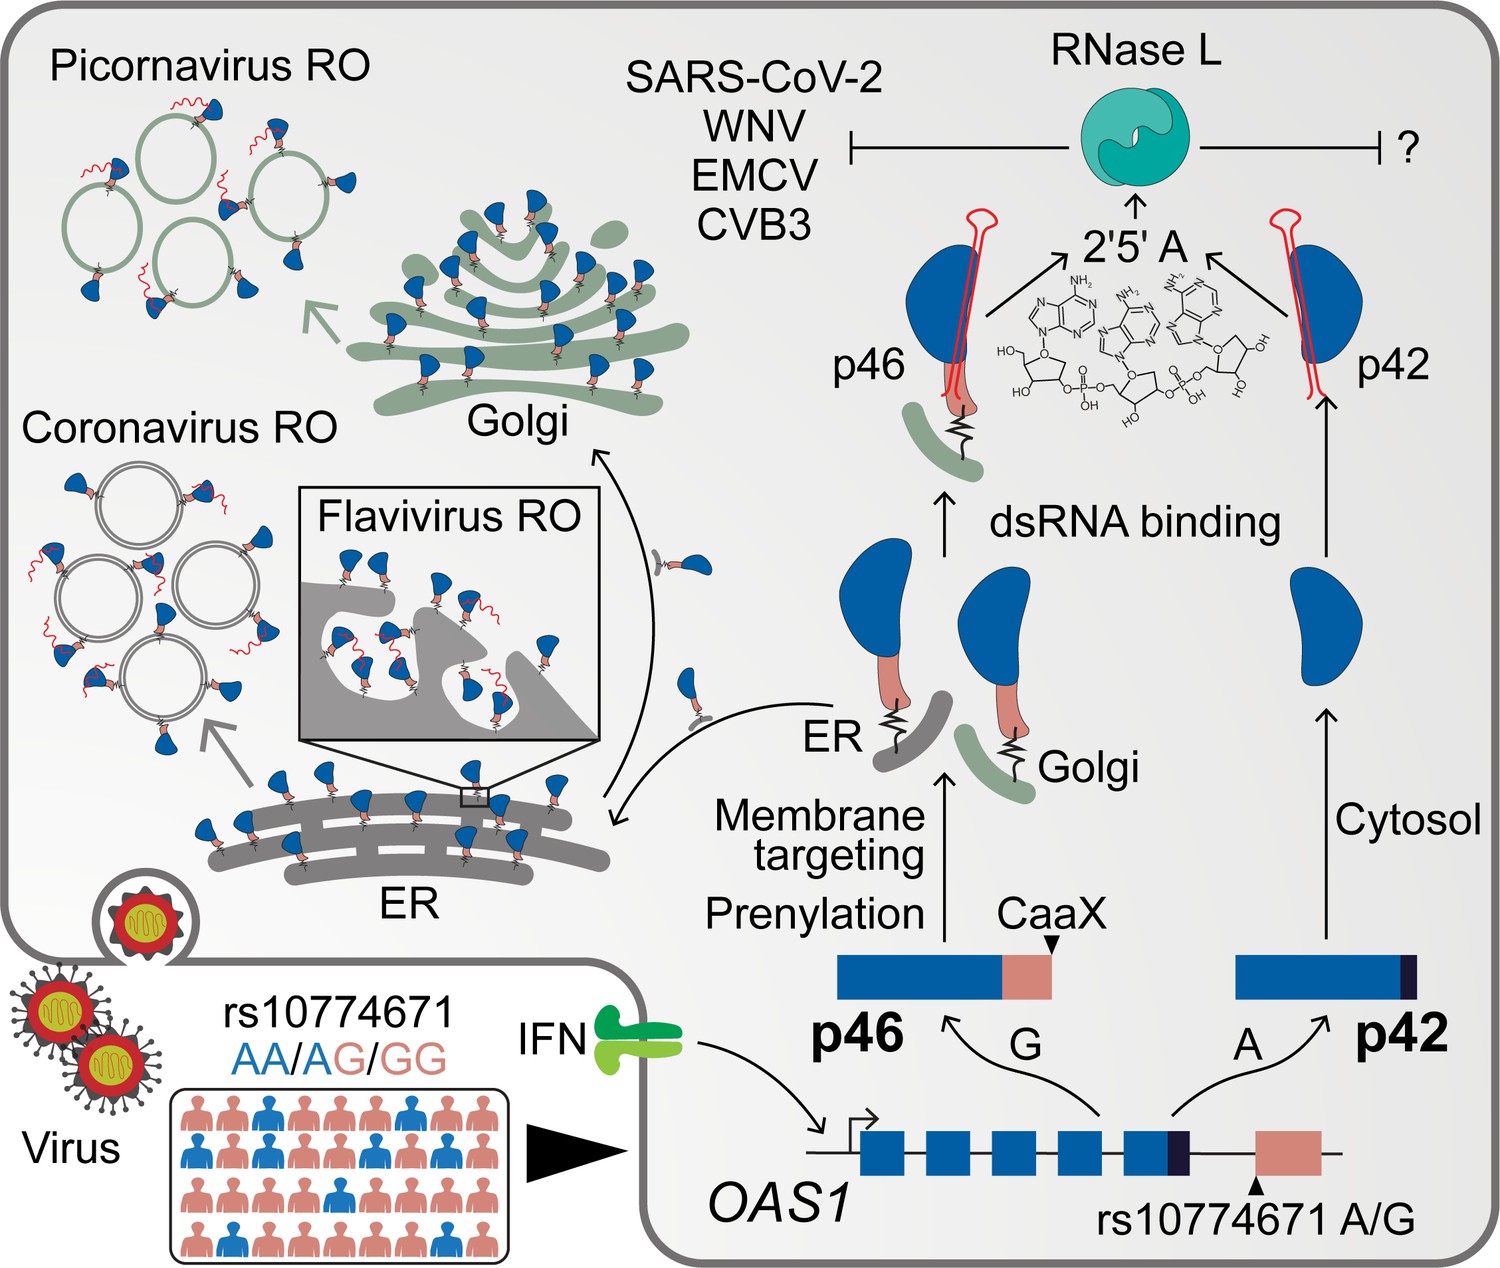
Schematic depicting how endomembrane targeting of OAS1 p46 primes antiviral activity against positive-strand RNA viruses.
A splice-acceptor SNP (rs10774671) controls production of the p42/p46 OAS1 isoforms. Isoform-specific prenylation localizes p46 to the Golgi apparatus, while OAS1 p42 is cytosolic. During positive-strand RNA virus infection, OAS1 p46 is recruited to virus replication organelles (VROs) of flaviviruses, picornaviruses and coronaviruses. Through this targeting p46 gains enhanced access to viral RNA. OAS1 p42 remains cytosolic and nuclear during infection and has limited access to viral RNA. Both OAS1 isoforms require catalytic activity and RNase L to be antiviral.
Author response image 1
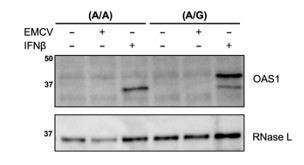
Primary human fibroblasts do not induce OAS1 expression upon infection with EMCV.
Primary human fibroblasts of (A/A) and (A/G) genotype at rs10774671 were infected with EMCV (MOI=0.01) or treated with 25 U/mL rIFNβ for 24h. OAS1 expression was assessed by Western blot.
Author response image 2
Additional files
-
Source data 1
Cumulative PDF file of all the source data in the manuscript.
- https://cdn.elifesciences.org/articles/71047/elife-71047-data1-v2.pdf
-
Supplementary file 1
Cells used in this study.
- https://cdn.elifesciences.org/articles/71047/elife-71047-supp1-v2.docx
-
Supplementary file 2
Antibodies used in this study.
- https://cdn.elifesciences.org/articles/71047/elife-71047-supp2-v2.docx
-
Supplementary file 3
Nucleic acids used in this study.
- https://cdn.elifesciences.org/articles/71047/elife-71047-supp3-v2.docx
-
Supplementary file 4
Viruses used in this study.
- https://cdn.elifesciences.org/articles/71047/elife-71047-supp4-v2.docx
-
Supplementary file 5
Clinical and demographic information for COVID-19 and matched healthy control cohort.
- https://cdn.elifesciences.org/articles/71047/elife-71047-supp5-v2.docx
-
Transparent reporting form
- https://cdn.elifesciences.org/articles/71047/elife-71047-transrepform-v2.docx
Download links
A two-part list of links to download the article, or parts of the article, in various formats.
Downloads (link to download the article as PDF)
Open citations (links to open the citations from this article in various online reference manager services)
Cite this article (links to download the citations from this article in formats compatible with various reference manager tools)
Endomembrane targeting of human OAS1 p46 augments antiviral activity
eLife 10:e71047.
https://doi.org/10.7554/eLife.71047


