Sequence features of retrotransposons allow for epigenetic variability
- Department of Diabetes Complications and Metabolism, Beckman Research Institute, United States
- Irell and Manella Graduate School of Biological Sciences, City of Hope, United States
- Van Andel Research Institute, United States
Figures
Figure 1 with 8 supplements

Sequence and chromatin context influence the establishment of a VM-IAPLTRs.
(A) All IAPLTR1 elements larger than 300 bps and the first 150bps of IAPEz-ints flanked by IAPLTR1 or IAPLTRs were clustered by sequence using PhyML with default settings. Major sequence variants for IAPLTR1s were separated into separate clades: clade1 (blue), clade 2 (Green), clade 3 (red), and clade 4 (orange). Major sequence variants for IAPEz-ints were separated into separate clades: clade α (dark blue), clade β (light blue), and clade γ (yellow). KZFP and KAP1 ChIP-seq signal was mapped across the consensus IAPLTR1 sequence as determined by MAFFT multiple sequence alignment. Gaps in the multiple sequence alignment for the IAPLTR1 sequence are displayed as grey. Heatmaps for KZFP and KAP1 ChIP-seq signals centered on the 5’ end of the IAPEz-int elements are show as well (B) Average KAP1 ChIP-seq signal across all IAPLTR1 and IAPEz-int clades. Each data point refers to the average KAP1 ChIP-seq signal at an individual IAPLTR1 element. Mean and standard deviation for each clade is shown as well. (C) Distribution of the IAPLTR1 elements clades (outer circle) and IAPEz-int clades (inner circle) for all IAP elements and VM-IAP elements. (D) Percent of VM-IAPLTR1s clade three elements and non VM-IAPLTR1 clade three elements that are within 50 kb of a constitutively expressed gene or 1 kb enhancer element, as a proxy for constitutive euchromatin environment. (E) Conservation of IAPLTR1 and IAPEz-int variants across mouse strains. Presence or absence of a IAP was determined using structural variants identified from the Sanger mouse genome project. Mouse KZFP and KAP1 ChIP-seq date are from GEO: GSE115291. VM-loci coordinates were obtained from Elmer et al., 2020.
Figure 1—figure supplement 1
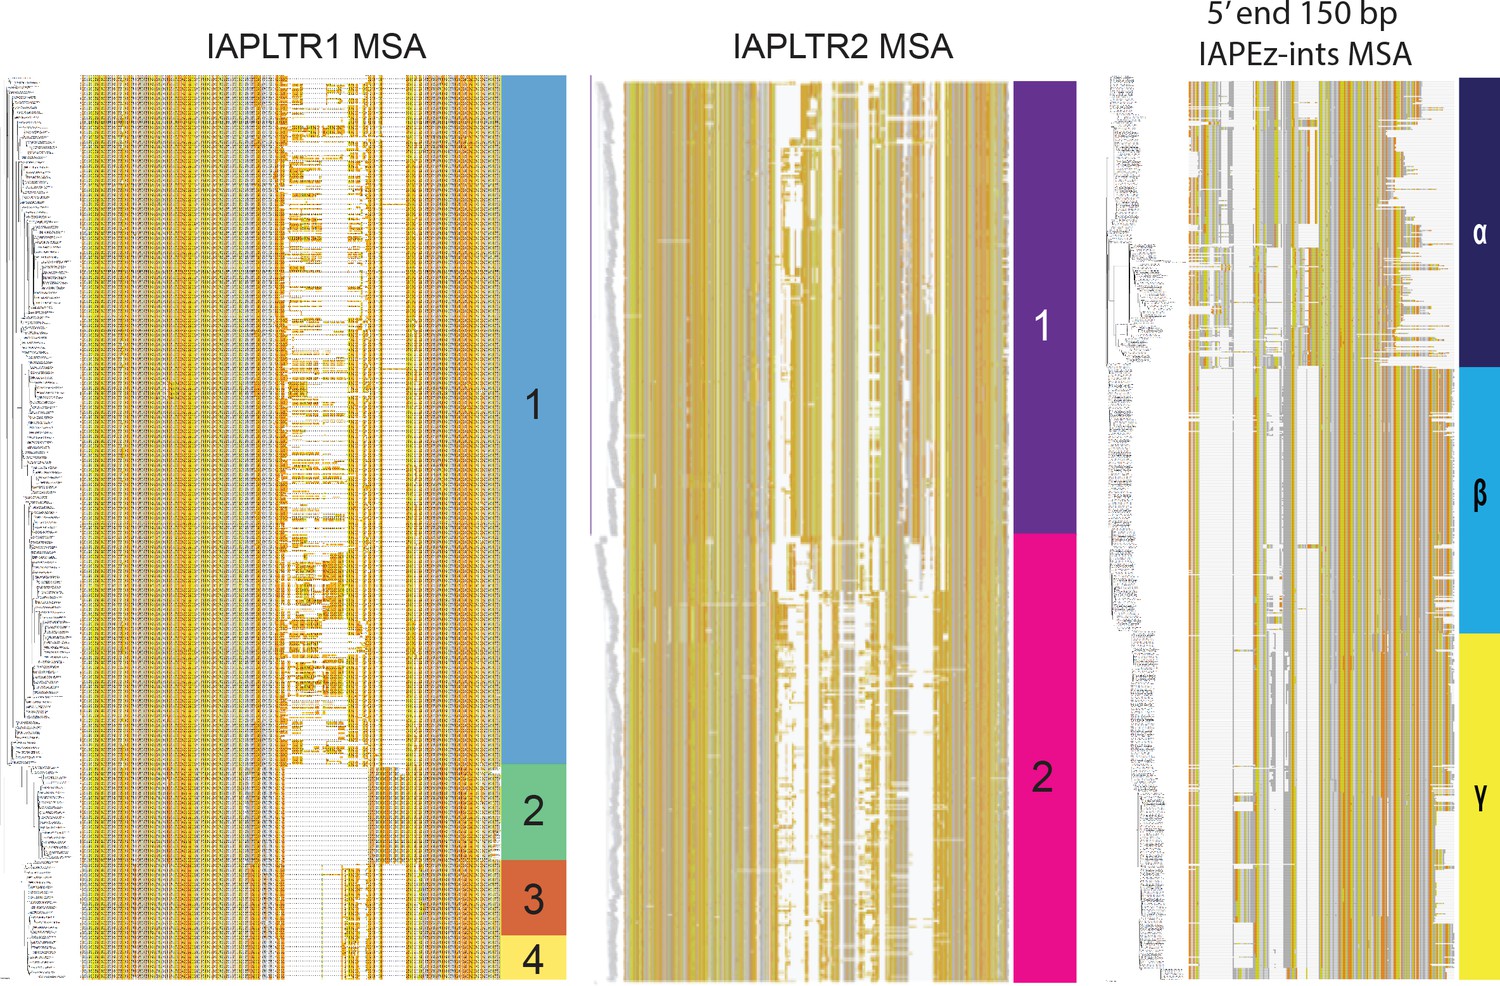
Multiple sequence alignment of IAPLTR1s, IAPLTR2, and the first 150bps of IAPEz-int flanked by IAPLTR1/2 aligned by MAFFT with default settings (Katoh and Standley, 2013).
Bases present in less than 10 % of IAPLTR elements were trimmed from the alignment. Sequences were clustered using PhyML with default settings. Each base is visualized by a different color: thymine is orange, adenine is dark gray, cytosine is yellow, and guanine is light gray. Bases with no alignment are white.
Figure 1—figure supplement 2

Consensus sequence of the IAPLTR1 clades identified in Figure 1—figure supplement 1.
Bases present in less than 10 % of IAPLTR elements were trimmed from the alignment. CpG dinucleotides are highlighted in light gray.
Figure 1—figure supplement 3
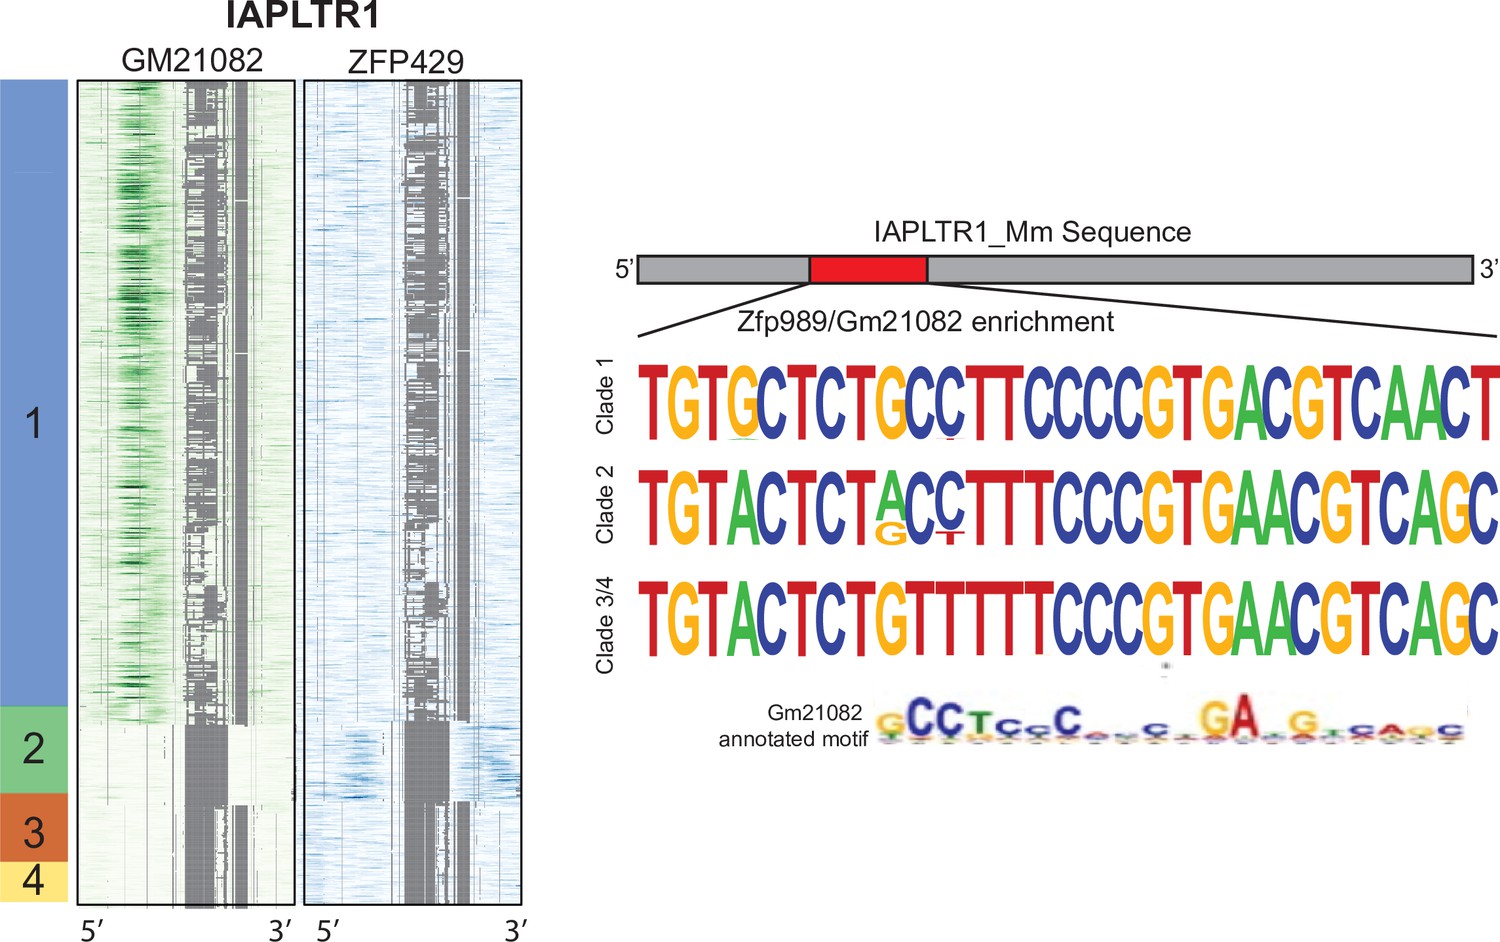
Gm21082 and KAP1 ChIP-seq signal mapped across all IAPLTR1 elements.
Consensus sequence of the IAPLTR1 clades at the region of increased ZFP989/Gm21082 binding. Arrows indicate locations of indels between clades. Previously identified Gm21082 binding motif from Wolf et al., 2020.
Figure 1—figure supplement 4
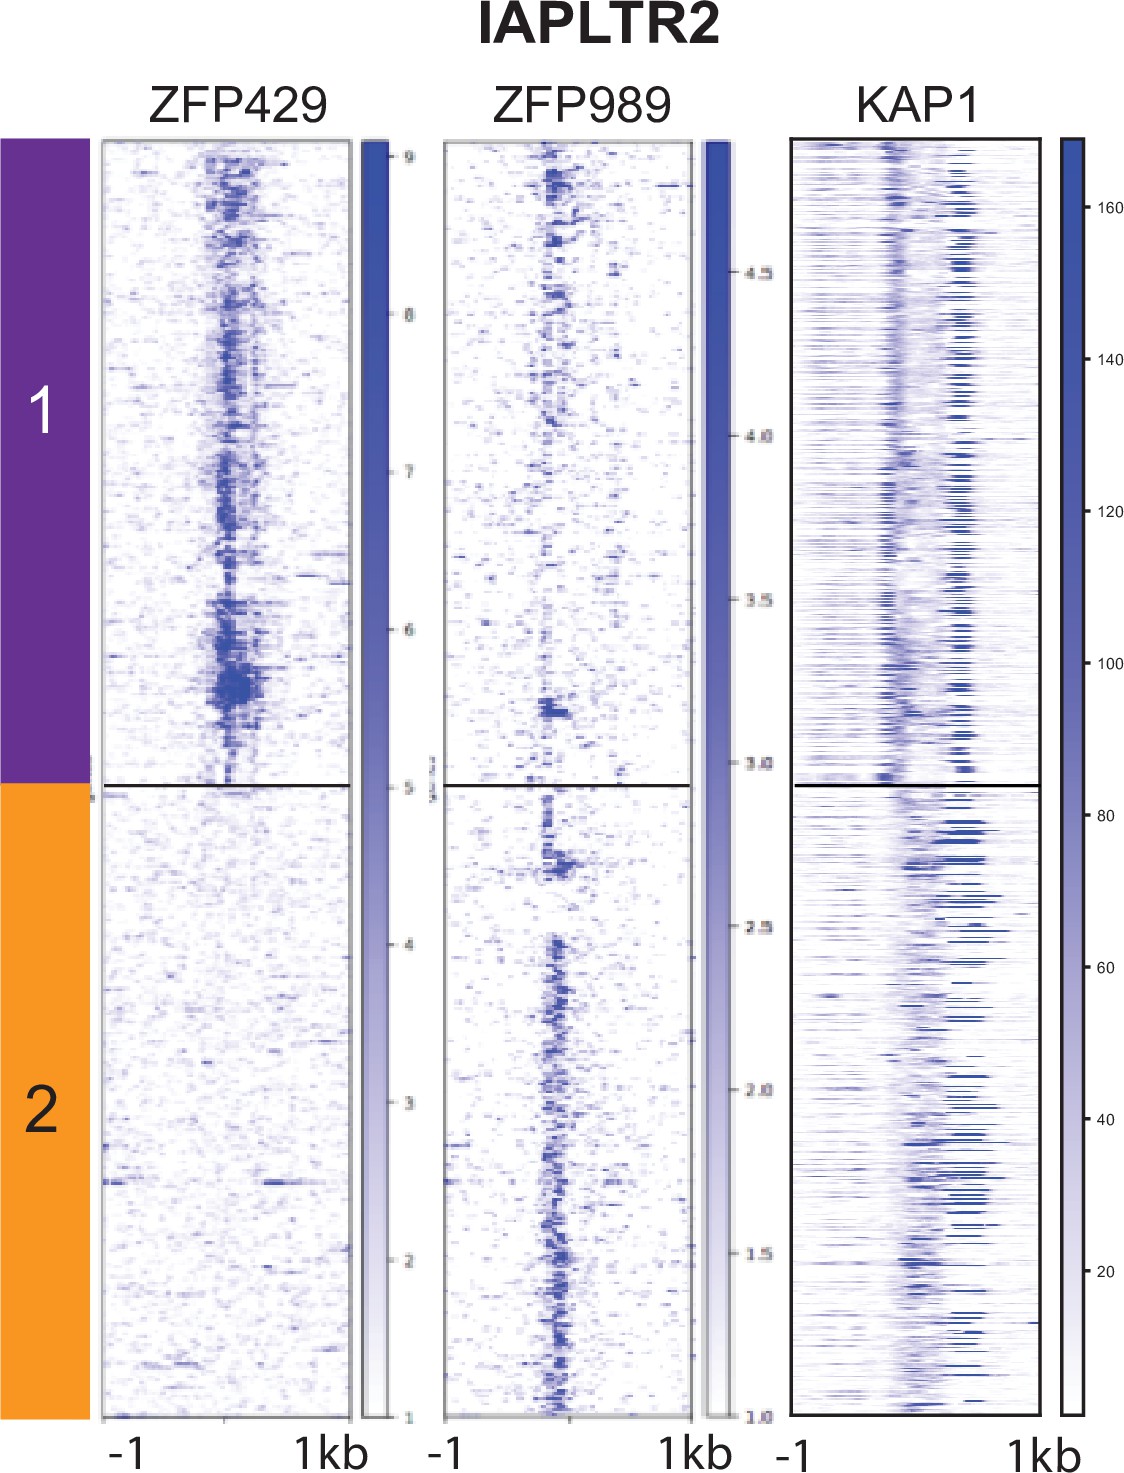
ZFP429, ZFP989, and KAP1 ChIP-seq signal mapped across all IAPLTR2 elements.
Figure 1—figure supplement 5
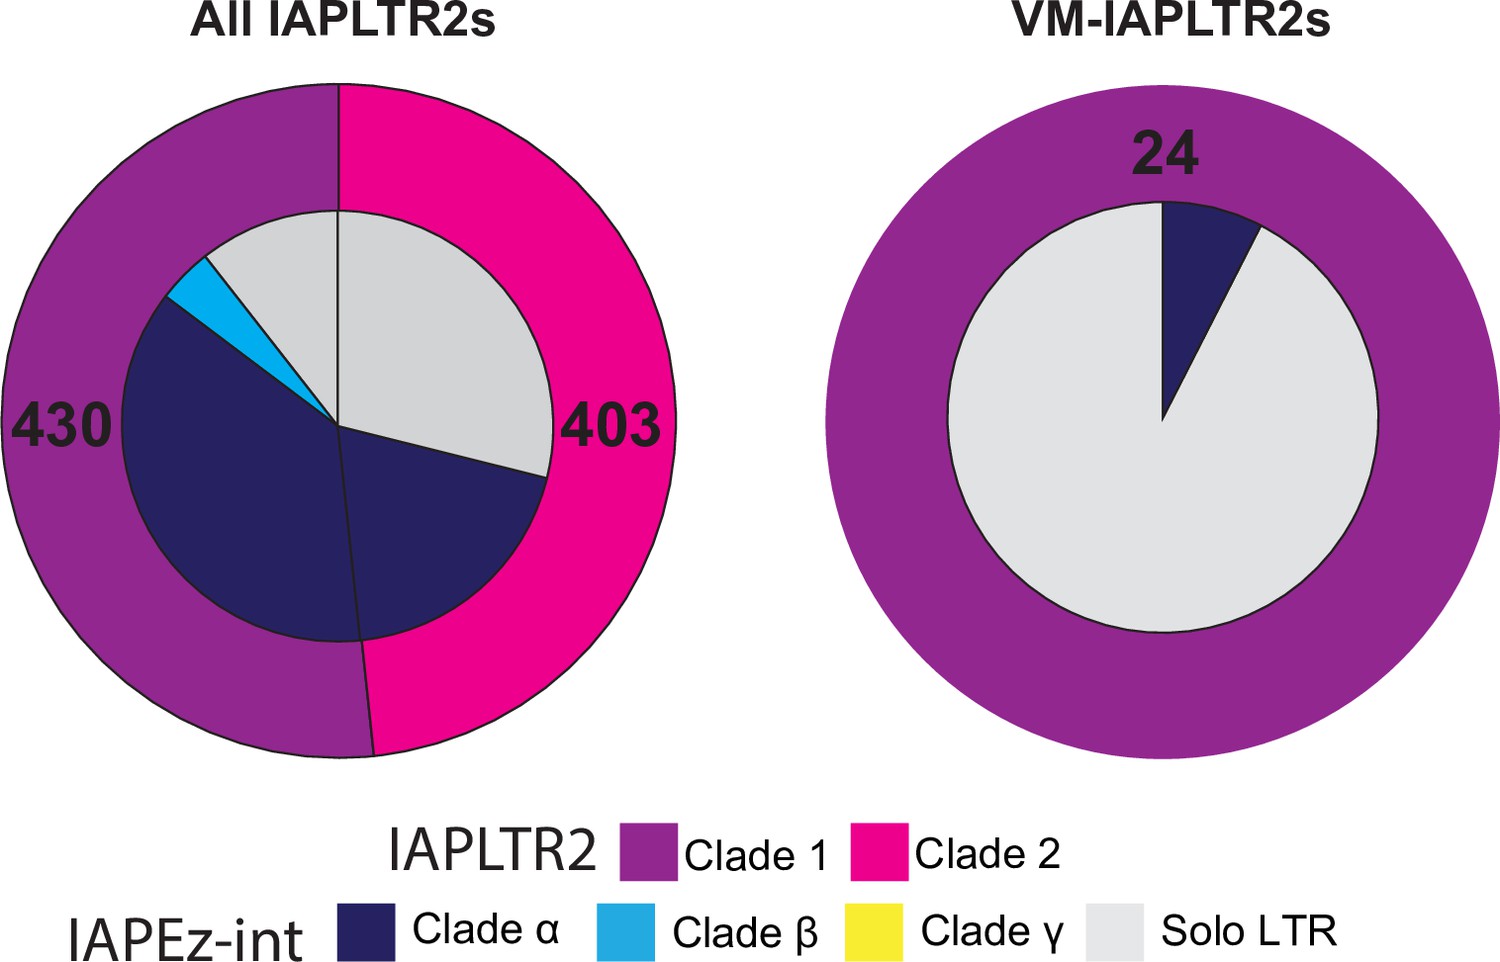
Association of IAPLTR2 and IAPEz-int clades for all IAPLTR2s and VM-IAPLTR2.
Figure 1—figure supplement 6

The percent of VM-IAPLTR1s clade three elements and non VM-IAPLTR1 clade three elements proximal to a constitutively expressed genes.
Each point refers to the percentage of IAPLTR1 proximal to a constitutively expressed gene at a given value. Distances were sampled every 2500bps.
Figure 1—figure supplement 7
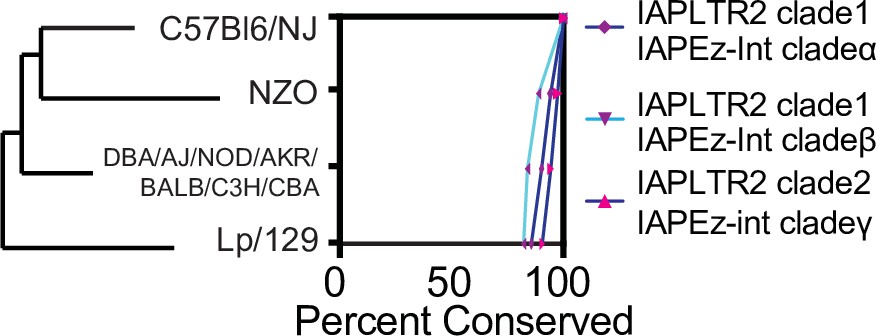
Conservation of IAPLTR1 and IAPEz-int variants across mouse strains.
Presence or absence of a IAP was determined using structural variants identified from the Sanger mouse genome project. If the entire IAP was found to be missing from the other mouse assembly, the IAP was determined to be not conserved.
Figure 1—figure supplement 8
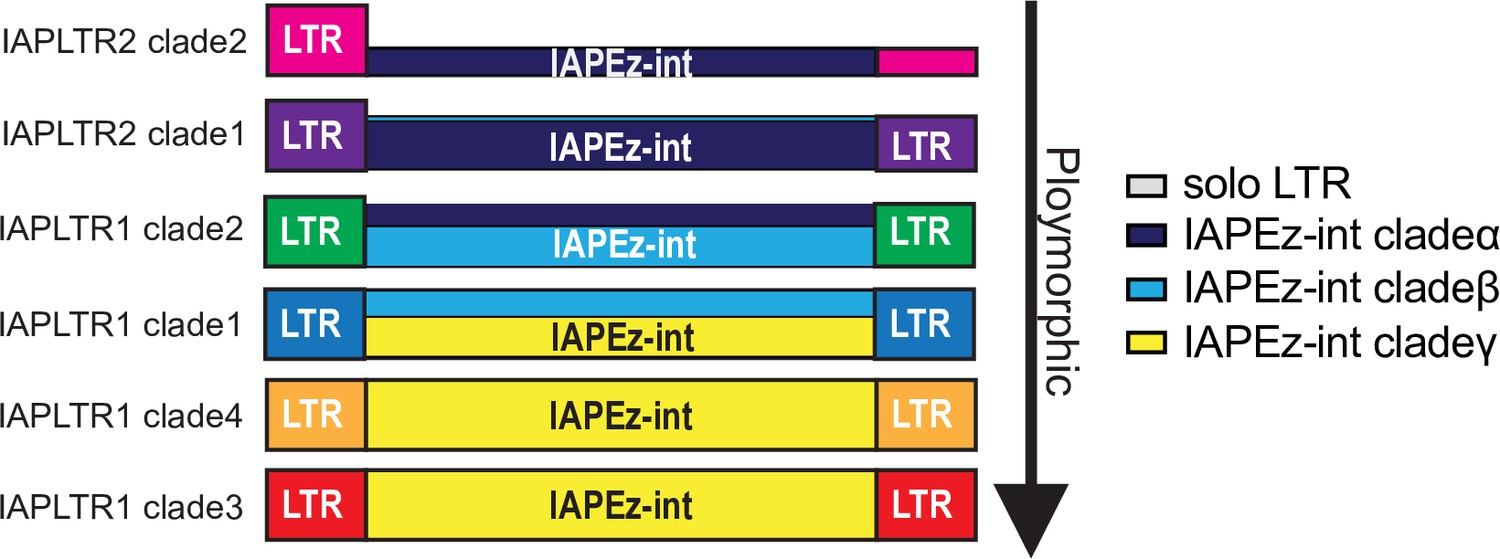
Model of IAPLTR and IAPEz-int interactions the height of each IAPEz-int refers to the percentage of IAP elements.
Figure 2 with 4 supplements
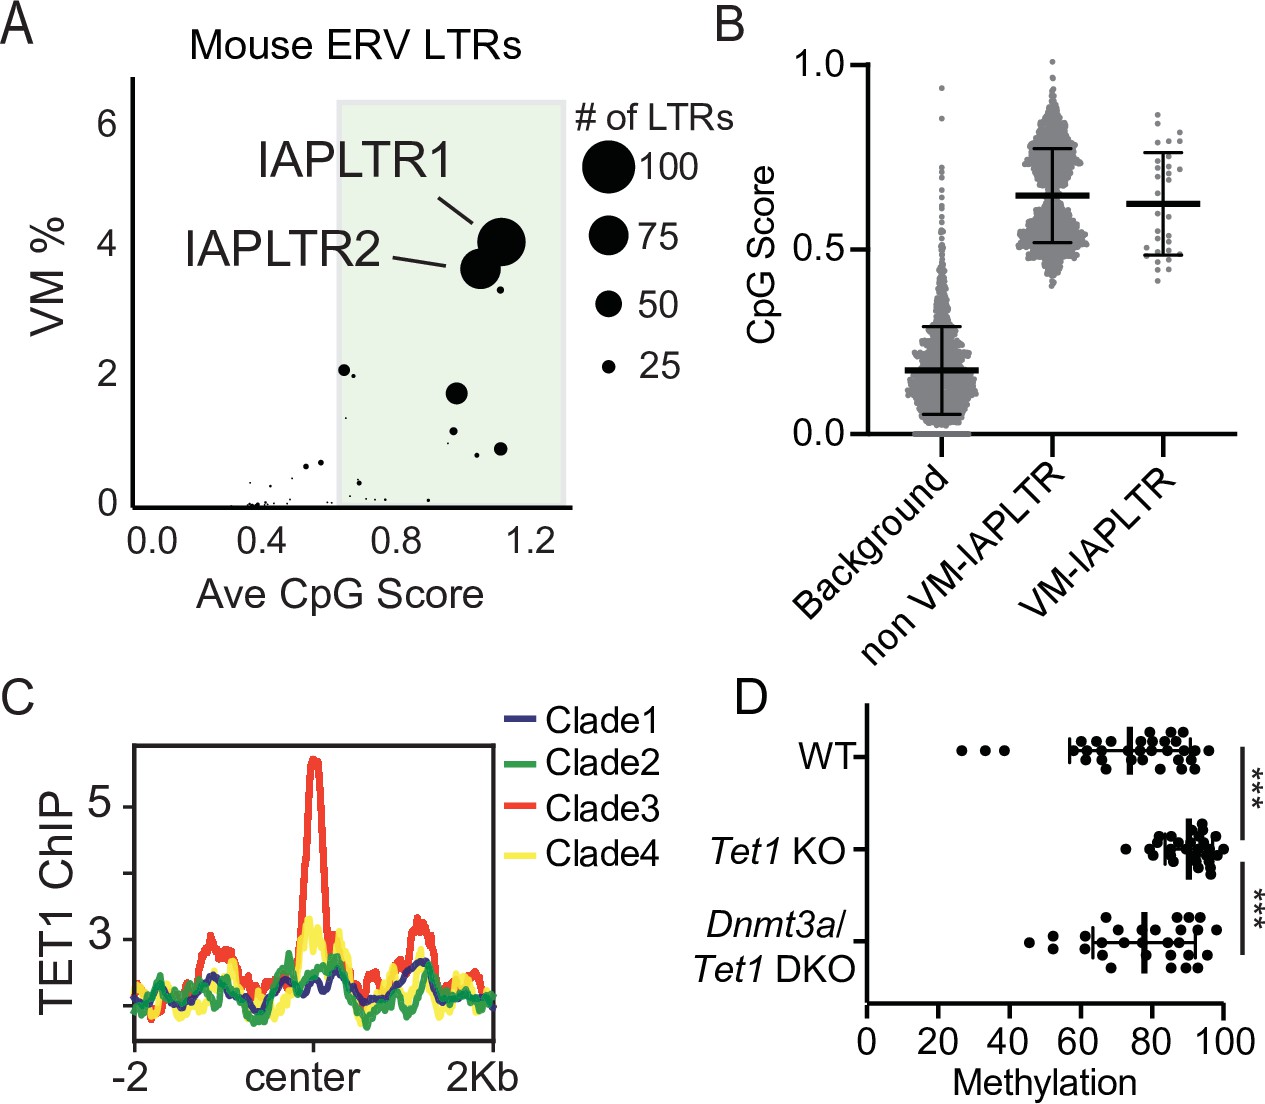
Divergent VM-IAPs elements have high CpG density and recruitment of ZF-CxxC proteins.
(A) Percent of ERV LTRs elements that are variably methylated for a given TE subfamily and average maximum CpG score of the TE subfamily. The size of each dot is determined by the number of VM-loci for each subfamily, with the largest dots indicating the greatest number of variably methylated elements. Average CpG score was determined by identifying the most CpG dense 200 bp window of each LTR and calculating the average CpG score for the whole subfamily. (B) Average CpG density of silenced and variably methylated IAPLTRs, as well as the average CpG score of a randomly selected background the same size as the IAPLTRs. Each dot refers to an individual IAPLTR element in the mm10 genome. Mean and standard deviation for each group is shown. (C) Aggregate plots of TET1 ChIP-seq signal across all identified IAPLTR1 clades. (D) Average methylation percentage of non-variable and VM-IAPLTR elements in wild type, Tet1 knockout (KO), and Dnmt3a/Tet1 double knockout cells (DKO). Each dot refers to the average methylation of an individual IAPLTR element. Only CpGs with >5 x coverage were retained to calculate methylation. Significance determined using a Wilcoxon rank sum test. *** indicates a p.value <0.0001. Bars for mean and standard deviation is shown as well for (B and D). TET1 ChIP-seq from GEO:GSE100957. Mouse Tet1 and Tet1/Dnmt3a DKO WGBS from GEO:GSE134396.
Figure 2—figure supplement 1

TET1 ChIP-seq signal mapped across all IAPLTR1 elements.
Figure 2—figure supplement 2
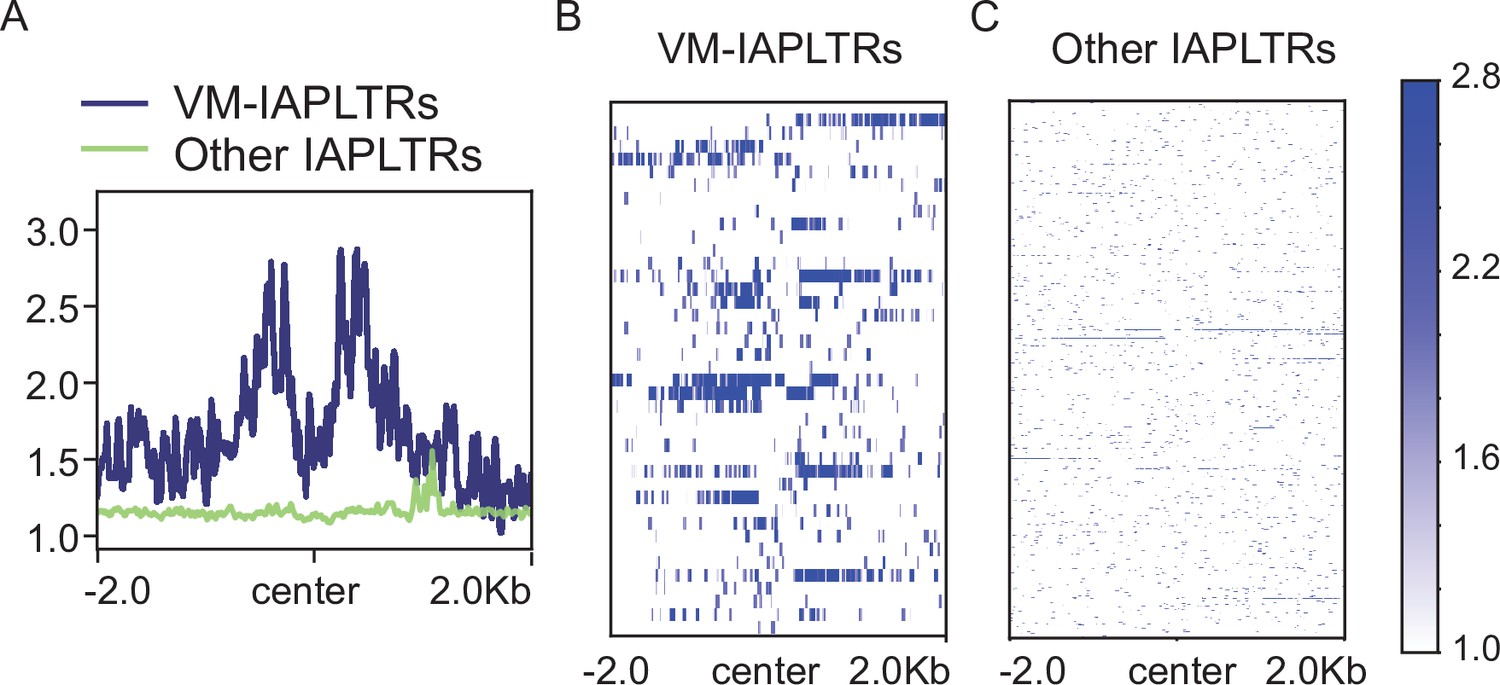
CFP1 profiling at IAPLTRs.
(A) Aggregate plots of Cfp1 signal at variably methylated and other IAPLTRs. Heatmaps of Cfp1 signal at (B) VM-IAPLTRs and (C) all other IAPLTR1 and IAPLTR2 elements (2819 elements). Reads were uniquely aligned using bowtie1. Data from GEO:GSE18578.
Figure 2—figure supplement 3
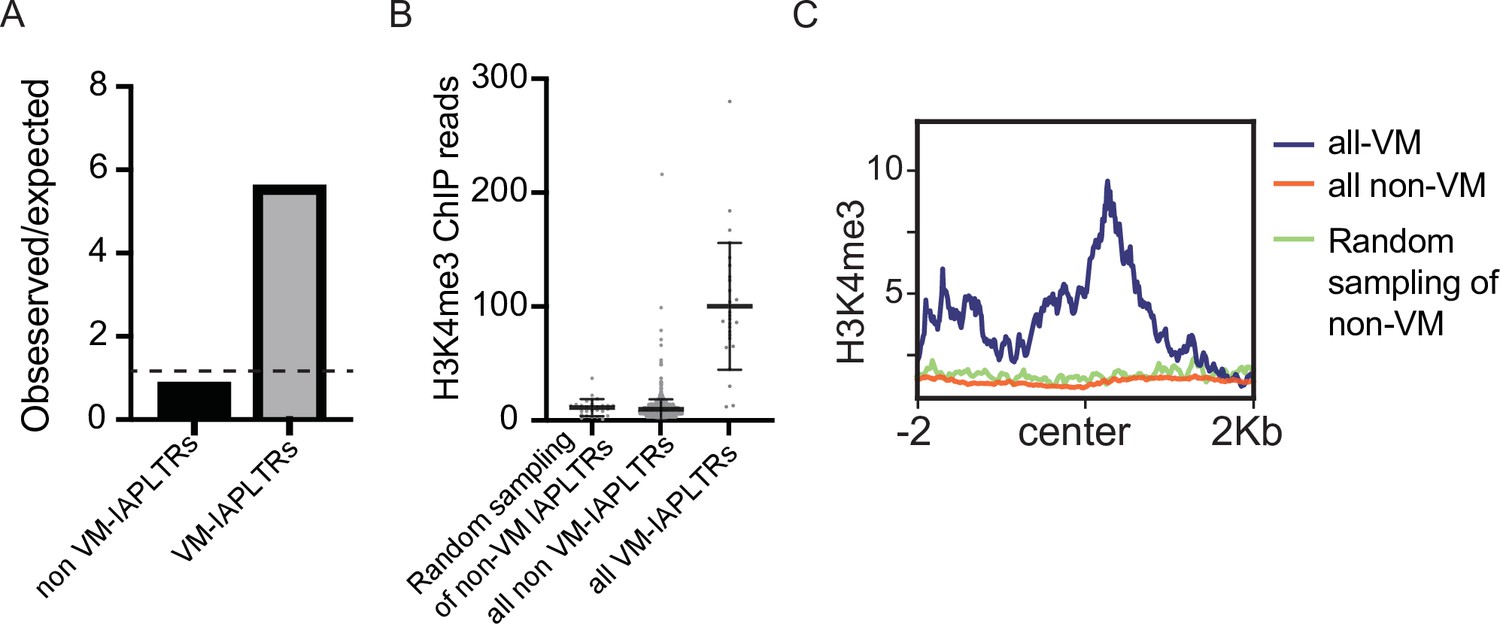
Enrichment of H3K4me3 at VM-IAPLTRs.
(A) Observed over expected H3K4me3 signal at variably methylated and non-variably methylated IAPLTRs. Expected H3K4me3 signal determined using average H3K4me3 signal at 50 randomly selected loci repeated 1000 times. (B) H3K4me4 ChIP-seq signal at all VM-IAPLTRs, silenced IAPLTRs and a random sampling of 50 IAPLTRs that were not variably methylated. (C) Aggregate plots of H3K4me3 ChIP-seq signal at the three groups identified in Figure 2—figure supplement 1C.
Figure 2—figure supplement 4
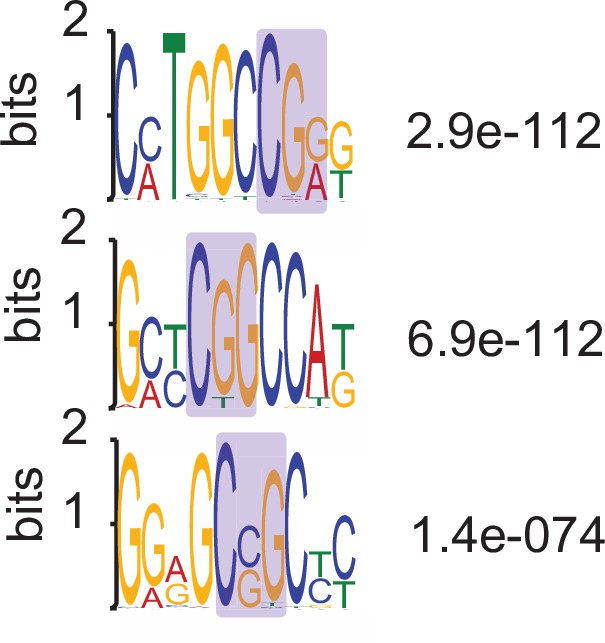
MEME identified motifs present in VM-IAPLTRs that contain CFP1-binding sites.
P-values obtained from MEME.
Figure 3 with 1 supplement
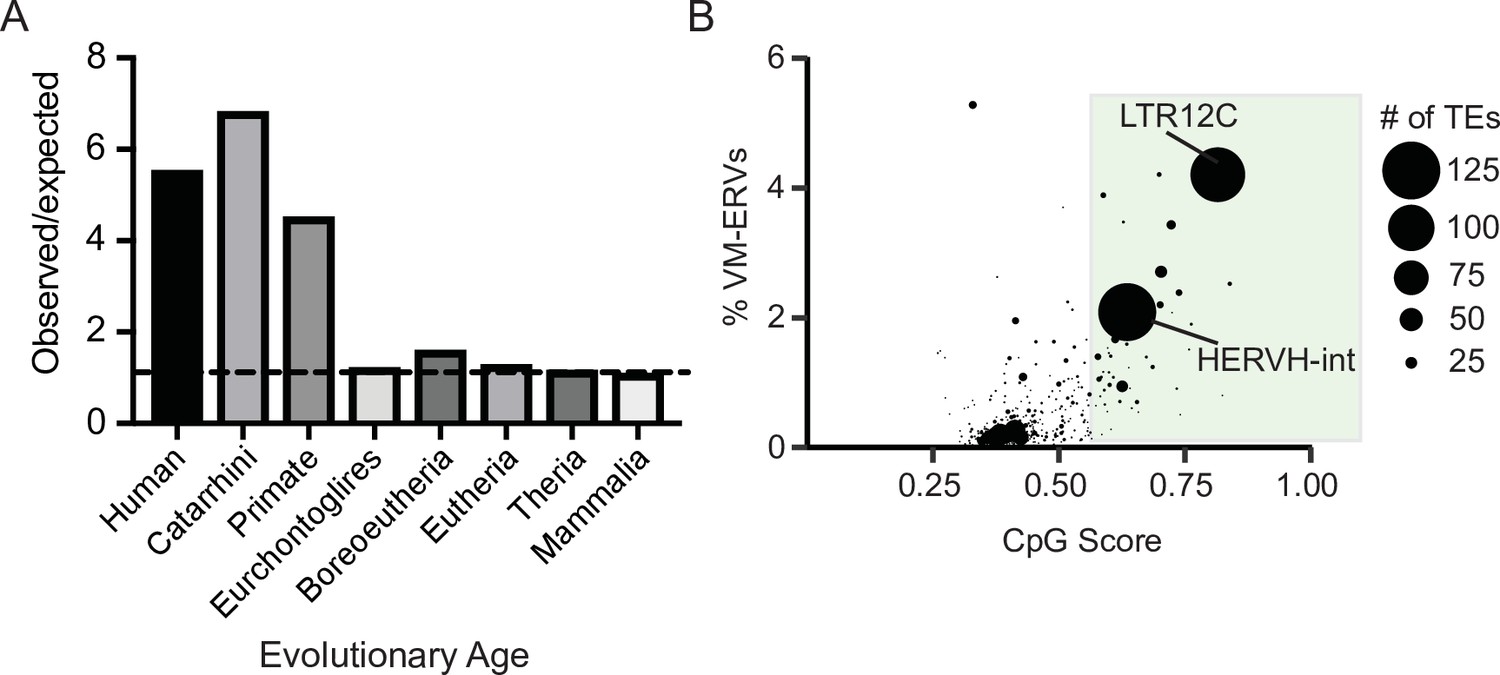
Variably methylated loci in humans are enriched for evolutionarily recent CpG-dense TEs.
(A) Observed over expected distribution of VM-TE elements in humans stratified by the evolutionary age of the TE. Expected distribution was determined using a random sampling of the hg38 genome the same size as the VM-loci. Evolutionary age for each TE subfamily was obtained from DFAM. (B) Scatterplot showing the percent of LTR elements which display VM for a given TE subfamily and average CpG score of the TE subfamily. The size of each dot is determined by the number of VM-loci for each subfamily. Average CpG score was determined by identifying the most CpG dense 200 bp window of each ERV and calculating the average CpG score for the whole subfamily. The coordinates of VM-loci for humans were obtained from Gunasekara et al., 2019.
Figure 3—figure supplement 1
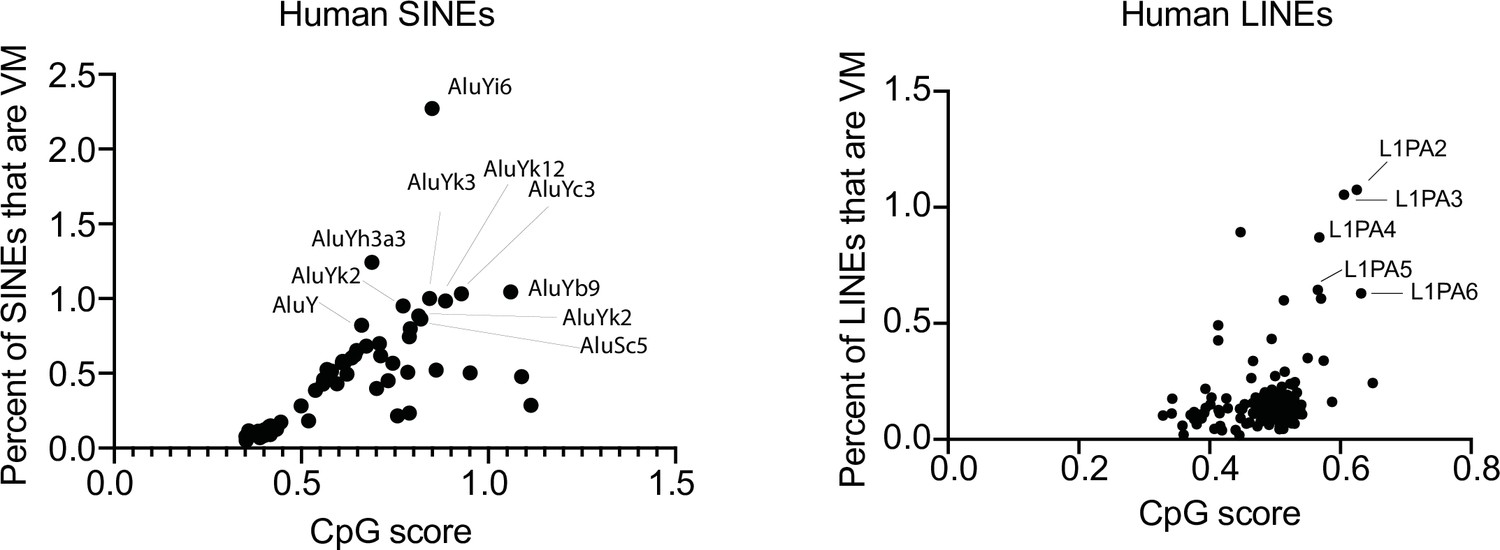
Scatter plot showing the percent of SINEs and LINEs that display variable methylation for a given TE subfamily and average CpG score of the TE subfamily in humans.
Figure 4 with 2 supplements
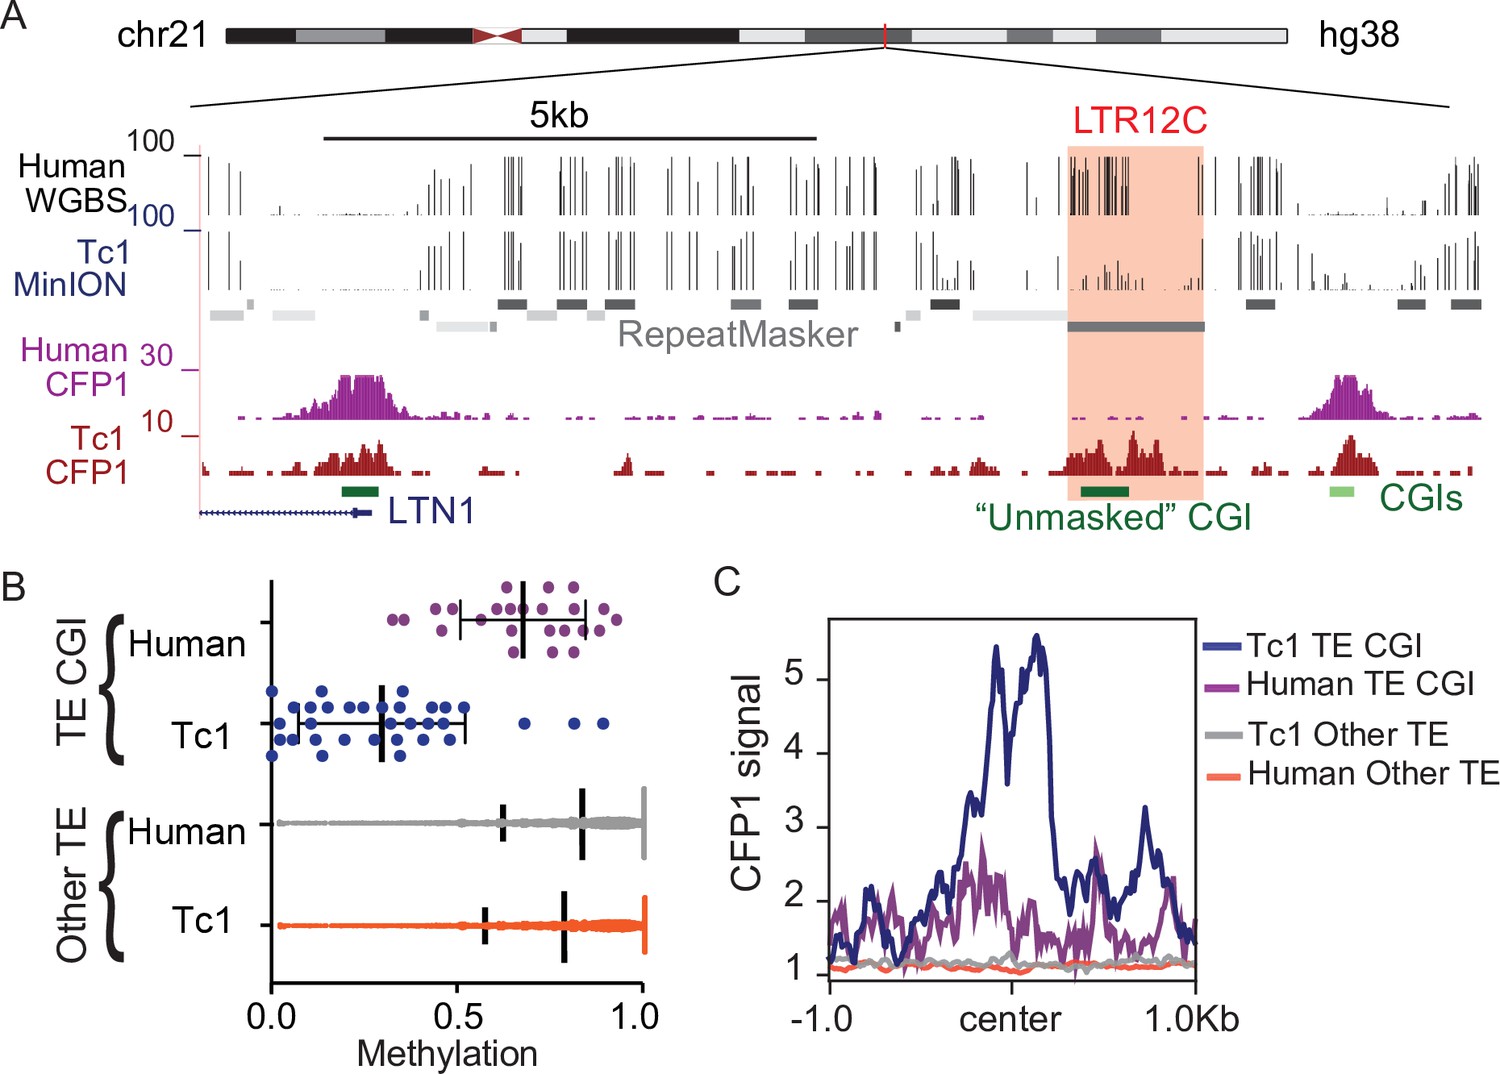
CpG dense TEs are hypomethylated and recruit ZF-CxxC proteins in the absence of KZFP-mediated silencing.
(A) UCSC genome browser screenshot of an LTR12C element which is hypomethylated in Tc1 mice and shows novel CFP1 recruitment in Tc1 mice. (B) CpG methylation of TE CpG islands (CGIs) and other TEs for human chromosome 21 in both Tc1 mouse and human genomes. Each data point refers to an individual CpG island that had greater than 5 x coverage. Mean and standard deviation for DNA methylation at is shown as well. (C) CFP1 signal in Tc1 mice and humans at the human TE CGIs and other TEs (from B) on human chromosome 21. Human CFP1 ChIP-seq from GEO:GSM3132538. WGBS from human liver GEO:GSM1716957.
Figure 4—figure supplement 1

CpG methylation of all TEs on human chromosome 21.
TEs were separated by CpG density and their capability of being silenced by a KZFP element shared between mouse and humans. Largely, these silenced repeat CGIs were found at Alu elements.
Figure 4—figure supplement 2

CFP1 signal at all non-repeat derived CpG islands on human chromosome 21 in Tc1 mice and humans.
Figure 5 with 2 supplements
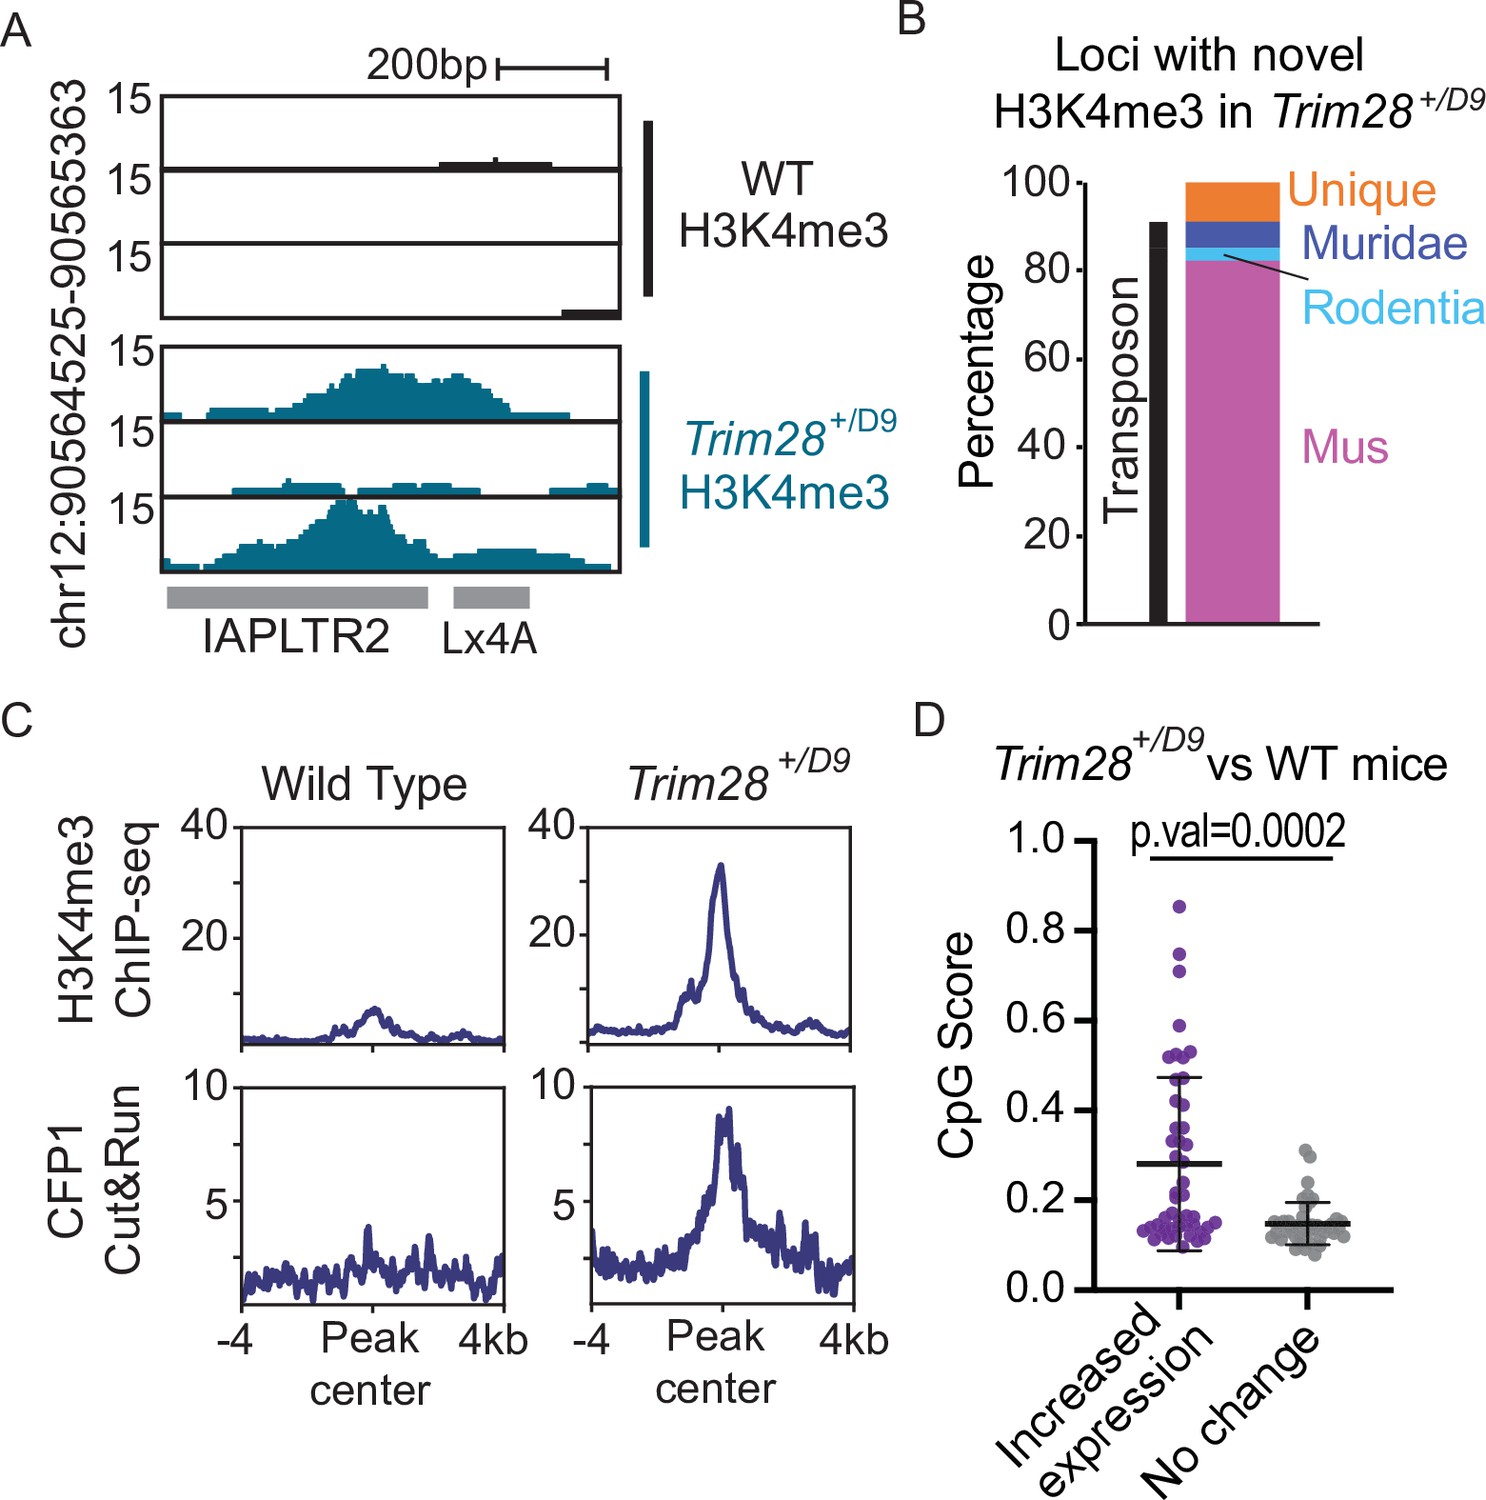
Trim28 haploinsufficiency leads to activation of evolutionarily recent and CpG dense TEs.
(A) Genome screenshot of an IAPLTR2 element with novel H3K4me3 enrichment in Trim28 haploinsufficient mice. (B) Breakdown of loci with novel H3K4me3 in Trim28 haploinsufficient mice. Age of each TE was determined by DFAM. (C) Aggregate plots of H3K4me3 and CFP11 signal across all loci that have novel H3K4me3 signal in Trim28 haploinsufficient mice (D) CpG Score of TE subfamilies with a global increase expression in Trim28 haploinsufficient mice and a random selection of non-responsive TEs subfamilies. Expression levels for each TE subfamily was determined using RepEnrich, and Deseq2 was used to determine TE subfamilies with a significant increase in expression in the Trim28 haploinsufficient mice. Bar is placed at mean and error bars cover one standard deviation. Each data point refers to an individual TE subfamily. p-Values for CpG density difference was calculated using a Wilcoxon rank sum test. Trim28 haploinsufficient and wild-type mouse RNA-seq was obtained from ENA:PRJEB11740.
Figure 5—figure supplement 1
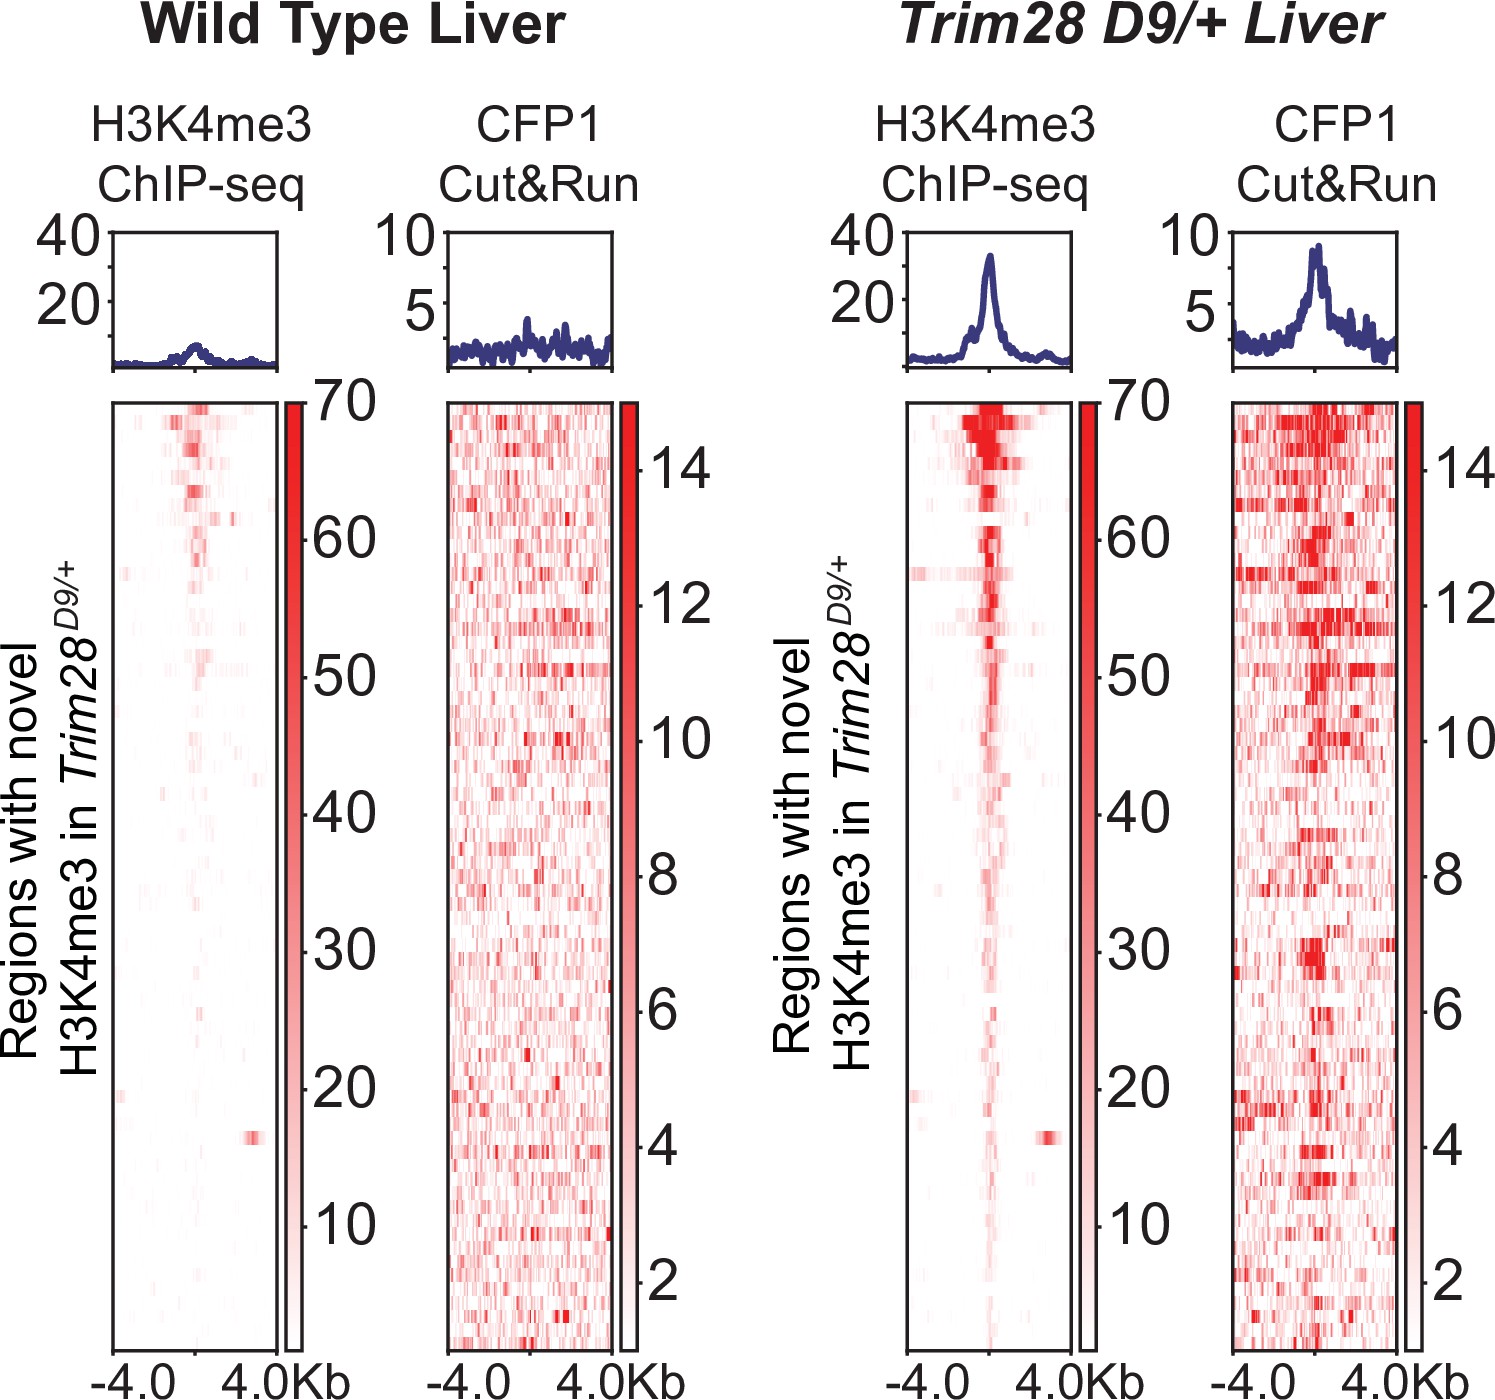
Heatmap and aggregate plots of H3K4me3 and CFP1 signal at loci with novel H3K4me3 signal in Trim28 D9/+ mice.
Figure 5—figure supplement 2
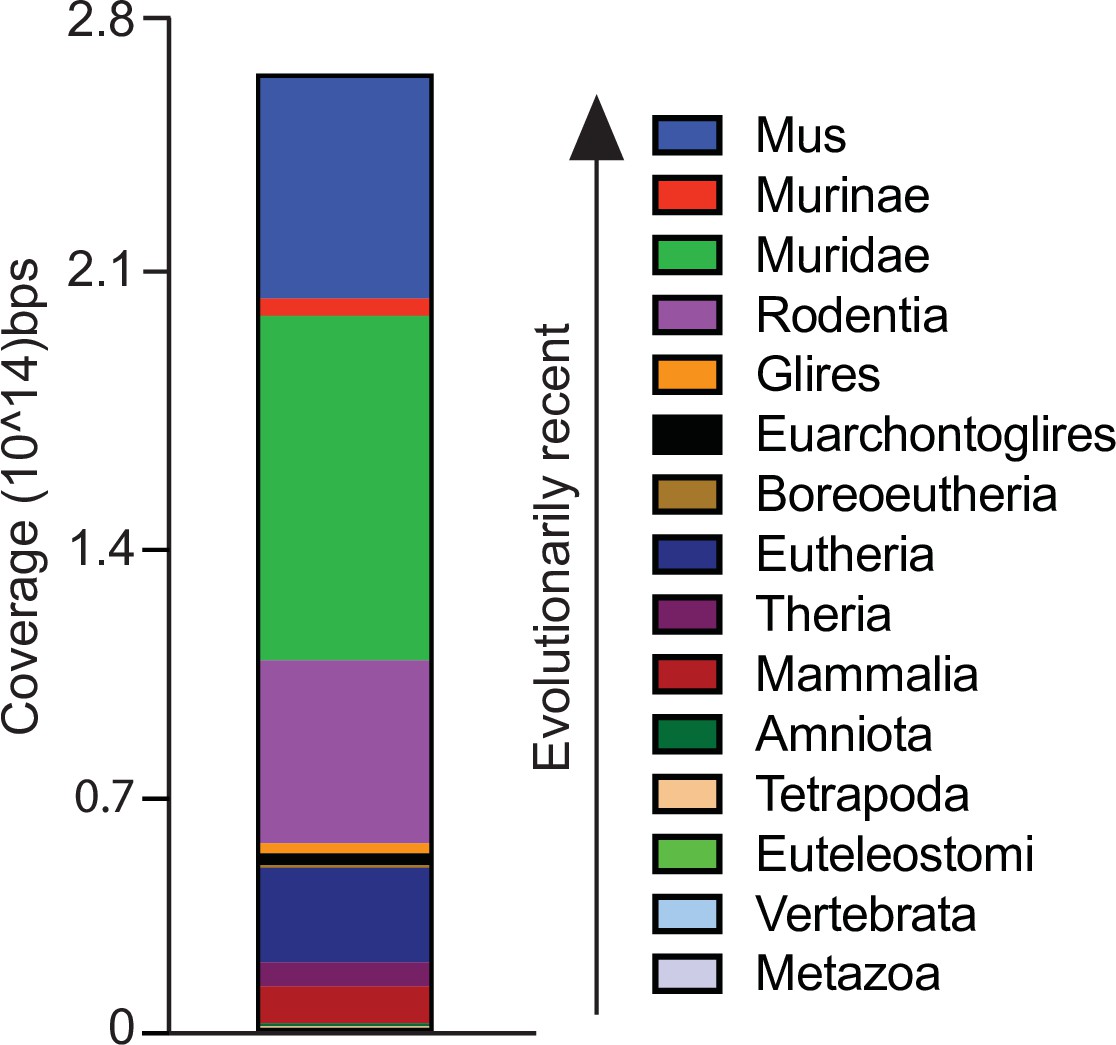
Evolutionary age of all TEs in the mm10 genome.
Evolutionary age was obtained from Dfam (Hubley et al., 2016).
Figure 6 with 1 supplement
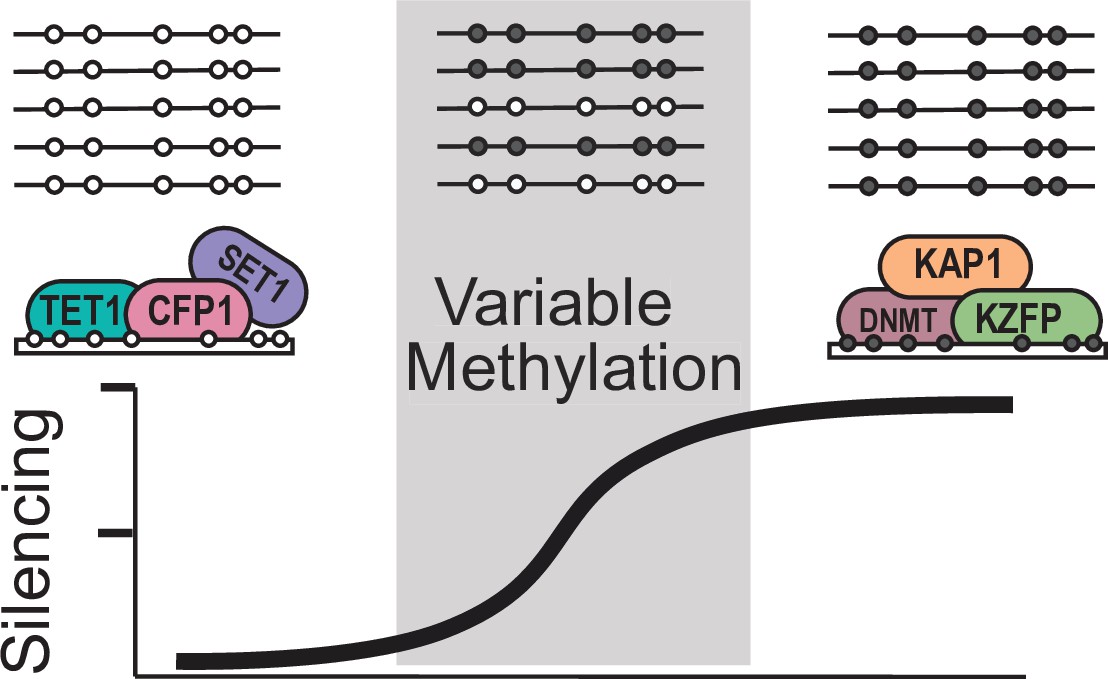
Model for variable methylated transposable elements.
Loci with high CpG density and loss of KZFP binding have the potential to recruit ZF-CxxC proteins to protect these TEs from being silenced. However, elements with high CpG density but strong KZFP recruitment will remain methylated.
Figure 6—figure supplement 1

Comparison of the IAPLTR1 associated with the ‘master’ IAP element identified in the C3H mice compared to the consensus sequence for each clade.
Only a portion of the IAPLTR1 containing identifiable sequence variants for each clade is shown to improve visibility.
Tables
Key resources table
| Reagent type (species) or resource | Designation | Source or reference | Identifiers | Additional information |
|---|---|---|---|---|
| Strain, strain background (Mus musculus) | Trim29+/D9 | Blewitt et al., 2005 | (RRID:MGI:3821610) | Haploinsufficient for Trim28 |
| Strain, strain background (Mus musculus) | B6129S-Tc(HSA21)1TybEmcf/J | The Jackson Laboratory | Stock No: 010801 (JAX)(RRID:IMSR_JAX:010801) | 2 Mb of a freely segregating human fragment of Chr21 |
| Antibody | Rabbit Polyclonal anti-CFP1 antibody | Millipore | ABE211(RRID:AB_10806210) | CUT&RUN(1:50 dilution) |
| Antibody | Rabbit polyclonal anti-H3K4me3Antibody | Abcam | ab8580(RRID:AB_306649) | ChIP-seq(2 µg antibody per25 µg chromatin) |
Additional files
-
Transparent reporting form
- https://cdn.elifesciences.org/articles/71104/elife-71104-transrepform1-v3.docx
-
Supplementary file 1
Annotation of IAP clades.
- https://cdn.elifesciences.org/articles/71104/elife-71104-supp1-v3.xlsx
Download links
A two-part list of links to download the article, or parts of the article, in various formats.
Downloads (link to download the article as PDF)
Open citations (links to open the citations from this article in various online reference manager services)
Cite this article (links to download the citations from this article in formats compatible with various reference manager tools)
Sequence features of retrotransposons allow for epigenetic variability
eLife 10:e71104.
https://doi.org/10.7554/eLife.71104


