Skeletal dysplasia-causing TRPV4 mutations suppress the hypertrophic differentiation of human iPSC-derived chondrocytes
- Department of Biomedical Engineering, Washington University in St. Louis, United States
- Department of Orthopedic Surgery, Washington University School of Medicine, St. Louis, United States
- Shriners Hospitals for Children - St. Louis, United States
- Department of Cell Biology and Physiology, Washington University School of Medicine, St. Louis, United States
- Department of Mechanical Engineering and Material Science, Washington University in St. Louis, United States
- Department of Neurology, Duke University School of Medicine, United States
- Department of Molecular Pathobiology - NYU College of Dentistry, United States
- Department of Orthopaedics and Rehabilitation, Center for Musculoskeletal Research, University of Rochester, United States
Figures
Figure 1
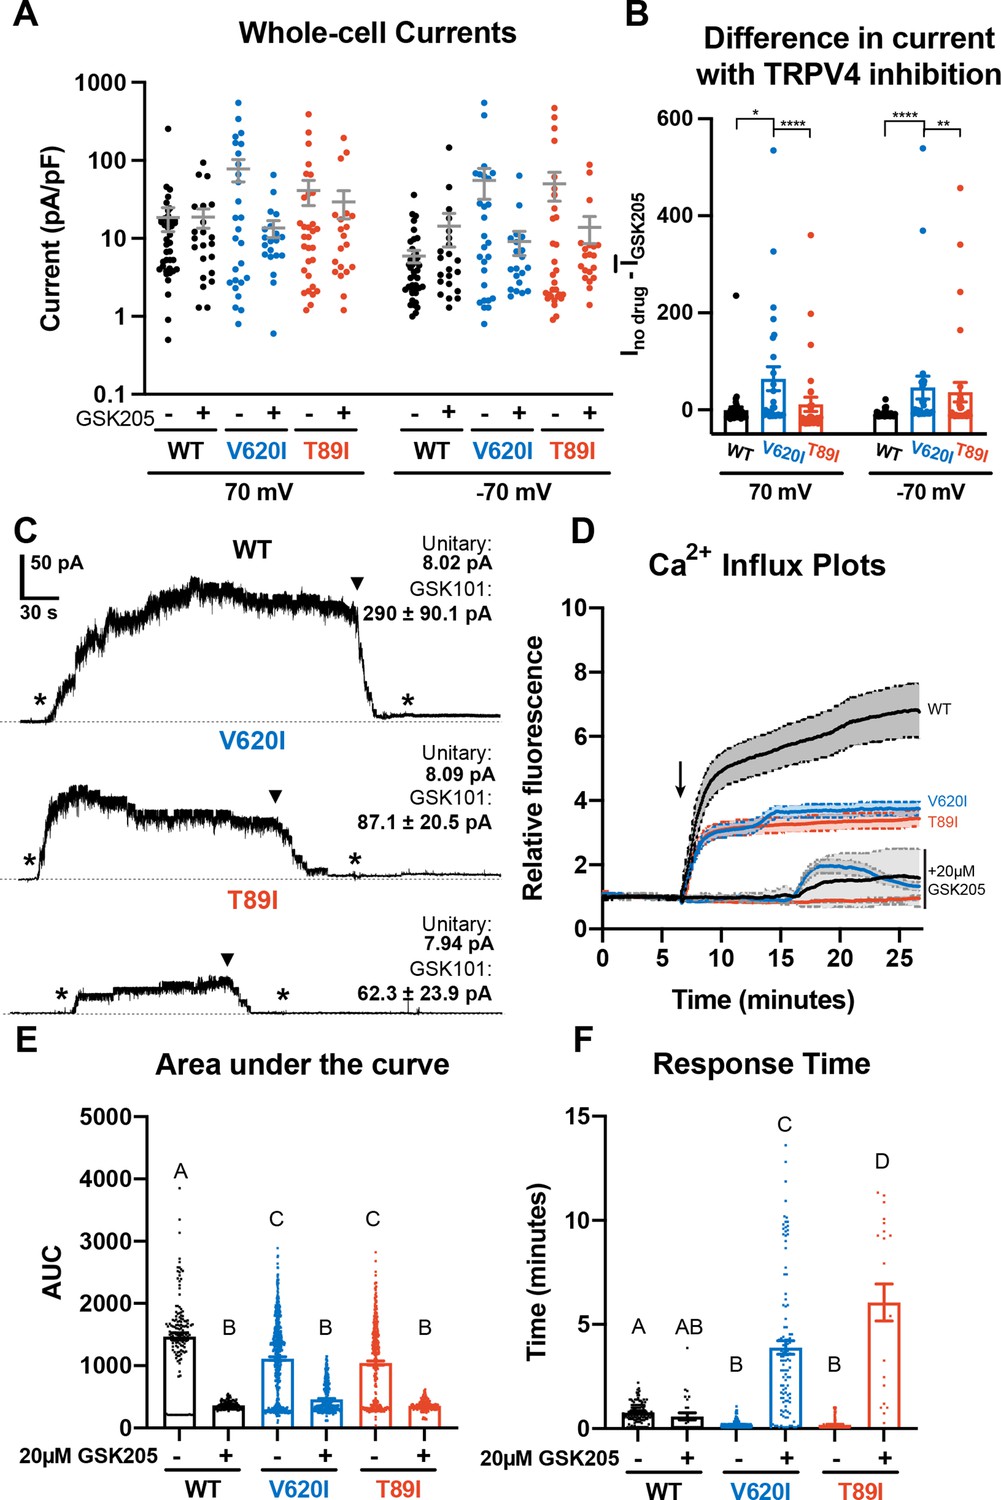
Differences in TRPV4 electrophysiological properties of wildtype (WT) and mutant human-induced pluripotent stem cell (hiPSC)-derived chondrocytes.
(A) Whole-cell currents were higher, on average, in mutant hiPSC-derived chondrocytes than WT at 70 and −70 mV. TRPV4 inhibition with 20 µM GSK205 reduced mutant currents to similar levels as WT. Mean ± standard error of the mean (SEM). n = 20–40 cells from 4 differentiations. Kruskal-Wallis test with multiple comparisons comparing cell lines at 70 and -70 mV. No significance. (B) The difference between the current (I) through TRPV4 without GSK205 from the average current through inhibited channels was significantly higher in V620I. There was no difference between no drugs and GSK205 in WT. Mean ± SEM. n = 27–40 from 4 differentiations. Kruskal–Wallis test with multiple comparisons comparing cell lines at 70 and −70 mV. *p < 0.05, **p < 0.01, ****p < 0.001. (C) Inside-out excised patches of WT had a higher current in response to 10 nM GSK101 (indicated by *) than mutants. The addition of 10 nM GSK101 + 20 µM GSK205 (indicated by arrow head) decreased the current and continued to block the channel when GSK101 alone was re-introduced (*). Representative plots with average unitary current and current in response to GSK101. Mean ± SEM. N = 5, 9, and 8 for WT, V620I, and T89I, respectively, from 2 differentiations. (D) Mutant TRPV4 decreased the channels’ sensitivity to activation with GSK101 (indicated by arrow) as shown with confocal imaging of ratiometric fluorescence indicating Ca2+ signaling. GSK205 attenuated GSK101-mediated signaling. Mean ± 95% CI. n = 3 experiments with a total of 158–819 cells per line. (E) Quantification of the area under the curve of (D). Mean ± SEM. n = 158–819 cells from 3 experiments. Ordinary two-way analysis of variance (ANOVA) with Tukey’s post hoc test. Interaction, cell line, and treatment p < 0.0001. Different letters are significantly different, p < 0.05, from each other. (F) Time of initial response of each responding cell (≥25% of frames for that cell are responding) measured from the addition of stimulus. Mutant TRPV4 responded faster to GSK101, but the response was significantly slowed by GSK205. Responding frames were considered to have a fluorescence greater than the mean plus three times the standard deviation. Mean ± SEM. n = 21–360 responding cells from 3 experiments. Ordinary two-way ANOVA with Tukey’s post hoc test. Interaction, cell line, and treatment p < 0.0001.Different letters are significantly different, p < 0.05, from each other.
Figure 2 with 1 supplement
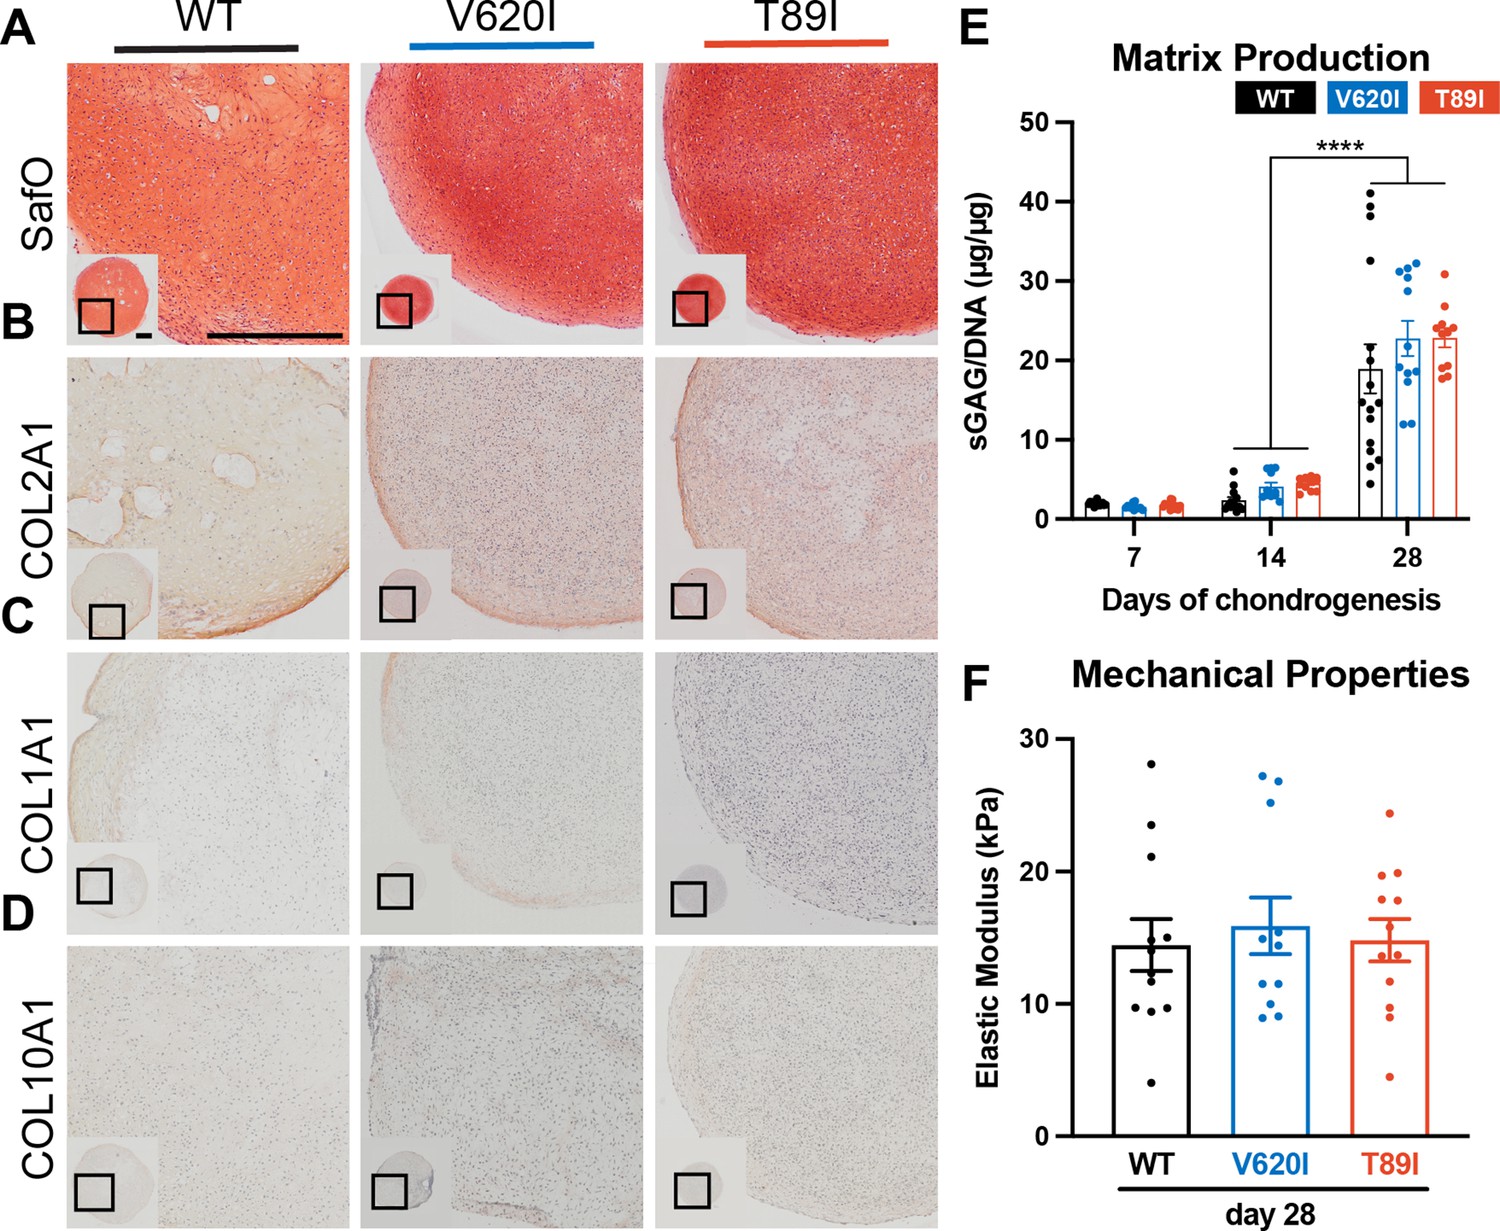
Mutant TRPV4 had little effect on chondrogenic matrix production.
(A) Wildtype (WT), V620I, and T89I day-28 pellets exhibit similar matrix production shown by staining for sulfated glycosaminoglycans (sGAGs) with Safranin-O and hematoxylin and labeling with immunohistochemistry (IHC) for (B) COL2A1 (C), COL1A1 (D), and COL10A1. Scale bar = 500 µm. Representative images from 3 to 4 differentiations. (E) The sGAG/DNA ratio increased in all three lines from day 14 to 28 of chondrogenesis. There were no differences between lines at each time point. Mean ± standard error of the mean (SEM). n = 11–16 from 3 to 4 independent differentiation experiments. ****p < 0.0001 Statistical significance determined by an ordinary two-way analysis of variance (ANOVA) with Tukey’s post hoc test. (F) There were no differences in the elastic modulus of the matrix at day 28. Mean ± SEM. n = 11–14 from 3 experiments. Statistical significance determined by an ordinary two-way ANOVA with Tukey’s post hoc test.
Figure 2—figure supplement 1
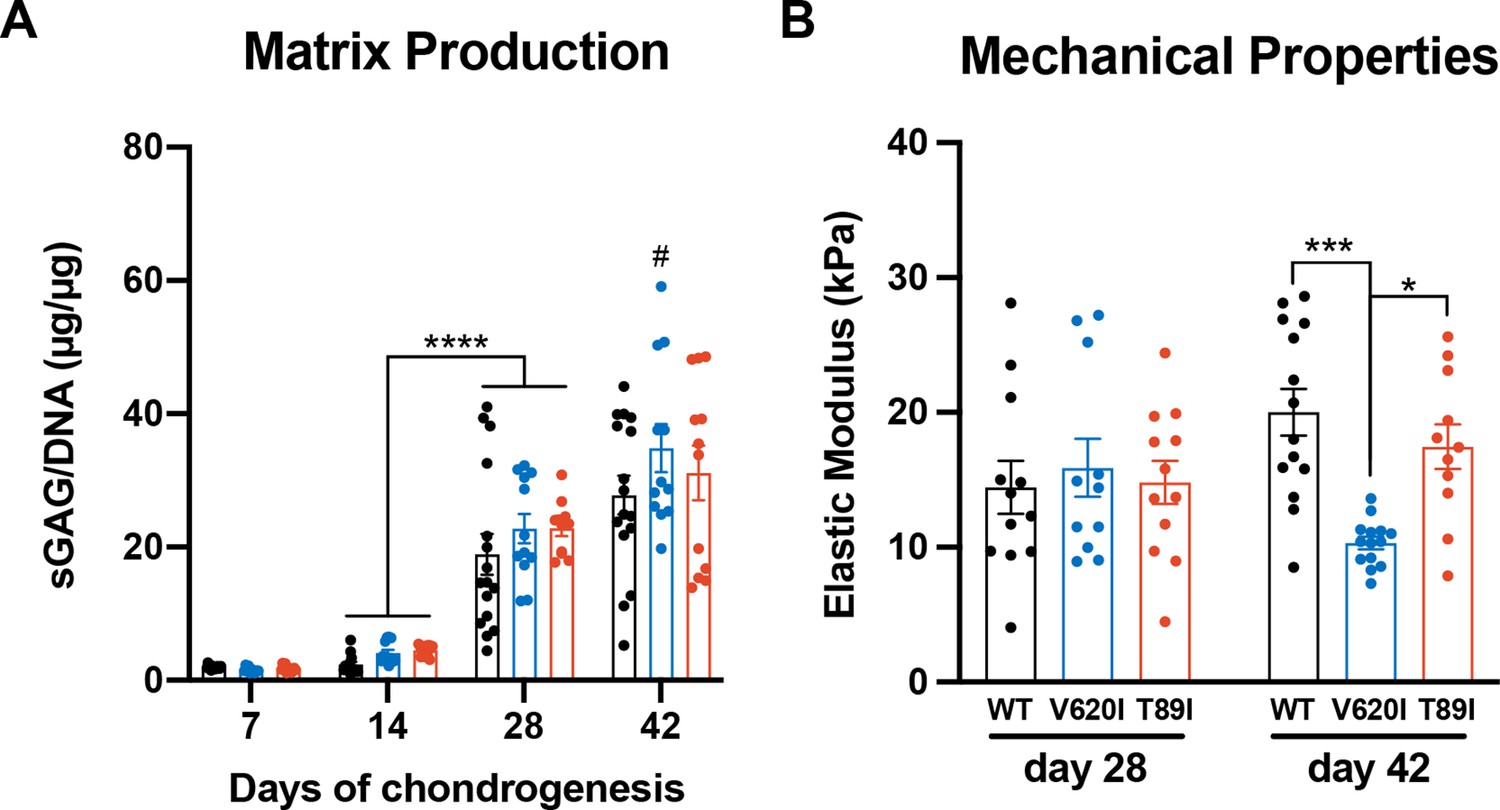
Minor differences in V620I matrix were observed at day 42 of chondrogenesis.
(A) The sulfated glycosaminoglycan (sGAG)/DNA ratio increased in all three lines from day 14 to 28 of chondrogenesis. V620I also had an increase in the sGAG/DNA ratio from day 28 to 42. There were no differences between lines at each time point. Mean ± standard error of the mean (SEM). n = 11–16 from 3 to 4 differentiation experiments. ****p < 0.0001, #p < 0.05 to day-28 V620I. Statistical significance determined by an ordinary two-way analysis of variance (ANOVA) with Tukey’s post hoc test. (B) There were no differences in the elastic modulus of the matrix at day 28. Day-42 V620I had a significantly lower elastic modulus than wildtype (WT) and T89I. Mean ± SEM. n = 11–14 from 3 experiments. *p < 0.05, ***p < 0.001 Statistical significance determined by an ordinary two-way ANOVA with Tukey’s post hoc test.
Figure 3 with 1 supplement
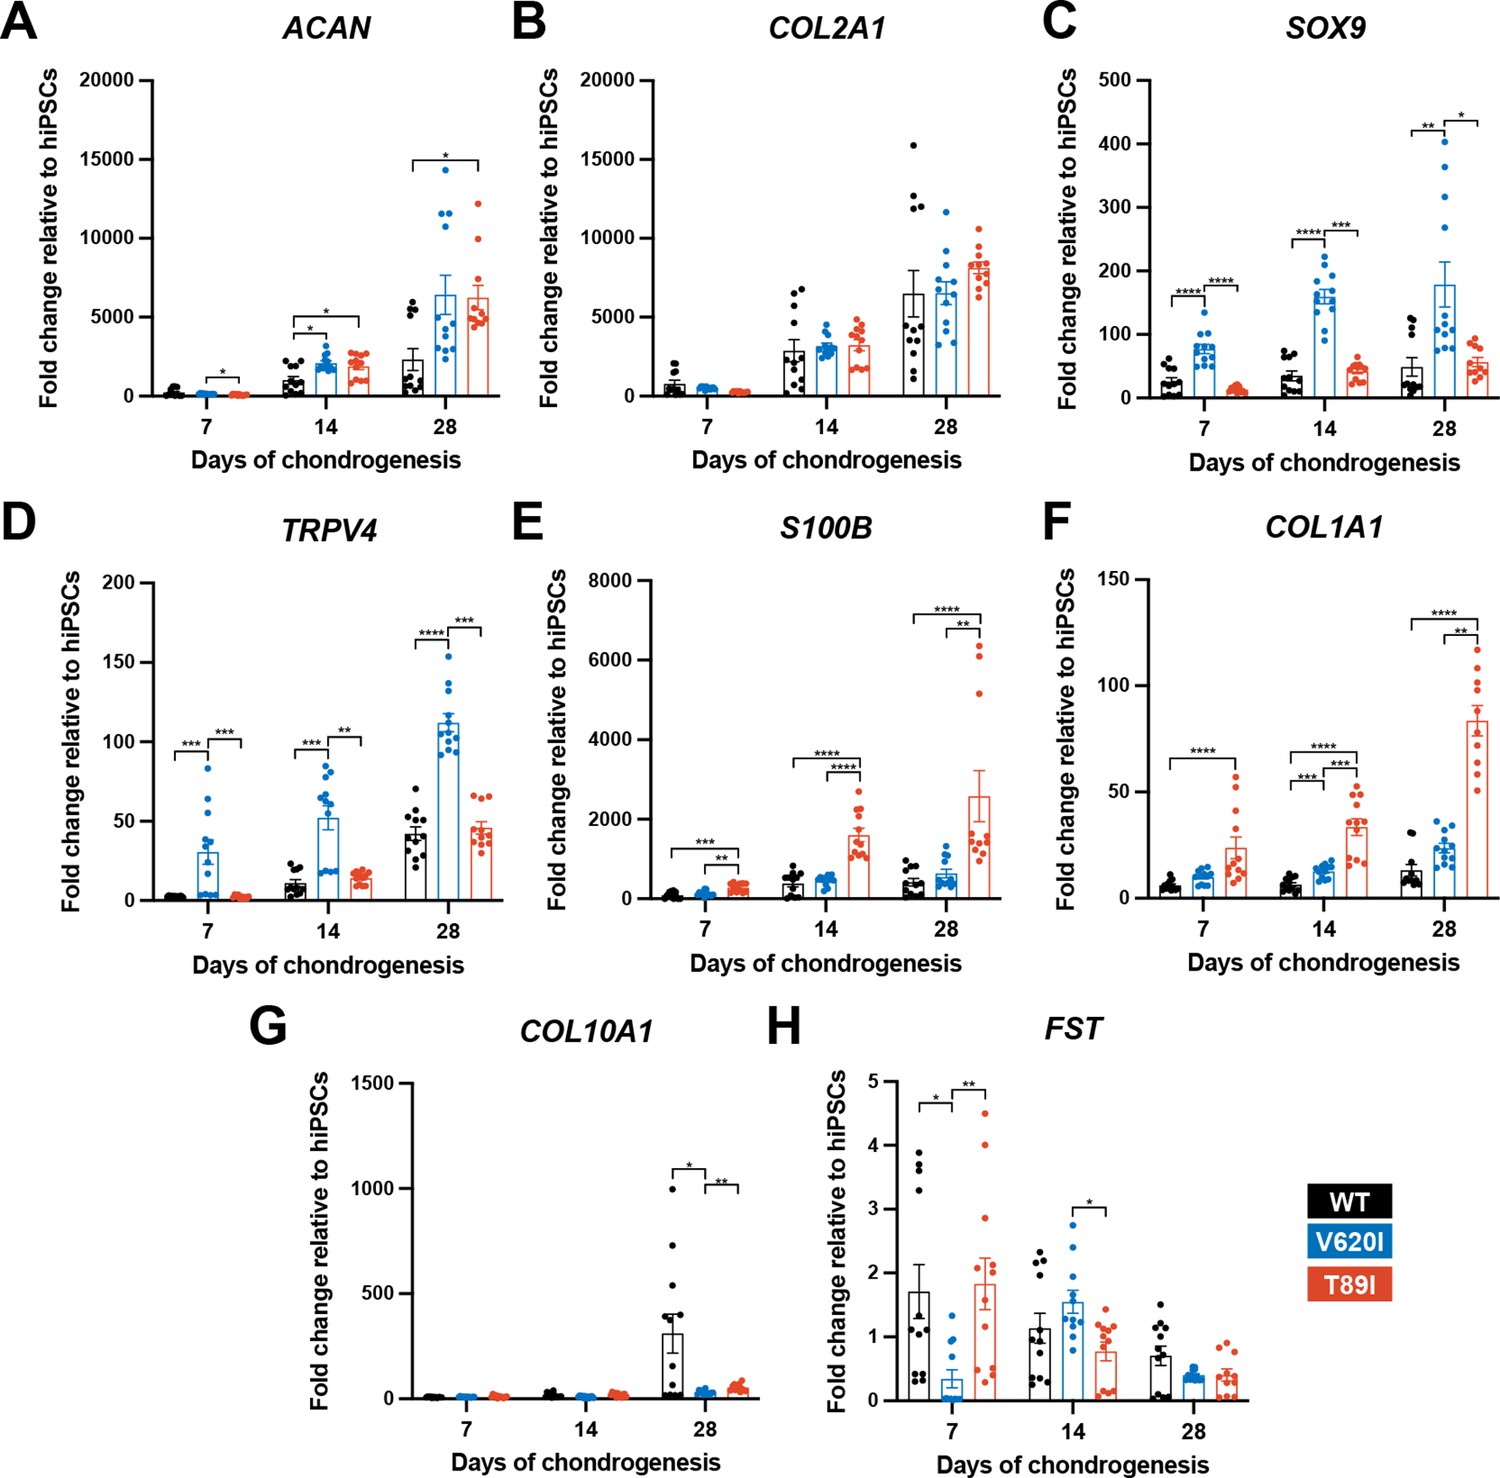
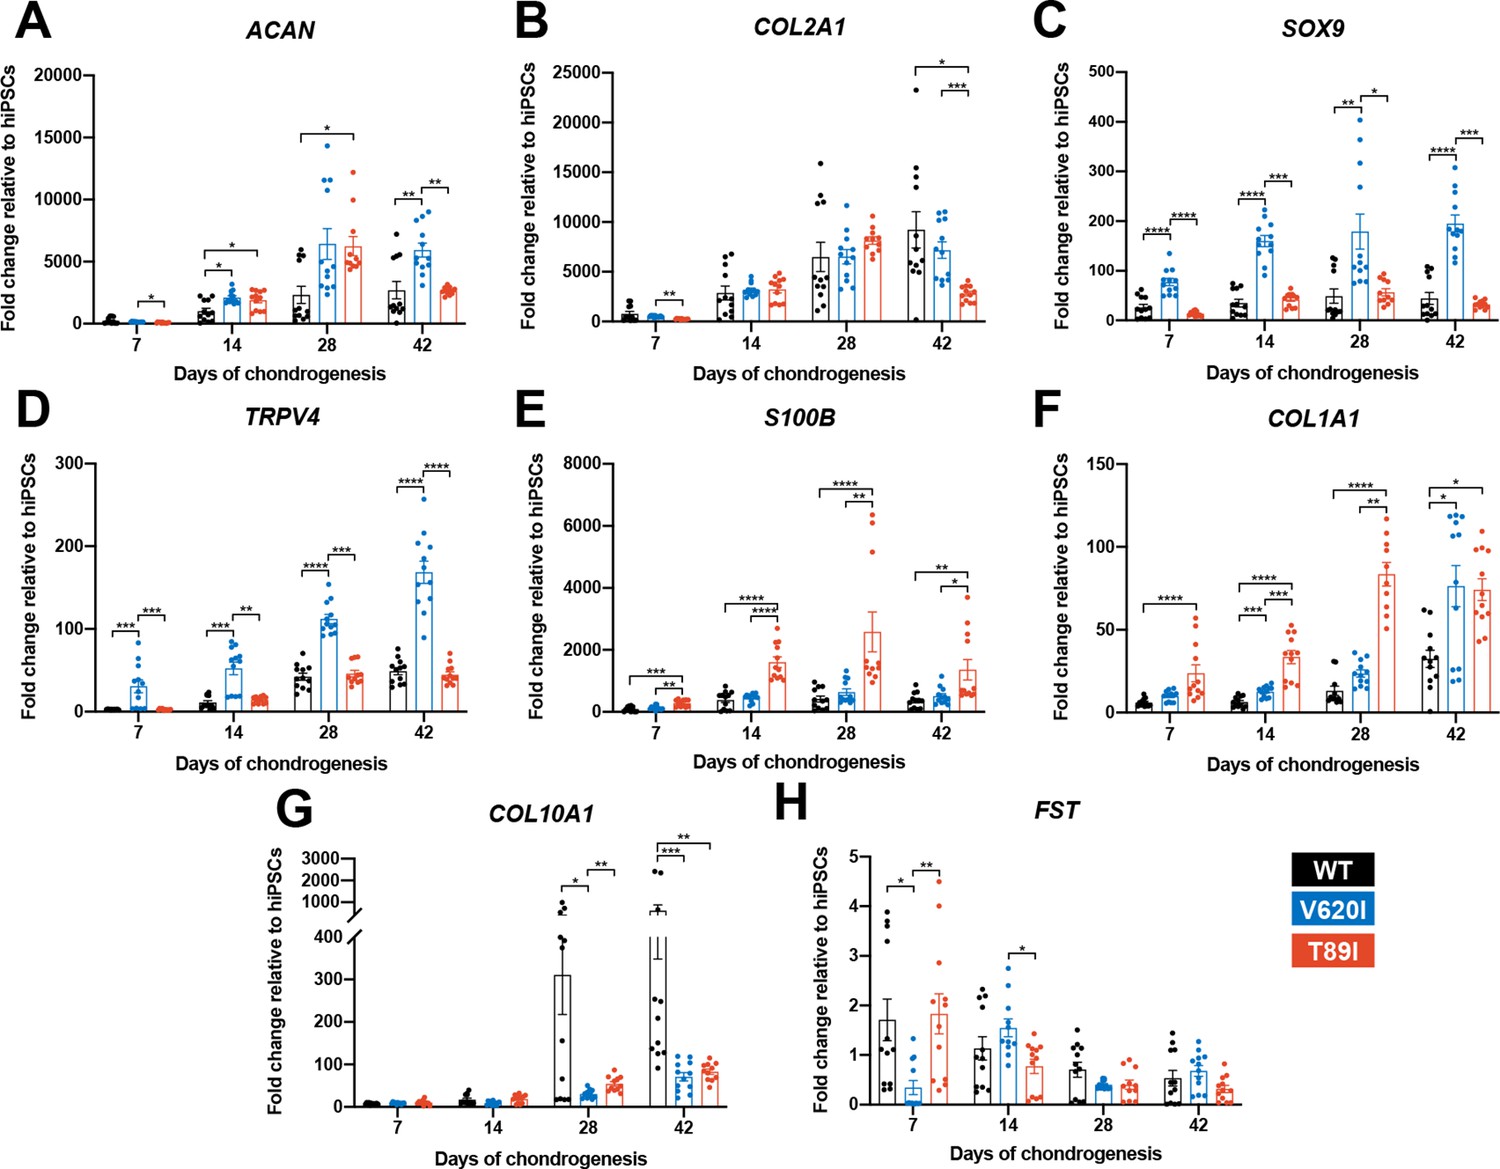
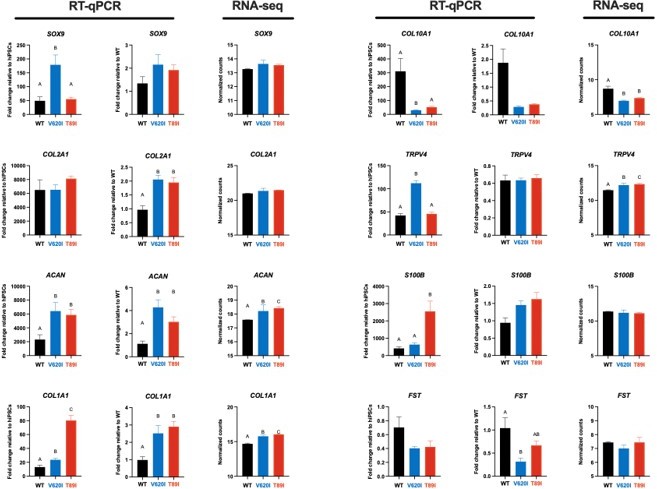
V620I and T89I exhibited differing effects on gene expression during chondrogenic differentiation.
(A) V620I and T89I had increased ACAN gene expression at day 28 compared to wildtype (WT). (B) The three lines had similar COL2A1 expression throughout differentiation. V620I increased expression of (C) SOX9 and (D) TRPV4 throughout chondrogenesis. T89I increased expression of (E) S100B and (F) COL1A1 throughout chondrogenesis. (G) Both mutations decreased COL10A1 gene expression at day 28 compared to WT. (H) There were no differences in FST expression at day 28. Mean ± standard error of the mean (SEM). n = 10–12 from 3 independent differentiation experiments. *p < 0.05, **p < 0.01, ***p < 0.001, ****p < 0.0001 Significance determined by one-way analysis of variance (ANOVA) with Tukey’s post hoc test for each time point.
Figure 3—figure supplement 1
V620I and T89I had differing effects on gene expression during chondrogenic differentiation.
(A) T89I and V620I had increased ACAN gene expression at days 28 and 42, respectively, compared to wildtype (WT). (B) Day-42 T89I chondrocytes had decreased expression of COL2A1. V620I increased expression of SOX9 (C) and TRPV4 (D) throughout chondrogenesis. T89I increased expression of S100B (E) and COL1A1 (F) throughout chondrogenesis. (G) Both mutations decreased COL10A1 gene expression at days 28 and 42, compared to WT. (H) There were no differences in FST expression at later time points days 28 and 42. Mean ± standard error of the mean (SEM). n = 10–12 from 3 differentiations. *p < 0.05, **p < 0.01, ***p < 0.001, ****p < 0.0001. Significance determined by one-way analysis of variance (ANOVA) with Tukey’s post hoc test for each time point.
Figure 4 with 2 supplements
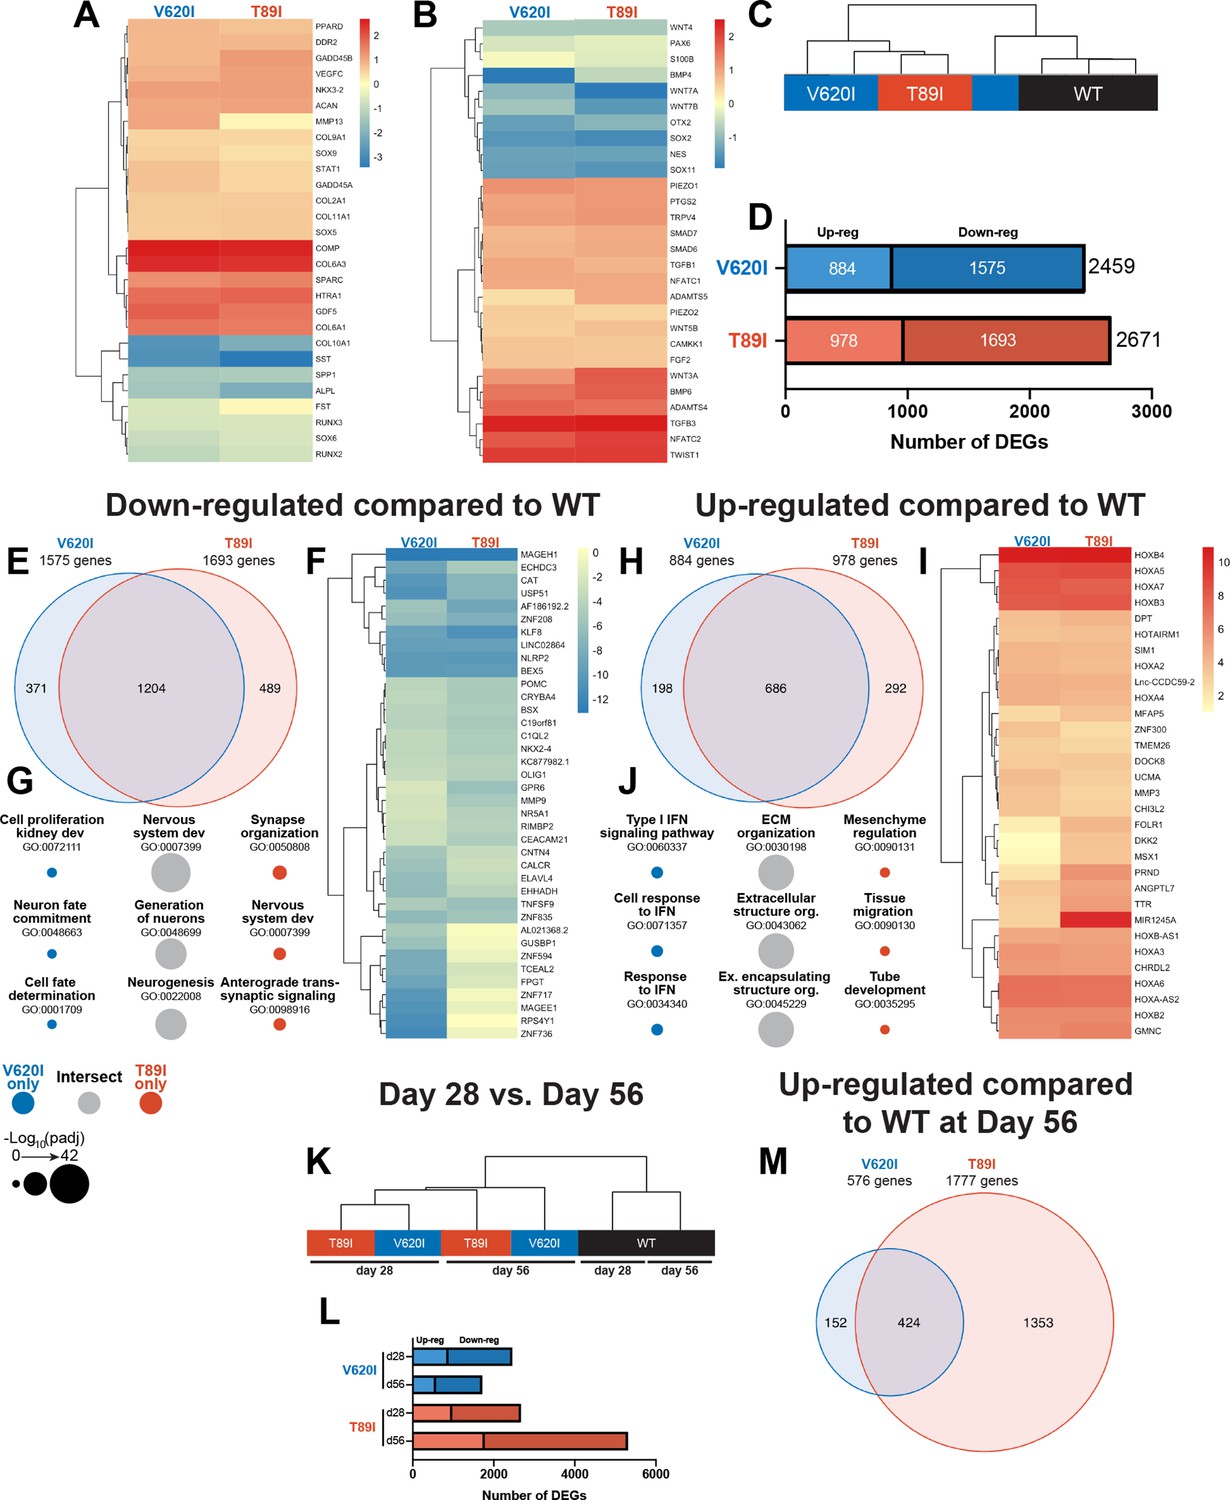
Dynamic changes in transcriptomic profiles of V620I and T89I mutants during chondrogenesis.
Heatmaps comparing the log2 fold change of common chondrogenic and hypertrophic genes (A) and growth factor and signaling genes (B) in day-28 V620I and T89I chondrocytes compared to wildtype (WT). (C) Clustering of the samples using Euclidean distances reveals that V620I and T89I human-induced pluripotent stem cell (hiPSC)-derived chondrocytes are more similar to each other than WT. (D) The number of up- and down-regulated differentially expressed genes (DEGs) in V620I and T89I day-28 chondrocytes compared to WT. (E–G) Analysis of the down-regulated genes compared to WT. (E) A Venn diagram reveals the number of similar and different down-regulated DEGs between V620I and T89I, where most genes are shared. (F) A heatmap showing the log2 fold change, compared to WT, of the top 25 down-regulated genes for each line. (G) The top 3 Gene Ontology (GO) terms (biological process) associated with the DEGs unique to V620I, shared between V620I and T89I, and unique to T89I. Symbol color represents the cell line, and size represents the −log10(padj).(H–J) Analysis of the up-regulated genes compared to WT. (H) A Venn diagram reveals the number of similar and different up-regulated DEGs between V620I and T89I, where most genes are shared. (I) A heatmap showing the log2 fold change, compared to WT, of the top 25 up-regulated genes for each line. (J) The top 3 GO terms (biological process) associated with the DEGs unique to V620I, shared between V620I and T89I, and unique to T89I. Symbol color represents the cell line, and size represents the −log10(padj). (K) Clustering of the day-28 and -56 samples using Euclidean distances reveals that the WT chondrocytes, at both days 28 and 56, cluster together while mutants cluster by time point. (L) The number of up- and down-regulated DEGs for V620I and T89I compared to WT at days 28 and 56. (M) A Venn diagram reveals the number of similar and different up-regulated DEGs between V620I and T89I, with T89I becoming more unique at day 56. n = 3–4 samples.
Figure 4—figure supplement 1
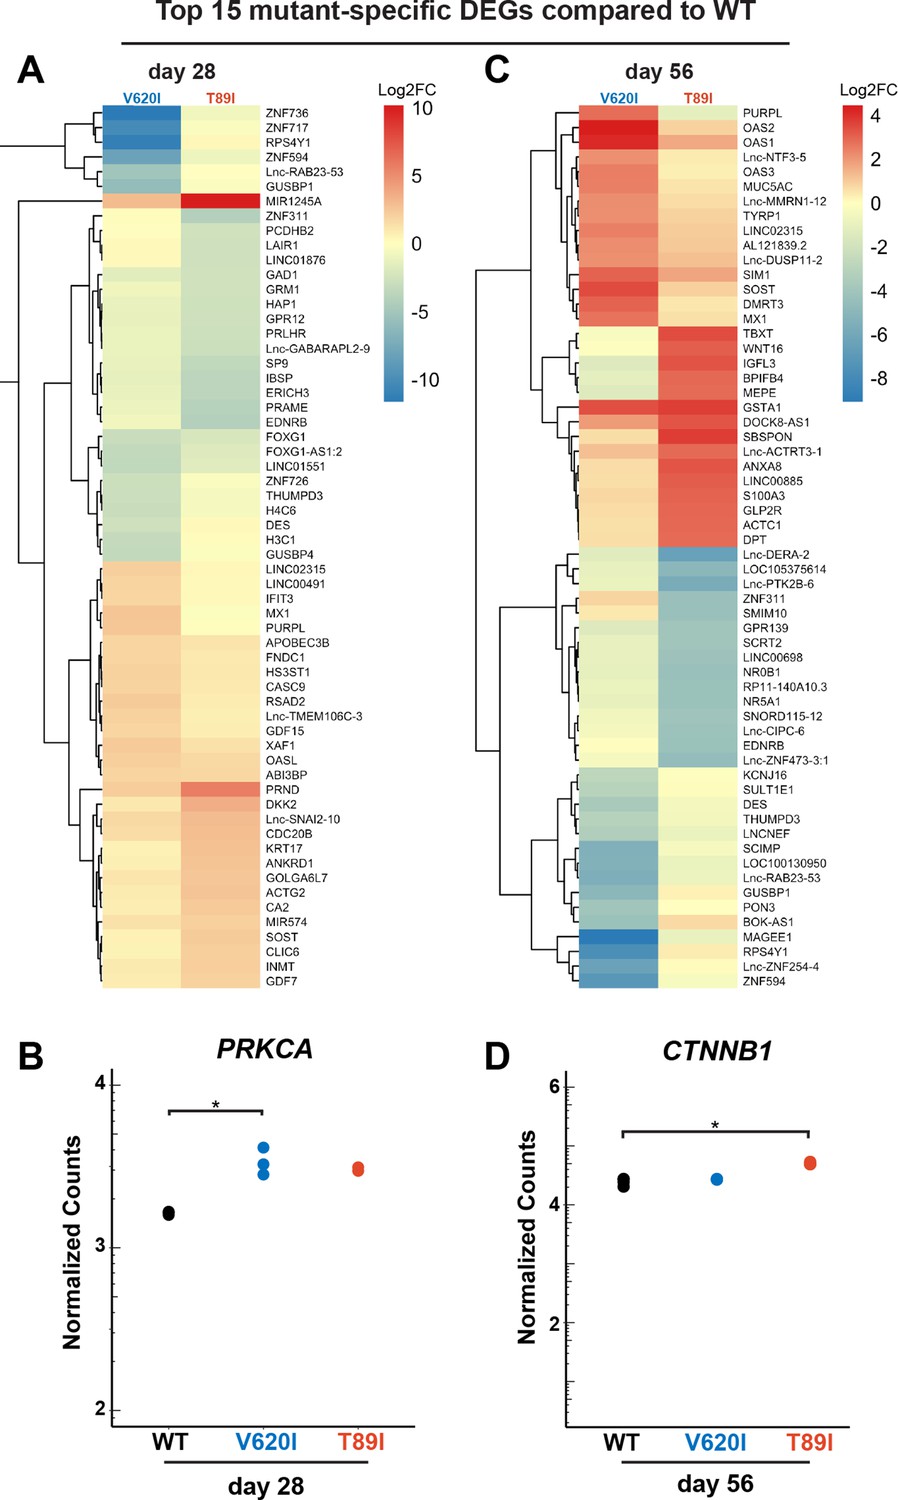
Distinction between V620I and T89I.
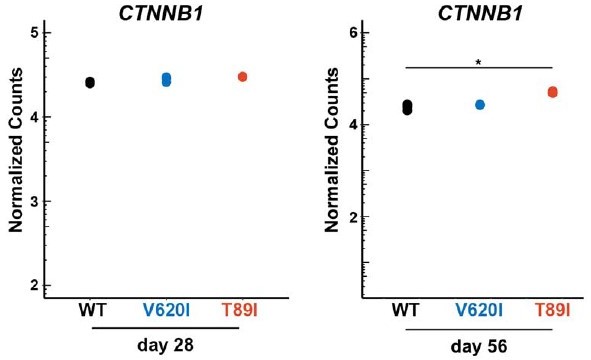
Moderate V620I and severe T89I mutations have distinct gene expression after 28 and 56 days of chondrogenic differentiation with TGFβ3. (A) A heatmap representing the log2 fold change, compared to wildtype (WT), of the top 15 most up- and down-regulated genes unique to V620I and T89I at day 28. (B) The expression of protein kinase C alpha (PRKCA) at day 28 for WT, V620I, and T89I represented by normalized counts. *padj ≤ 0.1 and log2(fold change) ≥1 (i.e., differentially expressed). (C) A heatmap representing the log2 fold change, compared to WT, of the top 15 most up- and down-regulated genes unique to V620I and T89I at day 56. (D) The expression of catenin beta 1 (CTNNB1) at day 56 for WT, V620I, and T89I represented by normalized counts. *padj ≤ 0.1 and log2(fold change) ≥1 (i.e., differentially expressed).
Figure 4—figure supplement 2
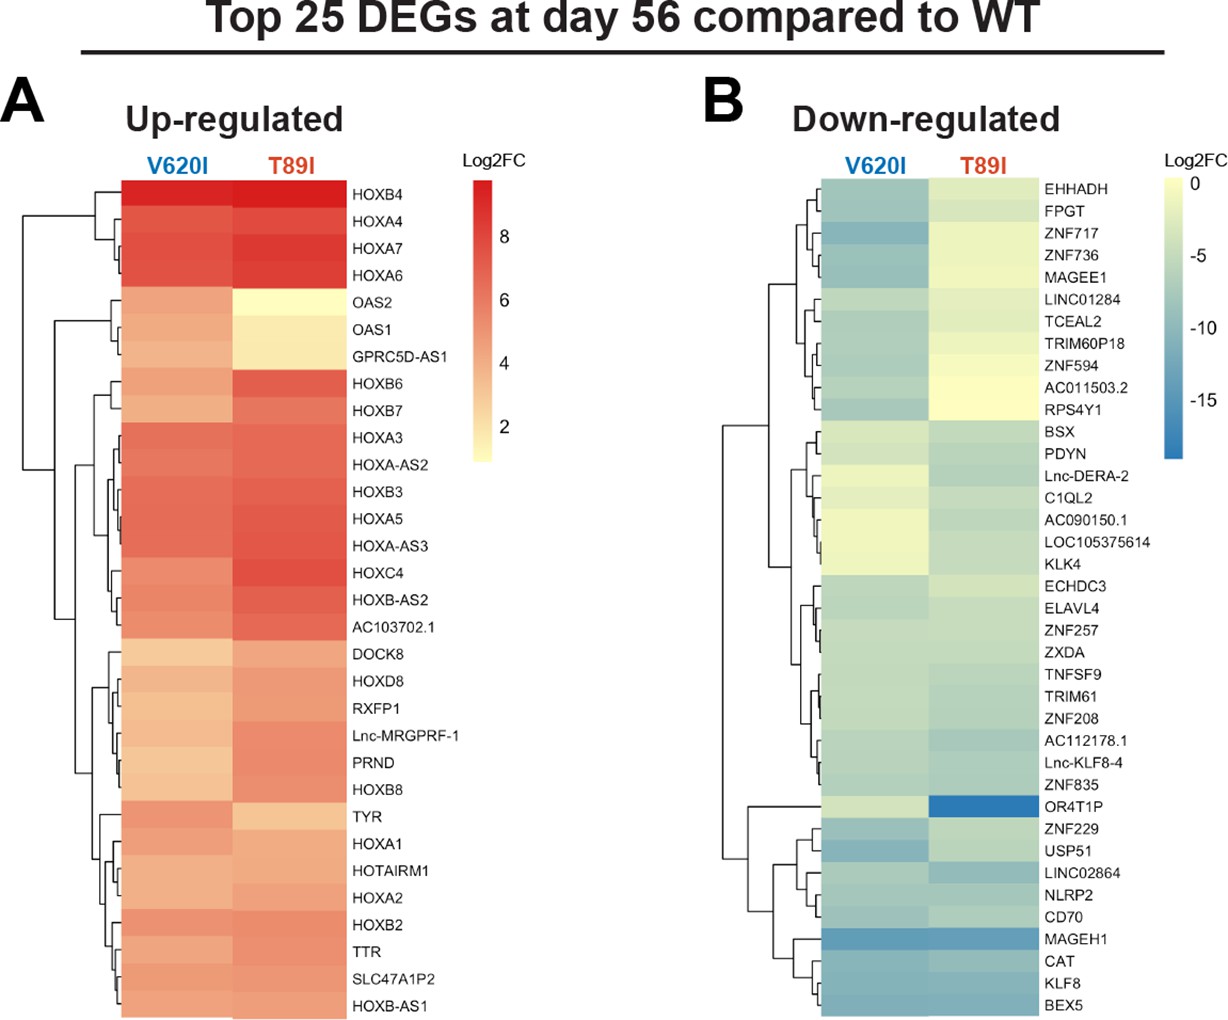
Top differentially expressed genes (DEGs) of V620I and T89I chondrocytes compared to wildtype (WT) remain from day 28 to 56.
(A) The top 25 up-regulated genes, and their log2 fold change, for day-56 TGFβ3-treated V620I and T89I chondrocytes compared WT. (B) The top 25 down-regulated genes, and their log2 fold change, for day-56 TGFβ3-treated V620I and T89I chondrocytes compared WT.
Figure 5 with 1 supplement
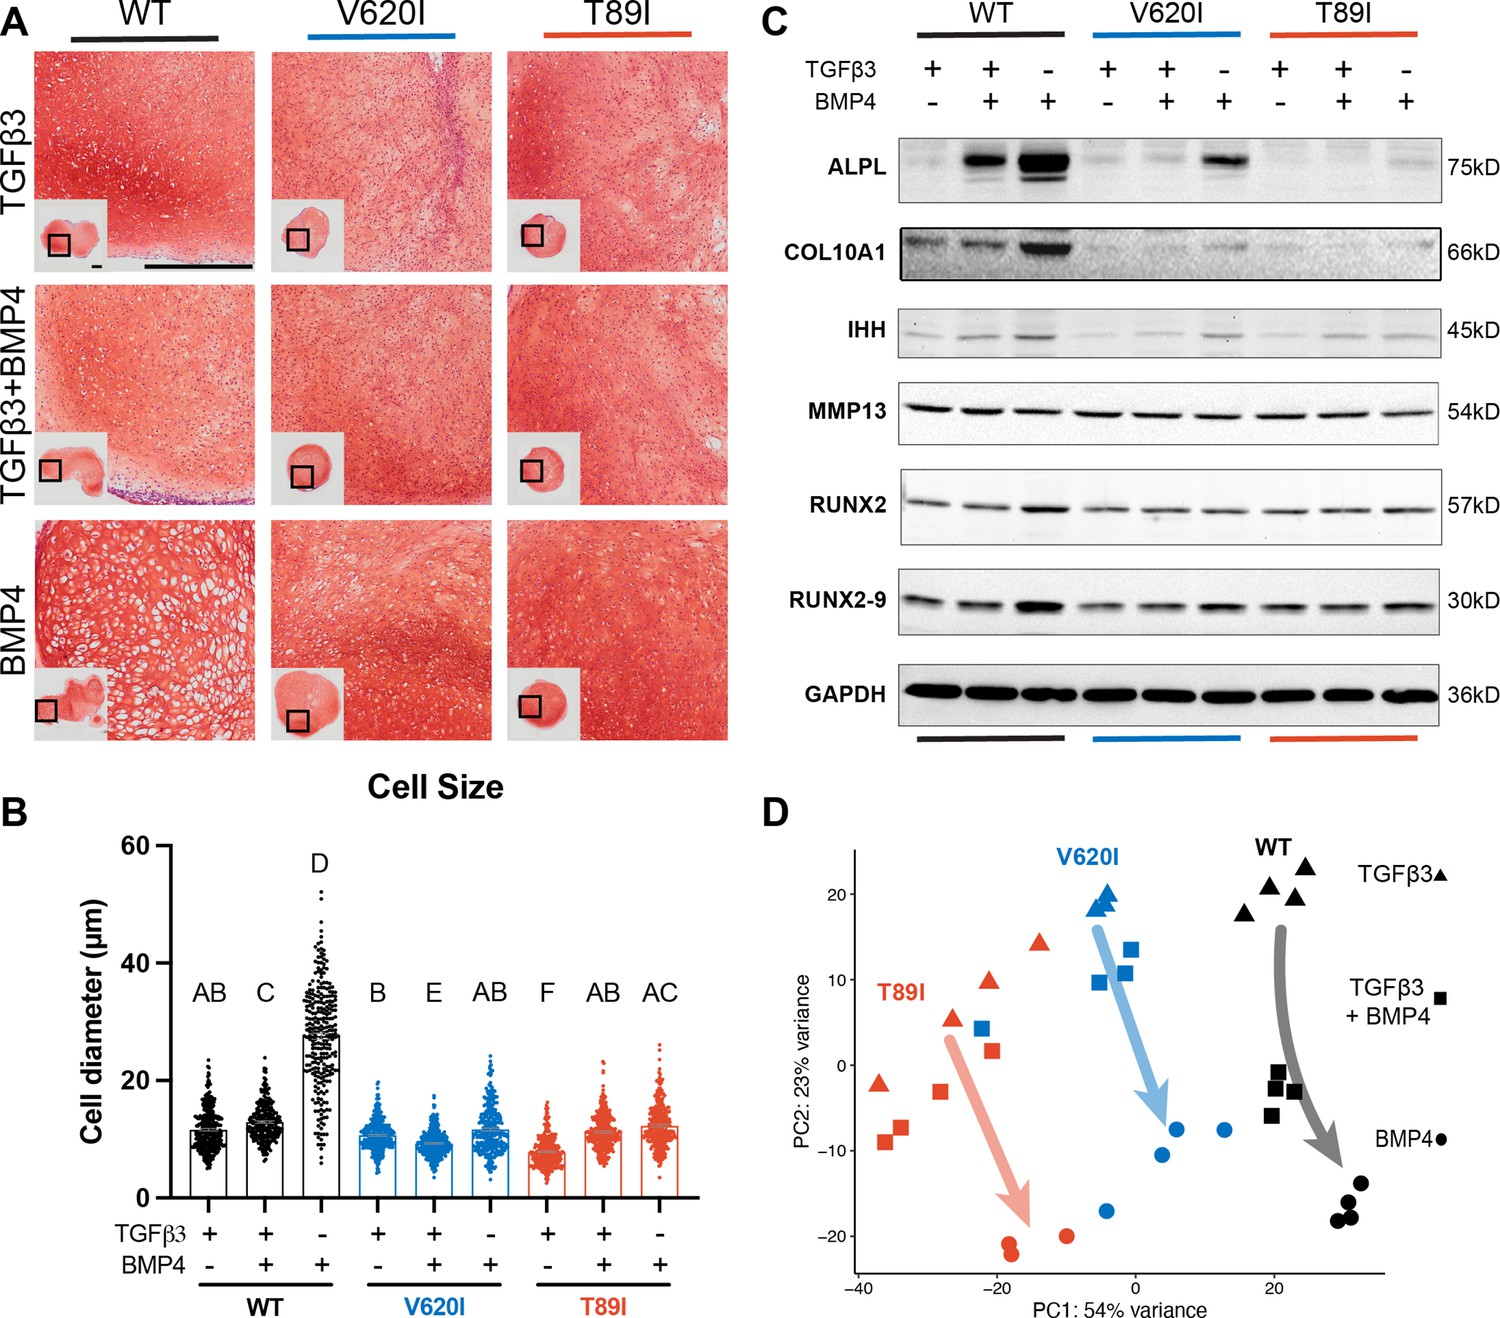
Wildtype (WT) chondrocytes are more sensitive to BMP4 treatment.
(A) WT chondrocytes treated with BMP4 developed a hypertrophic phenotype with enlarged lacunae, which was not present in the mutant cell lines or other conditions, as shown by Safranin-O and hematoxylin staining. Scale bar = 500 µm. Representative images from 2 experiments. (B) Cell diameter was significantly increased in the WT with BMP4 treatment compared to all other groups indicating a hypertrophic phenotype. Mean ± standard error of the mean (SEM). n = 249–304 cells from 2 pellets. Different letters indicate statistical significance (p < 0.05) between groups as determined by Kruskal–Wallis test with multiple comparisons since data was not normally distributed. (C) Western blot shows that WT had a stronger increased production of ALPL, COL10A1, IHH, RUNX2, and RUNX2-9 in response to BMP4 treatment than the mutants. (D) Principle component analysis (PCA) of bulk RNA-seq reveals an increased sensitivity to BMP4 (and TGFβ3 + BMP4) treatment in WT human-induced pluripotent stem cell (hiPSC)-derived chondrocytes compared to V620I and T89I. n = 3–4 samples.
-
Figure 5—source data 1
ALPL western blot: the full raw unedited gel with and without the bands labeled.
- https://cdn.elifesciences.org/articles/71154/elife-71154-fig5-data1-v2.zip
-
Figure 5—source data 2
COL10A1 western blot: the full raw unedited gel with and without the bands labeled.
- https://cdn.elifesciences.org/articles/71154/elife-71154-fig5-data2-v2.zip
-
Figure 5—source data 3
IHH western blot: the full raw unedited gel with and without the bands labeled.
- https://cdn.elifesciences.org/articles/71154/elife-71154-fig5-data3-v2.zip
-
Figure 5—source data 4
MMP13 western blot: the full raw unedited gel with and without the bands labeled.
- https://cdn.elifesciences.org/articles/71154/elife-71154-fig5-data4-v2.zip
-
Figure 5—source data 5
RUNX2 western blot: the full raw unedited gel with and without the bands labeled.
- https://cdn.elifesciences.org/articles/71154/elife-71154-fig5-data5-v2.zip
-
Figure 5—source data 6
GAPDH western blot: the full raw unedited gel with and without the bands labeled.
- https://cdn.elifesciences.org/articles/71154/elife-71154-fig5-data6-v2.zip
Figure 5—figure supplement 1
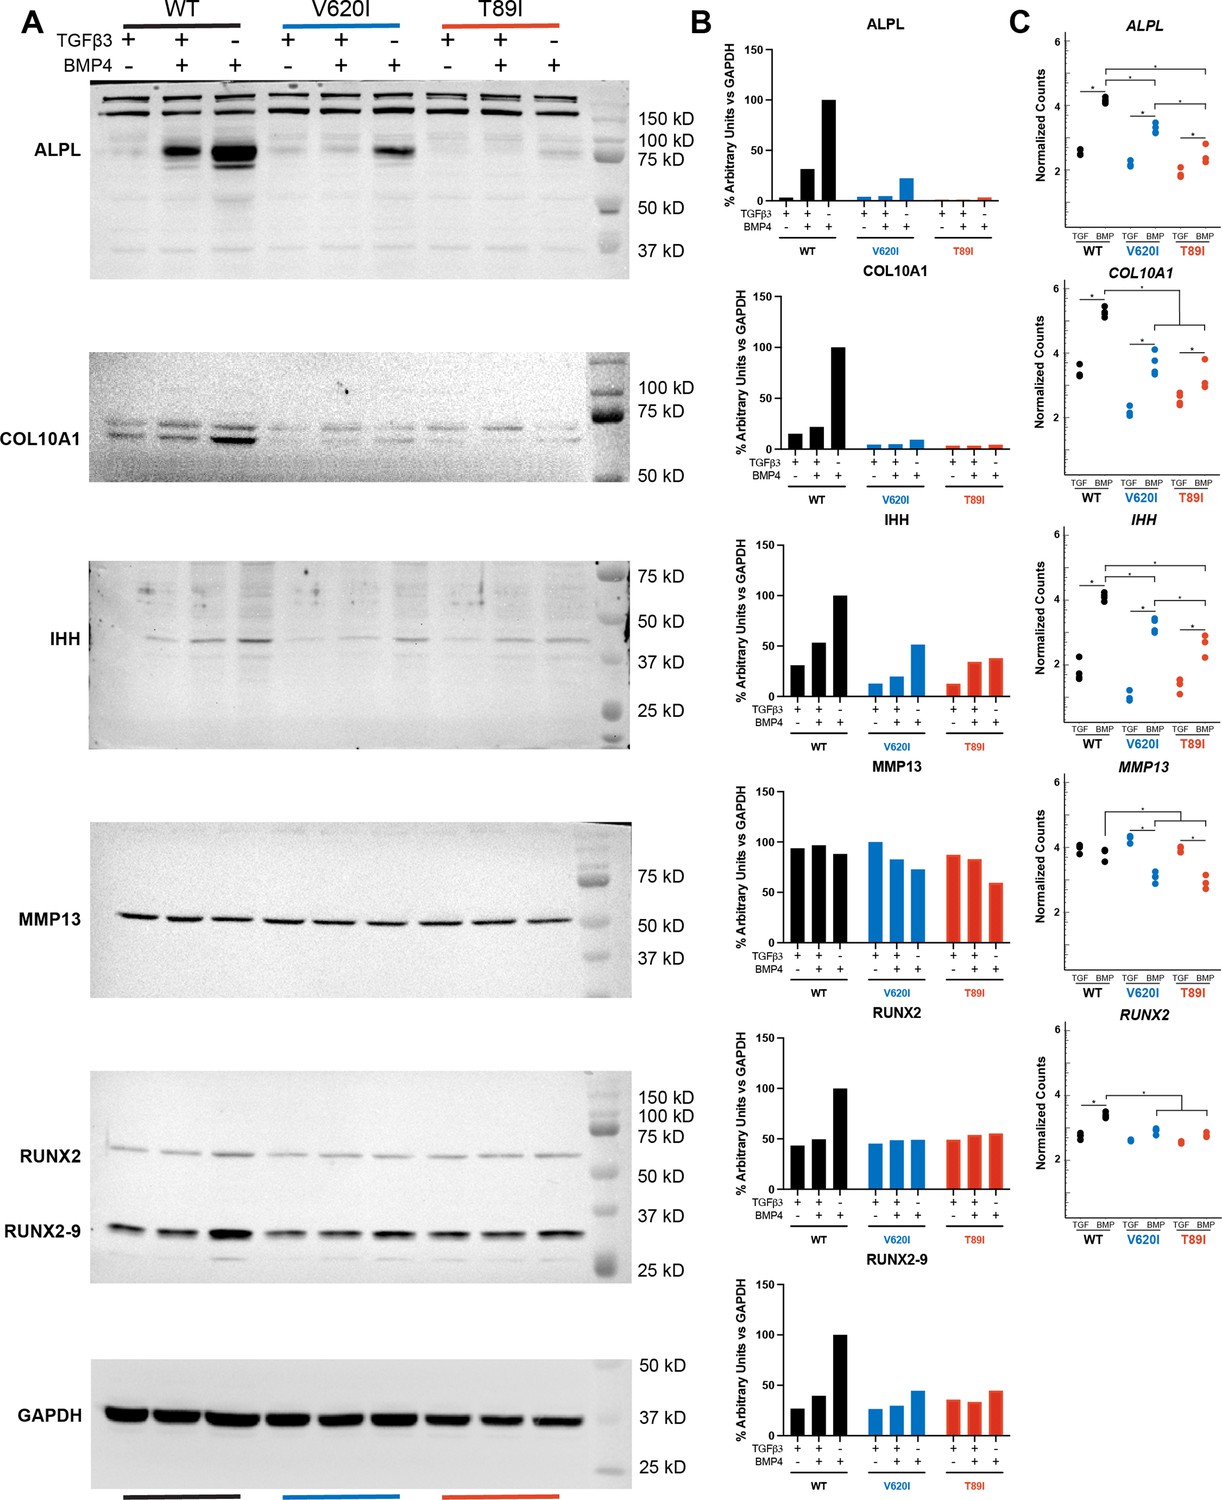
Hypertrophic gene and protein expression.
(A) The full images of the ALPL, COL10A1, IHH, MMP13, RUNX2, RUNX2-9, and GAPDH western blots. (B) Quantification of the western blots. (C) Gene expression from RNA sequencing for the same genes. For simplicity, TGFβ3- and BMP4-treated groups were included in the graphs. Mean ± n = 3–4. *p < 0.05. Significance determined by Student’s t-test comparing TGFβ3- and BMP4-treated groups within the cell line and one-way analysis of variance (ANOVA) with Tukey’s post hoc test comparing cell lines within BMP4-treated group.
Figure 6
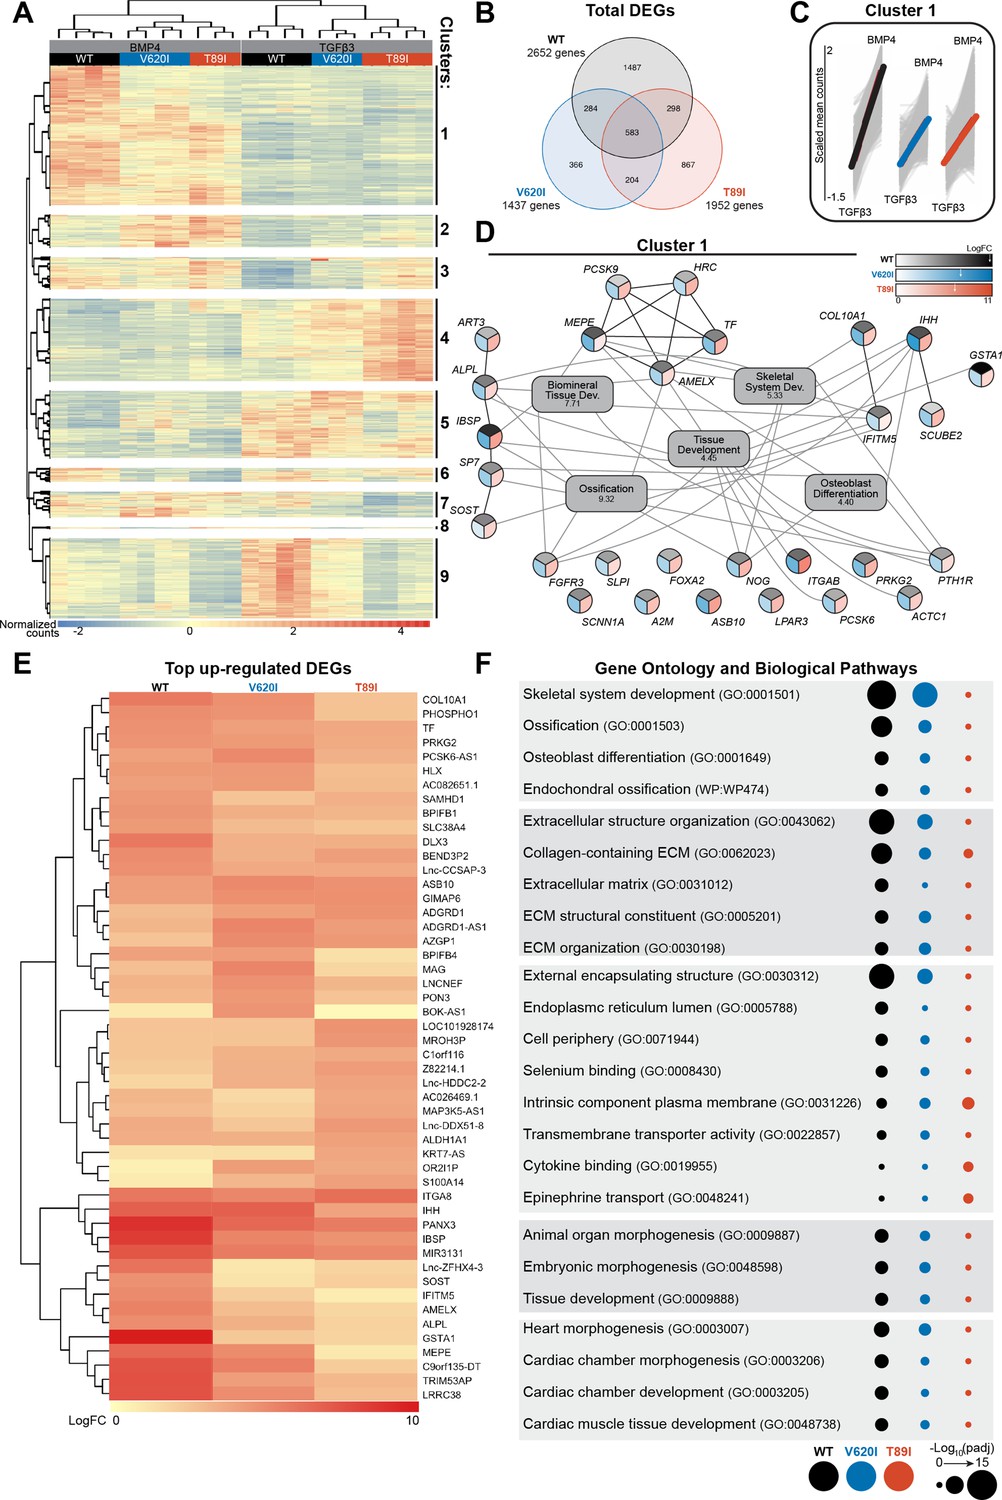
V620I and T89I had an inhibited hypertrophic response to BMP4 treatment.
(A) There are 9 clusters of genes based on expression and hierarchical k-means clustering of the samples. (B) Venn diagram shows similar and distinct differentially expressed genes (DEGs) in response to BMP4 treatment in all three lines. (C) Cluster 1 represented increasing in expression from TGFβ3 to BMP4 treatment (left to right on x-axis). Y-axis scale (−1.5 to 2) represents the scaled mean counts. (D) A protein–protein interaction network with functional enrichment analysis of cluster 1 reveals the top regulating genes and their associated concepts. Connections between protein-coding genes and Gene Ontology (GO) processes are based on the average log fold change between cell lines. Coloring of the protein-coding gene circles is divided into three to represent the log fold change for each cell line as shown in the legend. The white arrows in the legend indicates the location of the maximum log fold change for each respective cell line. The gray boxes represent the top 5 GO terms (biological process) identified for the network with the log10(false discovery rate) underneath the term. (E) A heatmap of the top 25 up-regulated genes, and their log2 fold change, in each line compared to their respective TGFβ3 controls. (F) The top GO terms and biological pathways associated with the up-regulated DEGs with BMP4 treatment. Symbol color represents the cell line, and size represents the −log10(padj).
Author response image 1
Author response image 2
Tables
Appendix 1—key resources table
| Reagent type (species) or resource | Designation | Source or reference | Identifiers | Additional information |
|---|---|---|---|---|
| Gene (Homo sapien) | TPRV4; Transient Receptor Potential Cation Channel Subfamily V Member 4 | HGNC Symbol | HGNC:18083; ENSEMBL:ENSG00000111199 | |
| Gene (Homo sapien) | SOX9; SRY-box transcription factor 9 | HGNC Symbol | HGNC:11204; ENSEMBL:ENSG00000125398 | |
| Gene (Homo sapien) | RUNX2; RUNX family transcription factor 2 | HGNC Symbol | HGNC:10472; ENSEMBL:ENSG00000124813 | |
| Gene (Homo sapien) | FST; follistatin | HGNC Symbol | HGNC:3971; ENSEMBL:ENSG00000134363 | |
| Gene (Homo sapien) | ACAN; aggrecan | HGNC Symbol | HGNC:319; ENSEMBL:ENSG00000157766 | |
| Gene (Homo sapien) | COL2A1; collagen type II alpha 1 chain | HGNC Symbol | HGNC:2200; ENSEMBL:ENSG00000139219 | |
| Gene (Homo sapien) | S100B; S100 calcium-binding protein B | HGNC Symbol | HGNC:10500; ENSEMBL:ENSG00000160307 | |
| Gene (Homo sapien) | COL1A1; collagen type I alpha 1 chain | HGNC Symbol | HGNC:2197; ENSEMBL:ENSG00000108821 | |
| Gene (Homo sapien) | COL10A1; collagen type X alpha 1 chain | HGNC Symbol | HGNC:2185; ENSEMBL:ENSG00000123500 | |
| Gene (Homo sapien) | ALPL; alkaline phosphatase, biomineralization associated | HGNC Symbol | HGNC:438; ENSEMBL:ENSG00000162551 | |
| Gene (Homo sapien) | IHH; Indian hedgehog signaling molecule | HGNC Symbol | HGNC:5956; ENSEMBL:ENSG00000163501 | |
| Gene (Homo sapien) | GSTA1; glutathione S-transferase alpha 1 | HGNC Symbol | HGNC:4626; ENSEMBL:ENSG00000243955 | |
| Gene (Homo sapien) | AMELX; amelogenin X-linked | HGNC Symbol | HGNC:461; ENSEMBL:ENSG00000125363 | |
| Gene (Homo sapien) | IFITM5; interferon induced transmembrane protein 5 | HGNC Symbol | HGNC:16644; ENSEMBL:ENSG00000206013 | |
| Gene (Homo sapien) | IBSP; integrin-binding sialoprotein | HGNC Symbol | HGNC:5341; ENSEMBL:ENSG00000029559 | |
| Gene (Homo sapien) | MEPE; matrix extracellular phosphoglycoprotein | HGNC Symbol | HGNC:13361; ENSEMBL:ENSG00000152595 | |
| Cell line (Homo sapien) | BJFF.6; BJFF | Washington University Genome Engineering and iPSC Center | RRID:CVCL_VU02 | Induced pluripotent stem cell derived from foreskin fibroblast |
| Cell line (Homo sapien) | V620I | This paper | Washington University Genome Engineering and iPSC Center; CRISPR-edited BJFF.6 with V620I TRPV4 mutation | |
| Cell line (Homo sapien) | T89I | This paper | Washington University Genome Engineering and iPSC Center; CRISPR-edited BJFF.6 with T89I TRPV4 mutation | |
| Antibody | Human Alkaline Phosphatase/ALPL Antibody; Anti-ALPL (mouse monoclonal) | R&D Systems | Cat #: MAB29092; RRID:AB_2924405 | WB (1:3000) |
| Antibody | Anti-Collagen I antibody; Anti-COL1A1 (mouse monoclonal) | Abcam | Cat #: ab90395; RRID:AB_2049527 | IHC P (1:800); pepsin retrieval (5 min, RT) |
| Antibody | Collagen type II: Anti-COL2A1 (mouse monoclonal) | Iowa Hybridoma Bank | Cat #: II-II6B3-s; RRID:AB_528165 | IHC P (1:10); proteinase k retrieval (3 min, 37°C) |
| Antibody | Collagen Type VI antibody; Anti-COL6A1 (rabbit polyclonal) | Fitzgerald Industries | Cat #: 70F-CR009X; RRID:AB_1283876 | IHC P (1:1000); proteinase k retrieval (3 min, 37°C) |
| Antibody | Monoclonal Anti-Collagen, Type X antibody produced in mouse; Anti-COL10A1 (mouse monoclonal) | Millipore Sigma | Cat #: C7974; RRID:AB_259075 | IHC P (1:200); pepsin retrieval (5 min, RT) |
| Antibody | Collagen X Polyclonal Antibody; anti-COL10A1 (rabbit polyclonal) | Thermo Fisher Scientific | Cat #: PA5-97603; RRID:AB_2812218 | WB (1:500) |
| Antibody | GAPDH Monoclonal antibody; anti-GAPDH (mouse monoclonal) | Proteintech | Cat #: 60004-1-Ig; RRID:AB_2107436 | WB (1:30,000) |
| Antibody | IHH Monoclonal Antibody (363CT4.1.6); Anti-IHH (mouse monoclonal) | Thermo Fisher Scientific | Cat #: MA5-37541; RRID:AB_2897471 | WB (1:500) |
| Antibody | MMP13 Monoclonal Antibody (VIIIA2); Anti-MMP13 (mouse monoclonal) | Thermo Fisher Scientific | Cat #: MA5-14238; RRID:AB_10981616 | WB (1:2000) |
| Antibody | RUNX2 Monoclonal Antibody (ZR002); Anti-RUNX2 (mouse monoclonal) | Thermo Fisher Scientific | Cat #: 41-1400 RRID: AB_2533497 | WB (1:2000) |
| Antibody | Anti-mouse IgG, HRP-linked antibody; horse anti-mouse IgG secondary antibody (horse polyclonal) | Cell Signaling | Cat #: 7076; RRID:AB_330924 | WB (1:30,000) |
| Antibody | Goat Anti-Mouse IgG H&L (Biotin); Goat anti-mouse antibody (goat polyclonal) | Abcam | Cat #: ab97021; RRID:AB_10679674 | IHC (1:500) |
| Antibody | Goat Anti-Rabbit IgG H&L (Biotin); Goat anti-rabbit antibody (goat polyclonal) | Abcam | Cat #: ab6720; RRID:AB_954902 | IHC (1:500) |
| Sequence-based reagent | ACAN_F | Huynh et al., 2020 | PCR primers | CACTTCTGAGTTCGTGGAGG |
| Sequence-based reagent | ACAN_R | Huynh et al., 2020 | PCR primers | ACTGGACTCAAAAAGCTGGG |
| Sequence-based reagent | COL1A1_F | Adkar et al., 2019 | PCR primers | TGTTCAGCTTTGTGGACCTC |
| Sequence-based reagent | COL1A1_R | Adkar et al., 2019 | PCR primers | TTCTGTACGCAGGTGATTGG |
| Sequence-based reagent | COL2A1_F | Adkar et al., 2019 | PCR primers | GGCAATAGCAGGTTCACGTA |
| Sequence-based reagent | COL2A1_R | Adkar et al., 2019 | PCR primers | CTCGATAACAGTCTTGCCCC |
| Sequence-based reagent | COL10A1_F | Adkar et al., 2019 | PCR primers | CATAAAAGGCCCACTACCCAAC |
| Sequence-based reagent | COL10A1_R | Adkar et al., 2019 | PCR primers | ACCTTGCTCTCCTCTTACTGC |
| Sequence-based reagent | FST_F | Ohta et al., 2015 | PCR primers | TGTGCCCTGACAGTAAGTCG |
| Sequence-based reagent | FST_R | Ohta et al., 2015 | PCR primers | GTCTTCCGAAATGGAGTTGC |
| Sequence-based reagent | S100B_F | Dix et al., 2016 | PCR primers | AGGGAGGGAGACAAGCACAA |
| Sequence-based reagent | S100B_R | Dix et al., 2016 | PCR primers | ACTCGTGGCAGGCAGTAGTA |
| Sequence-based reagent | SOX9_F | Loh et al., 2016 | PCR primers | CGTCAACGGCTCCAGCAAGAACAA |
| Sequence-based reagent | SOX9_R | Loh et al., 2016 | PCR primers | GCCGCTTCTCGCTCTCGTTCAGAAGT |
| Sequence-based reagent | TRPV4_F | Luo et al., 2018 | PCR primers | AGAACTTGGGCATCATCAACGAG |
| Sequence-based reagent | TRPV4_R | Luo et al., 2018 | PCR primers | GTTCGAGTTCTTGTTCAGTTCCAC |
| Sequence-based reagent | TBP_F | Adkar et al., 2019 | PCR primers | AACCACGGCACTGATTTTCA |
| Sequence-based reagent | TBP_R | Adkar et al., 2019 | PCR primers | ACAGCTCCCCACCATATTCT |
| Peptide, recombinant protein | Vitronectin; VTN-N | Thermo Fisher Scientific | Cat #: A14700 | |
| Peptide, recombinant protein | Activin | R&D Systems | Cat #: 338-AC | |
| Peptide, recombinant protein | Fibroblastic growth factor 2; FGF2 | R&D Systems | Cat #: 233-FB-025/CF | |
| Peptide, recombinant protein | Bone morphogenetic protein 4; BMP4 | R&D Systems | Cat #: 314-BP-010CF | |
| Peptide, recombinant protein | Human transforming growth factor- 3; TGF 3 | R&D Systems | Cat #: 243-B3-010/CF | |
| Peptide, recombinant protein | Type II collagenase | Worthington Biochemical | Cat #: LS00417 | Activity 225 u/ML |
| Commercial assay or kit | Fluo-4 AM | Thermo Fisher Scientific | Cat #: F14201 | |
| Commercial assay or kit | Fura Red AM | Thermo Fisher Scientific | Cat #: F3021 | |
| Commercial assay or kit | Quant-iT PicoGreen dsDNA Assay Kit; PicoGreen | Thermo Fisher Scientific | Cat #: P7589 | |
| Commercial assay or kit | Total RNA Purification Plus Kit | Norgen Biotek | Cat #: 48400 | |
| Commercial assay or kit | Fast SYBR green | Thermo Fisher Scientific | Cat #: 4385610 | |
| Commercial assay or kit | Histostain Plus Kit | Thermo Fisher Scientific | Cat #: 858943 | |
| Commercial assay or kit | AEC substrate solution | Abcam | Cat #: ab64252 | |
| Chemical compound, drug | Y-27632 | STEMCELL Technologies | Cat #: 72304 | |
| Chemical compound, drug | ReLeSR | STEMCELL Technologies | Cat #: 053263872 | |
| Chemical compound, drug | CHIR99021 | Reprocell | Cat #: 04-0004-02 | |
| Chemical compound, drug | SB505124 | Tocris Bioscience | Cat #: 3263 | |
| Chemical compound, drug | Dorsomorphin; DM | Reprocell | Cat #: 04-0024 | |
| Chemical compound, drug | PD173074 | Tocris Bioscience | Cat #: 3044 | |
| Chemical compound, drug | Wnt-C59 | Cellagen Technologies | Cat #: C7641-2s | |
| Chemical compound, drug | Purmorphamine | Reprocell | Cat #: 04-0009 | |
| Chemical compound, drug | 1-Thioglycerol | Millipore Sigma | Cat #: M6145 | |
| Chemical compound, drug | 2-Mercaptoethnol; 2-ME | Thermo Fisher Scientific | Gibco; Cat #: 21985023 | |
| Chemical compound, drug | L-Ascorbic acid; ascorbate | Millipore Sigma | Cat #: A89 60 | |
| Chemical compound, drug | L-Proline; proline | Millipore Sigma | Cat #: P5607 | |
| Chemical compound, drug | ML329 | Cayman Chemical | Cat #: 2248 | |
| Chemical compound, drug | Dexamethasone; Dex | Millipore Sigma | Cat #: D4902 | |
| Chemical compound, drug | GSK1016790A; GSK101 | Sigma-Aldrich | Cat #: G0798 | |
| Chemical compound, drug | GSK205 | AOBIOUS | Cat #: AOB1612 1263130-79-5 | |
| Chemical compound, drug | Sulfinpyrazone | Sigma-Aldrich | Cat #: S9509-5G | |
| Chemical compound, drug | 1,9-Dimethylmethylene blue; DMMB | Sigma-Aldrich | Cat #: 341088 | |
| Software, algorithm | pClamp software suite | Molecular Devices | RRID:SCR_011323 | |
| Software, algorithm | Fiji software – ImageJ | This paper | RRID:SCR_002285; version 2.1.0 | Used to analyze fluorescence confocal imaging of calcium signaling |
| Software, algorithm | MATLAB – Hertz model | Darling et al., 2006 | Used to analyze AFM data to determine modulus | |
| Software, algorithm | bcl2fastq | llumina | RRID:SCR_015058 | |
| Software, algorithm | Ensembl release 76 primary assembly with STAR | Dobin et al., 2013 | RRID:SCR_002344; version 2.5.1a | |
| Software, algorithm | Subread:featureCount | Liao et al., 2014 | RRID:SCR_012919; version 1.4.6-p5 | |
| Software, algorithm | Salmon | Patro et al., 2017 | RRID:SCR_017036; version 0.8.2 | |
| Software, algorithm | RSeQC | Wang et al., 2012 | RRID:SCR_005275; version 2.6.2 | |
| Software, algorithm | DESeq2 R package | Love et al., 2014 | RRID:SCR_015687 | |
| Software, algorithm | Pheatmap R package | Kolde, 2015 | RRID:SCR_016418 | |
| Software, algorithm | ggplot2 R package | Wickham, 2009 | RRID:SCR_014601 | |
| Software, algorithm | GraphPad Prism, version 9.1 | GraphPad Software, Boston, MA | RRID:SCR_002798; version 9.1.0 | |
| Software, algorithm | VennDiagram R package | Chen and Boutros, 2011 | RRID:SCR_002414 | |
| Software, algorithm | g:profiler | Raudvere et al., 2019 | RRID:SCR_006809 | |
| Software, algorithm | tidyverse R package | Altman and Krzywinski, 2017 | RRID:SCR_019186 | |
| Software, algorithm | Cytoscape String | Doncheva et al., 2019; Shannon et al., 2003 | RRID:SCR_003032 | |
| Other | Essential 8 Flex Media; E8 | Thermo Fisher Scientific | Gibco; Cat #: A2858501 | hiPSC medium (see Materials and methods: hiPSC culture) |
| Other | Iscove’s Modified Dulbecco’s Medium, glutaMAX; IMDM | Thermo Fisher Scientific | Gibco; Cat #: 31980097 | Mesodermal differentiation medium (see Materials and methods: Mesodermal differentiation) |
| Other | Ham’s F-12 nutrient mix, glutaMAX; F12 | Thermo Fisher Scientific | Gibco; Cat #: 31765092 | Mesodermal differentiation medium (see Materials and methods: Mesodermal differentiation) |
| Other | Penicillin–streptomycin; P/S | Thermo Fisher Scientific | Gibco; Cat #: 15140122 | Mesodermal and chondrogenic differentiation medium supplement (see Materials and methods: Mesodermal differentiation, Chondrogenic differentiation with 3D pellet culture) |
| Other | Insulin–Transferrin–Selenium; ITS+ | Thermo Fisher Scientific | Gibco; Cat #: 41400045 | Mesodermal and chondrogenic differentiation medium supplement (see Materials and methods: Mesodermal differentiation, Chondrogenic differentiation with 3D pellet culture) |
| Other | Chemically defined concentrated lipids | Thermo Fisher Scientific | Cat #: 11905031 | Mesodermal differentiation medium supplement (see Materials and methods: Mesodermal differentiation) |
| Other | Dulbecco’s Modified Eagle Medium/F12, glutaMAX; DMEM/F12 | Thermo Fisher Scientific | Cat #: 10565042 | Chondrogenic differentiation medium (see Materials and methods: Chondrogenic differentiation with 3D pellet culture) |
| Other | Modified Eagle Medium (MEM) with nonessential amino acids; NEAA | Thermo Fisher Scientific | Gibco; Cat #: 11140050 | Chondrogenic differentiation medium supplement (see Materials and methods: Chondrogenic differentiation with 3D pellet culture) |
| Other | Fetal bovine serum; FBS | Atlanta Biologicals | Cat #: S11550 | Neutralization medium (see Materials and methods: Chondrogenic differentiation with 3D pellet culture) |
| Other | Axopatch 1D patch-clamp amplifier and digitized with Digidata 1320 digitizer | Molecular Devices | Patch clamping equipment (see Materials and methods: Patch clamping) | |
| Other | Soda lime glass | Kimble Chase | Cat #: 2502 | Patch clamping equipment (see Materials and methods: Patch clamping) |
| Other | Sutter P-86 puller | Sutter Instruments | Patch clamping equipment (see Materials and methods: Patch clamping) | |
| Other | HEPES | Thermo Fisher Scientific | Gibco; Cat #: 15630130 | Calcium signaling medium (see Materials and methods: TRPV4 agonists and antagonists, Patch clamping) |
| Other | Confocal microscope | Zeiss | LSM 880 | Calcium signaling equipment (see Materials and methods: Confocal imaging of Ca2+ signaling) |
| Other | Optimal cutting temperature; OCT | Sakura Finetek | Cat #: 4583 | AFM materials (see Materials and methods: AFM measurement of neocartilage mechanical properties) |
| Other | Cryofilm | Section-Lab | Type: 2C(10) | AFM materials (see Materials and methods: AFM measurement of neocartilage mechanical properties) |
| Other | Atomic force microscopy; AFM | Asylum Research | Cat #: MFP-3D Bio | AFM equipment (see Materials and methods: AFM measurement of neocartilage mechanical properties) |
| Other | Silicon cantilever with a spherical tip | Novascan Technologies | 5 μm diameter, k ~ 7.83 N/m; AFM materials (see Materials and methods: AFM measurement of neocartilage mechanical properties) | |
| Other | RIPA buffer | Cell Signaling Technology | Cat #: 9806S | Western blot materials (see Materials andmethods: Western blot) |
| Other | Protease inhibitor | Thermo Fisher Scientific | Cat #: 87786 | Western blot materials (see Materials and methods: Western blot) |
| Other | TidyBlot Western Blot Detection Reagent:HRP; TidyBlot-Reagent-HRP | Bio-Rad | Cat #: STAR209 | 1:1000; Western blot materials (see Materials and methods: Western blot) |
| Other | 10% sodium dodecyl sulfate–polyacrylamide gel electrophoresis gel with pre-stained molecular weight markers | Bio-Rad | Cat #: 161-0374 | Western blot materials (see Materials and methods: Western blot) |
| Other | iBright FL1000 Imaging System | Thermo Fisher Scientific | Western blot equipment (see Materials and methods: Western blot) | |
| Other | DNase | Norgen Biotek | Cat #: 25720 | RNA sequencing materials (see Materials and methods: Genome-wide mRNA sequencing) |
| Other | RNA Clean-Up and Concentration Kit | Norgen Biotek | Cat #: 43200 | RNA sequencing materials (see Materials and methods: Genome-wide mRNA sequencing) |
| Other | NovaSeq 6000 | Illumina | RNA sequencing equipment (see Materials and methods: Genome-wide mRNA sequencing) | |
| Other | Safranin-O solution; Saf-O | Millipore Sigma | Cat #: HT904 | Histology materials (see Materials and methods: Histology) |
| Other | Harris hematoxylin with glacial acetic acid; hematoxylin | Poly Scientific | Cat #: 212A16OZ | Histology materials (see Materials and methods: Histology) |
| Other | Vector hematoxilyn QS counterstain | Vector Laboratories | Cat #: H-3404 | Histology materials (see Materials and methods: Histology) |
Additional files
-
Supplementary file 1
Additional figures to support data in Figures 2, 3 and 5.
Figure 2—figure supplement 1. Matrix production and mechanical properties through day 42 of chondrogenic differentiation. Figure 3—figure supplement 1. Gene expression using RT-qPCR through day 42 of chondrogenic differentiation. Figure 4—figure supplement 1. Top 15 mutant-specific differentially expressed genes (DEGs) compared to wildtype (WT) and genes of interest at days 28 and 56 as identified by RNA sequencing. Figure 4—figure supplement 2. Top 25 most up- and down-regulated DEGs compared to WT at day 56 as identified by RNA sequencing. Figure 5—figure supplement 1. Hypertrophic gene and protein expression in TGFβ3- and BMP4-treated day-56 chondrogenic pellets.
- https://cdn.elifesciences.org/articles/71154/elife-71154-supp1-v2.xlsx
-
Transparent reporting form
- https://cdn.elifesciences.org/articles/71154/elife-71154-transrepform1-v2.docx
Download links
A two-part list of links to download the article, or parts of the article, in various formats.
Downloads (link to download the article as PDF)
Open citations (links to open the citations from this article in various online reference manager services)
Cite this article (links to download the citations from this article in formats compatible with various reference manager tools)
Skeletal dysplasia-causing TRPV4 mutations suppress the hypertrophic differentiation of human iPSC-derived chondrocytes
eLife 12:e71154.
https://doi.org/10.7554/eLife.71154


