A novel immunopeptidomic-based pipeline for the generation of personalized oncolytic cancer vaccines
- Drug Research Program (DRP) ImmunoViroTherapy Lab (IVT), Division of Pharmaceutical Biosciences, Faculty of Pharmacy, Viikinkaari 5E, University of Helsinki, Finland
- Helsinki Institute of Life Science (HiLIFE), Fabianinkatu 33, University of Helsinki, Finland
- Translational Immunology Program (TRIMM), Faculty of Medicine Helsinki University, postal code Haartmaninkatu 8, University of Helsinki, Finland
- Experimental Hematology Unit, Division of Immunology, Transplantation and Infectious Diseases, IRCCS San Raffaele Scientific Institute, University Vita-Salute San Raffaele, Italy
- Digital Precision Cancer Medicine Flagship (iCAN), University of Helsinki, Finland
- Institute for Molecular Medicine Finland, FIMM, Helsinki Institute of Life Science (HiLIFE), University of Helsinki, Finland
- Pharmaceutical Biophysics Research Group, Drug Research Program, Faculty of Pharmacy, University of Helsinki, Finland
- Valo Therapeutics Oy, Finland
- Science for Life Laboratory, Department of Oncology-Pathology, Karolinska Institutet, Sweden
- Department of Molecular Medicine and Medical Biotechnology, Naples University “Federico II”, Italy
Figures
Figure 1 with 1 supplement
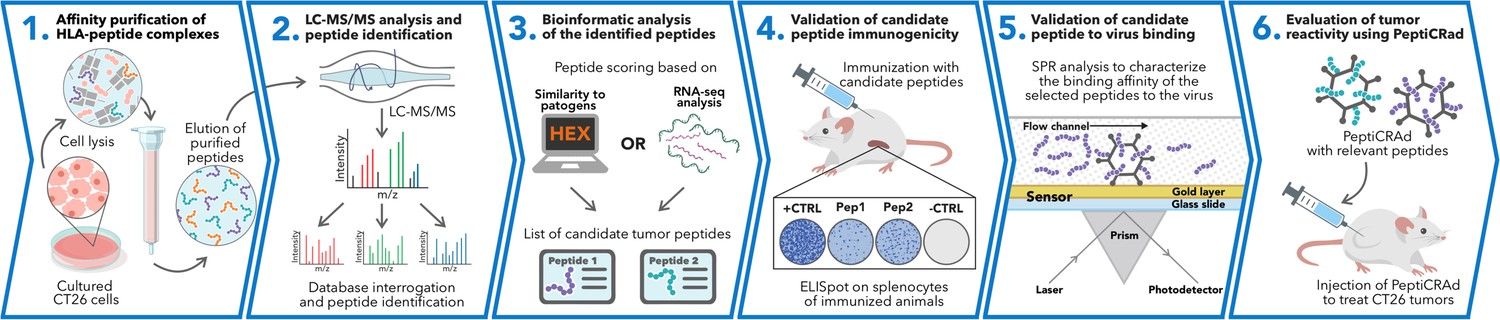
Schematic of the proposed immunopetidomic-based pipeline.
Major histocompatibility complex (MHC) I peptides are immunopurified from the surface of tumor cells (Step 1). Next, the peptides are analyzed by mass spectrometry (Step 2) and the generated list of peptides is investigated with two main approaches: RNAseq analysis and HEX software (Step 3). The selected peptides then go through a functional characterization for their immunogenicity profile in vivo through enzyme-linked immunospot (ELISpot) assay (Step 4) and the best candidates are poly-lysine-modified and analyzed by surface plasmon resonance (SPR) for their binding affinity to the oncolytic adenovirus (OAd) (Step 5). Finally, the peptides are used to decorate OAd to generate therapeutic cancer vaccine (PeptiCRAd) and tested in tumor-bearing mice (Step 6).
Figure 1—figure supplement 1
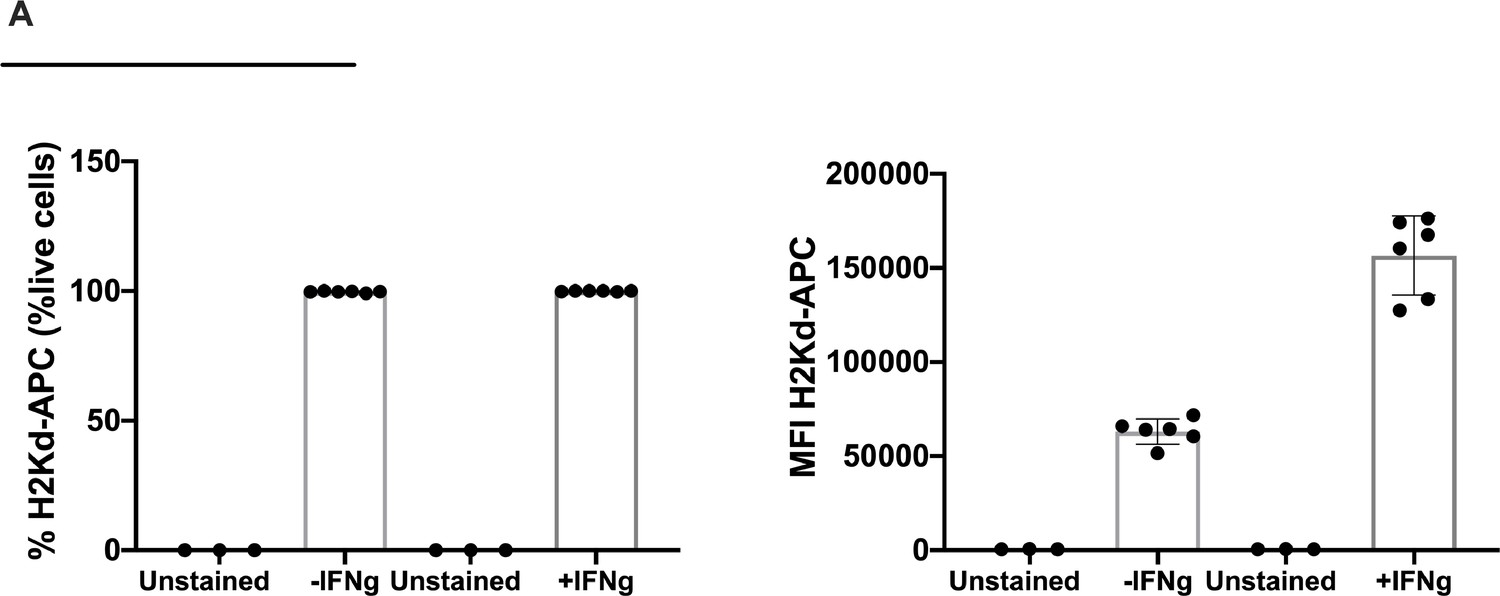
Flow cytometry analysis of H2Kd expression level in the colon tumor model CT26.
The frequency and the mean fluorescent intensity (MFI) are shown without or upon IFN-γ stimulation.
Figure 2
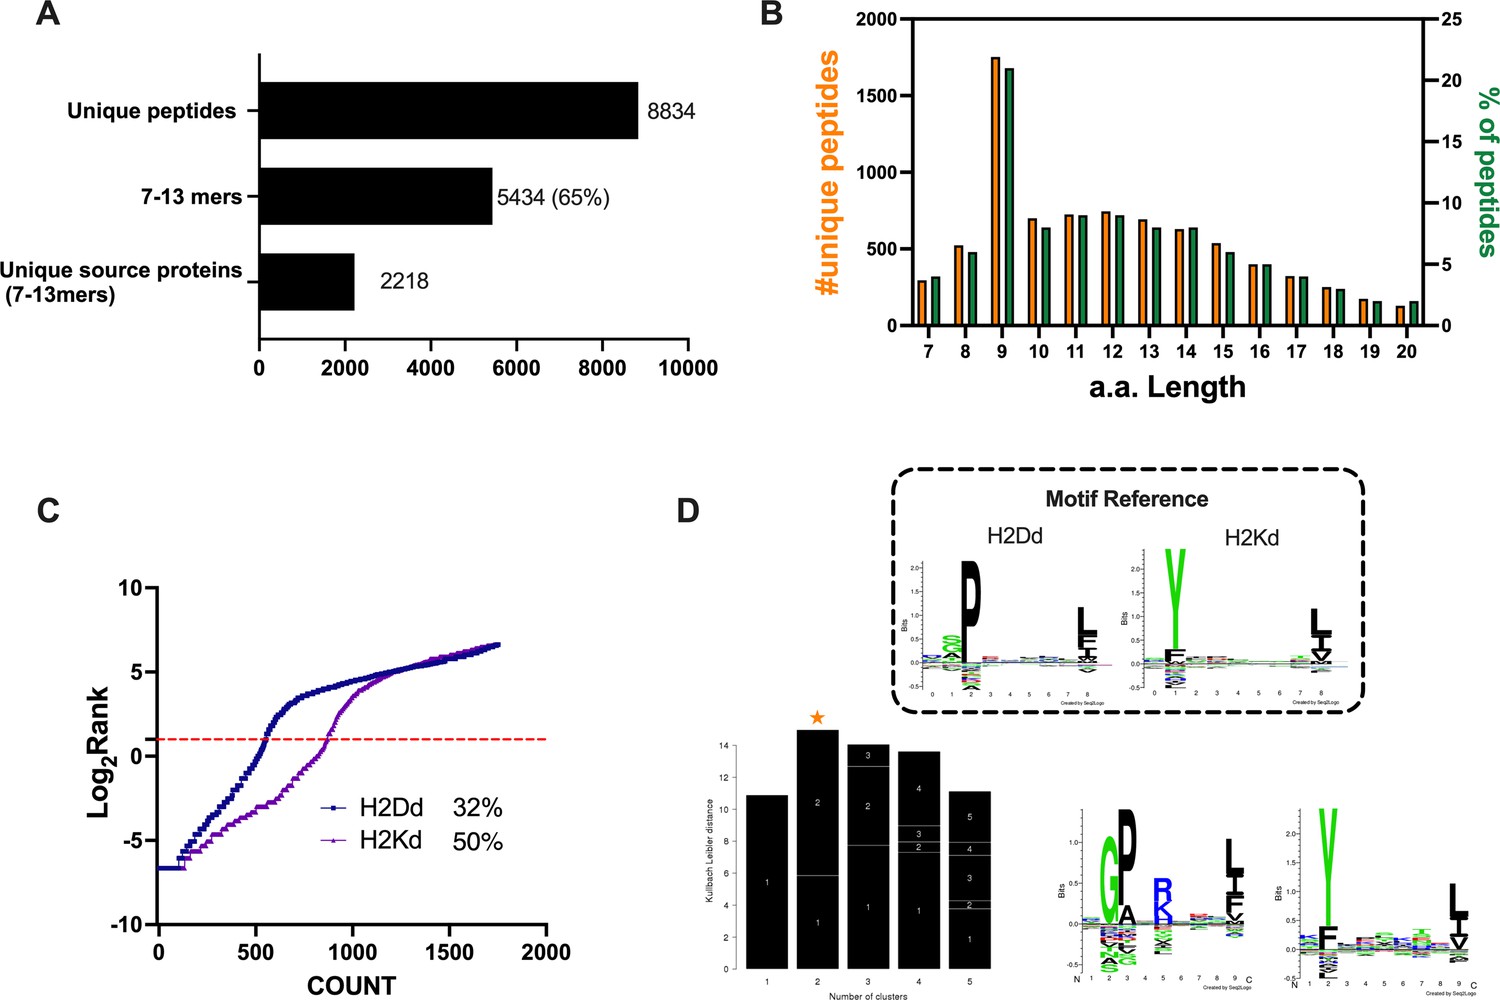
Properties of the peptides eluted from the CT26 tumor model.
(A) Unique peptides, 7–13 specimen, and their respective source proteins are reported as finite number and depicted as bar plots. (B) Overall peptides’ amino acid length distribution is shown as function of number (left y-axis) and percentage of occurrence (right y-axis). (C) The eluted 9mers were analyzed in regard to their binding affinity to H2Kd and H2Dd. Binders and not binders were defined in NetMHCpan 4.0 Server (applied rank 2%). (D) Major histocompatibility complex (MHC) I consensus binding motifs. The consensus binding motifs among the eluted 9mers peptides were deconvoluted through Gibbs clustering analysis. The reference motif (according to NetMHCpan motif viewer) is depicted in the upper square. The clusters with the optimal fitness (higher KLD values, orange star) are shown, and the sequence logo is represented.
Figure 3 with 2 supplements
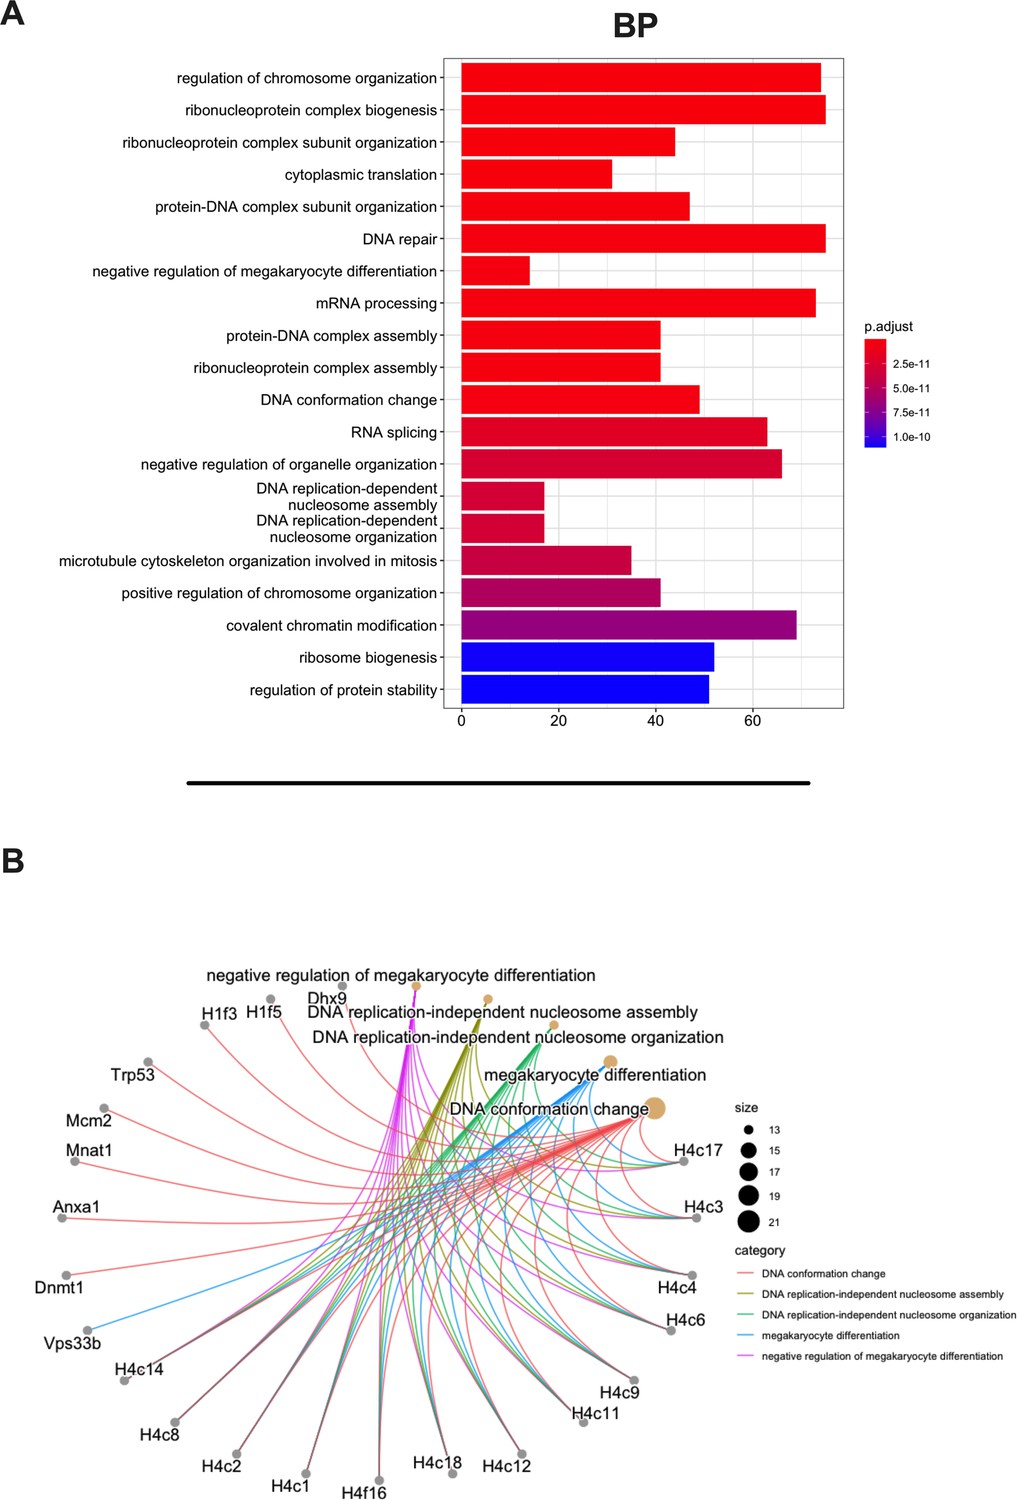
Gene Ontology (GO) enrichment analysis of the source proteins.
(A) GO enrichment was evaluated by biological process (BP); adjusted p-values of the first 20 statically relevant BPs are depicted as color gradient, and the respective number of genes is shown as bar plots. (B) Genes and BP linkages are summarized in a cnetplot graph. Each color line represents a different BP category, and the bubble size symbolizes the number of genes.
Figure 3—figure supplement 1
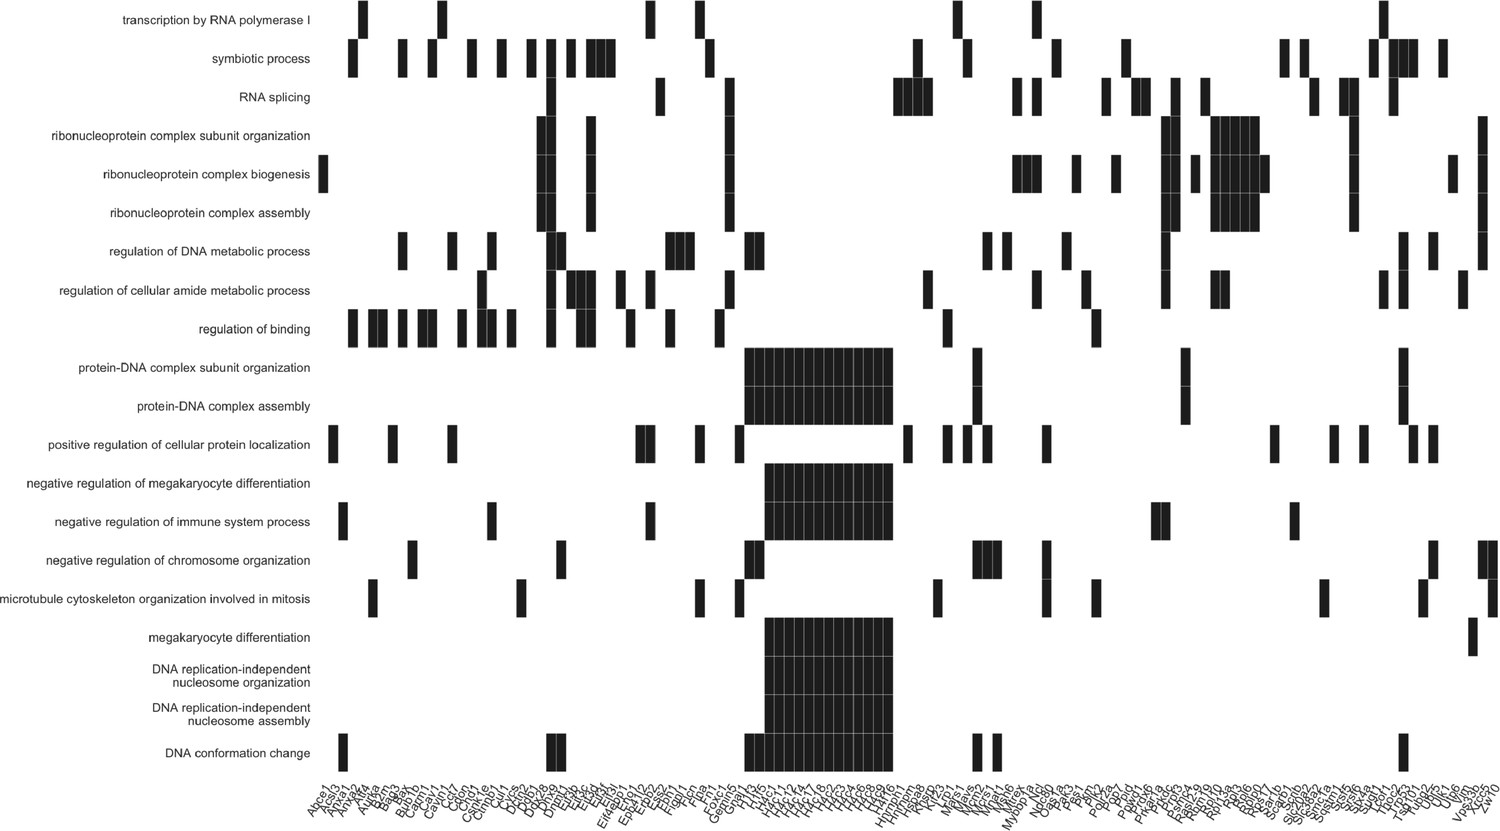
Heatmap of the Gene Ontology (GO) enrichment results is displayed.
The biological process analysis of the source proteins was performed, and the first 20 biological processes with the respective gene names are shown.
Figure 3—figure supplement 2
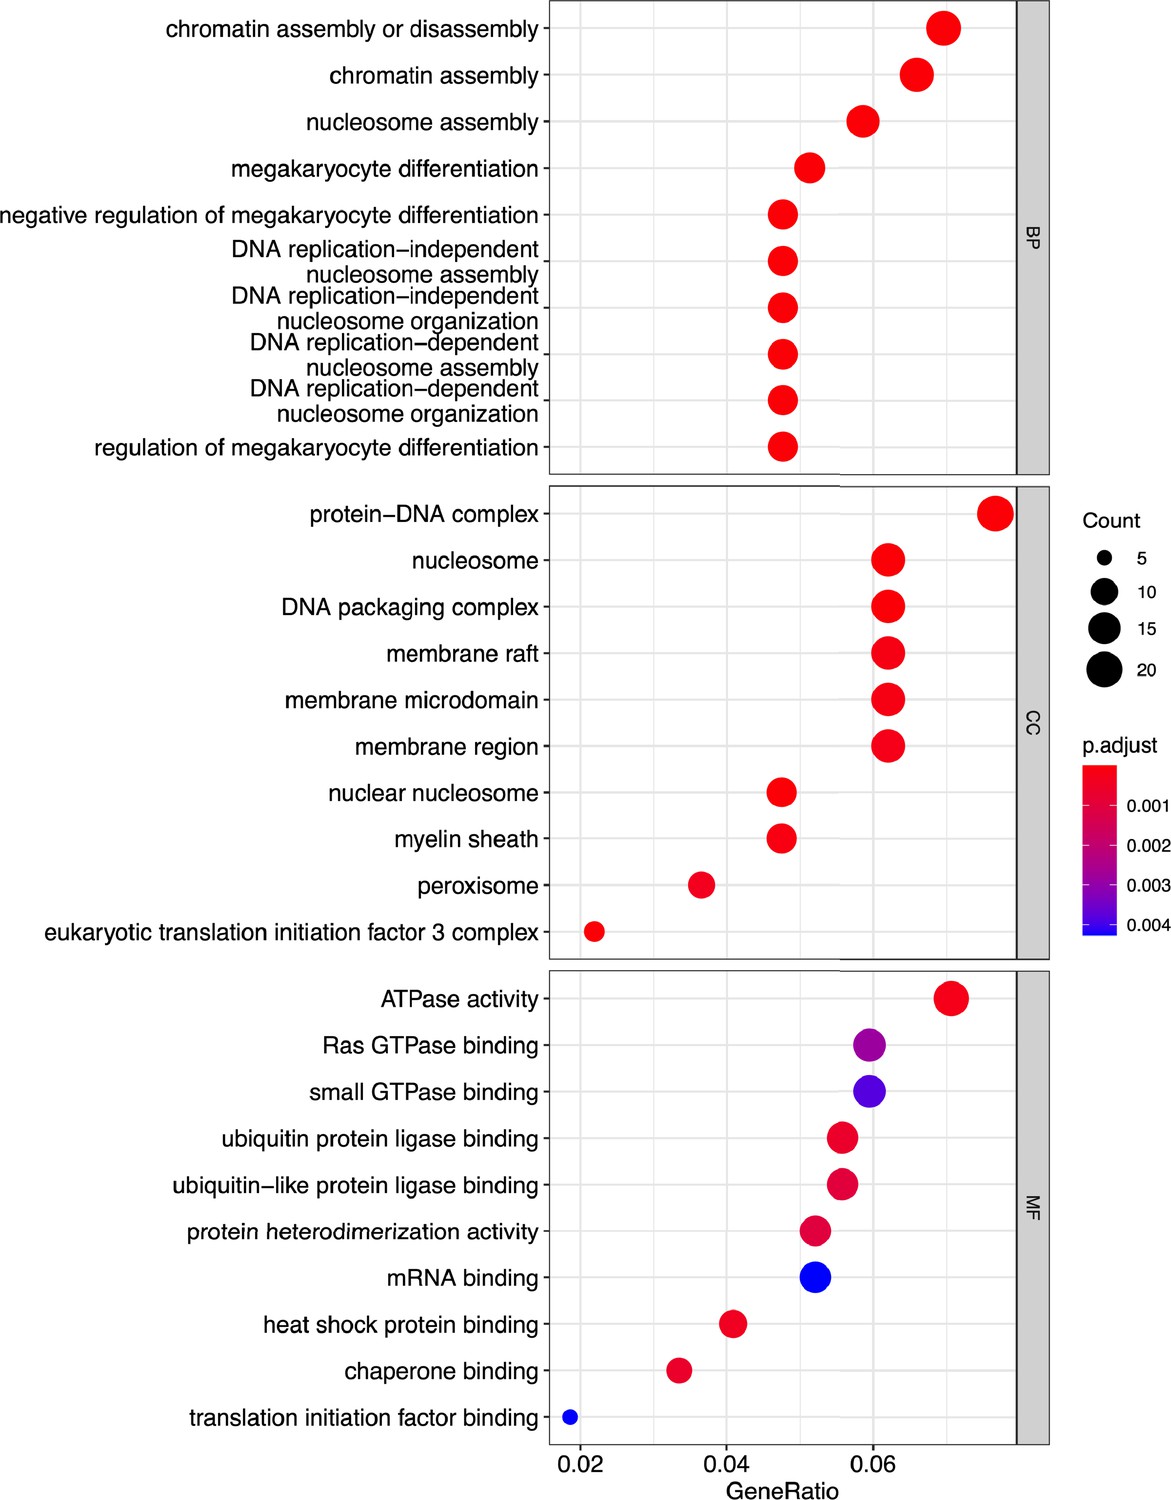
Gene Ontology (GO) analysis is reported.
Dot plot showing enrichment of GO biological process (BP), cellular components (CCs), and molecular functions (MFs); adjusted p-values of the first 10 statically relevant terms are depicted as color gradient.
Figure 4
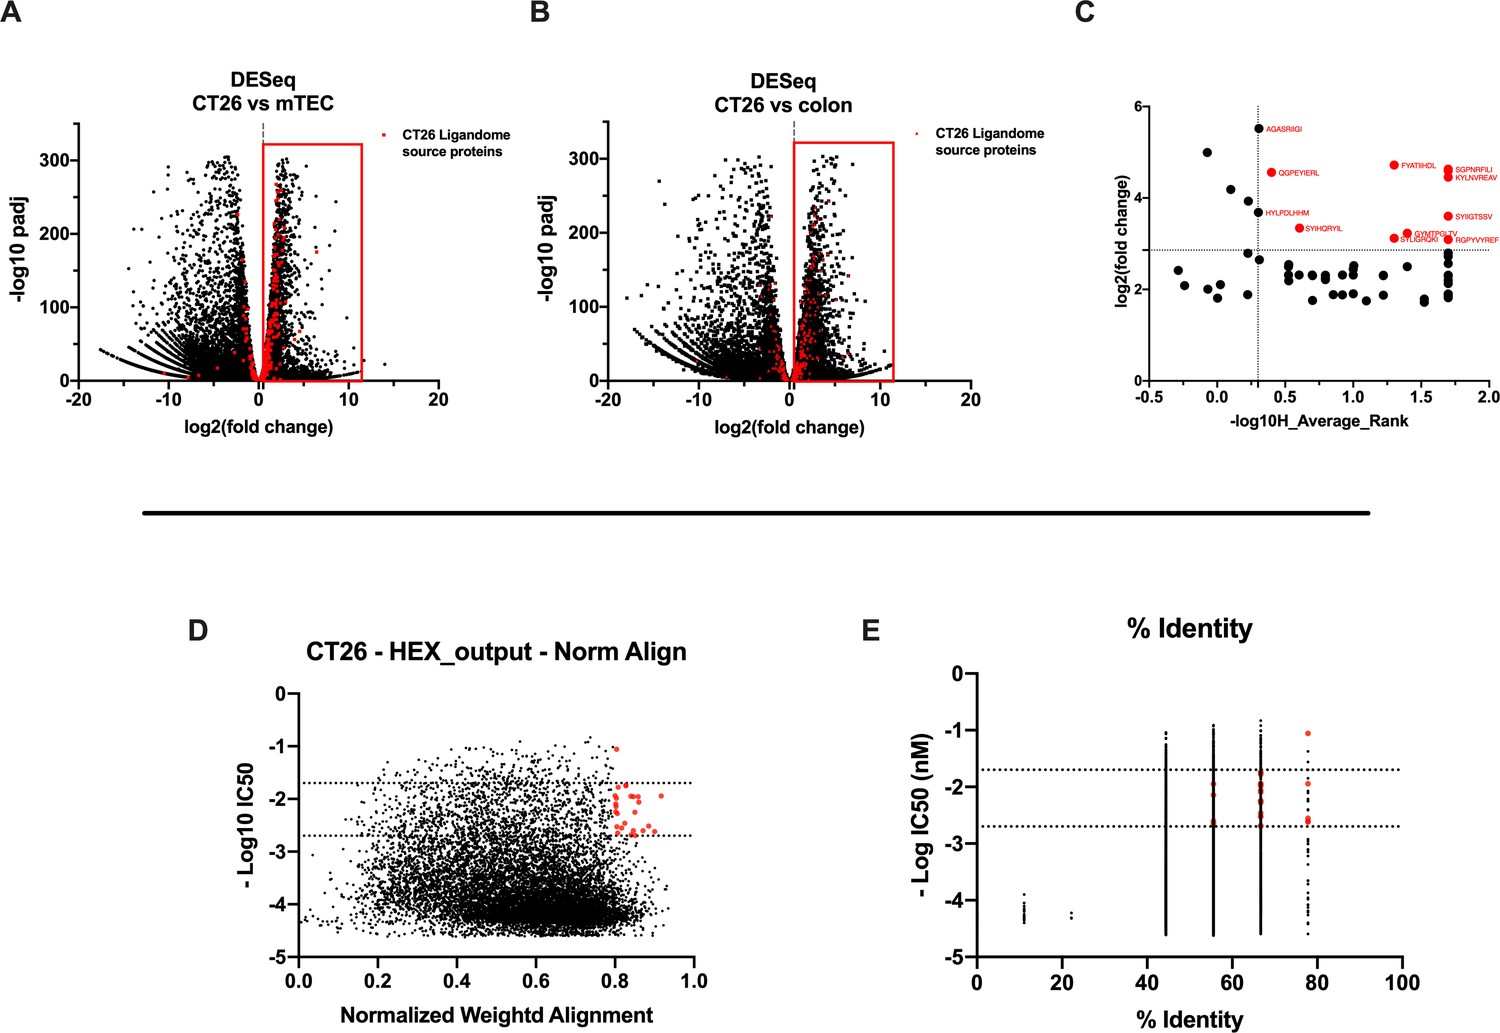
Differential expression and HEX analysis for the major histocompatibility complex (MHC) I ligand candidates.
(A, B) Differential gene expression profile (DESeq) in CT26 versus medullary thymic epithelial cell (mTEC) (A) and CT26 versus healthy Balb/c colon (B) is depicted as volcano plot of -log10 of p-adj-values versus log2 ratio (fold change). The source proteins of MHC-I ligands from our dataset are marked in red, and the differential expression is considered significant for a fold change of 1.5 and a padj-value of 0.05 (red square). (C) Scatter plot comparing the fold change of the source proteins found statistically overexpressed in both DESeq analysis and the average binding affinity score for both H2Kd and H2Dd allotypes. The values were considered significant for >-log10 0.5 H_average ranks and the third quartile of average fold change (red marked). (D, E) The peptides were stratified based on their binding affinity expressed as -log10 and on the weighted score to prioritize similarity between more central amino acids in the peptide (D) or on the percentage of similarity to viral peptides (E). Binding affinity <50 nM and weighted score and similarity >0.8 were considered as the threshold to select tumor peptides similar to viral epitopes.
Figure 5
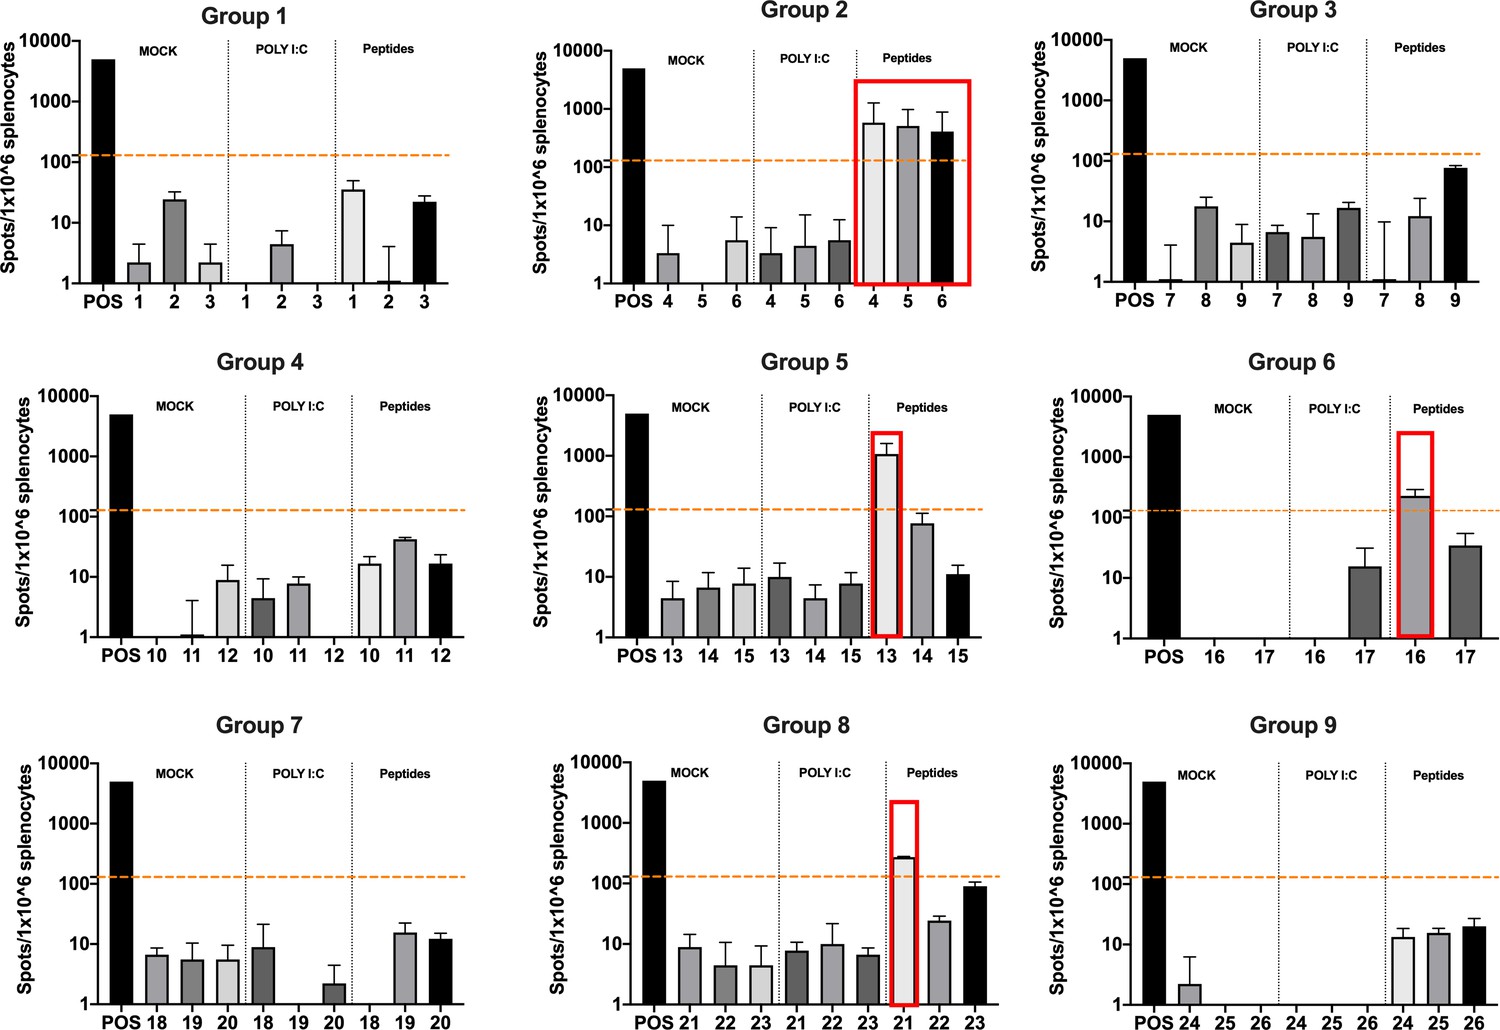
Functional characterization of the peptide candidates.
Enzyme-linked immunospot (ELISpot) IFN-γ analysis was performed on splenocytes harvested from mice pre-immunized with poly(I:C) and the peptide candidates. The figure shows the stimuli conditions and the treatment groups. The frequencies of antitumor T-cell responses are depicted as peptides-specific reaction per 1 × 10⁶ splenocytes. The average of the number of spots above 100 (i.e., 10-fold change compared to the control groups’ signal, orange dashed line) is defined as the inclusion criteria to select the peptides (red square).
Figure 6
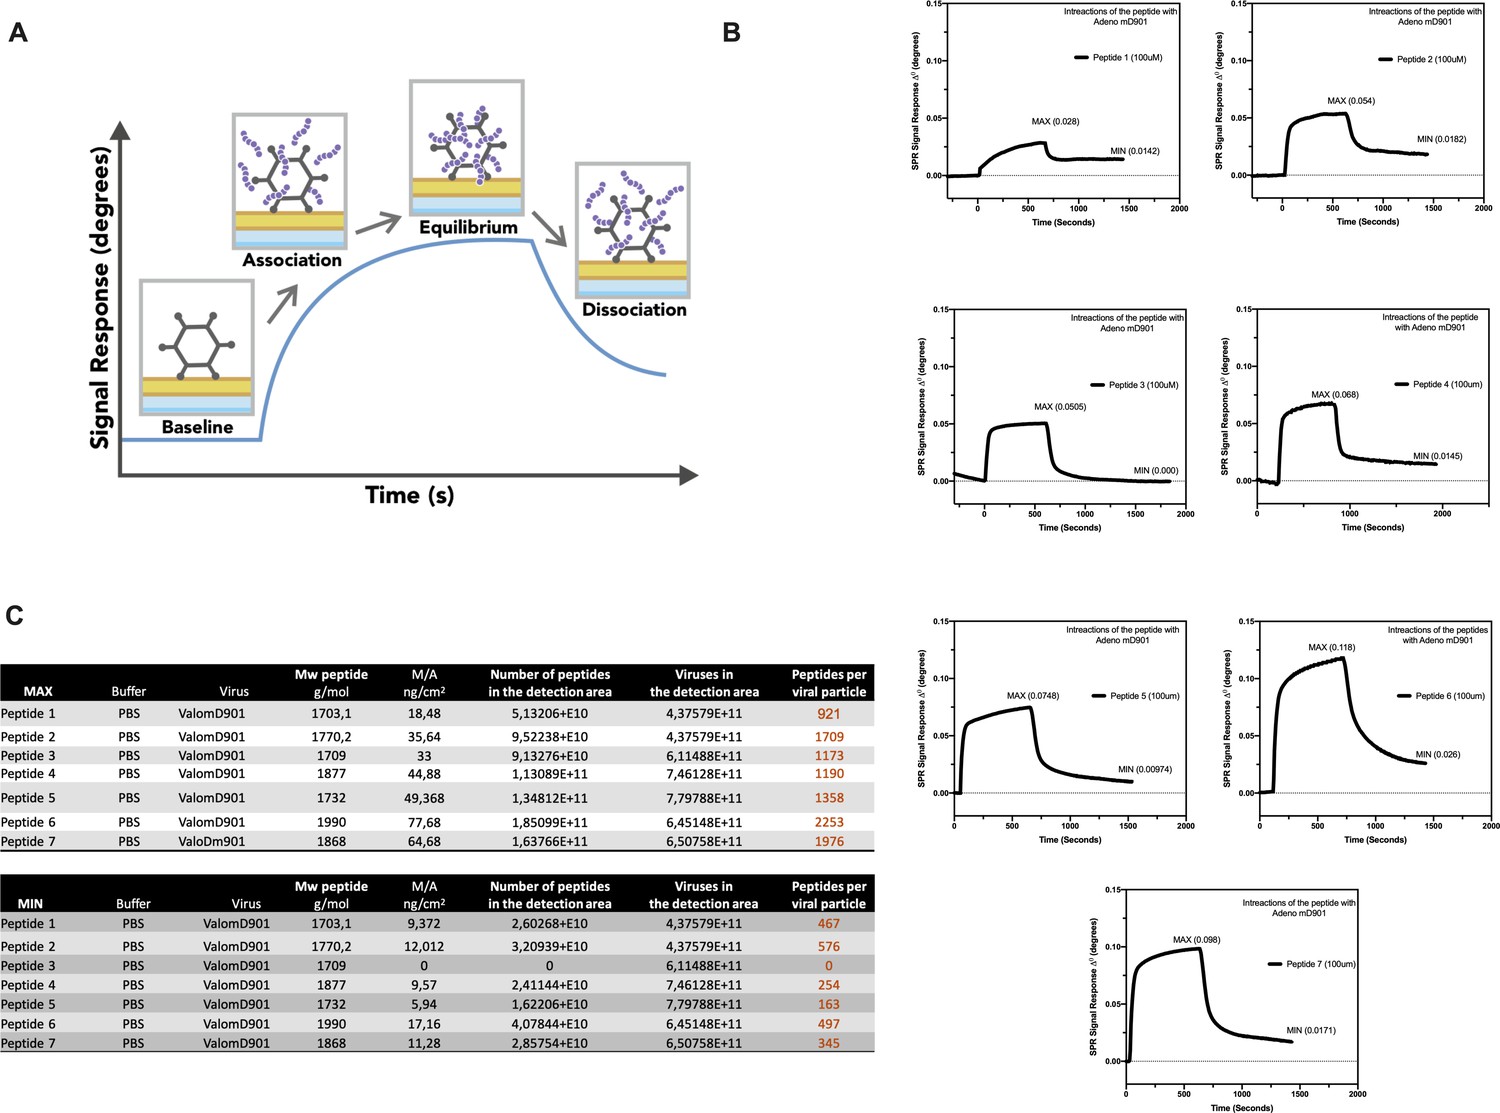
Surface plasmon resonance (SPR) analysis of the peptide/oncolytic adenovirus (OAd) interaction.
(A) An overview of the SPR analysis principle is depicted. (B) SPR analysis of the interaction between the poly-lysine-modified peptides and OAd is shown as signal response degree and time (seconds). For each peptide, the maximum interaction (MAX, equilibrium) and minimum (MIN, dissociation) peak are reported. (C) For each peptide and both equilibrium and dissociation stage, the number of peptides per viral particle has been determined.
Figure 7 with 1 supplement
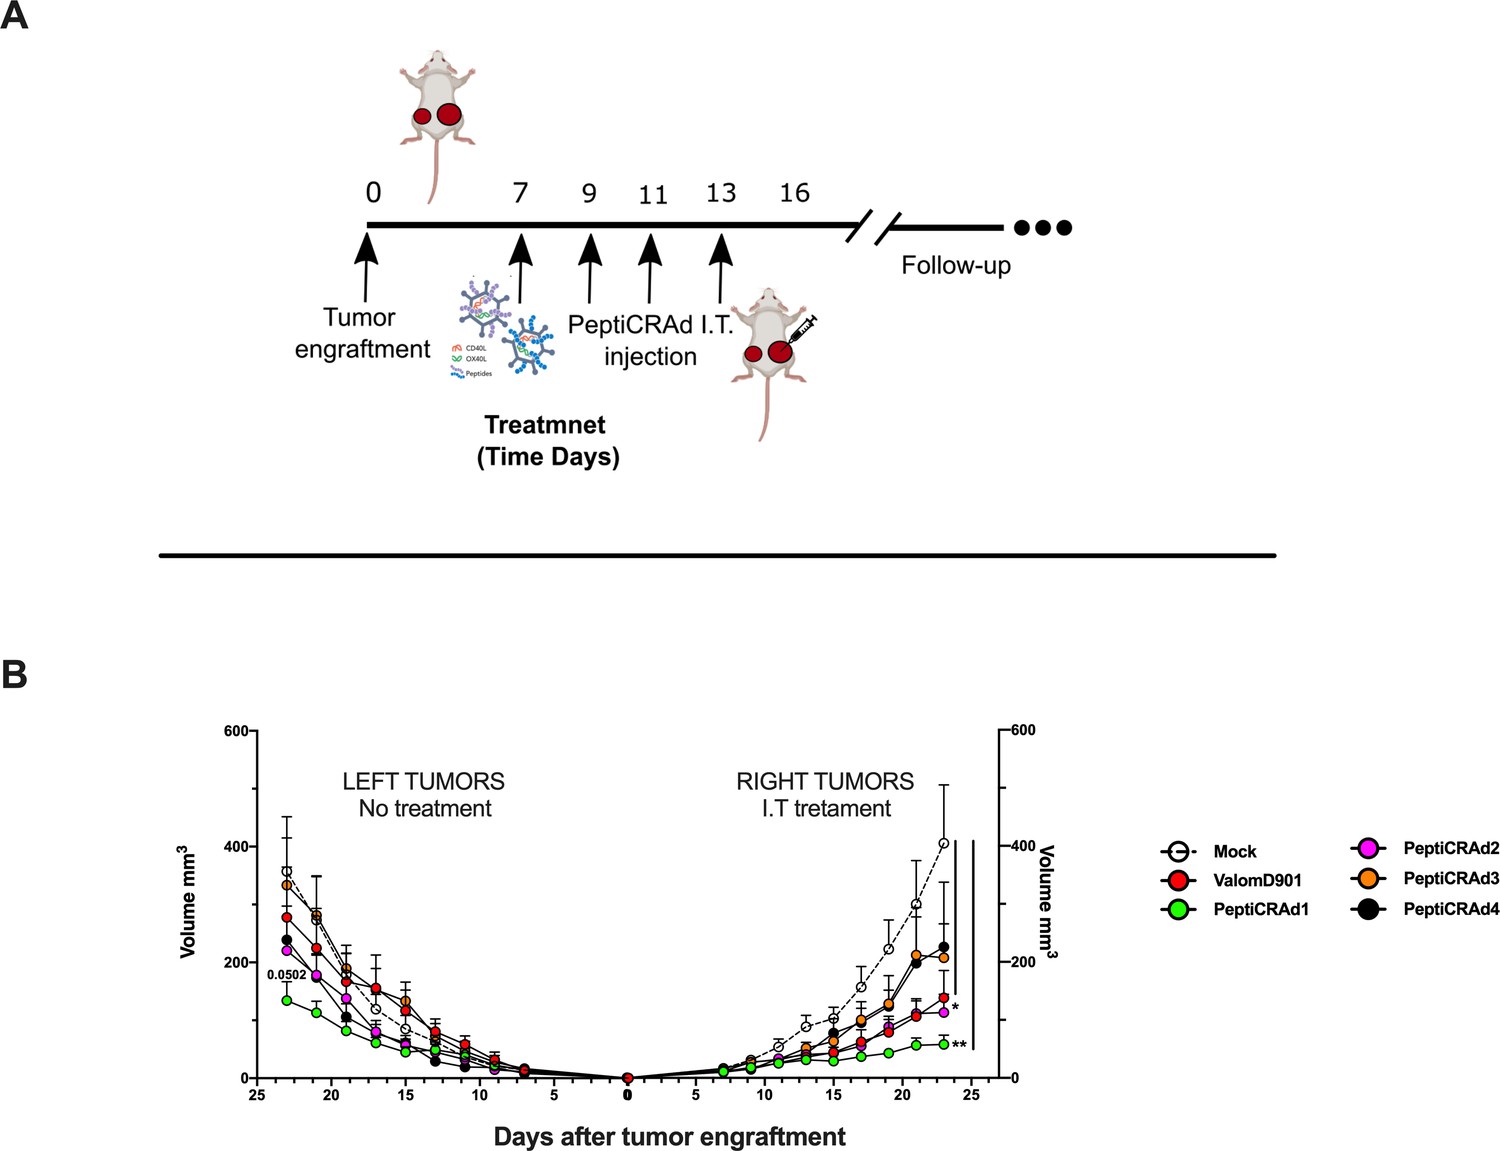
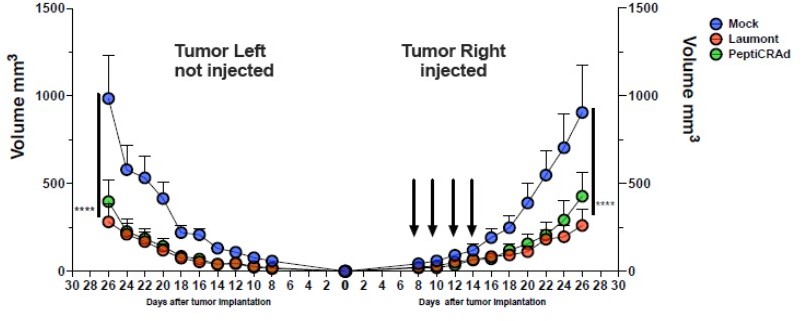
PeptiCRAd improved the tumor growth control in both injected and not injected lesions.
(A) A schematic representation of the animal experiment setting is depicted. Immunocompetent Balb/c mice were subcutaneously injected with the syngeneic tumor model CT26 in the left (0.6 × 10⁶ cells) and right flanks (1 × 10⁶). PeptiCRAd was intratumorally administrated four times, 2 days apart. (B) The CT26 tumor growth was followed until the end of the experiment, and the tumor size is presented as the mean ± SEM. Statistically significant difference was assessed with two-way ANOVA (*p<0.05; ***p<0.001; ****p<0.0001; ns, nonsignificant).
Figure 7—figure supplement 1
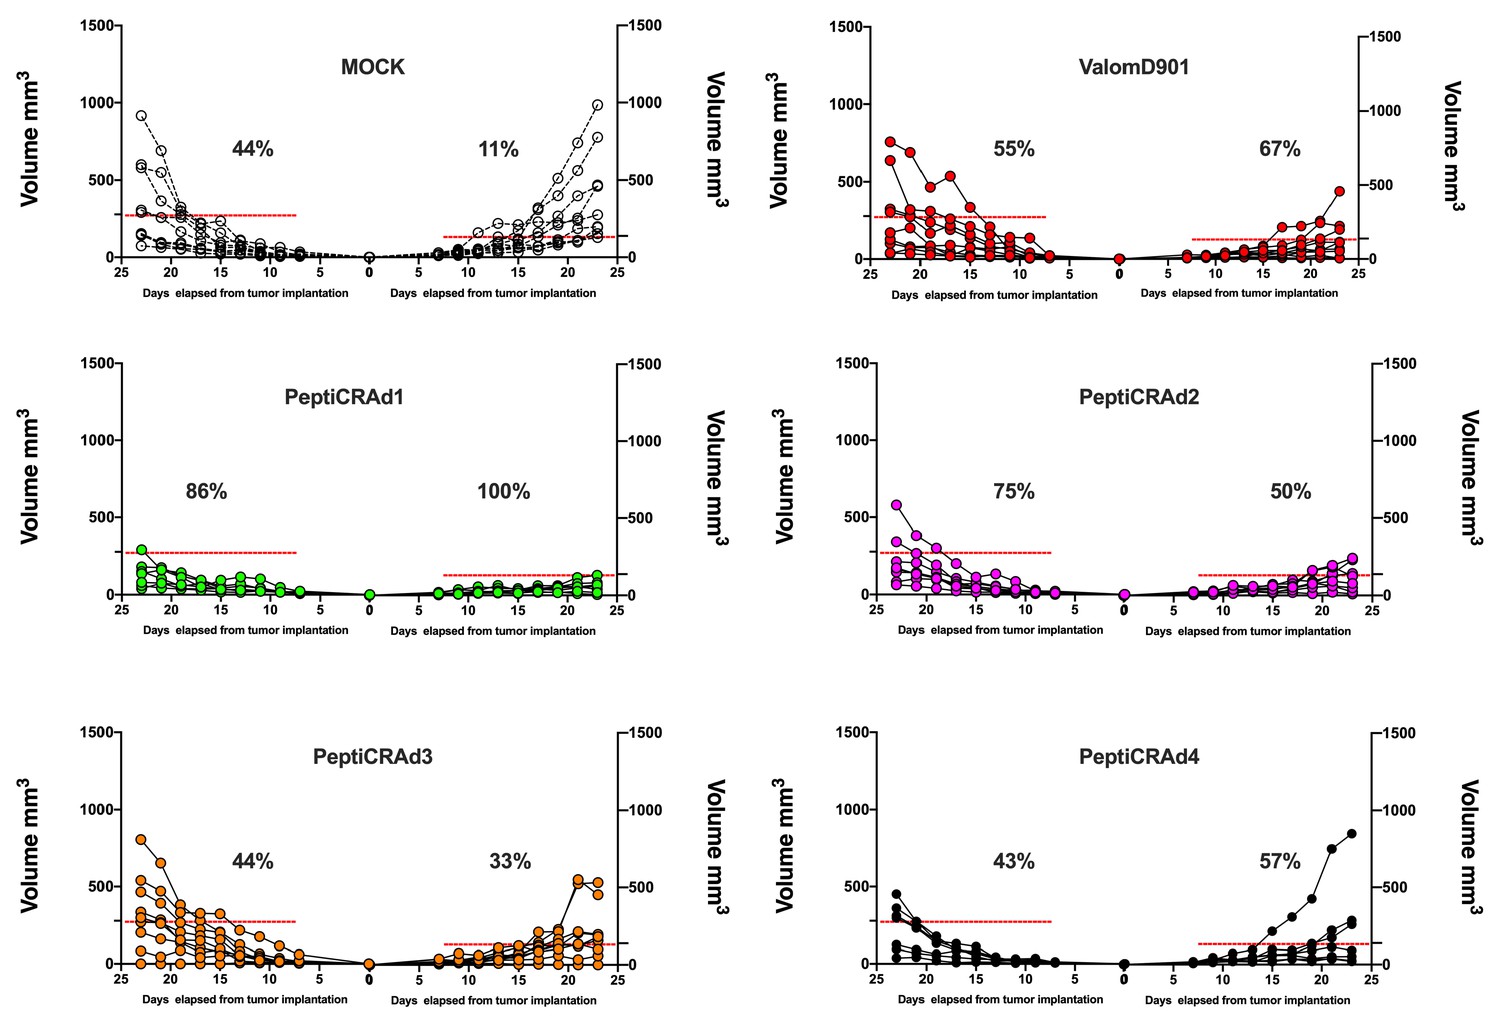
Single-tumor growth for single mouse for each treatment group is depicted.
A threshold of 138 mm3 (right tumor) and 278 mm3 (left tumor) was set to define the percentage of mice responding to the different therapies (dotted line). The percentage of responders in each treatment group is shown on the right side of the dotted line. (The threshold was defined as the average of the tumor size on the last day of the experiment in the treatment control group ValomD901 and calculated separately for the right and left tumors.)
Figure 8 with 2 supplements
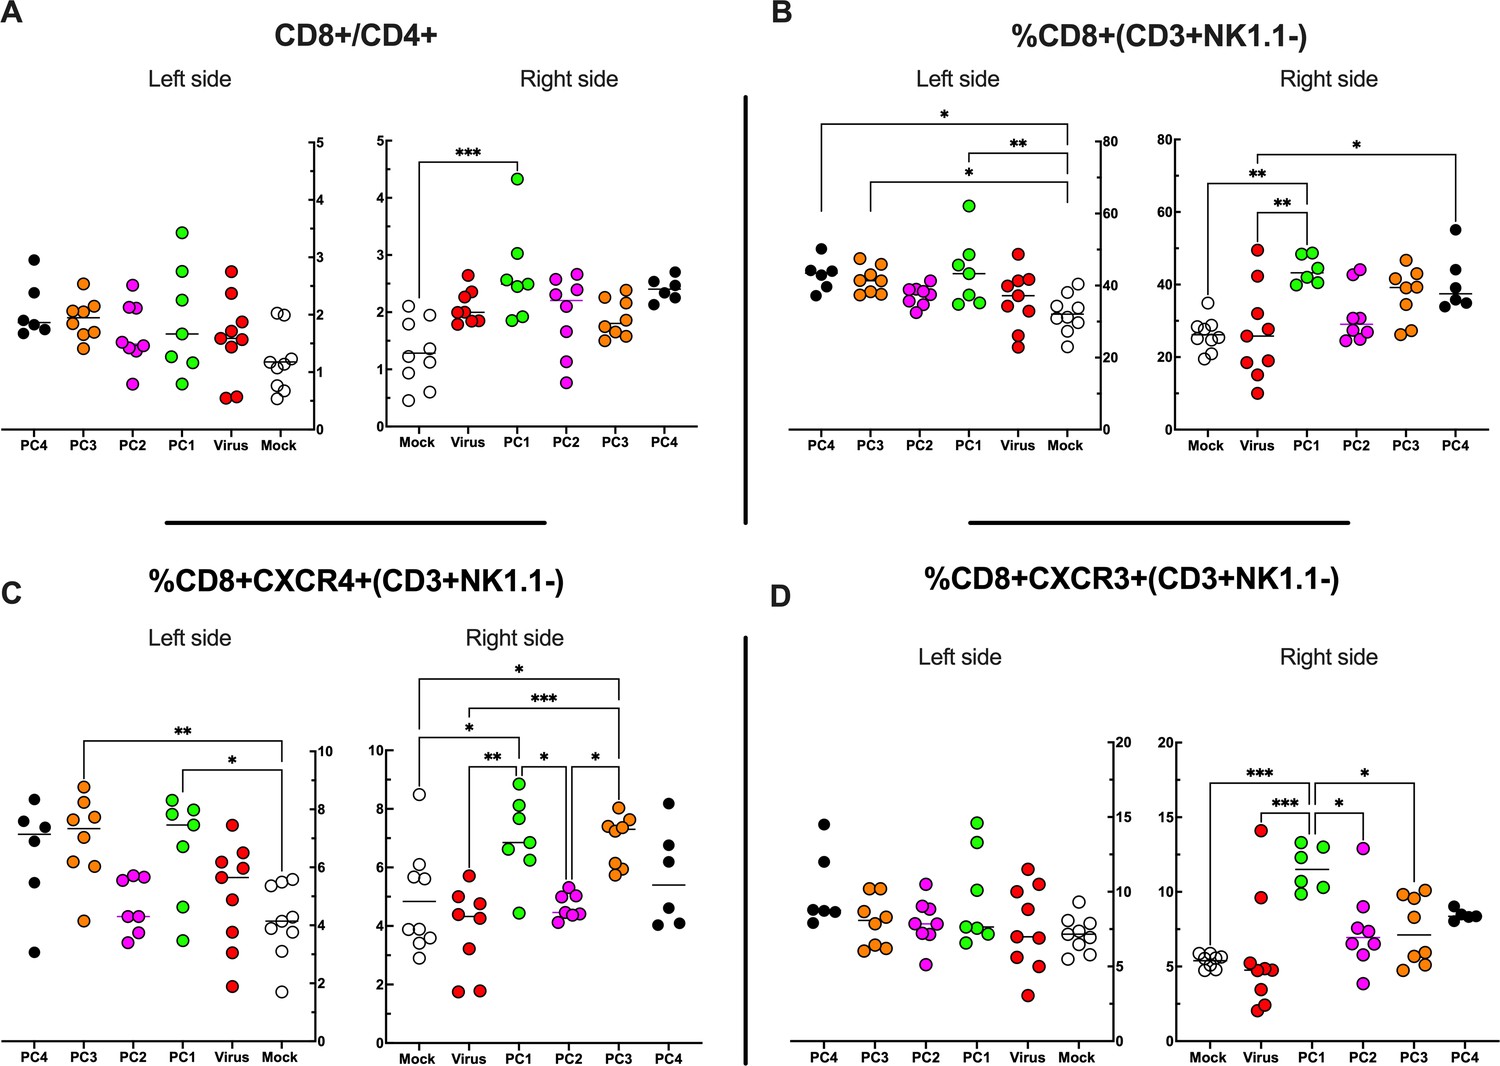
Flow cytometry analysis of tumor-Infiltrating lymphocytes (TILs).
(A–D) The treated (right side) and untreated tumors (left side) were harvested at the end of the experiment and analyzed for the CD8+/CD4+ ratio (A) and the frequency of CD8+ (B), CD8+ CXCR4+ (C), and CD8+ CXCR3+ (D) in the tumor microenvironment (TME). All the data are plotted as dot plot for each mouse and each treatment group. The significance was assessed by one-way ANOVA and Tukey’s correction (*p<0.05; ***p<0.001; ****p<0.0001; ns, nonsignificant).
Figure 8—figure supplement 1
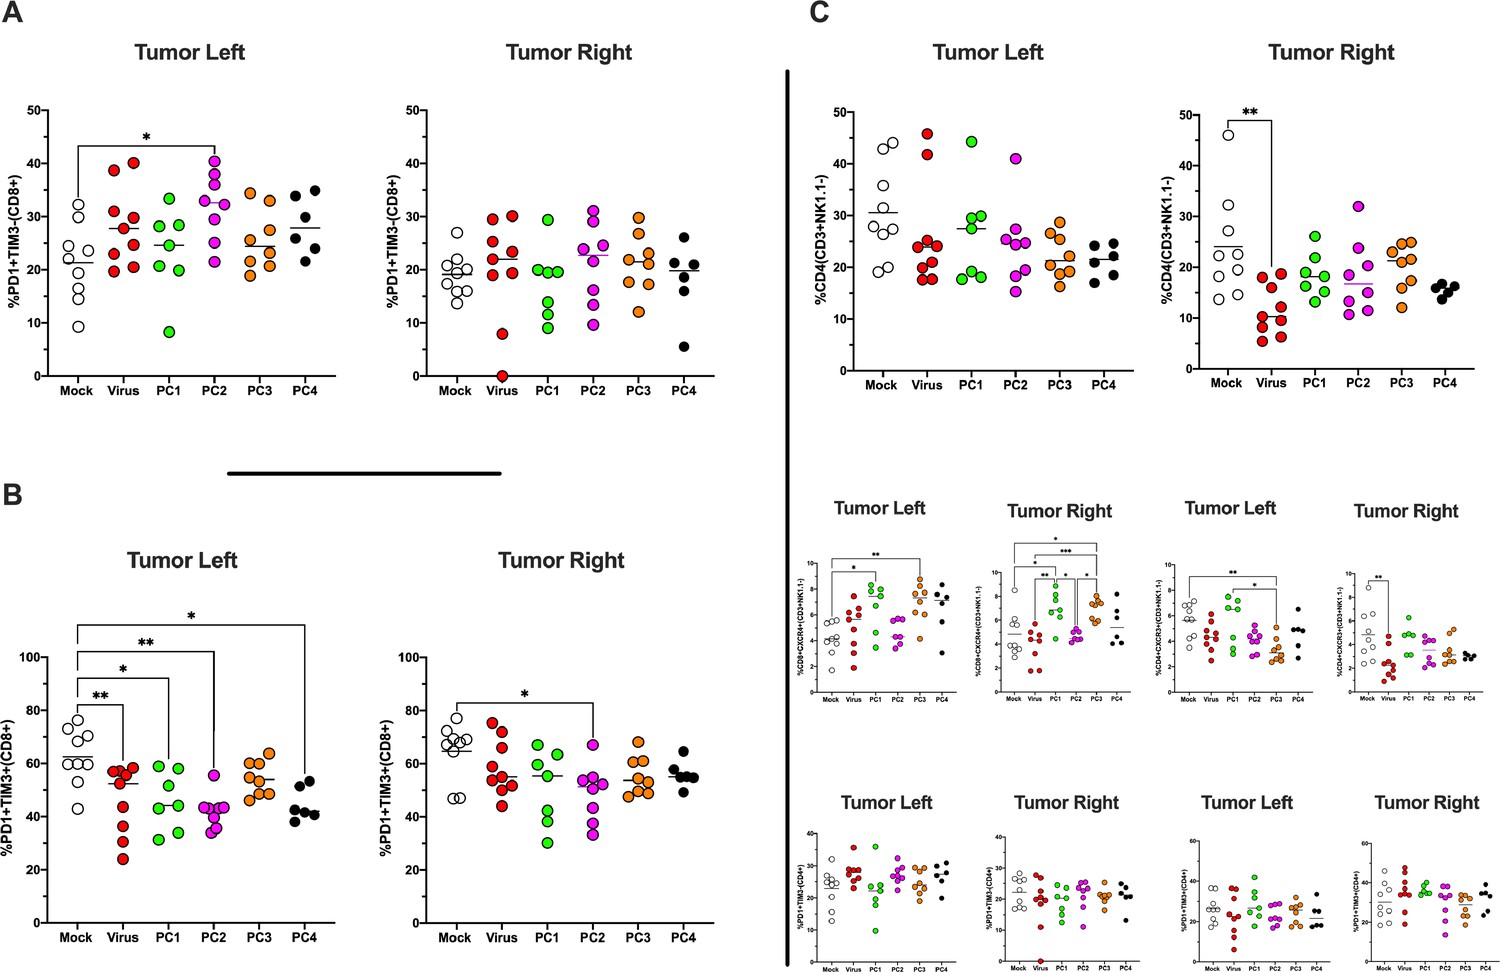
Immunophenotype of tumors treated and untreated.
The antigen experience (PD1+TIM3-) (A)/exhaustion profile (PD1+TIM3+) (B) of CD8+ T cells in the tumor microenvironment (TME) was investigated by flow cytometry analysis. (C) The frequency of CD4+, CD4+CXCR4+, CD4+CXCR3+, CD4+PD1+TIM3, and CD4+PD1+TIM3+ in the TME is shown. All the data are plotted as dot plot for each mouse, each tumor, and each treatment group. The significance was assessed by one-way ANOVA and Tukey’s correction (*p<0.05; ***p<0.001; ****p<0.0001; ns, nonsignificant).
Figure 8—figure supplement 2
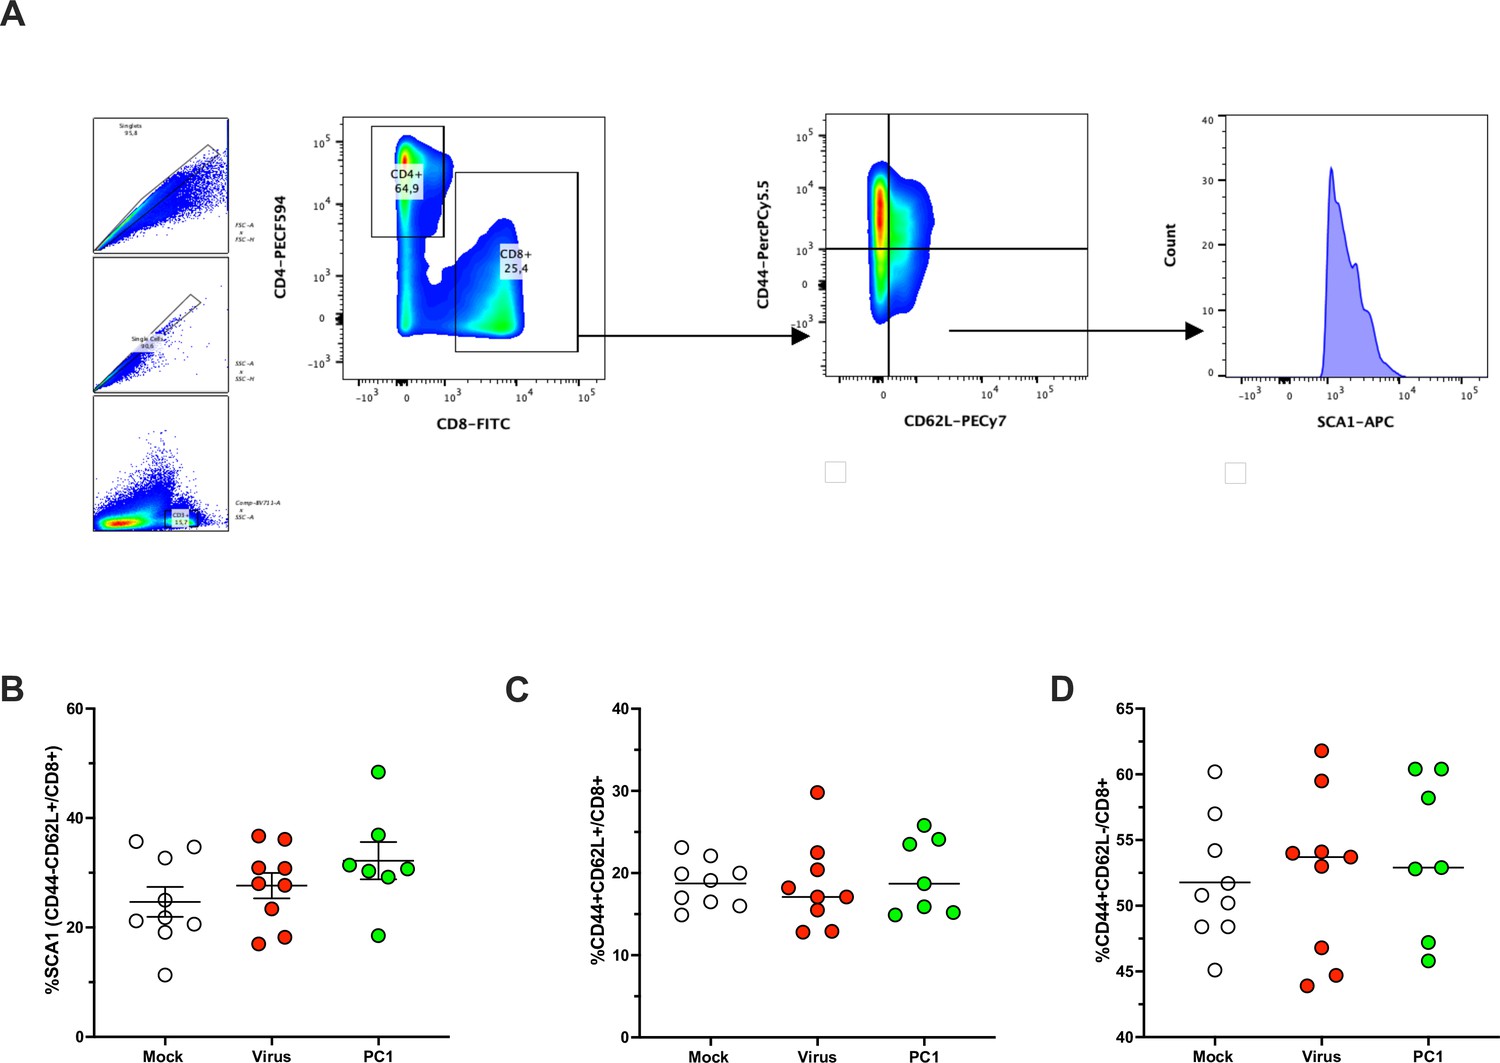
Immunophenotyping of T-cell memory population in spleens harvested from mice upon treatments.
Representative flow cytometry staining from spleens illustrating the gating strategy for identifying SCA-1+CD44-CD62L+CD8+ T-cell population (A). (B–D) The spleens were harvested at the end of the experiment and analyzed for the frequency of SCA1+ (B), CD44+CD62L+ (C), and CD44+CD62L- (D) CD8+ T-cell population. All the data are plotted as dot plot for each mouse and each treatment group. The significance was assessed by one-way ANOVA and Tukey’s correction (*p<0.05; ***p<0.001; ****p< 0.0001; ns, nonsignificant).
Author response image 1
The CT26 tumor growth was followed until the end of the experiment and the tumor size is presented as the mean ± SEM and statistically difference was assessed with two-way ANOVA; (*, P < 0.05; ***, P < 0.001; ****, P < 0.0001; ns, nonsignificant).
Additional files
-
Supplementary file 1
List of candidate peptides derived by differential gene expression profile (DESeq) analysis in CT26 versus (medullary thymic epithelial cell (mTEC) and CT26 versus healthy Balb/c colon).
For each peptide, the Uniprot ID, gene name, and sequence are reported. Additionally, the last column indicates whether (1) or not (0) the peptide has been already described in a published ligandome dataset.
- https://cdn.elifesciences.org/articles/71156/elife-71156-supp1-v2.docx
-
Supplementary file 2
HEX software results.
For each peptide, the Uniprot ID, amino acid sequence, and similar pathogen species with the respective viral peptides with sequence similarity are shown. The last column indicates whether (1) or not (0) the peptide has been already described in a published ligandome dataset.
- https://cdn.elifesciences.org/articles/71156/elife-71156-supp2-v2.docx
-
Supplementary file 3
List of peptides tested in the enzyme-linked immunospot (ELISpot) assay.
For each group of mice, the peptides with the respective identification number as indicated in the ELISpot assay are reported.
- https://cdn.elifesciences.org/articles/71156/elife-71156-supp3-v2.docx
-
Supplementary file 4
List of peptides with the respective polyK-peptides.
The candidate peptides used in PeptiCRAd technology with the respective net charge without and with the poly-lysine modification are shown.
- https://cdn.elifesciences.org/articles/71156/elife-71156-supp4-v2.docx
-
Supplementary file 5
List of polyK-peptides used in PeptiCRAd.
The poly-lysine-modified peptides, Uniprot ID, and respective gene names for each PeptiCRAd treatment group are summarized.
- https://cdn.elifesciences.org/articles/71156/elife-71156-supp5-v2.docx
-
Transparent reporting form
- https://cdn.elifesciences.org/articles/71156/elife-71156-transrepform1-v2.pdf
Download links
A two-part list of links to download the article, or parts of the article, in various formats.
Downloads (link to download the article as PDF)
Open citations (links to open the citations from this article in various online reference manager services)
Cite this article (links to download the citations from this article in formats compatible with various reference manager tools)
A novel immunopeptidomic-based pipeline for the generation of personalized oncolytic cancer vaccines
eLife 11:e71156.
https://doi.org/10.7554/eLife.71156


