Evolution of brilliant iridescent feather nanostructures
- Department of Ecology and Evolutionary Biology, Princeton University, United States
- Grainger Bioinformatics Center, Field Museum of Natural History, United States
Figures
Figure 1
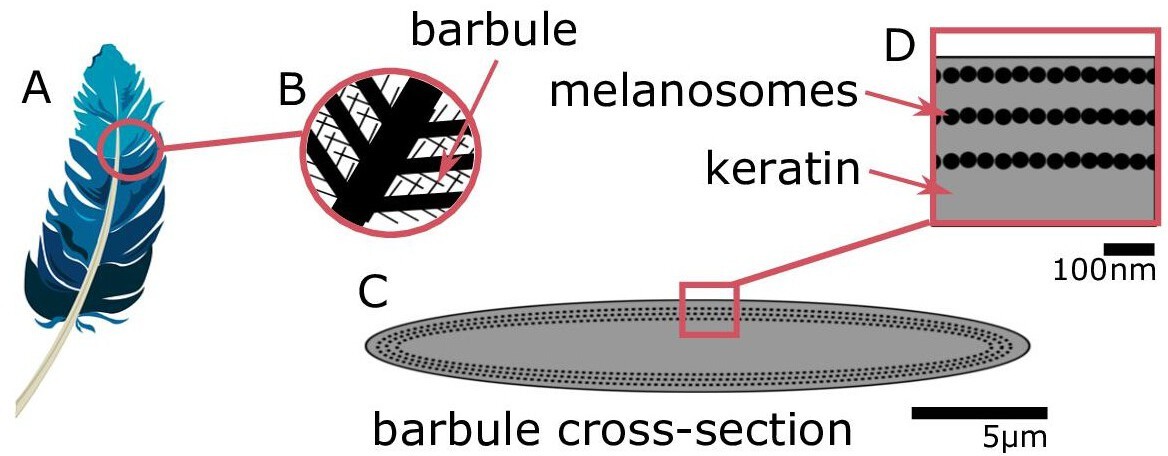
Iridescent plumage is produced by nanostructures in the feather barbules.
A vaned feather (A) consists of branching structures where the barbules (B) are the interlocking filaments. A cross-section of a barbule from an iridescent feather (C) reveals the intricate nanostructure responsible for the color, consisting of layers of melanosomes in keratin (D).
© 2016, Yuri B. Blue feather in (A) from Pixabay, licensed under the Pixabay License (full details in Supplementary file 1m). It is not covered by the CC-BY 4.0 license.
Figure 2
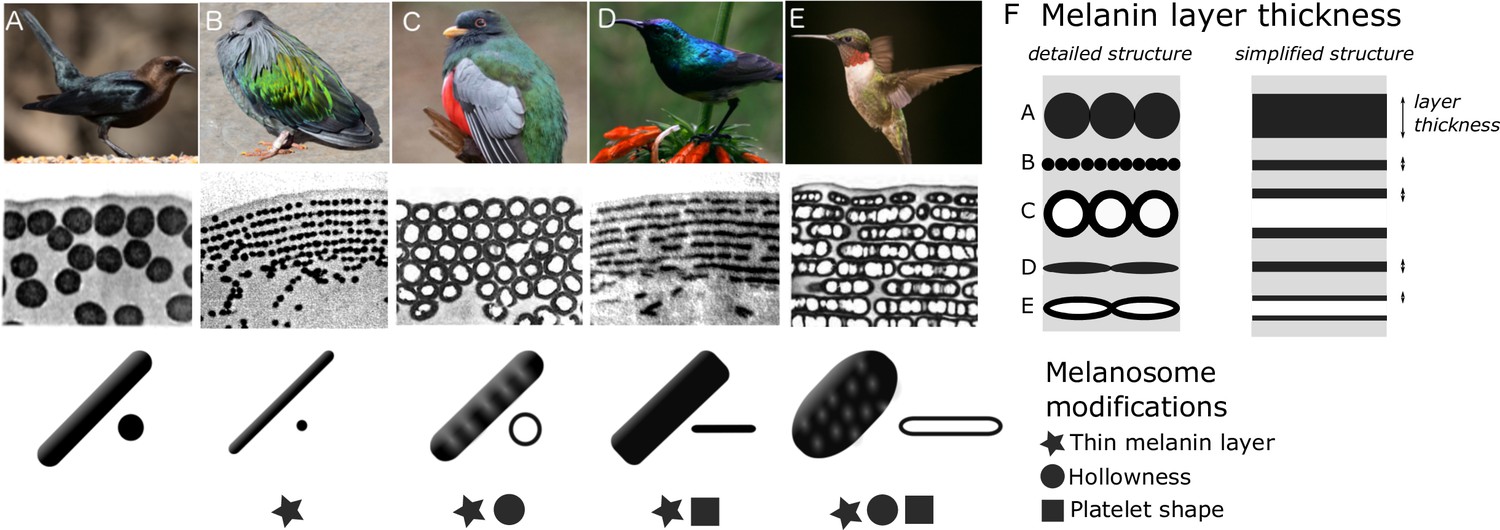
Iridescent feather nanostructures are diverse.
Structures can vary both in melanosome type and melanosome organization. There are five main types of melanosomes (shown as schematics in bottom row, each viewed from the side and in cross-section (A–E)) and two main types of structural organization (shown by microscope images of barbule cross-sections, middle row: single-layered (A) and photonic crystal (B–E)). A single-layered structure with thick solid rods (A) gives rise to the dark, black-blue iridescence of a brown-headed cowbird (Molothrus ater). This type of structure generally gives rise to ‘weak’ iridescent colors, with low color saturation and brightness. Photonic crystals (B–E) with multiple layers of melanosomes generally give rise to ‘brilliant’ iridescent colors, with high saturation and brightness. Thin solid rods (B) in a multilayer configuration (also called a one-dimensional photonic crystal) produce the iridescent colors of the Nicobar pigeon (Caloenas nicobarica). In the elegant trogon (Trogon elegans), the iridescent green color is produced by hexagonally packed hollow rods (C). Sunbird (here the variable sunbird, Cinnyris venustus) barbules contain melanosomes stacked in multilayers, with solid platelet-shaped melanosomes serving as the building blocks (D). The fifth melanosome type is a hollow platelet (E), which forms multilayer configurations in many hummingbird species (here a ruby-throated hummingbird, Archilochus colubris). The five types of melanosomes are characterized by different combinations of three key modifications: thin melanin layers, hollowness, and platelet shape, which are indicated as symbols under each melanosome type. Thin melanin layers are present in four melanosome types, but they are achieved in different ways, as is shown by the schematic in (F). A simplified diagram of each melanosome type (F, right) shows how solid forms translate to a single melanin layer, while hollow forms create two thinner melanin layers intersected by an air layer. All photographs (top row) are under a Public Domain License (details in Supplementary file 1n).
© 1977, Durrer et al. Transmission Electron Microscope images from Durrer, 1977, reproduced with permission. It is not covered by the CC-BY 4.0 licence and further reproduction of this panel would need permission from the copyright holder.
Figure 3
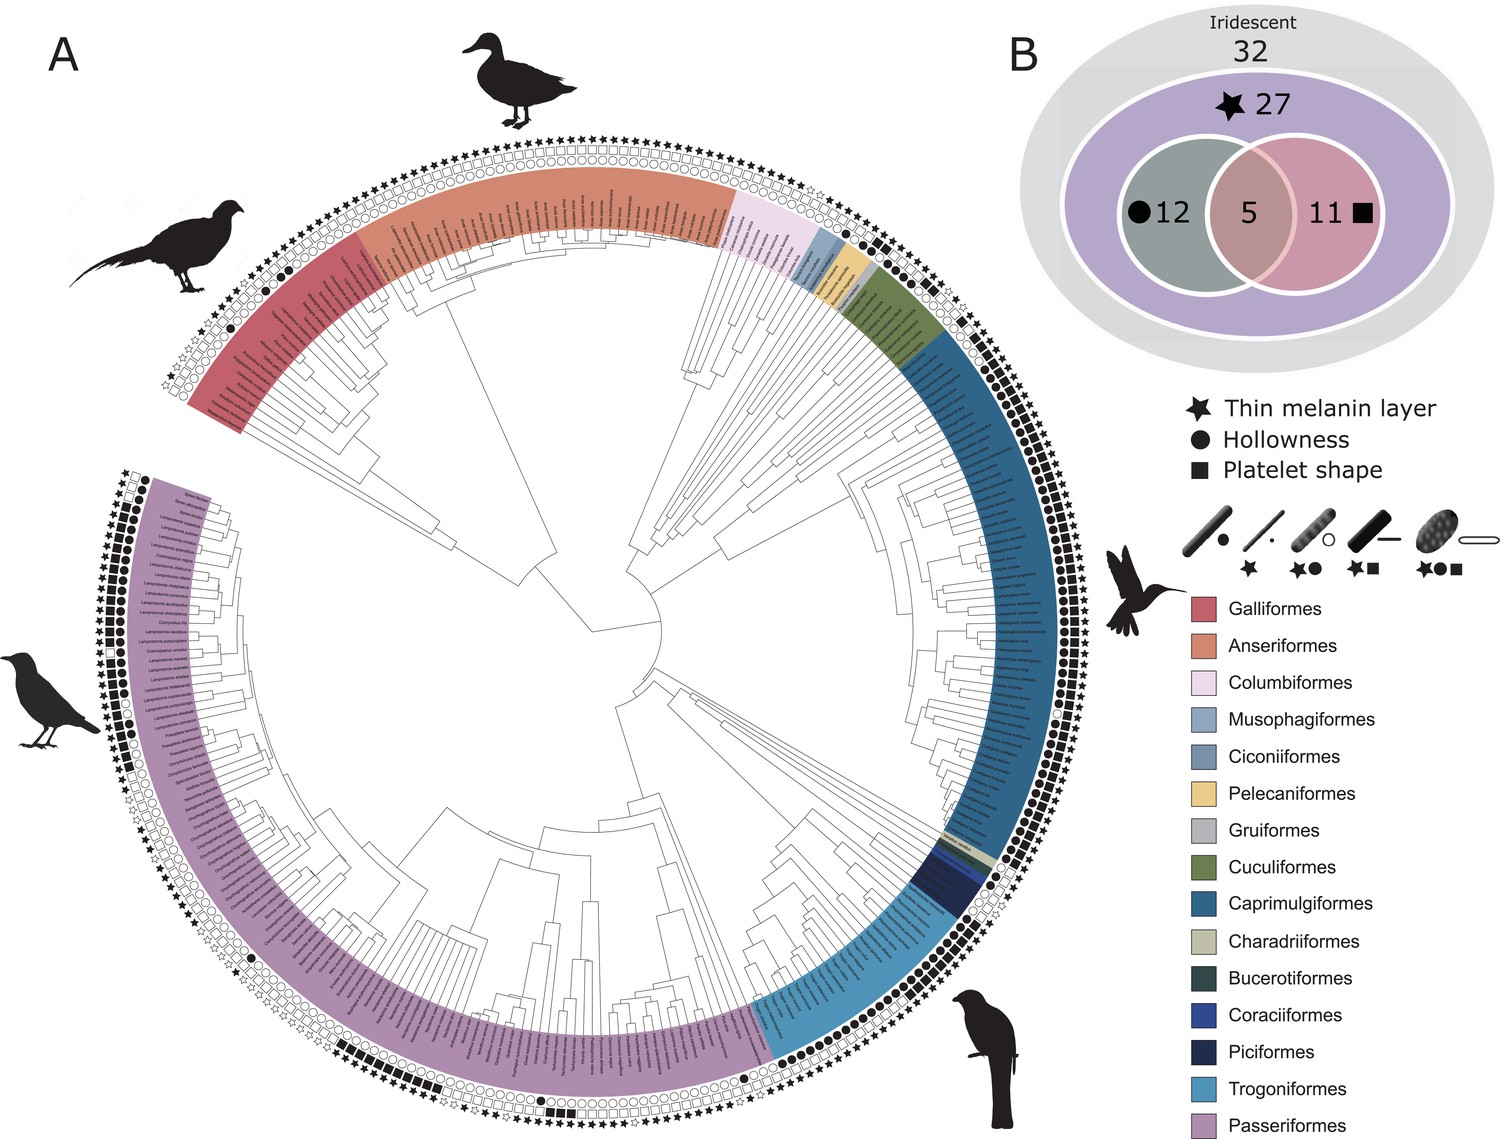
Evolutionary distribution of three key melanosome modifications in iridescent structures: thin melanin layers (star), hollowness (circle), and platelet shape (square).
Schematics of melanosomes in the key show how combinations of modifications correspond to each melanosome type. (A) Melanosome modifications mapped onto a phylogeny including all species in the feather iridescence database (280 species, after excluding 26 species lacking data on melanosome type). Note that where data on melanin layer thickness was not available for a species with hollow and/or platelet-shaped melanosomes, they were assumed to have thin melanin layers, since all known hollow and platelet structures do. Silhouettes shown for the five families that are best represented in the feather iridescence database (>20 species represented in the database): Sturnidae, Phasianidae, Anatidae, Trogonidae, and Trochilidae. (B) Venn diagram showing the number of bird families in the feather iridescence database for which each modification was present. The majority of bird families with iridescent plumage studied have evolved thin melanin layers, and there are no hollow or platelet-shaped melanosomes that have not also evolved this modification. A similar number of families have hollow or platelet-shaped melanosomes, but only five families have evolved both modifications together. Note that this plot depicts the number of occurrences of each modification, not independent evolutionary origins. Silhouettes from Phylopic.org, licensed under a Public Domain License (full details in Supplementary file 1o).
Figure 4
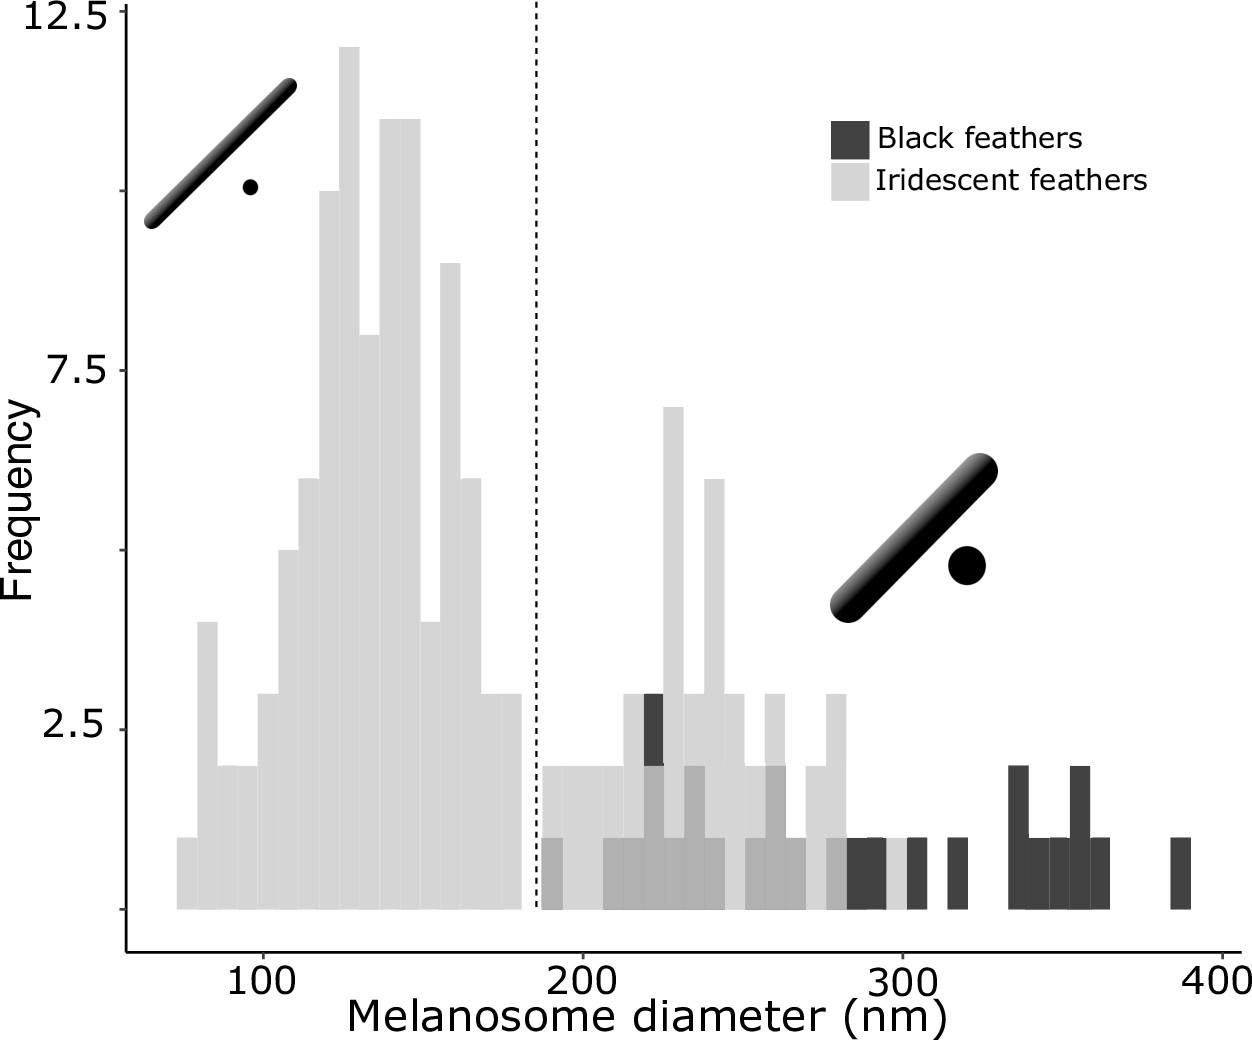
There are two distinct types of solid rods in iridescent structures: thick solid rods and thin solid rods.
This is evident from the clear bimodal distribution shown by the histogram of melanosome diameters found among all solid rods in the feather iridescence database (gray). Based on this distribution, we define ‘thin solid rods’ as any solid rod with a diameter <190 nm (marked with dashed line). Plotted in black is the distribution of diameters from melanosomes in black feathers (data from Li et al., 2012), which overlaps with the distribution of thick solid rods in iridescent structures.
Figure 5
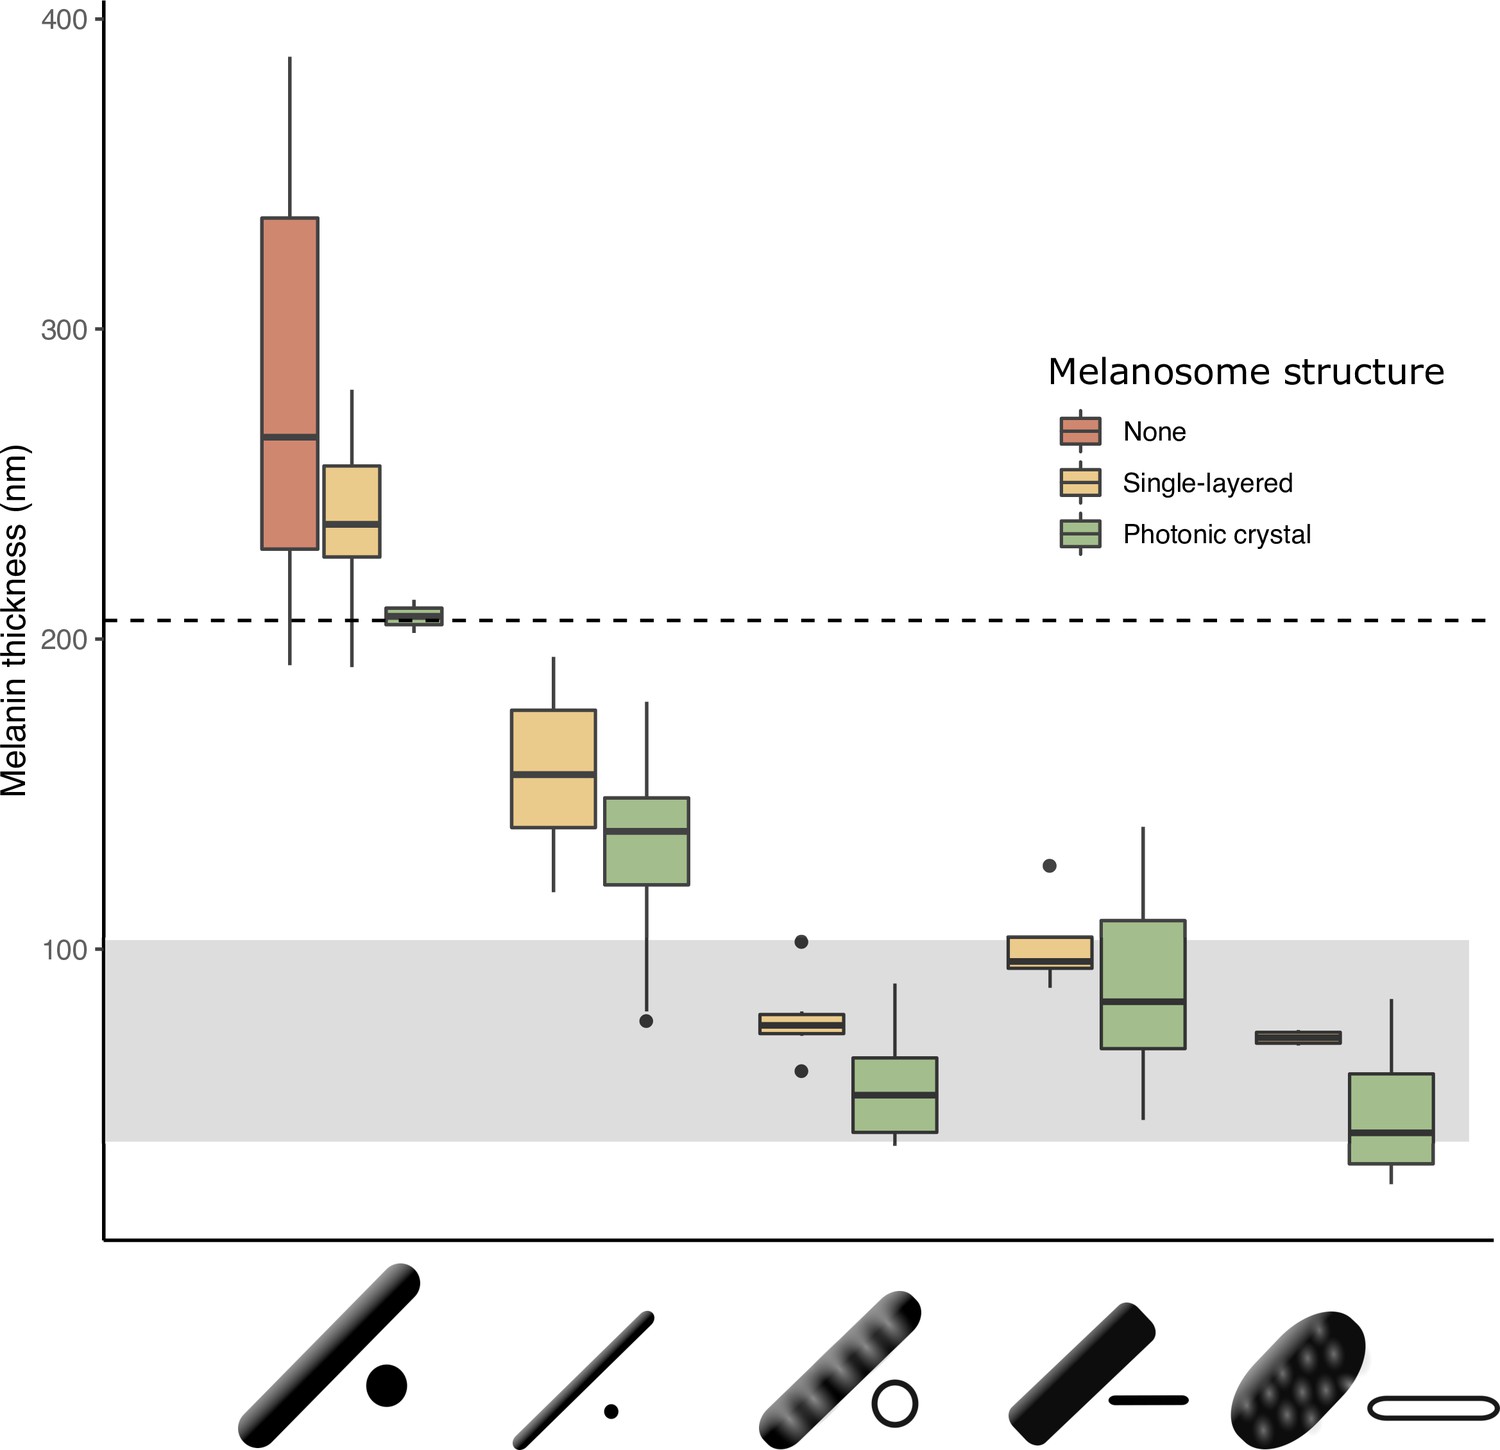
The thickness of melanin layers in derived melanosomes has converged toward the theoretical expected range, where optical thickness < (below dashed line, for bird-visible spectrum).
Boxplot shows the distribution of melanin layer thicknesses for each melanosome type in single-layered structures (yellow) and photonic crystals (green) in the feather iridescence database. ‘None’ corresponds to melanosomes in a black feather without organization (data from Li et al., 2012). All melanosome types except thick solid rods, which are predominantly found only in single-layered structures with weak iridescence, have converged toward an optical thickness of < . Hollow and platelet forms often reach thicknesses closer to , which can in theory form ideal multilayers (gray box, for bird-visible spectrum). Note that three species are recorded to have thick solid rods in a photonic crystal: Paradisaea rubra (Red bird-of-paradise), Parotia lawesii (Lawes’ parotia), and Eudynamys scolopaceus (Asian koel). Paradisaea rubra and Parotia lawesii have melanosomes with porous interiors (see Discussion), so they are not ‘true’ thick solid rods and will have an optical thickness closer to that of a derived melanosome. The structure in Eudynamys scolopaceus consists of tightly, hexagonally packed rods and appears to produce relatively weak iridescent color. It may be an example of a structure evolving toward brilliant iridescence (Path 2, Figure 7C).
Figure 6 with 2 supplements
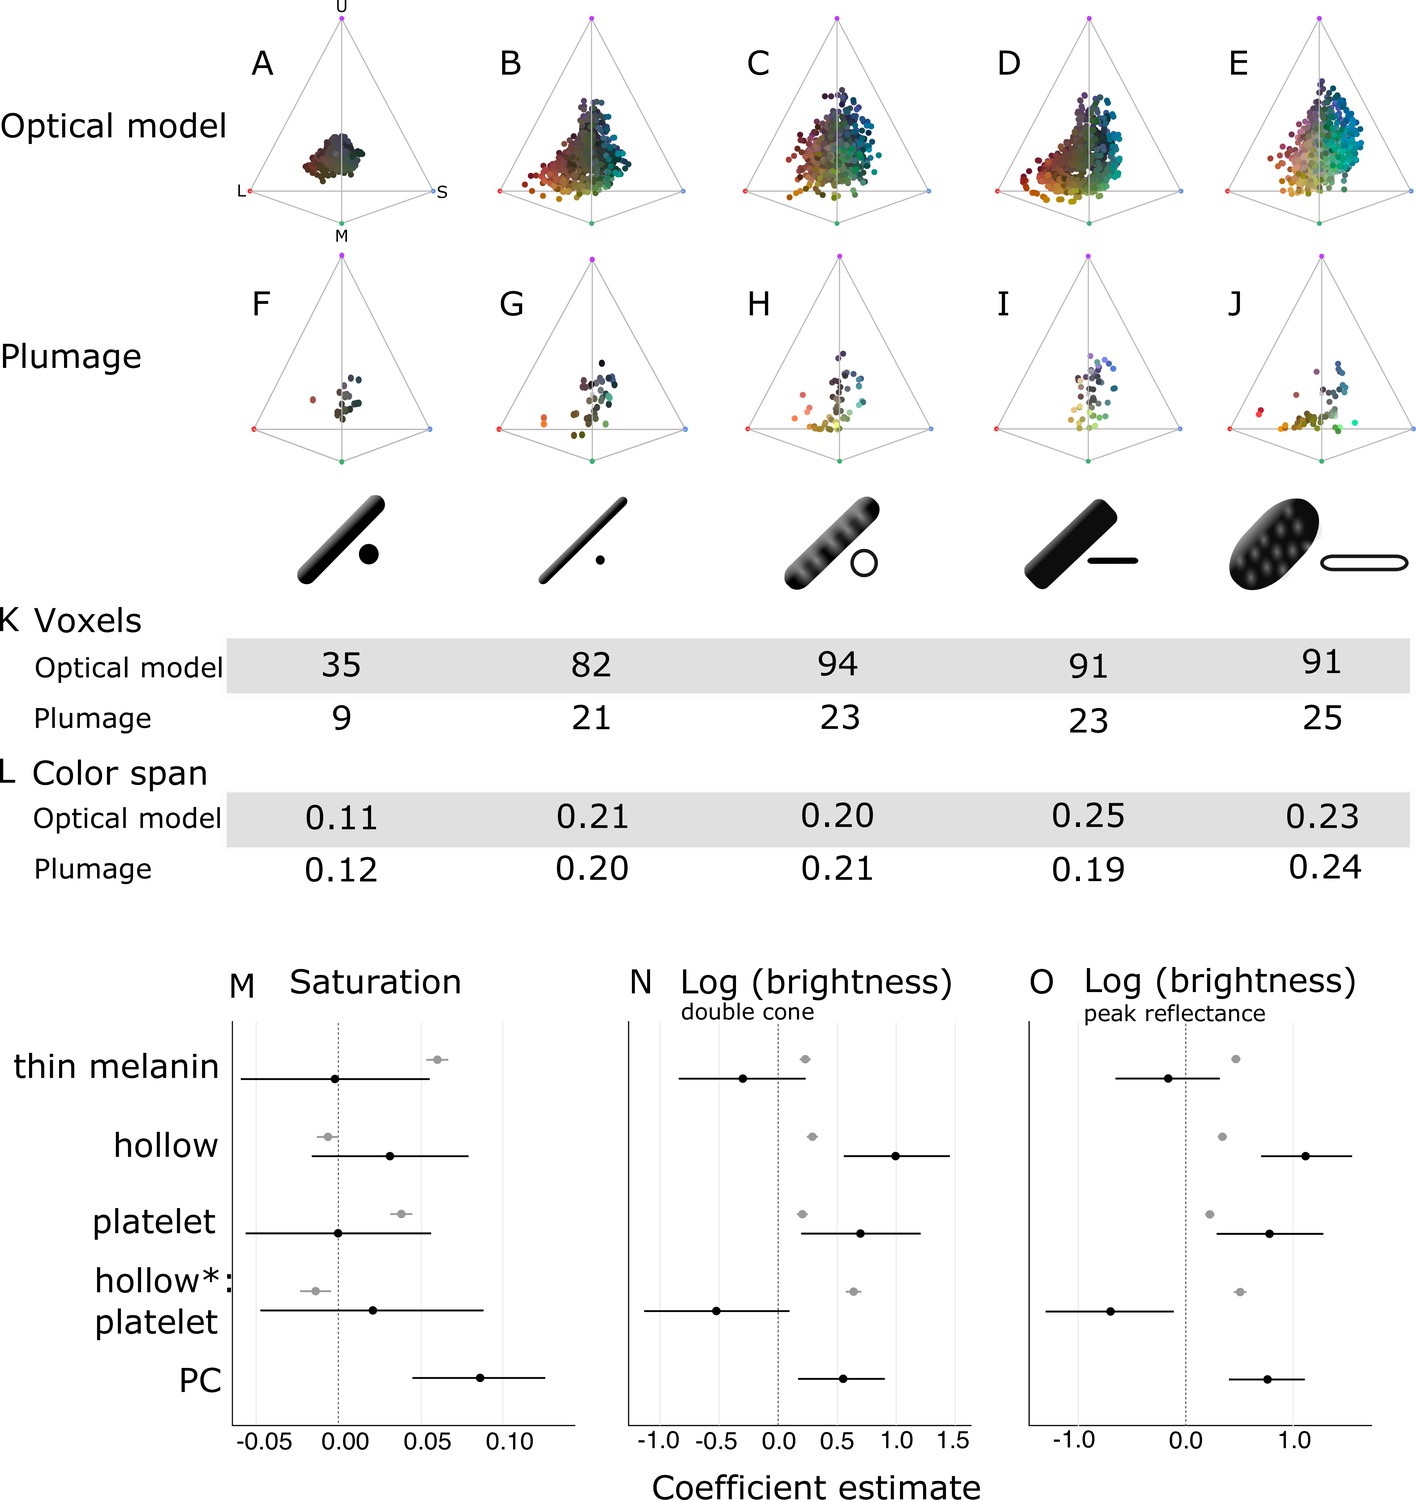
Optical effects of different melanosome modifications, as predicted by an optical model and found in empirical plumage analysis.
(A–J) show the color diversity for structures with each type of melanosome represented in an avian tetrahedral color space (optical model (A–E); plumage data (F–J)). Statistics for color diversity are presented in terms of the number of occupied voxels (K) and mean color span (L) for both data sets. Thick solid rods produce colors of substantially lower diversity and saturation (A, F) than all melanosome types with thin melanin layers (B–E, G–J). In contrast, hollowness and platelet shape do not affect color diversity notably (C–E, H–J). (M–O) depict the estimates for the effects of each melanosome modification on saturation (M), log (brightness, double-cone) (N), and log (brightness, peak reflectance) (O), as predicted by linear models. The parameter PC describes variation explained by having a photonic crystal, which was used to control for variation in plumage data (see Results). Gray points show coefficient estimates for a model based on optical model simulations, and black dots show the posterior coefficient estimates for a model based on the plumage data. Horizontal lines show 95% confidence intervals for estimates.
Figure 6—figure supplement 1
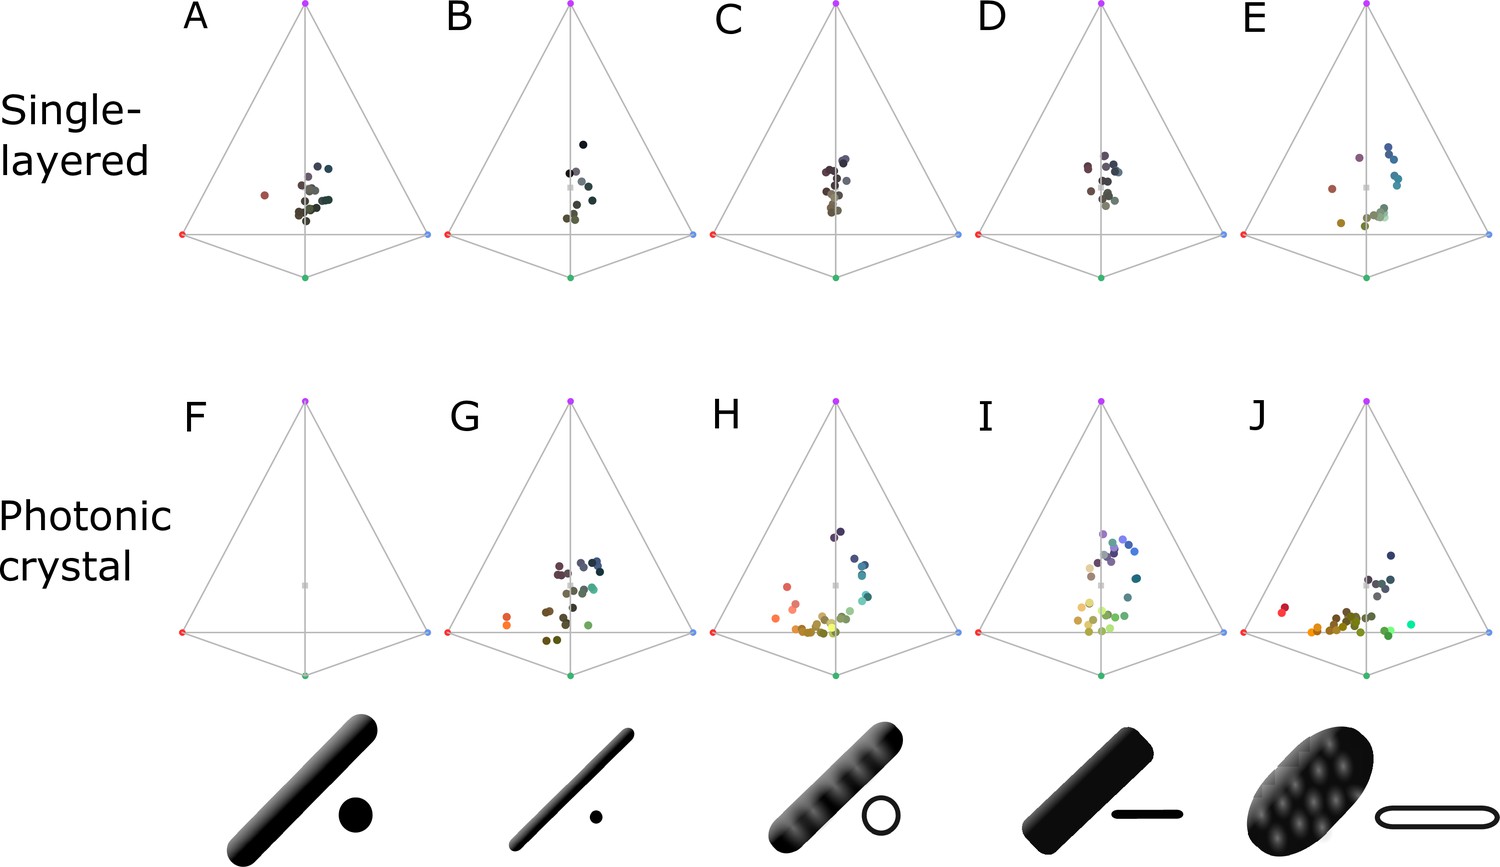
Plumage color data (represented in avian color space) subdivided by type of structure; single-layered (A–E) and photonic crystal (F–J).
Melanosome schematics in bottom row indicate the type of melanosome in the structures: thick solid rod (A, F), thin solid rod (B, G), hollow rod (C, H), solid platelet (D, I), and hollow platelet (E, J). Note that saturation is low for all single-layered structures, with the exception of hollow platelets (E). Data for (E) are mainly collected from African starlings; thus, it is not clear whether this is a general trend or specific to this group. Either way, it demonstrates that single-layered structures behave differently from photonic crystals and deserve further study.
Figure 6—figure supplement 2
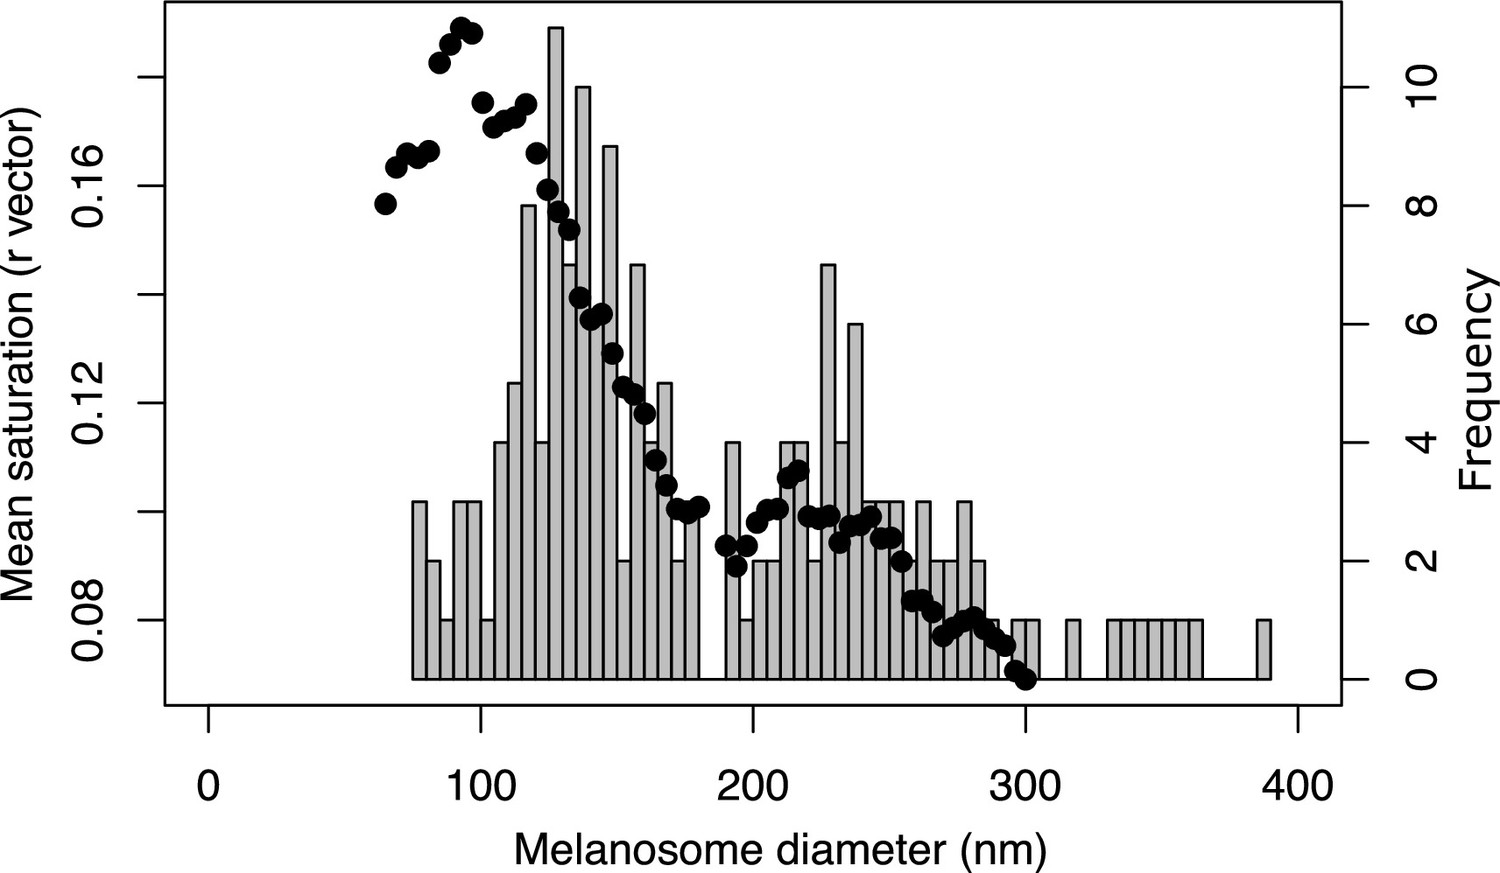
Color saturation increases for structures with solid rods of diameter <190 nm.
Black dots show the mean saturation of simulated structures with solid rods of varying diameters, as estimated by the optical model. Histogram in the background shows the size distribution of solid rods in iridescent feather structures (data from feather iridescence database). Both the results of the optical model and the distribution of melanosome size in solid rods suggest that there is a shift at approximately 190 nm, which we have defined as the dividing line between thin and thick melanin layers. Saturation reaches a maximum for melanin layer thickness of around 100 nm, where the optical thickness approximates .
Figure 7
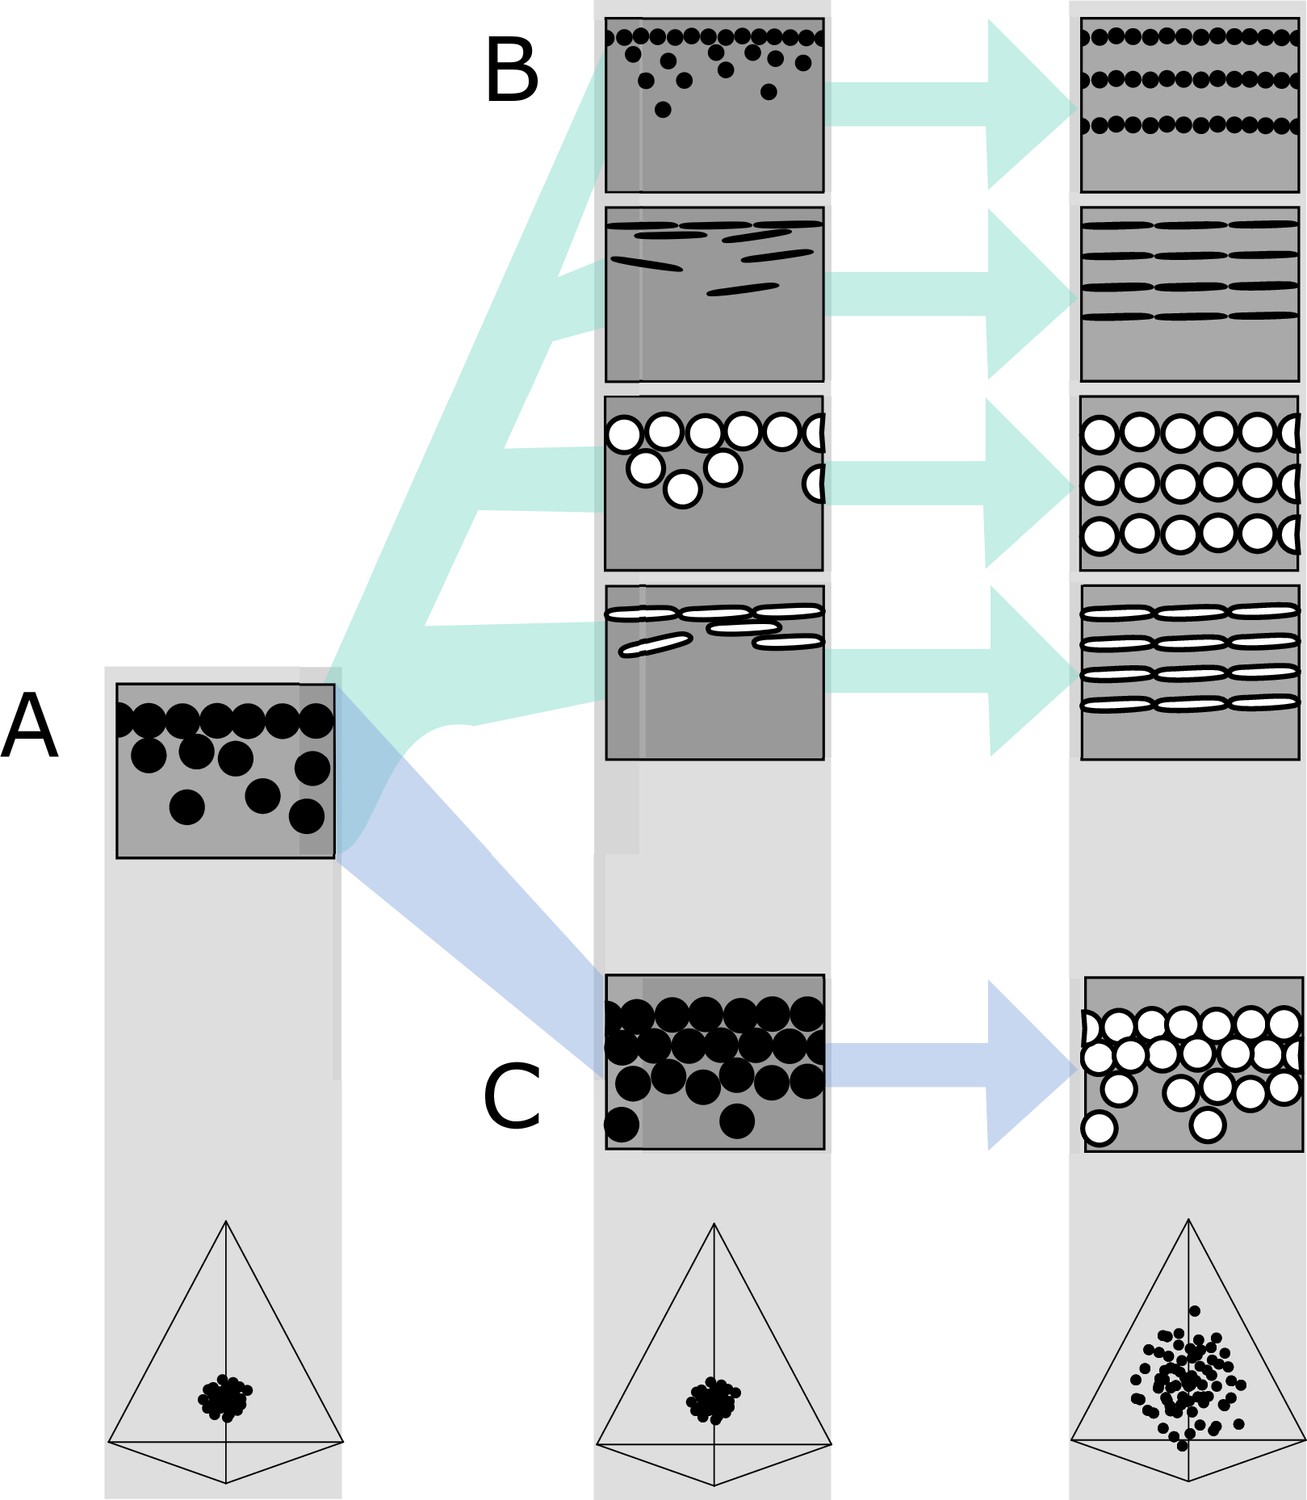
Hypothetical evolutionary paths to brilliant iridescence.
Gray squares depict schematics of barbule cross-sections, showing the iridescent nanostructures within, while the tetrahedra below show hypothetical color diversity for each evolutionary ‘step,’ represented in avian color space. (A) Assumed ancestral state for iridescent structures—a single-layered structure with thick solid rods. Note that a layer refers to a continuous layer of melanosomes; scattered or disorganized melanosomes often seen below a continuous single layer do not constitute additional layers. From this state, structures may either first evolve modified melanosomes in a single-layered structure (B, Path 1) or first evolve multilayered, hexagonal structuring of thick solid rods (C, Path 2). Both of these states are expected to give a negligible advantage in terms of color saturation and diversity, as seen in the hypothetical color spaces corresponding to each stage (bottom). We argue that Path 1 might initially be driven by selection for brighter colors, while Path 2 could form spontaneously from higher concentrations of melanosomes in the barbule. Both paths can then evolve toward more brilliant forms (multilayers in (B), modified melanosomes with thin melanin layers in (C)), which will drastically expand the possible color diversity.
Figure 8
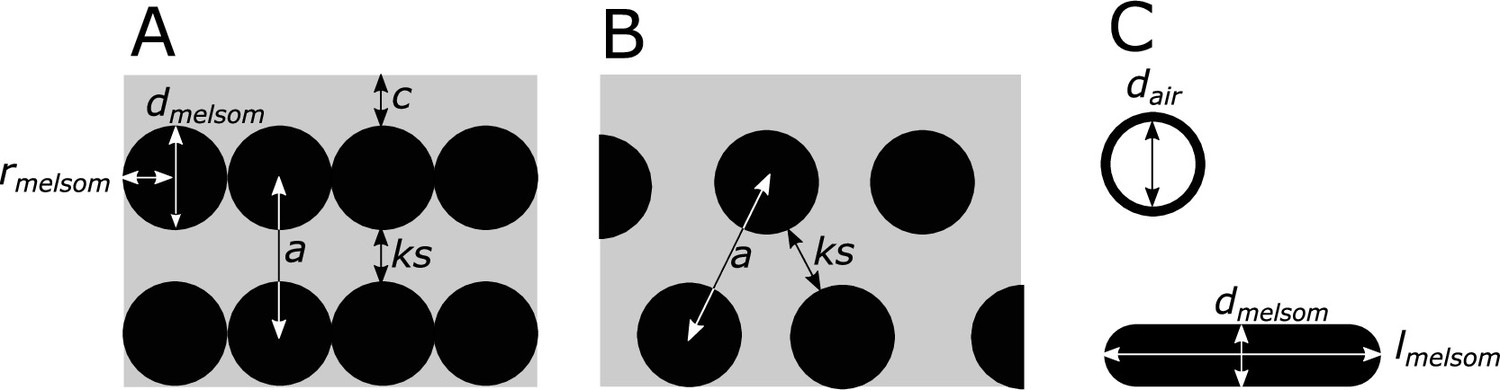
Definitions of parameters used in the study, shown in schematics of cross-sections of iridescent structures.
(A) Laminar photonic crystal (multilayer); (B) hexagonal photonic crystal; and (C) isolated hollow and flat melanosomes. In (A), dmelsom: diameter of melanosome (shortest axis in flat melanosomes), rmelsom: radius of melanosome (dmelsom /2), c: thickness of keratin cortex, a: lattice spacing (center-center distance between melanosomes), ks: keratin spacing (thickness of keratin layer between melanosomes at the thinnest point). In (B), keratin spacing (ks) and lattice spacing (a) are shown for a hexagonal photonic crystal. In (C), dair: diameter of internal air pockets (shortest axis of air pockets in hollow platelets), lmelsom: width of platelets. Melanin layer thickness is defined as (dmelsom for solid forms, and (dmelsom−dair)/2) for hollow forms.
Author response image 1
Tables
Table 1
Model parameter ranges for each melanosome type.
The values reported in parentheses are the number of evenly spaced steps with which the parameter was varied. For each melanosome type, we simulated 900 unique structural configurations.
| Melanosome type | Melanosome diameter (nm) | Hollowness (dair/dmelsom) | Flatness(lmelsom/dmelsom) | Relative lattice spacing (rmelsom/a) | Cortex (nm) | Hexagonal packing |
|---|---|---|---|---|---|---|
| Thick solid rods | 190–300 (30) | 0 | 1 | 0.15–0.5 (5) | 5–1000 (3) | Yes |
| Thin solid rods | 65–180 (30) | 0 | 1 | 0.15–0.5 (5) | 5–1000 (3) | Yes |
| Hollow rods | 135–440 (10) | 0.26–0.69 (3) | 1 | 0.15–0.5 (5) | 5–1000 (3) | Yes |
| Solid platelets | 45–140 (30) | 0 | 2.4 | 0.15–0.5 (5) | 5–1000 (3) | No |
| Hollow platelets | 135–280 (10) | 0.26–0.69 (3) | 2.4 | 0.15–0.5 (5) | 5–1000 (3) | No |
Additional files
-
Supplementary file 1
Supplementary tables - details of statistical test results, supplementary color statistics and source links to images in Figures 1—3.
(a) Result of phylogenetic pairwise t-test for difference in melanin layer thickness. P values corrected for multiple comparisons. (b) Phylogenetic signal for traits used in phylogenetic t-tests and ANOVA. (c) Summary statistics for brightness and saturation of optical model data, subdivided by melanosome type (used in linear models). (d) Summary statistics for brightness and saturation of plumage data, subdivided by melanosome type (used in Bayesian linear models). (e) Color diversity and saturation for optical model data using the UVS cone sensitivity function. (f) Color diversity and saturation for plumage data using the UVS cone sensitivity function. (g) Summary of results for linear model of saturation for optical model data. Model: Saturation (r.vec)~ hollow + thin+ platelet + hollow*platelet. Residual standard error: 0.072 on 4495 degrees of freedom. Multiple R-squared: 0.170, adjusted R-squared: 0.169. (h) Summary of results for linear model of brightness (double cone quantum catch) for optical model data. Model: Log brightness (double cone quantum catch)~ hollow + thin+ platelet + hollow*platelet. Residual standard error: 0.502 on 4495 degrees of freedom. Multiple R-squared: 0.459, adjusted R-squared: 0.459. (i) Summary of results for linear model of brightness (peak reflectance) for model data. Model: Log brightness (peak reflectance)~ hollow + thin+ platelet + hollow*platelet. Residual standard error: 0.4629 on 4495 degrees of freedom. Multiple R-squared: 0.540, adjusted R-squared: 0.540. (j) Summary of results for Bayesian linear model of saturation for plumage data. Model: saturation (r.vec)~ hollow + thin+ platelet + hollow*platelet+ PC. (k) Summary of results for Bayesian linear model of brightness (double cone quantum catch) for plumage data. Model: Log brightness (double cone quantum catch)~ hollow + thin+ platelet + hollow*platelet+ PC. (l) Summary of results for Bayesian linear model of brightness (peak reflectance) for plumage data. Model: Log brightness (peak reflectance)~ hollow + thin+ platelet + hollow*platelet+ PC (m) Image attribution for feather in Figure 1. (n) Image attribution for photographs in Figure 2. (o) Image attribution for silhouettes in Figure 3.
- https://cdn.elifesciences.org/articles/71179/elife-71179-supp1-v1.docx
-
Transparent reporting form
- https://cdn.elifesciences.org/articles/71179/elife-71179-transrepform1-v1.docx
Download links
A two-part list of links to download the article, or parts of the article, in various formats.
Downloads (link to download the article as PDF)
Open citations (links to open the citations from this article in various online reference manager services)
Cite this article (links to download the citations from this article in formats compatible with various reference manager tools)
Evolution of brilliant iridescent feather nanostructures
eLife 10:e71179.
https://doi.org/10.7554/eLife.71179


