TMEM120A is a coenzyme A-binding membrane protein with structural similarities to ELOVL fatty acid elongase
- Department of Physiology, University of Texas Southwestern Medical Center, United States
- Department of Biophysics, University of Texas Southwestern Medical Center, United States
- Howard Hughes Medical Institute, University of Texas Southwestern Medical Center, United States
- Department of Biochemistry, University of Texas Southwestern Medical Center, United States
- Department of pharmaceutical Sciences, School of Pharmacy, University of Pittsburgh, United States
Figures
Figure 1

Electrophysiology of TMEM120A.
(a) Sample traces of patch-clamp recordings of HEK293 cells with and without TMEM120A expression. (b) Recordings of Piezo1 knockout HEK293 cells with and without TMEM120A expression. (c) Recordings of CHO cells with and without TMEM120A expression. (d) Sample traces of giant liposome patching using proteoliposomes with 1:500 (left) or 1:100 (right) protein-to-lipid (w/w) ratio.
Figure 2 with 3 supplements
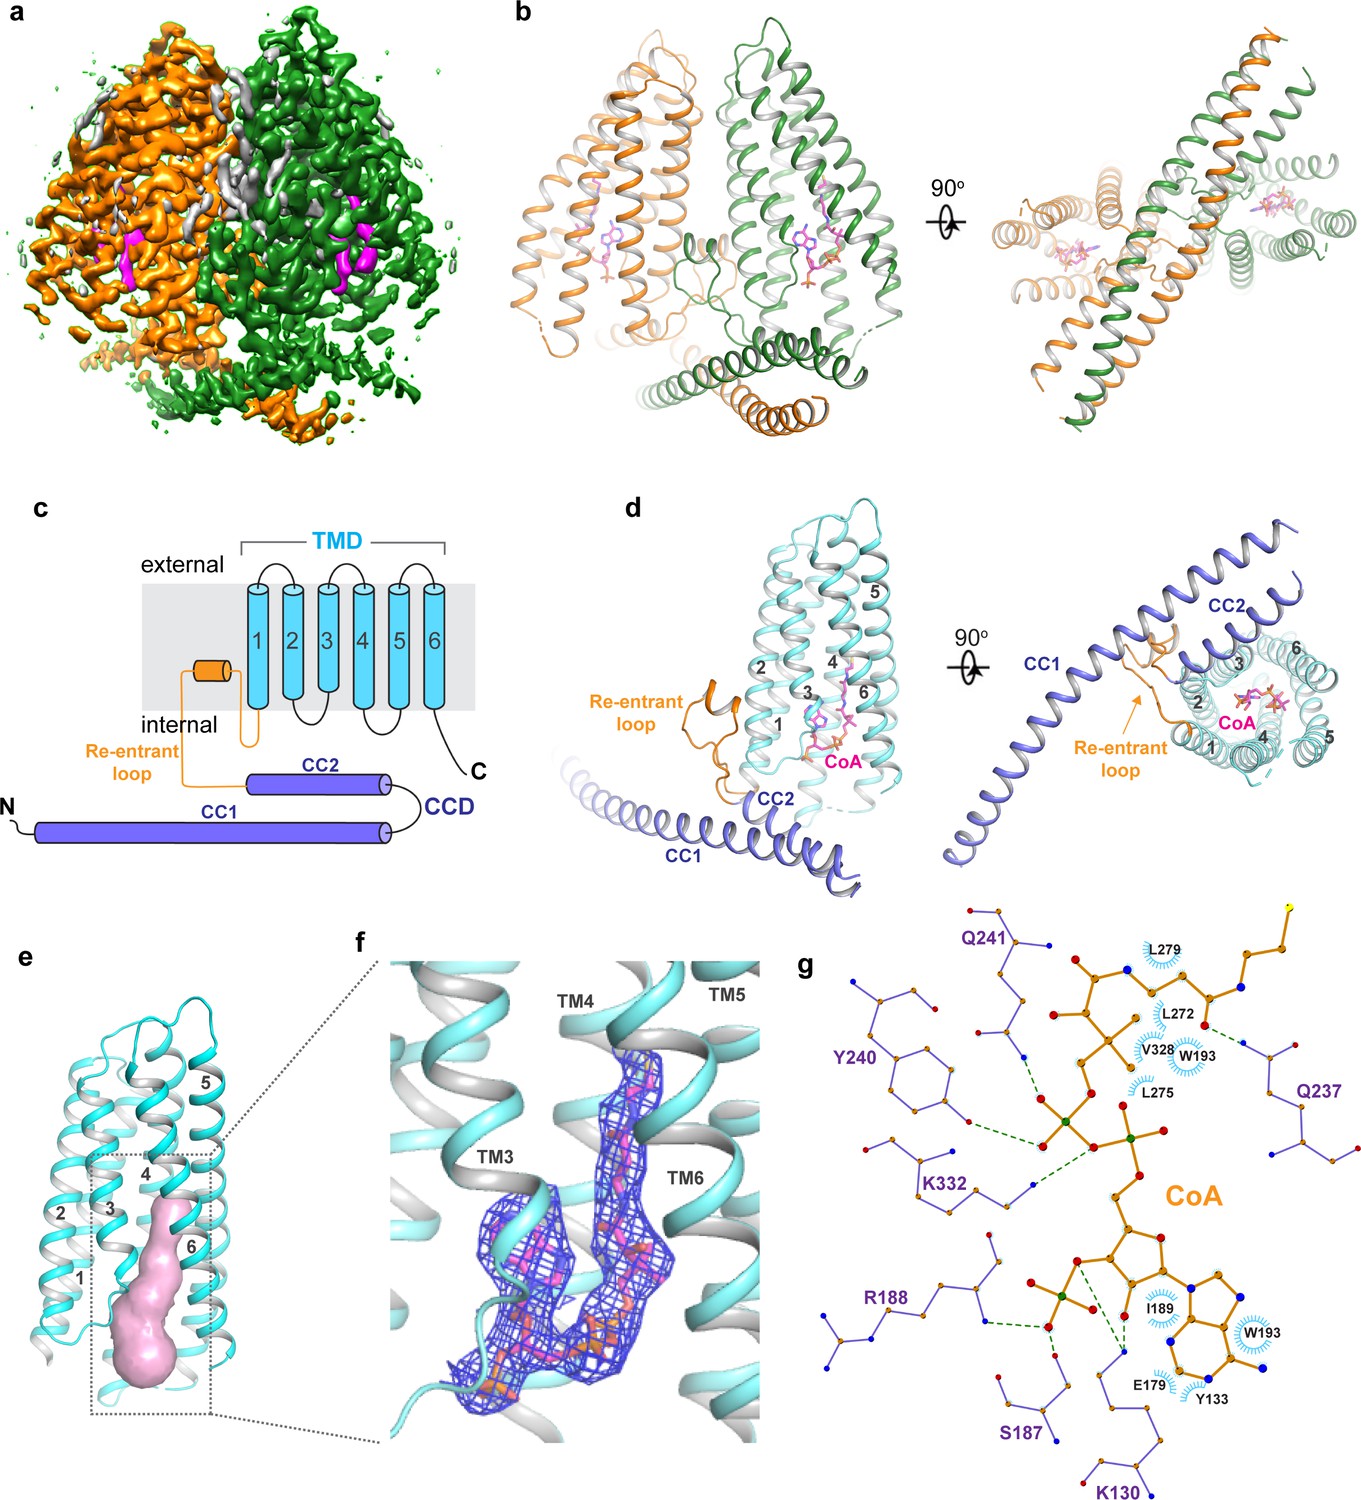
Overall structure of TMEM120A.
(a) Side view of 3D reconstruction of TMEM120A. Channel subunits are colored individually with bound substrate density in purple and lipid density in gray. (b) Side and bottom views of cartoon representation of TMEM120A structure. Coenzyme A (CoA) molecules are rendered as sticks. (c) Topology and domain arrangement in a single TMEM120A subunit. (d) Side and bottom views of a single subunit in a similar orientation as the green-colored subunit in (b). (e) Transmembrane domain (TMD)-enclosed pocket (colored in salmon) analyzed using the program CAVER (Jurcik et al., 2018). (f) Zoomed-in view of CoA-binding site with its density (blue mesh). (g) Schematic diagram detailing the interactions between TMEM120A residues and CoA. Toothed wheels mark the hydrophobic contacts between protein residues and CoA. Dotted lines mark the salt bridges and hydrogen bonds.
-
Figure 2—source data 1
Cryo-EM data collection and model statistics.
- https://cdn.elifesciences.org/articles/71220/elife-71220-fig2-data1-v2.doc
Figure 2—figure supplement 1
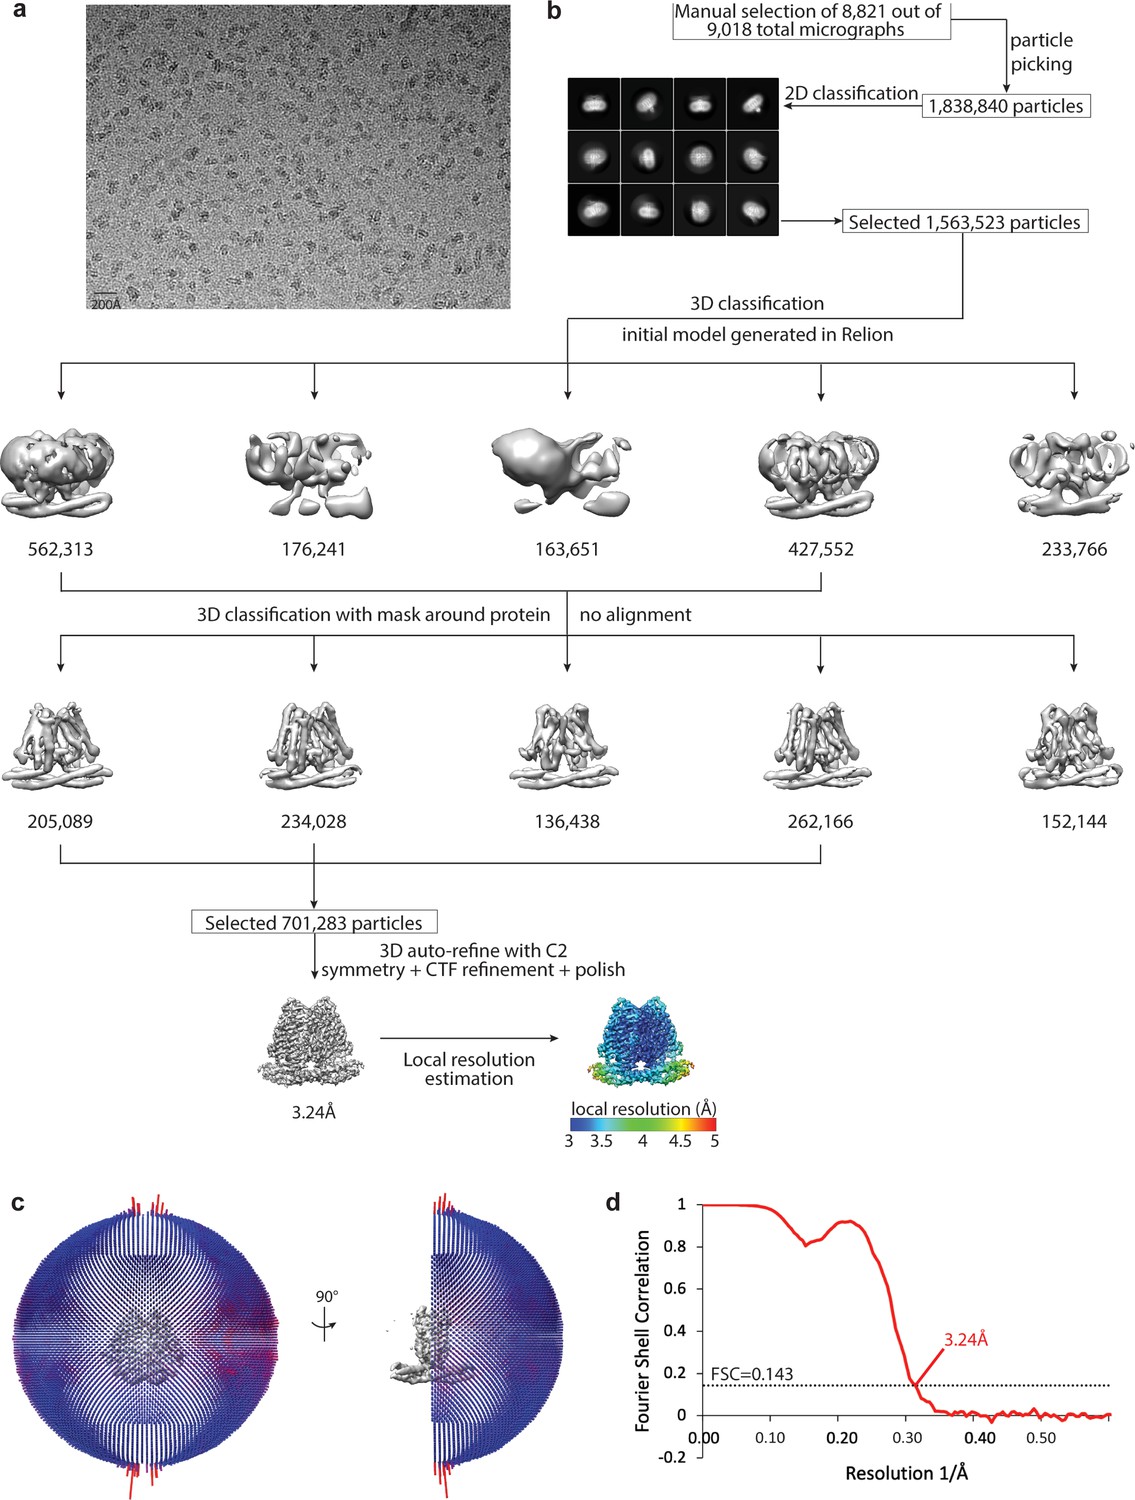
Cryo-EM data processing scheme of human TMEM120A.
(a) A representative micrograph. Scale bar is 20 nm. (b) Flow chart of the cryogenic electron microscopy (cryo-EM) data processing procedure. Selected 2D class averages are shown. The particle numbers are indicated under the corresponding 3D classes. (c) Euler angle distribution of particles used in the final 3D reconstruction. (d) Fourier Shell Correlation (FSC) curves showing the overall resolution of 3.24 Å at FSC = 0.143.
Figure 2—figure supplement 2
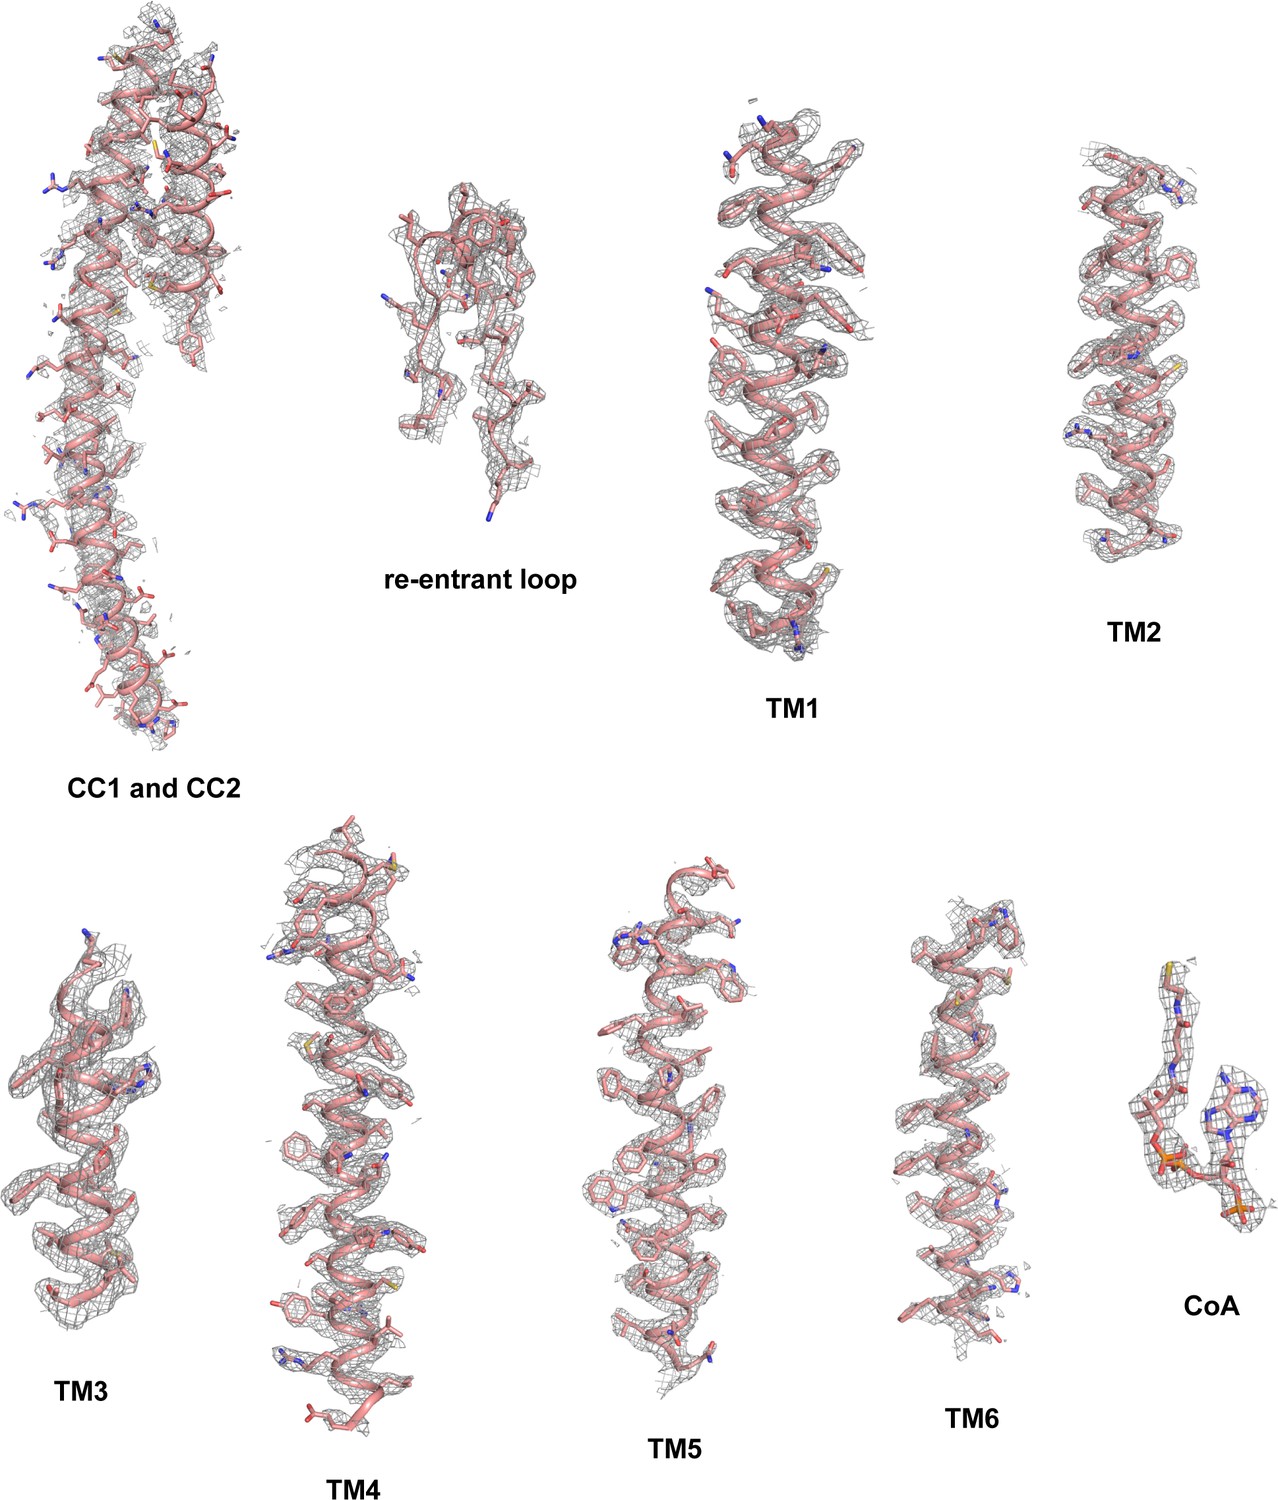
Sample density maps of human TMEM120A at various regions.
Maps of CC1 and CC2 are contoured at 4.5 σ. All other maps are contoured at 6.0 σ.
Figure 2—figure supplement 3
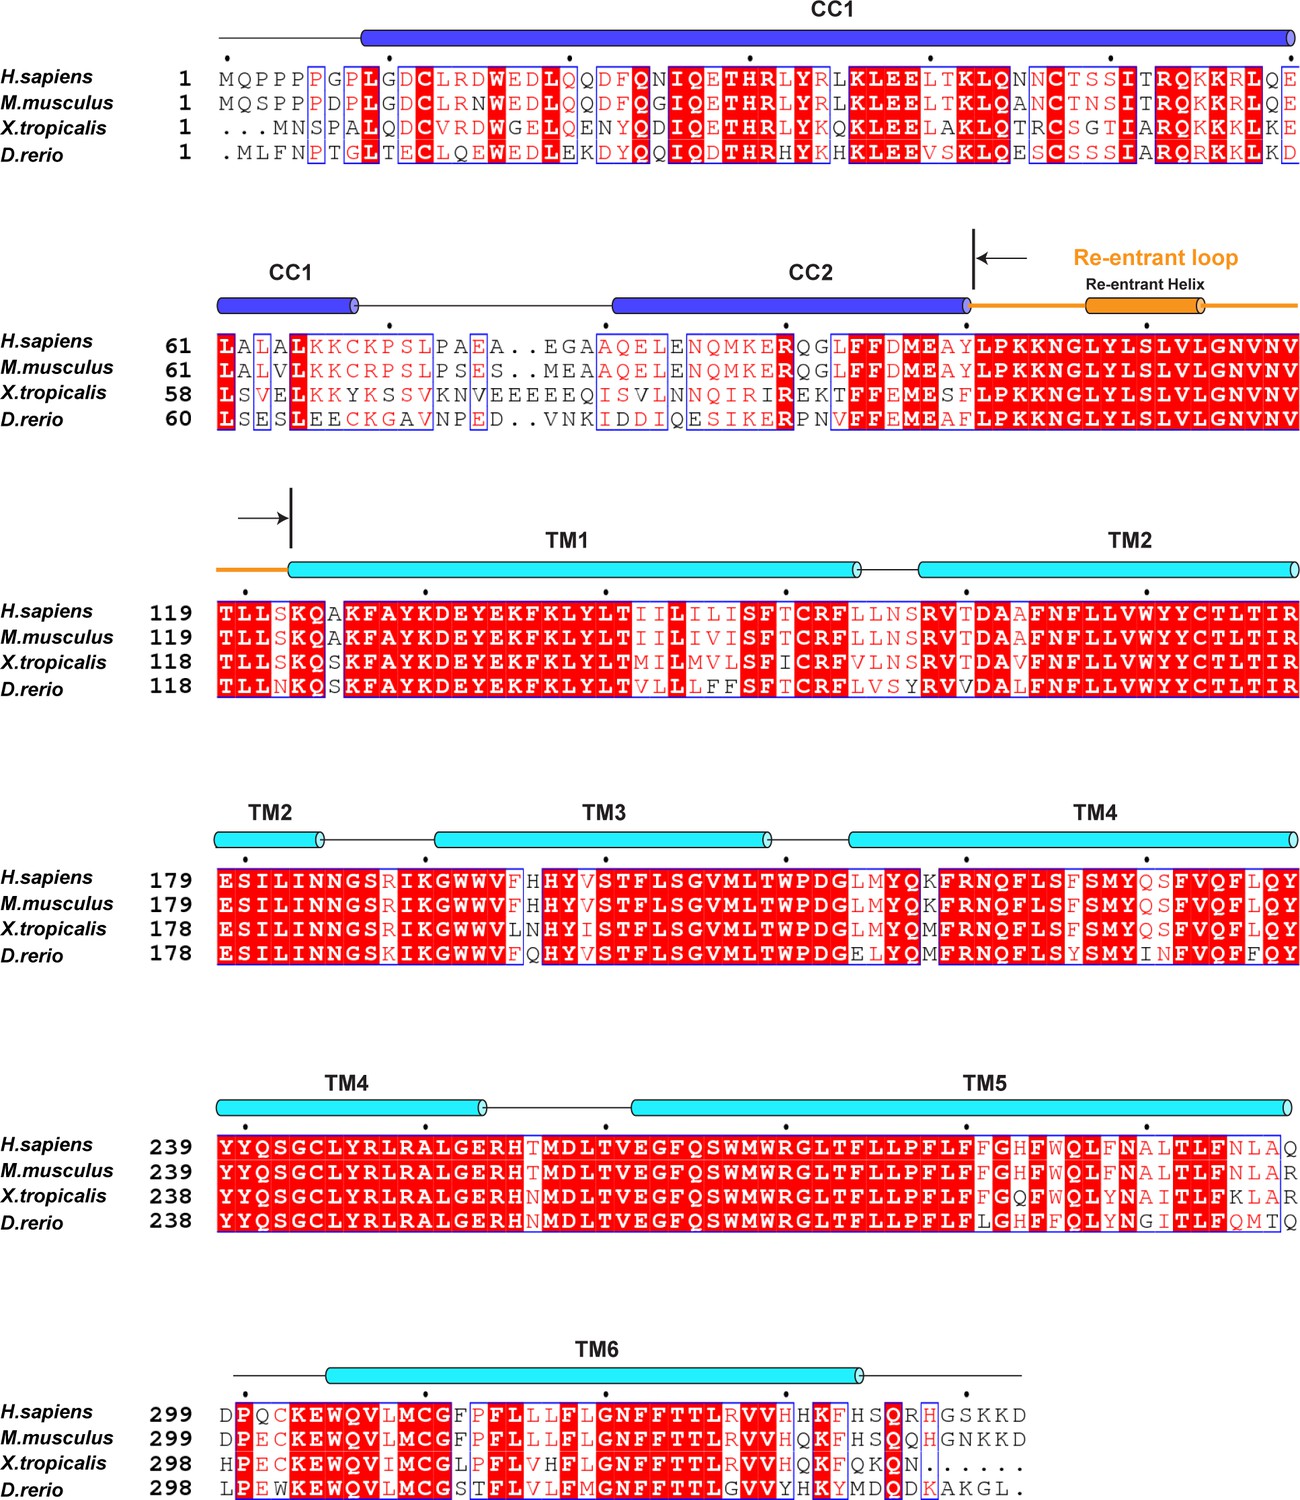
Sequence alignment of vertebrate TMEM120A.
Secondary structure assignments are based on the structure of human TMEM120A.
Figure 3
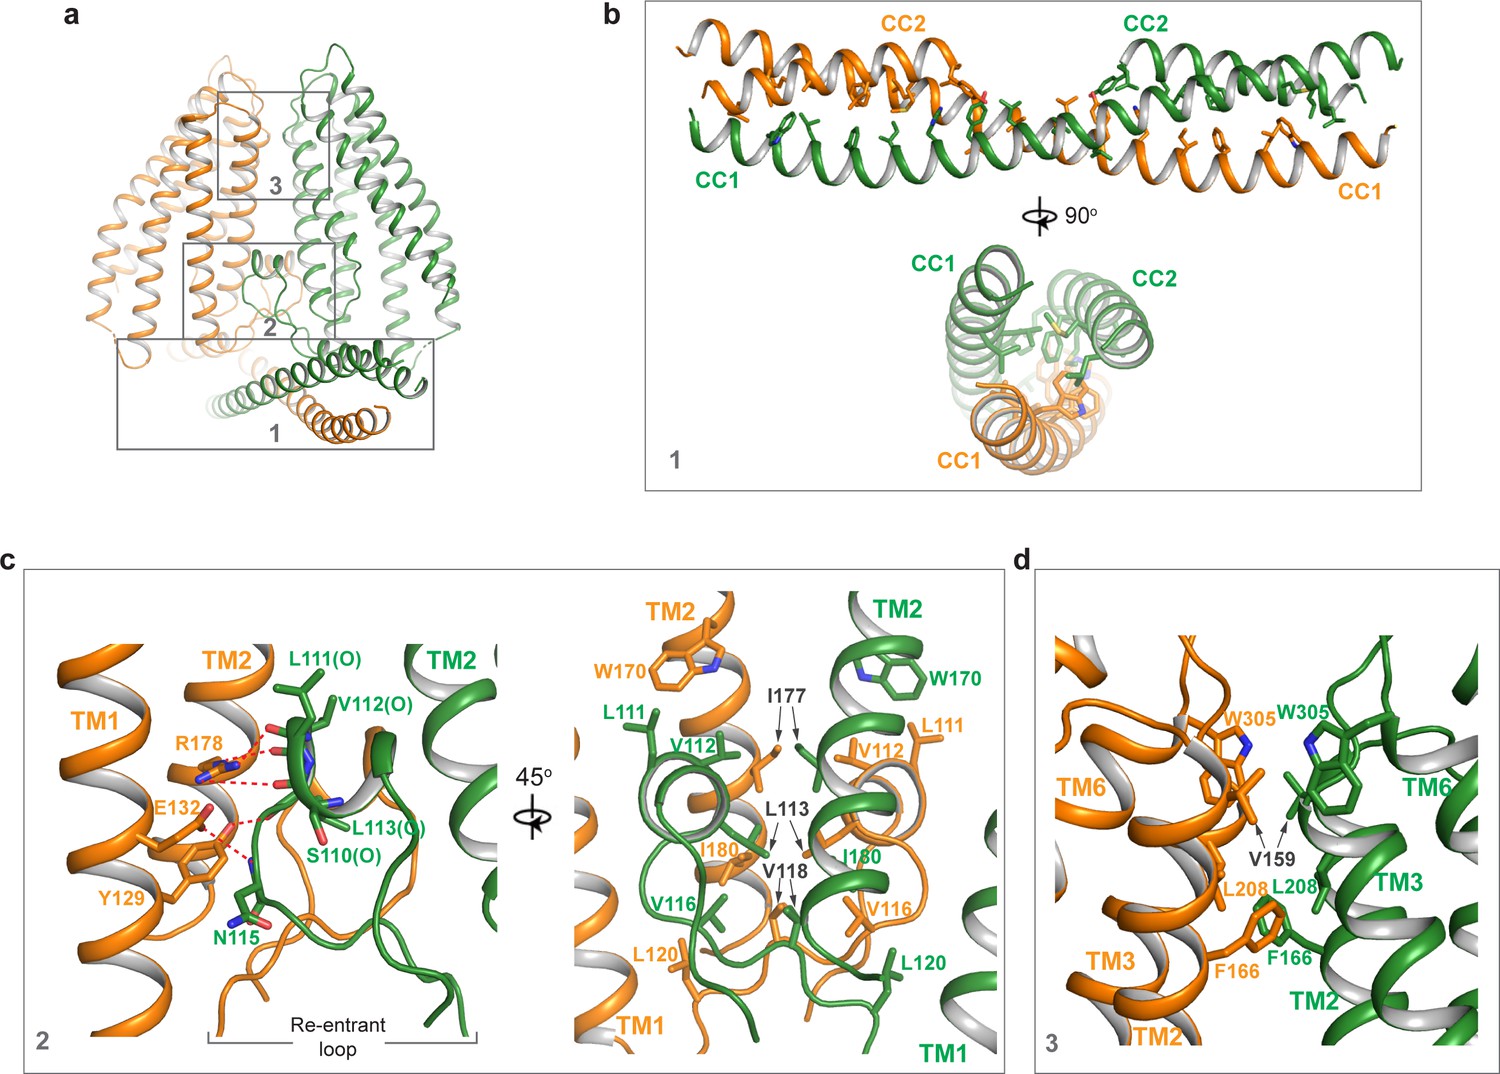
Dimerization of TMEM120A.
(a) Extensive dimerization interactions occur in three boxed regions: the coiled coil domain (CCD) (box 1), the re-entrant loop (box 2), and the external side of transmembrane domain (TMD) (box 3). (b) Zoomed-in view of dimerization interactions at CCD. Residues that participate in the inter-subunit contact are W16, L19, F23, I26, H30, Y33, L37, L40, L43, I51, L58, and L61 in CC1, and L83, M87, L93, F94, M97, Y100, and L101 in CC2. (c) Zoomed-in view of dimerization at the re-entrant loop. Shown in the left panel are the inter-subunit hydrogen bonding interactions between R178 side chain and the carbonyl oxygen atoms of S110, L111, and V112, between Y129 side chain and the carbonyl oxygen of L113, and between the side chains of E132 and N115. Shown in the right panel are the inter-subunit hydrophobic contacts between the two re-entrant loops and between the re-entrant loop and transmembrane helices (TMs) 1-2 of the neighboring subunit. (d) Zoomed-in view of the inter-subunit hydrophobic contacts between the two TMDs.
Figure 4
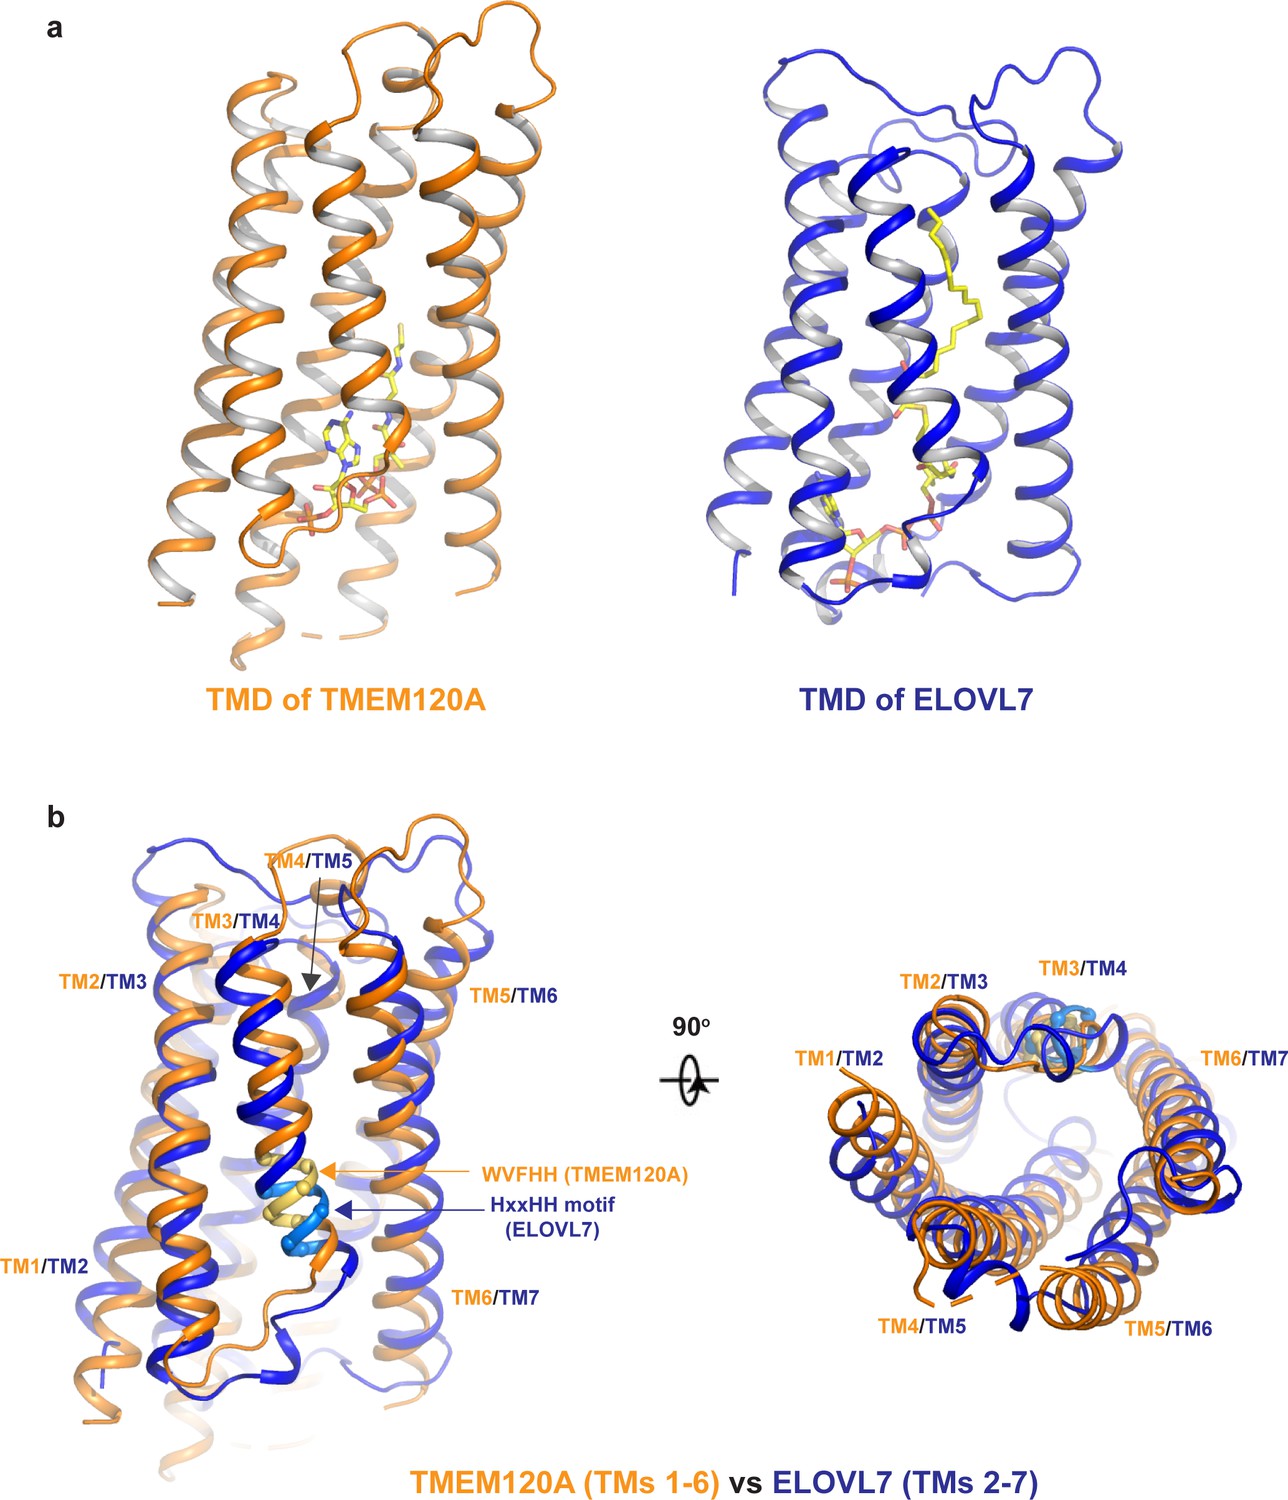
Structural comparison between TMEM120A and ELOVL7 elongase.
(a) Structures of the 6-TM α-barrel transmembrane domains (TMDs) from TMEM120A (TMs 1–6, left) and ELOVL7 elongase (TMs 2–7, right). Coenzyme A (CoA) in TMEM120A and 3-keto acyl-CoA in ELOVL7 are rendered as sticks. (b) Structural comparison between the 6-TM barrels from TMEM120A (orange) and ELOVL7 (blue) in side view (left) and bottom view (right). HxxHH motif in ELOVL7 is colored in cyan. The WVFHH sequence of TMEM120A at the equivalent location is colored in yellow.
Figure 5
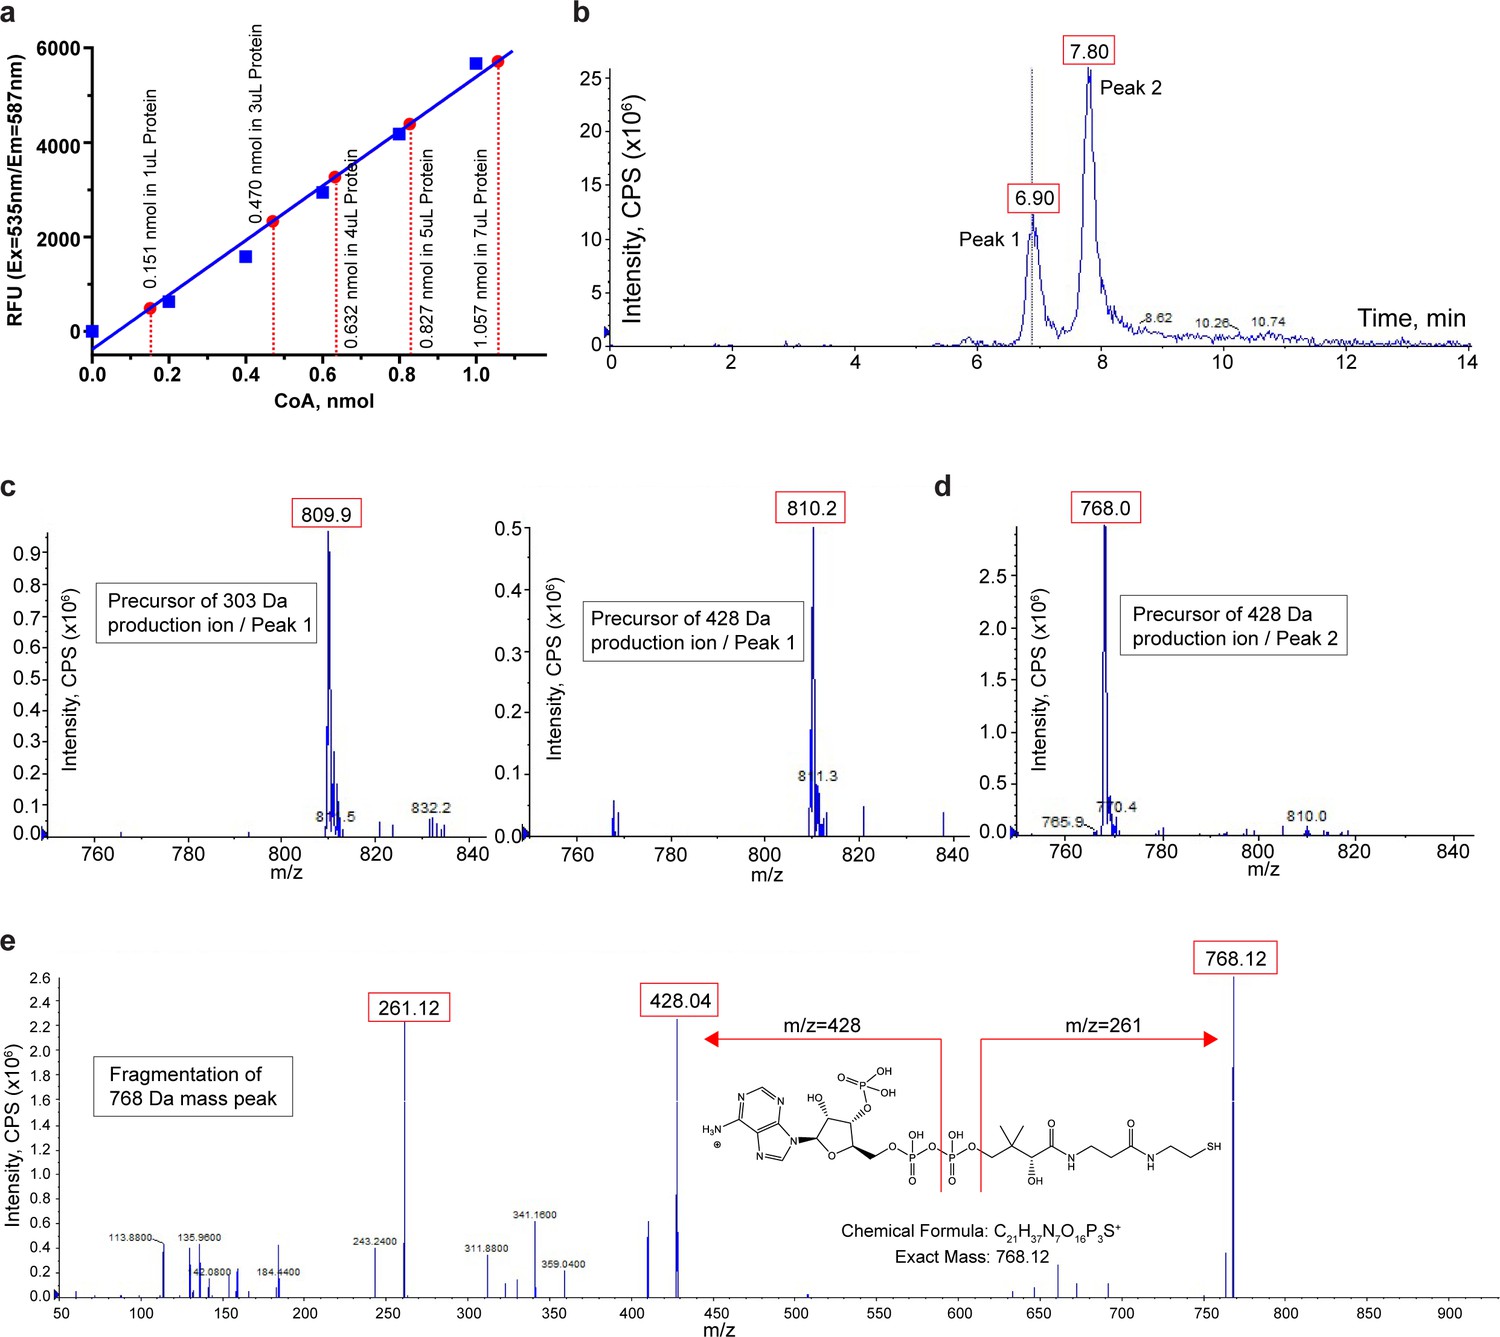
Biochemical and mass spectrometry assay of CoA in TMEM120A.
(a) Coenzyme A (CoA) assay. A blue standard curve is obtained from fluorometric measurements of various amounts of pure CoA provided in the assay kit. Red dots mark the measured CoA contents in 1, 3, 4, 5, and 7 μl of protein samples. The measure of CoA concentration in 4 mg/ml protein sample is 0.1564 ± 0.0027 mM (mean ± SEM, n = 5). (b) Liquid chromatography (LC) separation of extracted substrates from TMEM120A protein sample in liquid chromatography-tandem mass spectrometry (LC-MS/MS). (c) Precursor ion scan of peak 1 effluent using 303 Da (left) and 428 Da (right) fragments. (d) Precursor ion scan of peak 2 effluent using 428 Da fragments. (e) Fragmentation (product ion scan) of the 768 Da mass peak.
-
Figure 5—source data 1
CoA assay.
- https://cdn.elifesciences.org/articles/71220/elife-71220-fig5-data1-v2.xlsx
Tables
Key resources table
| Reagent type (species) or resource | Designation | Source or reference | Identifiers | Additional information |
|---|---|---|---|---|
| Strain, strain background (Escherichia coli) | TOP10 | Thermo Fisher Scientific | Cat# 18258012 | |
| Strain, strain background (E. coli) | DH10bac | Thermo Fisher Scientific | Cat# 10361012 | |
| Cell line (Spodoptera frugiperda) | Sf9 cells | Thermo Fisher Scientific | Cat# 11496015; RRID:CVCL_0549 | |
| Cell line (Homo sapiens) | FreeStyle 293 F cells | Thermo Fisher Scientific | Cat# R79007; RRID:CVCL_D603 | |
| Transfected construct (H. sapiens) | pEZT-BM-TMEM120A-Nflag | This paper | N/A | |
| Recombinant DNA reagent | pEZT-BM | DOI:10.1016/j.str.2016.03.004 | Addgene:74099 | |
| Sequence-based reagent | TMEM120A_F_primer: gatataGCTAGCCAACCGCCACCACCCGGGCCATTG | This paper | N/A | |
| Sequence-based reagent | TMEM120A_R_primer: gatataGCGGCCGCTCAATCTTTTTTTGAGCCATG | This paper | N/A | |
| Peptide, recombinant protein | Flag peptide | Sigma-Aldrich | Cat# F3290 | |
| Commercial assay or kit | Coenzyme A Assay Kit | Sigma-Aldrich | Cat# MAK034 | |
| Chemical compound, drug | Sodium Butyrate | Sigma-Aldrich | Cat# 303410 | |
| Chemical compound, drug | Lauryl Maltose Neopentyl Glycol | Anatrace | Cat# NG310 | |
| Chemical compound, drug | Digitonin | Acros Organics | Cat# 11024-24-1 | |
| Software, algorithm | MotionCor2 | Zheng et al., 2017 | http://msg.ucsf.edu/em/software/motioncor2.html | |
| Software, algorithm | GCTF | Zhang, 2016 | https://www.mrc-lmb.cam.ac.uk/kzhang/Gctf | |
| Software, algorithm | RELION | Scheres, 2012 | http://www2.mrc-lmb.cam.ac.uk/relion | |
| Software, algorithm | Chimera | Pettersen et al., 2004 | https://www.cgl.ucsf.edu/chimera; RRID:SCR_004097 | |
| Software, algorithm | PyMol | Schrödinger | https://pymol.org/2; RRID:SCR_000305 | |
| Software, algorithm | COOT | Emsley et al., 2010 | https://www2.mrc-lmb.cam.ac.uk/personal/pemsley/coot; RRID:SCR_014222 | |
| Software, algorithm | MolProbity | Chen et al., 2010 | http://molprobity.biochem.duke.edu/ | |
| Software, algorithm | PHENIX | Adams et al., 2010 | https://www.phenix-online.org | |
| Other | Superose 6 Increase10/300 GL | GE Healthcare | Cat# 29091596 | |
| Other | Anti-DYKDDDDK G1 Affinity Resin | GeneScript | Cat# L00432 | |
| Other | Amicon Ultra-15 Centrifugal Filter Units | Milliporesigma | Cat# UFC9100 | |
| Other | Quantifoil R 1.2/1.3 grid Au300 | Quantifoil | Cat# Q37572 | |
| Other | Cellfectin | Thermo Fisher Scientific | Cat# 10362100 | |
| Other | Sf-900 II SFM medium | Thermo Fisher Scientific | Cat# 10902088 | |
| Other | FreeStyle 293 Expression Medium | Thermo Fisher Scientific | Cat# 12338018 | |
| Other | Antibiotic Antimycotic Solution | Sigma-Aldrich | Cat# A5955 | |
| Other | Proteinase K | Thermo Fisher Scientific | Cat# EO0491 |
Additional files
Download links
A two-part list of links to download the article, or parts of the article, in various formats.
Downloads (link to download the article as PDF)
Open citations (links to open the citations from this article in various online reference manager services)
Cite this article (links to download the citations from this article in formats compatible with various reference manager tools)
TMEM120A is a coenzyme A-binding membrane protein with structural similarities to ELOVL fatty acid elongase
eLife 10:e71220.
https://doi.org/10.7554/eLife.71220


