Chemotactic smoothing of collective migration
- The Andlinger Center for Energy and the Environment, Princeton University, United States
- Department of Chemical and Biological Engineering, Princeton University, United States
- Lewis-Sigler Institute for Integrative Genomics, Princeton University, United States
- Princeton Center for Theoretical Science, Princeton University, United States
Figures
Figure 1
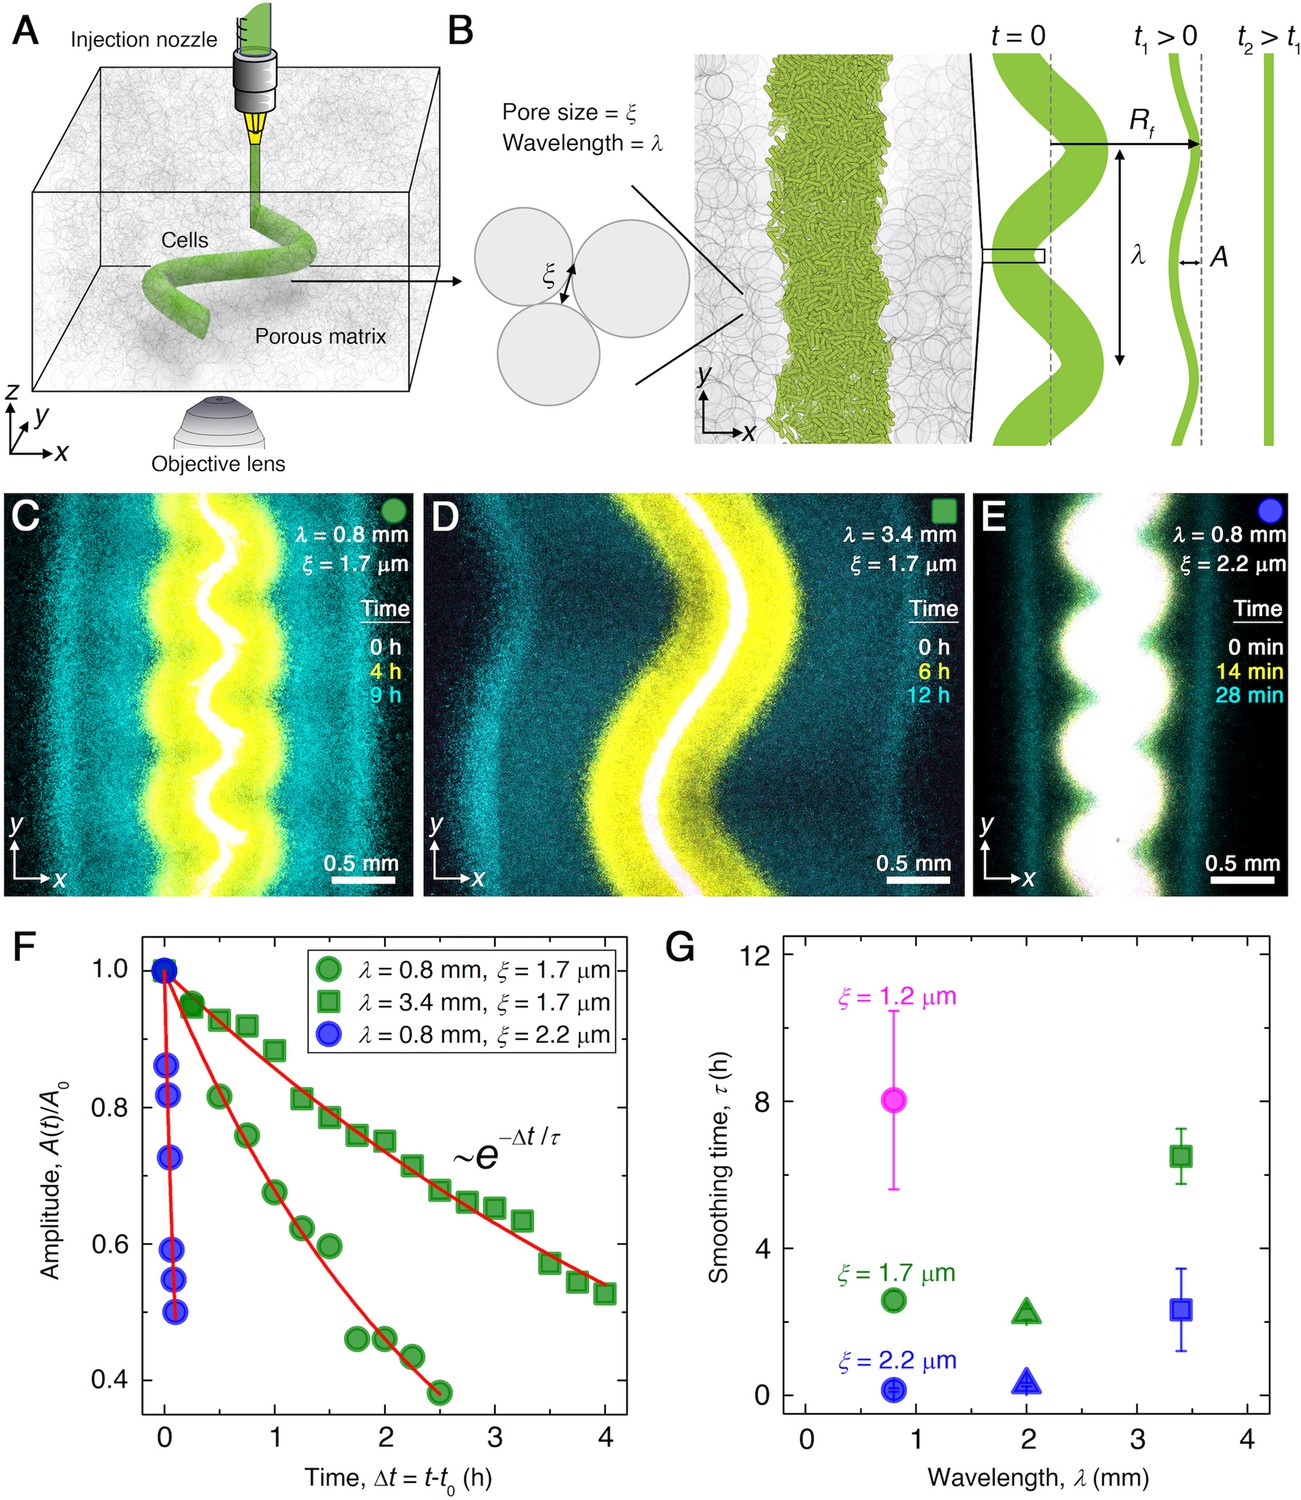
Experiments reveal that migrating E. coli populations autonomously smooth large-scale morphological perturbations.
(A) Schematic of an undulated population (green cylinder) 3D-printed within a porous medium made of jammed hydrogel particles (gray). Each undulated cylinder requires ∼10 s to print, two orders of magnitude shorter than the duration between successive 3D confocal image stacks, ∼10 min. The surrounding medium fluidizes as cells are injected into the pore space, and then rapidly re-jams around the dense-packed cells. (B) Two-dimensional slice through the midplane of the population. The starting morphology of the 3D-printed population has undulation wavelength and amplitude , as defined by the undulated path traced out by the injection nozzle. The cells subsequently swim through the pores between hydrogel particles, with mean pore size . The population thereby migrates outward in a coherent front that eventually smooths; we track the radial position of the leading edge of the front and the undulation amplitude over time . (C–E) Bottom-up ( plane) projections of cellular fluorescence intensity measured using 3D confocal image stacks. Images show sections of three initially undulated populations in three different porous media, each at three different times (superimposed white, yellow, cyan), as the cells migrate radially outward. A pixel corresponds to approximately one cell, and the images only show a magnified view of the overall population. Panels (C) and (D) demonstrate the influence of varying the undulation wavelength, keeping the mean pore size the same; increasing slows smoothing. Panels (C) and (E) demonstrate the influence of varying the pore size, keeping the undulation wavelength the same; increasing hastens smoothing. (F) For each experiment shown in (C–E), the undulation amplitude , normalized by its initial value , decays exponentially with the time elapsed from the initiation of smoothing at . Fitting the data (symbols) with an exponential decay (red lines) yields the smoothing time for each experiment. (G) Smoothing time measured in experiments increases with increasing undulation wavelength and decreasing medium mean pore size , which enables cells to migrate more easily. Error bars reflect the uncertainty in determining the initiation time from the exponential fit of the data.
Figure 2
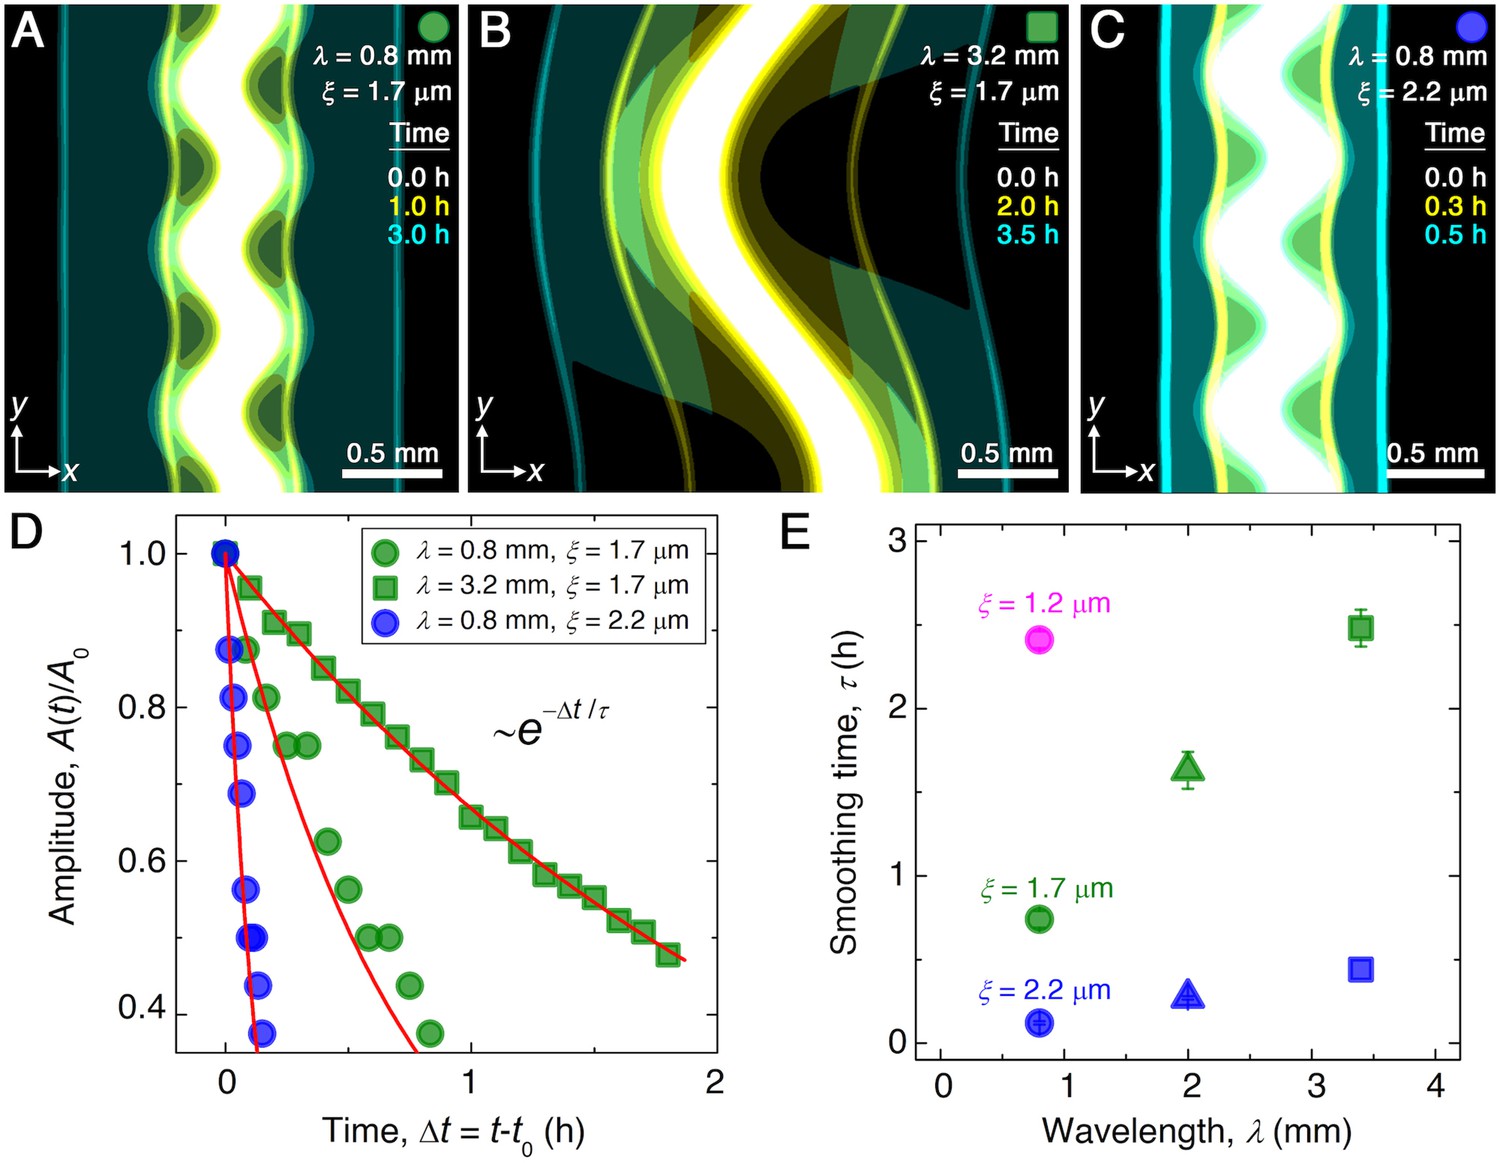
Continuum model captures the essential features of the smoothing of migrating bacterial populations.
(A–C) Simulations corresponding to experiments reported in Figure 1C and E, respectively, performed by numerically solving Equations 1 and 2 in two dimensions ( plane). Images show the calculated cellular signal (details in Materials and methods) for three initially undulated populations in three different porous media, each at three different times (superimposed white, yellow, cyan), as the cells migrate outward. Panels (A) and (B) demonstrate the influence of varying the undulation wavelength, keeping the mean pore size the same; as in the experiments, increasing slows smoothing. Panels (A) and (C) demonstrate the influence of varying the pore size, keeping the undulation wavelength the same; as in the experiments, increasing , incorporated in the model by using larger values of the diffusion and chemotactic coefficients as obtained directly from experiments, hastens smoothing. (D) For each simulation shown in (A–C), the undulation amplitude ,normalized by its initial value , decays exponentially with the time elapsed from the initiation of smoothing at as in the experiments. Fitting the data (symbols) with an exponential decay (red lines) again yields the smoothing time for each simulation. (E) Smoothing time obtained from the simulations increases with increasing undulation wavelength and decreasing medium mean pore size , as in the experiments. Error bars reflect the uncertainty in determining the initiation time from the exponential fit of the data.
Figure 3
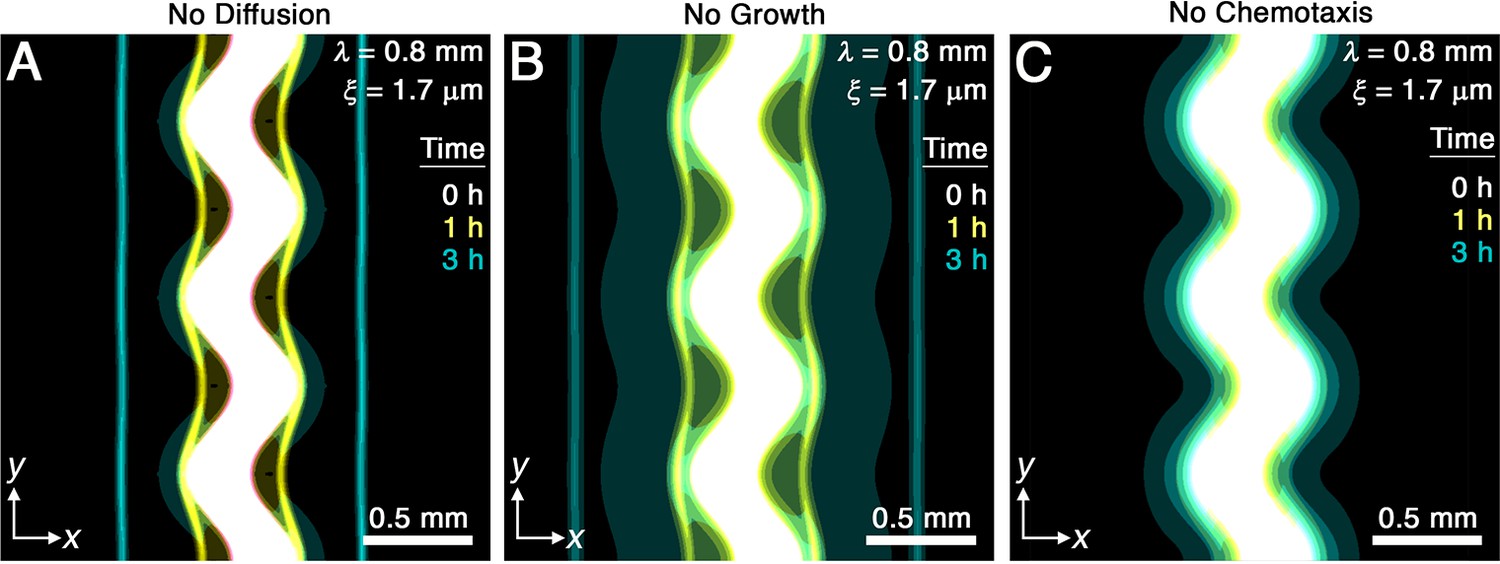
Chemotaxis is the primary driver of morphological smoothing.
Images show the same simulation as in Figure 2A, which serves as an exemplary case, but with either (A) diffusive cell motion, (B) cell proliferation, or (C) cell chemotaxis knocked out by setting the diffusivity , proliferation rate , or chemotactic coefficient to zero, respectively. Simulated bacterial fronts lacking diffusion or proliferation still smooth, as shown in (A, B), but simulated fronts lacking chemotaxis do not smooth, as shown in (C), demonstrating that chemotaxis is necessary and sufficient for the observed morphological smoothing.
Figure 4 with 3 supplements
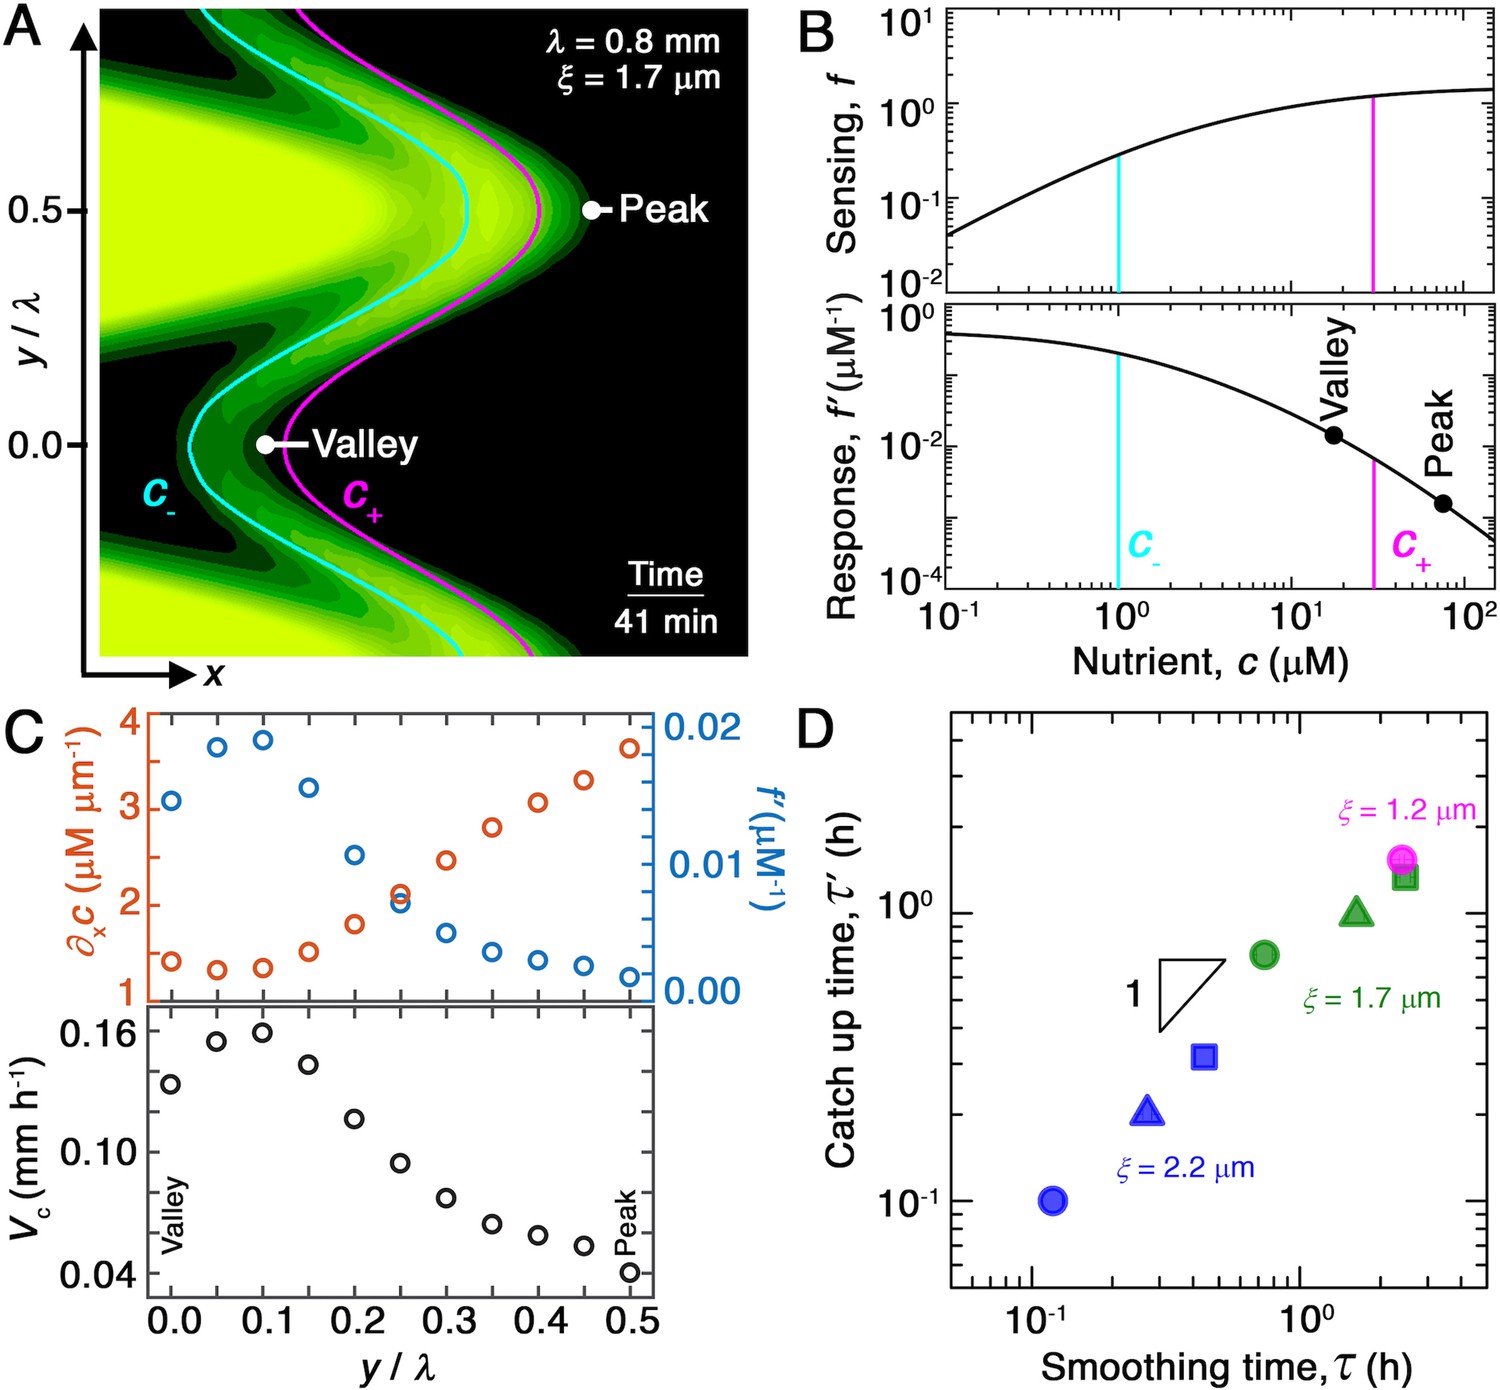
Chemotaxis alters the morphology of migrating bacterial fronts in two distinct ways.
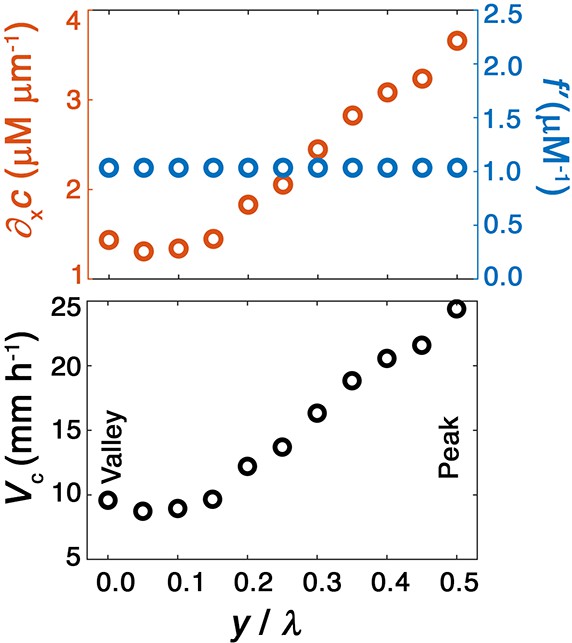
(A) Magnified view of a migrating bacterial front from the simulation shown in Figure 2A at time min as a representative example. To illustrate the spatially varying nutrient levels, we show the contours of constant nutrient concentration and in magenta and cyan, respectively; these represent characteristic upper and lower limits of sensing. The contours are spaced closer at the leading edge of the convex peak () than the concave valley (), indicating that the magnitude of the local nutrient gradient is larger at peaks than at valleys. The nutrient concentration itself, which increases monotonically with increasing , is also larger at the peak than at the valley. (B) Top and bottom panels show the variation of the nutrient sensing function and chemotactic response function , respectively, with nutrient concentration . Because sensing saturates at high nutrient concentrations, chemotactic response is weaker at higher (peaks) than at lower (valleys). (C) Top panel shows the component of the nutrient gradient (red, left axis) and the response function (blue, right axis), and bottom panel shows the component of the chemotactic velocity computed from these quantities, evaluated at different lateral positions along the leading edge of the front in (A). While the driving force of chemotaxis represented by is smaller at the valley, the chemotactic response is larger at the valley and dominates in setting : valleys move out faster than peaks, eventually catching up to them and smoothing out the undulations. (D) For all simulations (Figure 2E), the smoothing time determined by analyzing the decay of large-scale undulations (Figure 2D) is similar to the time needed for valleys to catch up to peaks estimated using their different -component chemotactic velocities. Note that we do not expect an exact match between and as they are related yet different quantities.
Figure 4—figure supplement 1

Effect of reduced sensing.
To investigate the influence of varying the upper limit of sensing , we repeat the simulation for the prototypical case of μm and mm but with lowered by a factor of 15. Consistent with our expectation, we find that reducing this upper limit weakens chemotactic response not just at the peaks, but also the valleys, thereby slowing smoothing. Image is presented as in Figure 2A.
Figure 4—figure supplement 2
Chemotactic smoothing requires a concave sensing function .
To illustrate the necessity of a concave sensing function with for chemotactic smoothing, we repeat our analysis but for a strictly linear with . In this case, the condition of concavity is violated: . We therefore expect chemotactic smoothing to not occur. Top panel shows the component of the nutrient gradient (red, left axis) and the response function (blue, right axis), and bottom panel shows the component of the chemotactic velocity computed from these quantities, evaluated at different lateral positions along the leading edge of the front for this case of a strictly linear sensing function. In this case, we find that the valleys no longer move faster than peaks—consistent with our expectation.
Figure 4—figure supplement 3
Convergence of the numerical simulations.
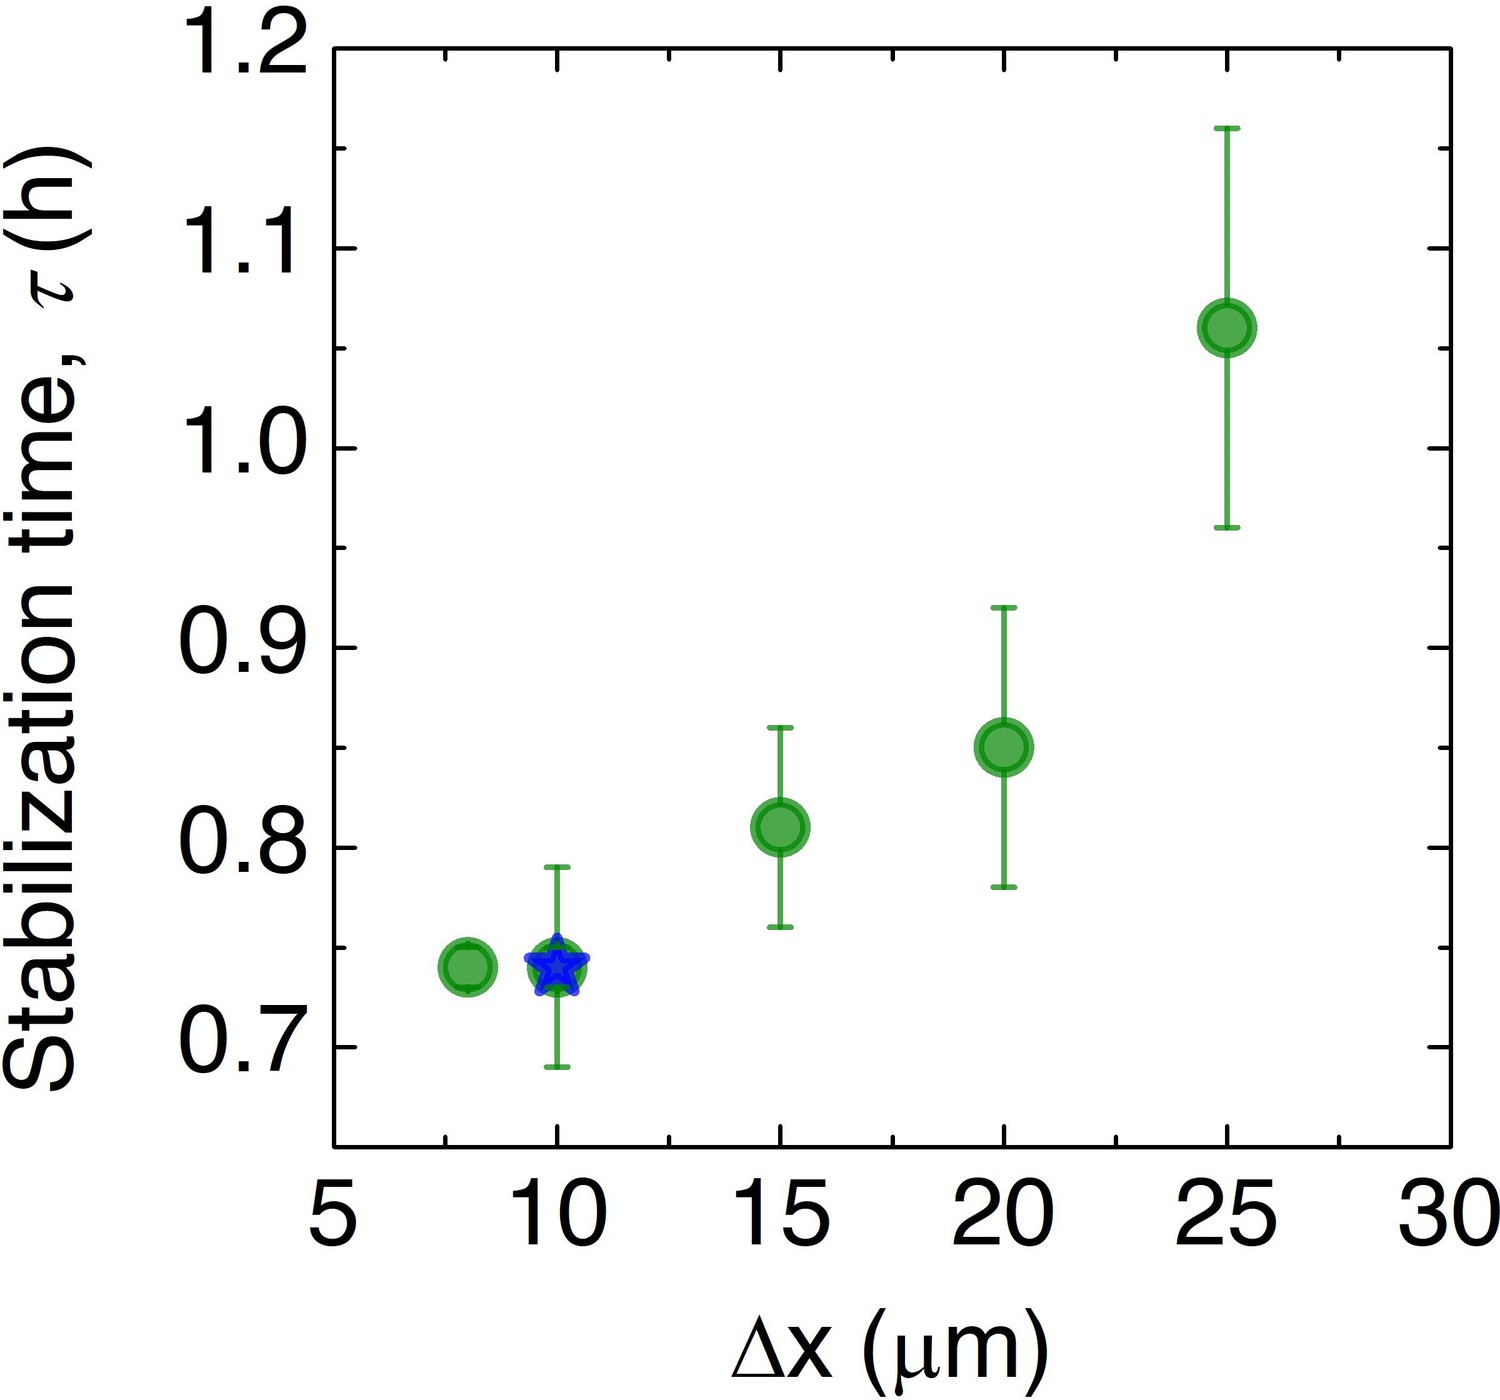
To assess the influence of discretization, we repeat the simulation for the prototypical case of μm and mm with different choices of the spatial discretization and measure the smoothing time . In all cases, we find qualitatively similar results, although the dynamics vary; however, as shown by the green data points, the dynamics do not appreciably change for discretization smaller than ≈ 10 μm, which is the value used in the main text simulations, as indicated by the blue star.
Author response image 1
Author response image 2
Videos
Video 1
Experiment probing chemotactic smoothing for mm, μm.
Video shows the maximum intensity fluorescence projection (bottom-up view) of migration from a 3D-printed undulated cylinder of closely packed E. coli. The cells collectively migrate outward in a front that autonomously smooths out the large-scale undulations as it continues to propagate.
Video 2
Experiment probing chemotactic smoothing for mm, μm.
Video shows the maximum intensity fluorescence projection (bottom-up view) of migration from a 3D-printed undulated cylinder of closely packed E. coli.
Video 3
Experiment probing chemotactic smoothing for mm, μm.
Video shows the maximum intensity fluorescence projection (bottom-up view) of migration from a 3D-printed undulated cylinder of closely packed E. coli.
Video 4
Simulation probing chemotactic smoothing for mm, μm.
Video shows the calculated cellular fluorescence signal of cells migrating from an undulated stripe of closely packed E. coli similar to Video 1. As in the experiments, the cells collectively migrate outward in a front that autonomously smooths out the large-scale undulations as it continues to propagate.
Video 5
Simulation probing chemotactic smoothing for mm, μm.
Video shows the calculated cellular fluorescence signal of cells migrating from an undulated stripe of closely packed E. coli similar to Video 2.
Video 6
Simulation probing chemotactic smoothing for mm, μm.
Video shows the calculated cellular fluorescence signal of cells migrating from an undulated stripe of closely packed E. coli similar to Video 3.
Video 7
Simulation probing the condition of lower initial overall nutrient concentration for mm, μm.
Video shows the calculated cellular fluorescence signal of cells failing to migrate as a front from an undulated stripe of closely packed E. coli with initial μM. To more clearly show the lack of front formation, in this visualization we neglect fluorescence signal loss that occurs when cells are oxygen depleted.
Additional files
Download links
A two-part list of links to download the article, or parts of the article, in various formats.
Downloads (link to download the article as PDF)
Open citations (links to open the citations from this article in various online reference manager services)
Cite this article (links to download the citations from this article in formats compatible with various reference manager tools)
Chemotactic smoothing of collective migration
eLife 11:e71226.
https://doi.org/10.7554/eLife.71226


