Desmosomal connectomics of all somatic muscles in an annelid larva
- Living Systems Institute, University of Exeter, United Kingdom
- Janelia Research Campus, United States
- kazmos GmbH, Germany
Figures
Figure 1 with 3 supplements
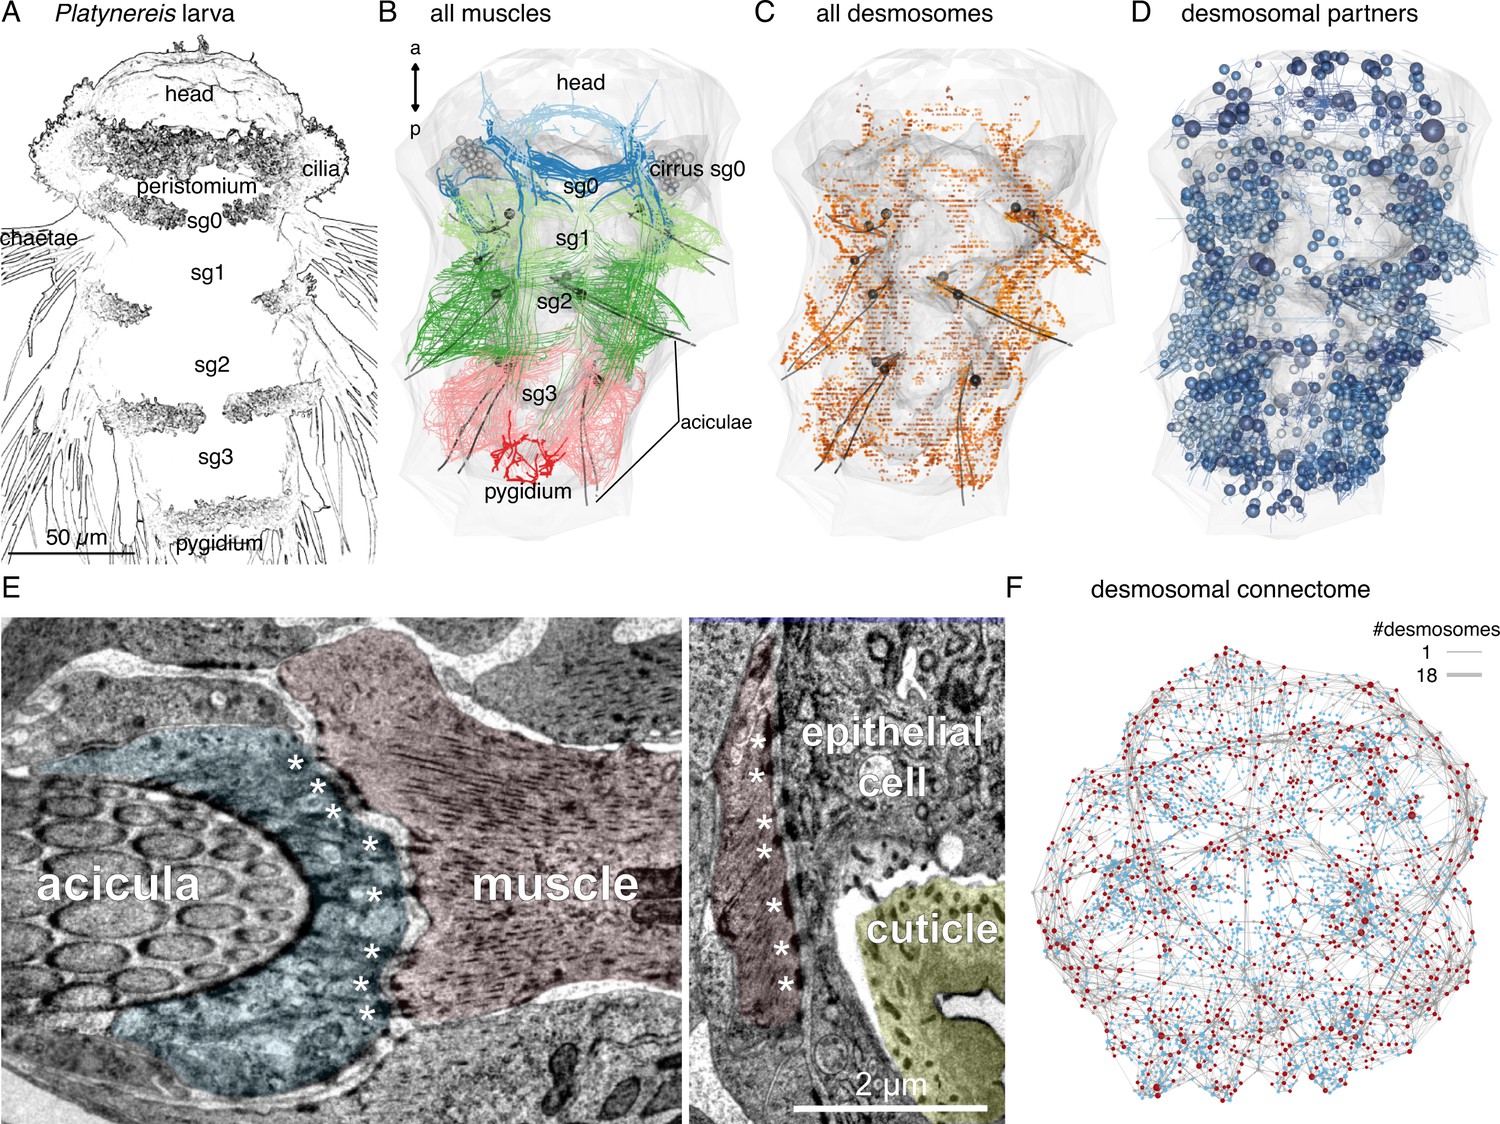
Whole-body desmosomal connectomics in the Platynereis larva.
(A) Stylised scanning electron micrograph of a 3-day-old Platynereis larva with the main body regions indicated. (B) Skeleton representation of the aciculae and all muscle cells in the larva, coloured by body segment. The position and size of the cell body of the aciculoblasts are shown as grey spheres. The developing tentacular cirri of the cryptic segment (segment 0) are also shown in grey for reference. Nucleus positions are not shown for the muscle cells. (C) Position of all annotated desmosomes and hemidesmosomes in the volume. Desmosomes and hemidesmosomes were annotated every 50 layers in the first round of annotations, hence the appearance of lines. (D) Skeletonised representations of all the cells that connect to muscle cells through desmosomes. Spheres represent position and size of cell nuclei. (E) Transmission electron micrographs showing examples of desmosomal muscle-attachment sites (indicated with asterisks) between muscles and an aciculoblast (left panel) or an epidermal cell (right panel). (F) Overview of the desmosomal connectome, comprising muscle cells and their desmosomal partners. Nodes represent single cells or basal lamina fragments (red, muscles; cyan, other cells; grey, basal lamina fragments), connections represent desmosomes and hemidesmosomes. Node size is proportional to the weighted degree of nodes. Edge thickness is proportional to the number of desmosomes. The graph is undirected. Panels A–D show ventral views. In B–D, the body outline and yolk outline are shown in grey. Abbreviations: sg0–3, segments 0–3. This figure can be reproduced by running the code/Figure1.R script from the Jasek_et_al GitHub repository (Jasek, 2022).
Figure 1—figure supplement 1
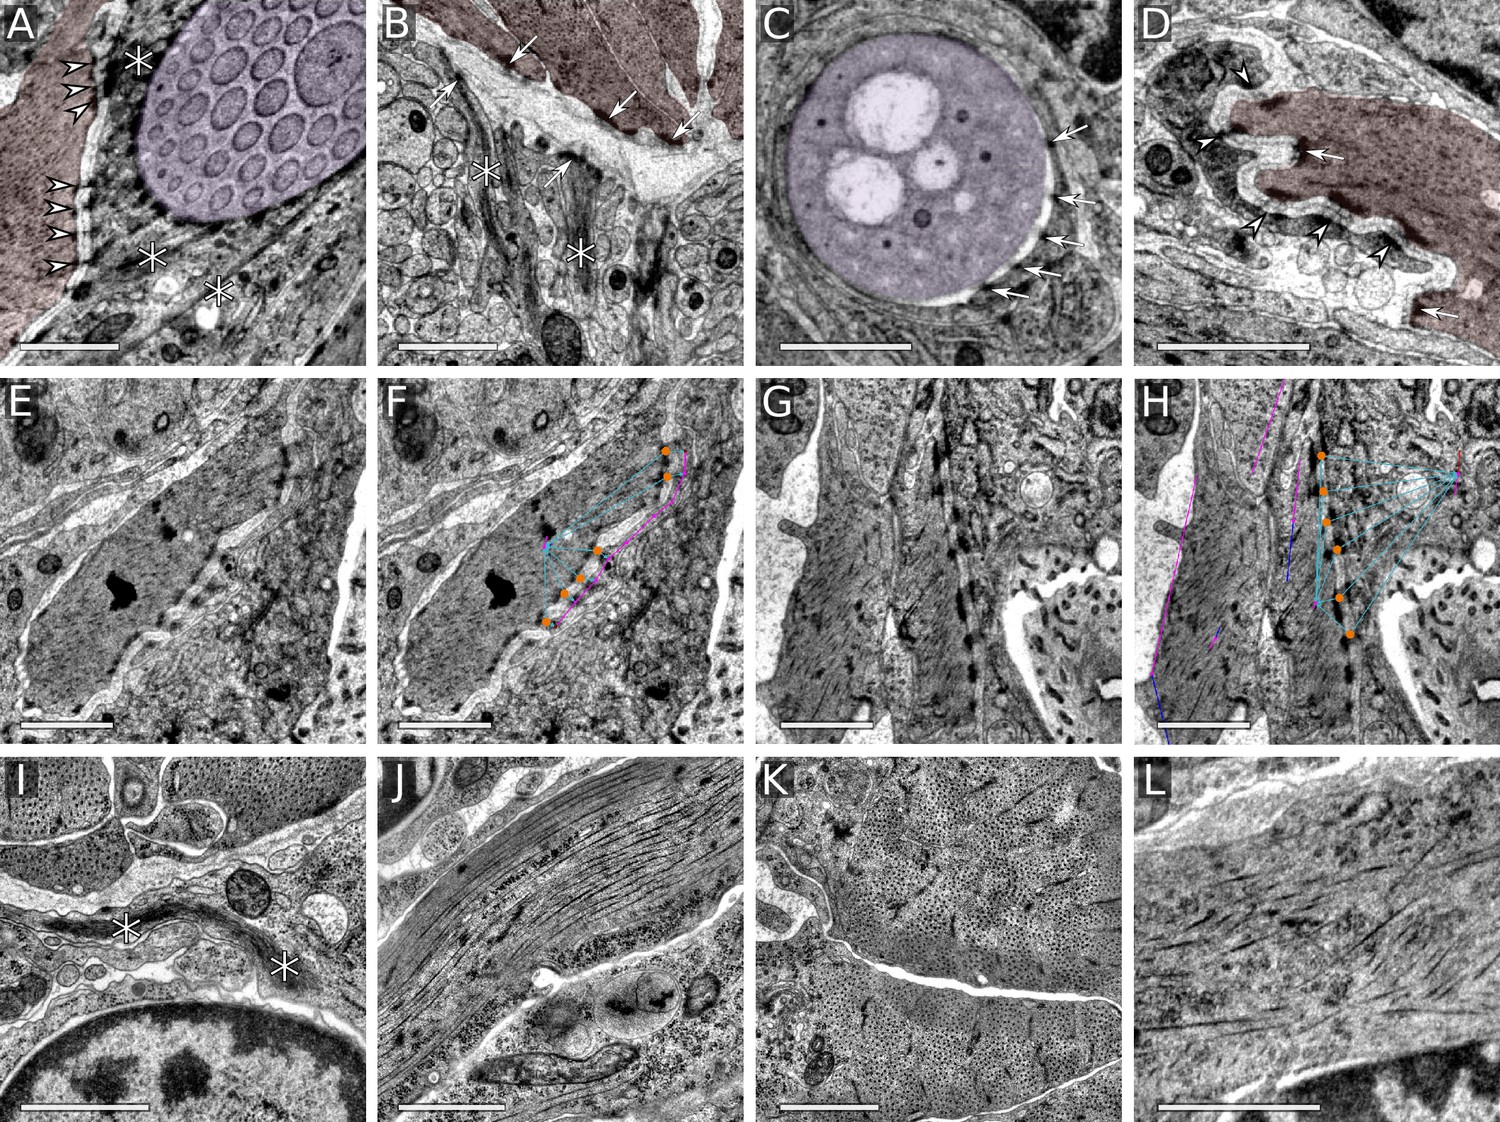
Desmosome and muscle ultrastructure.
(A) Desmosomes between aciculoblast and muscle cells. (B) Hemidesmosomes formed on the midline extracellular matrix by the axochord, the oblique muscles, and the midline cells. Tonofibrils connected to hemidesmosomes are visible in the midline cells. (C) Hemidesmosomes from an acicular follicle cell to an acicula. (D) Desmosomes between muscle and epidermal cells. (E–H) Muscle attachment to epidermal cells, with desmosomes marked with orange circles in CATMAID (F, H). (I) Tonofibrils in a midline cell. (J) Striated muscle, longitudinal cross-section. (K) Striated muscle, transverse section. (L) Smooth head muscle. Scale bars: 1 μm. Arrows mark hemidesmosomes, arrowheads desmosomes, and asterisks tonofibrils. In the top row, muscles are coloured in red and acicula in purple.
Figure 1—figure supplement 2
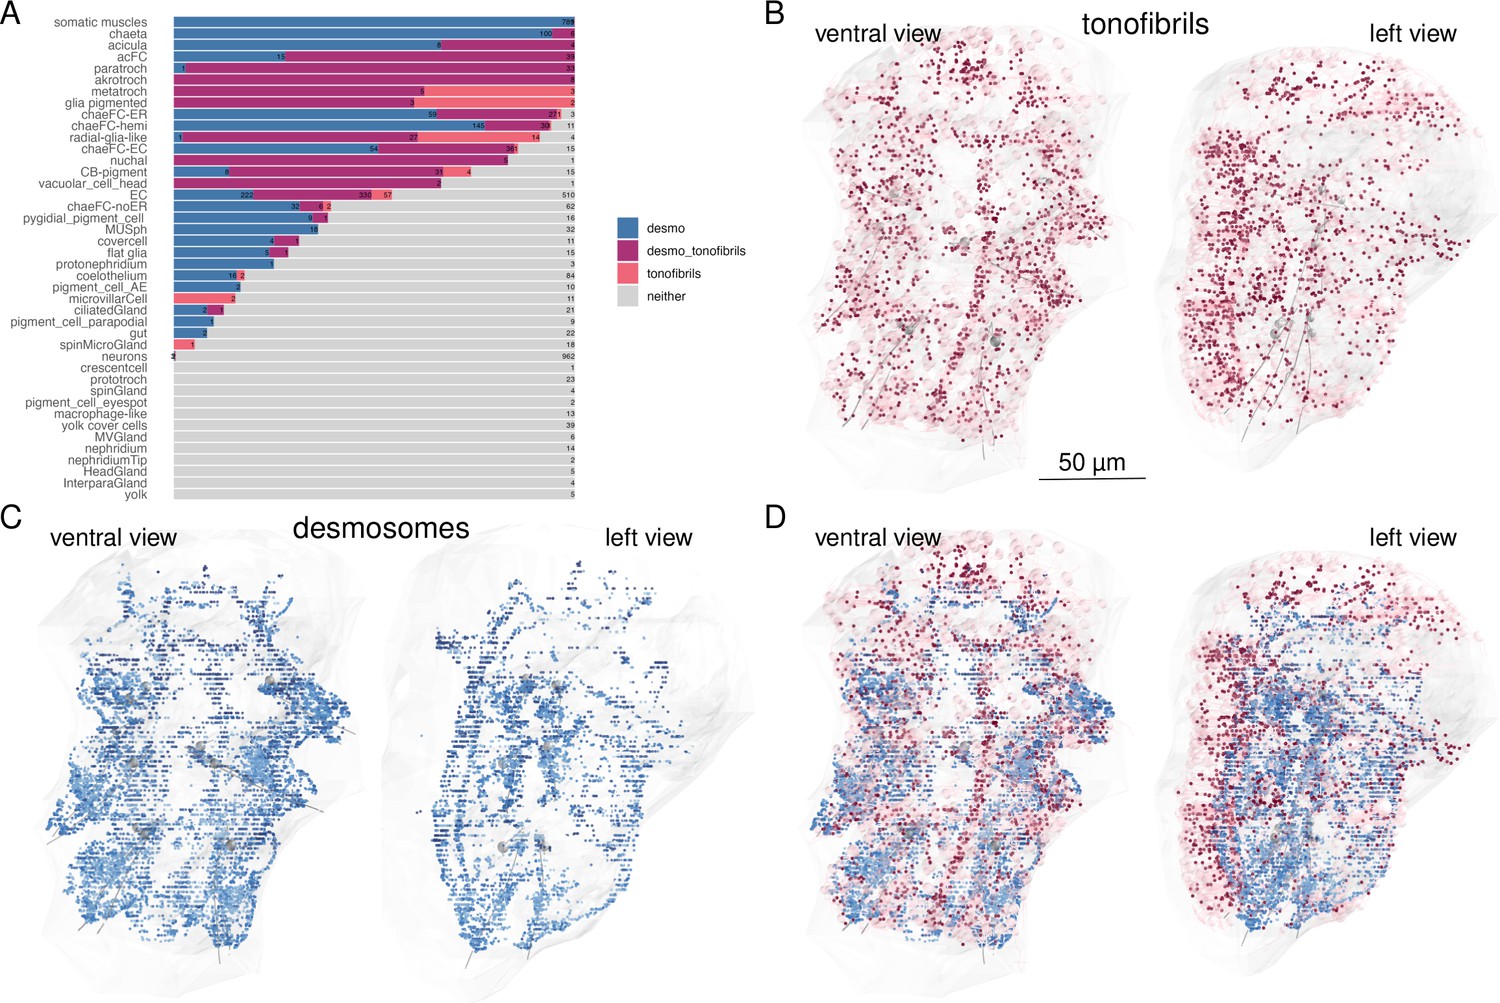
Cells containing desmosomes, tonofibrils, or both.
(A) Percentage of cells containing desmosomes, tonofibrils or, both, or neither, arranged by cell type. Bars represent the fraction of cells with desmosomes, tonofibrils, both or neither. The numbers show the total number of cells per category. Cells were counted as desmosome-containing if they had at least one desmosome connected to the skeleton and tonofibril-containing if they had at least one ‘black fibers’ tag. (B) Morphological rendering of cells containing tonofibrils. Cells annotated with ‘black fibers’ are shown in pink. The tonofibrils themselves were tagged with ‘black fibers’ to mark their exact location in the cells. The tags are depicted as red dots. (C) All desmosomes and hemidesmosomes. (D) Overlay of desmosomes and cells with tonofibrils. This figure can be reproduced by running the code/Figure1_figure_suppl2.R script (Jasek, 2022).
Figure 1—figure supplement 3

Morphological renderings of non-muscle components of the desmosomal connectome.
Aciculae and acicular follicle cells. (B) Chaetae and the four types of chaetal follicular cells. The region in the inset is shown in C. (C) Close-up of the left parapodium in the second segment with aciculae, chaetae, desmosomes (white), and follicular cells (nuclei not shown). Aciculae are approximately 60 µm long. (D) Ciliary band cells that have desmosomal contacts with muscles. (E) Epidermal cells that have desmosomal contacts with muscles. (F) Glial cells that have desmosomal contacts with muscles. (G) Pigment cells that have desmosomal contacts with muscles. (H) Basal lamina fragments that have desmosomal contacts either with muscles or other cells. This figure can be reproduced by running the code/Figure1_figure_suppl3.R script (Jasek, 2022).
Figure 2
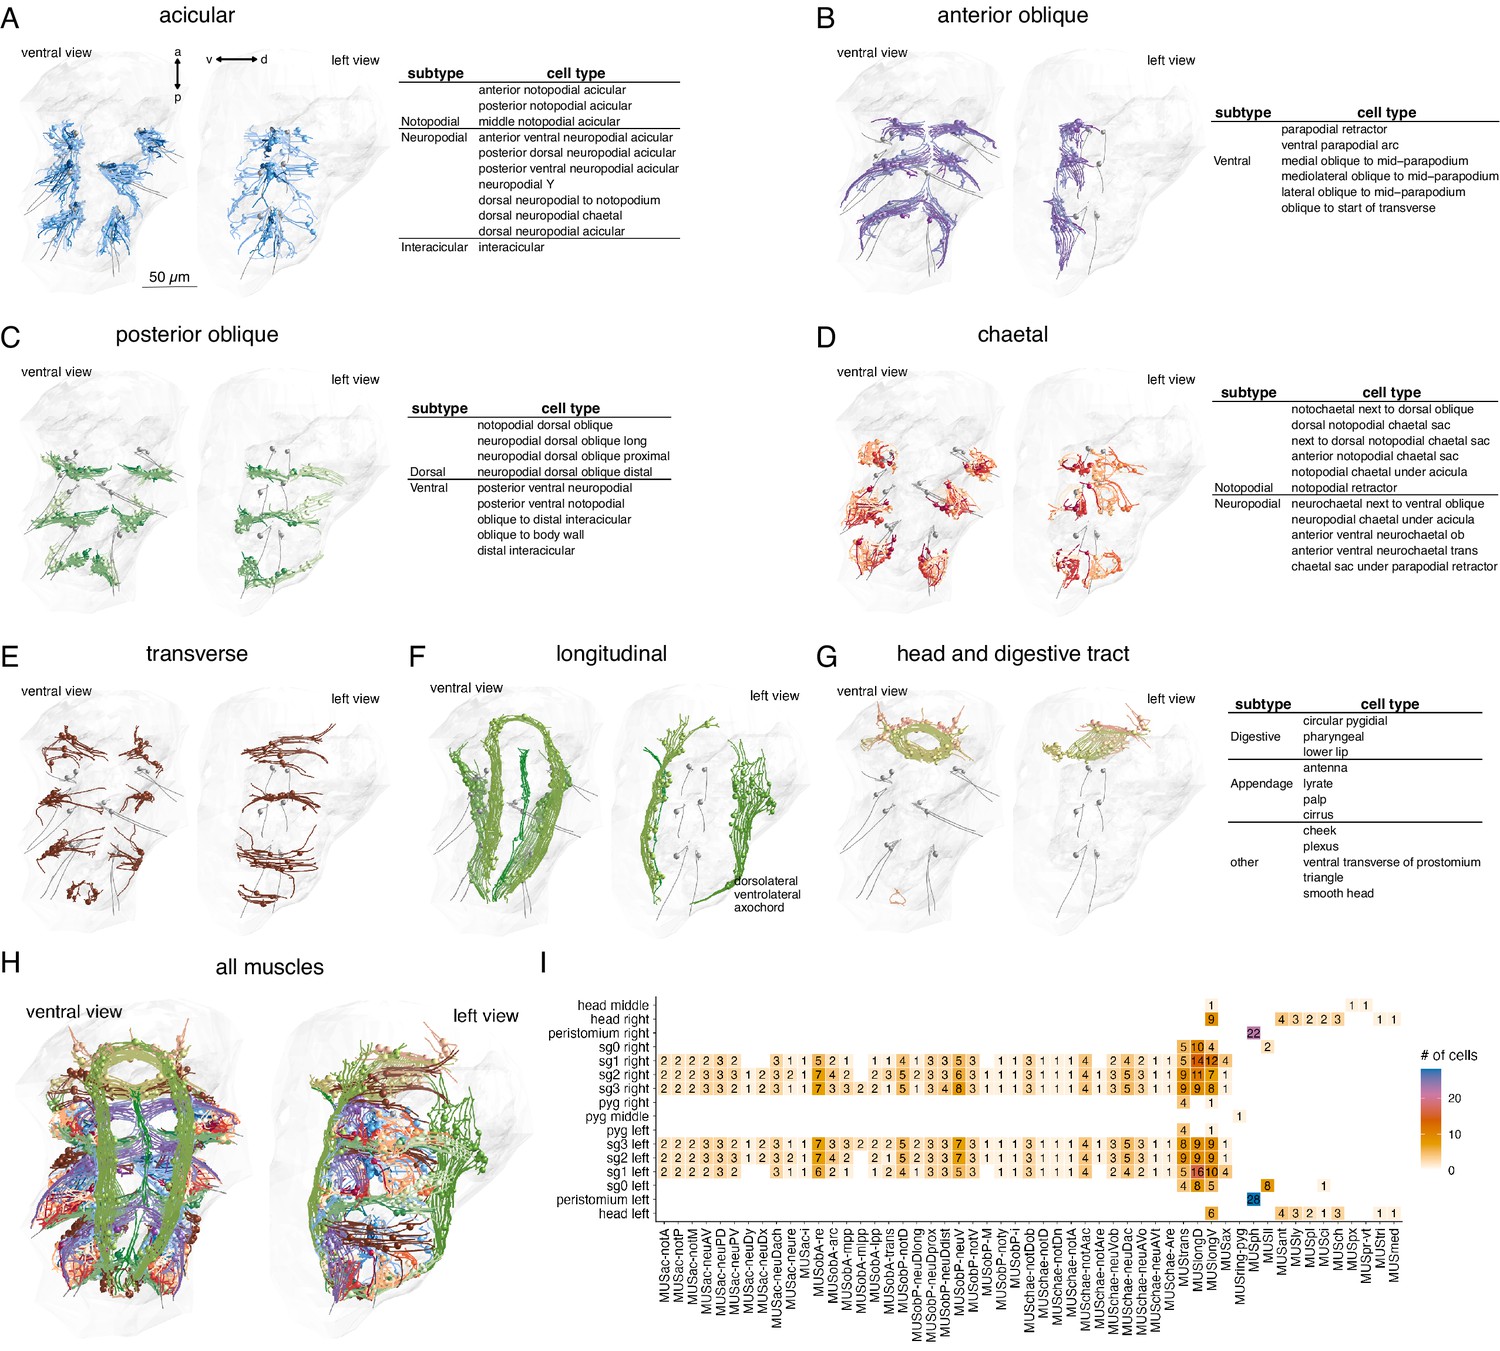
Classification and distribution of muscle cell types in the 3-day-old Platynereis larva.
(A) Morphological rendering of traced skeletons and soma position (spheres) of all acicular muscles. The table shows the cell-type classification of acicular muscles. (B) All anterior oblique muscles and their classification. (C) All posterior oblique muscles and their classification. (D) All chaetal muscles and their classification. (E) All transverse muscles (one type only). (F) All longitudinal muscles and their classification. (G) Muscles of the developing digestive system and the head and their classification. (H) All muscles, coloured by category. (I) Segmental and left–right distribution of all muscle cell types. Numbers indicate the number of cells per type and body region. The short names of the individual muscle types are based on composites of anatomical abbreviations (cf. panels A–G). Not, notopodial; neu, neuropodial; A, anterior; P, posterior; D, dorsal; V, ventral; ac, acicular; chae, chaetal; ob, oblique; trans, transverse; long, longitudinal. Full muscle names and their abbreviations are listed in Table 1. In A–H, the left panels are ventral views, the right panels lateral-left views. The body outline is shown in grey, aciculae are shown for segmental reference. This figure can be reproduced by running the code/Figure2.R script (Jasek, 2022).
-
Figure 2—source data 1
Source data for panel I listing the segmental and left–right distribution of all muscle cell types.
- https://cdn.elifesciences.org/articles/71231/elife-71231-fig2-data1-v2.csv
-
Figure 2—source data 2
All muscle skeletons as point clouds with tangent vectors (dotprop).
An R data source file (.RDS).
- https://cdn.elifesciences.org/articles/71231/elife-71231-fig2-data2-v2.zip
Figure 3 with 1 supplement
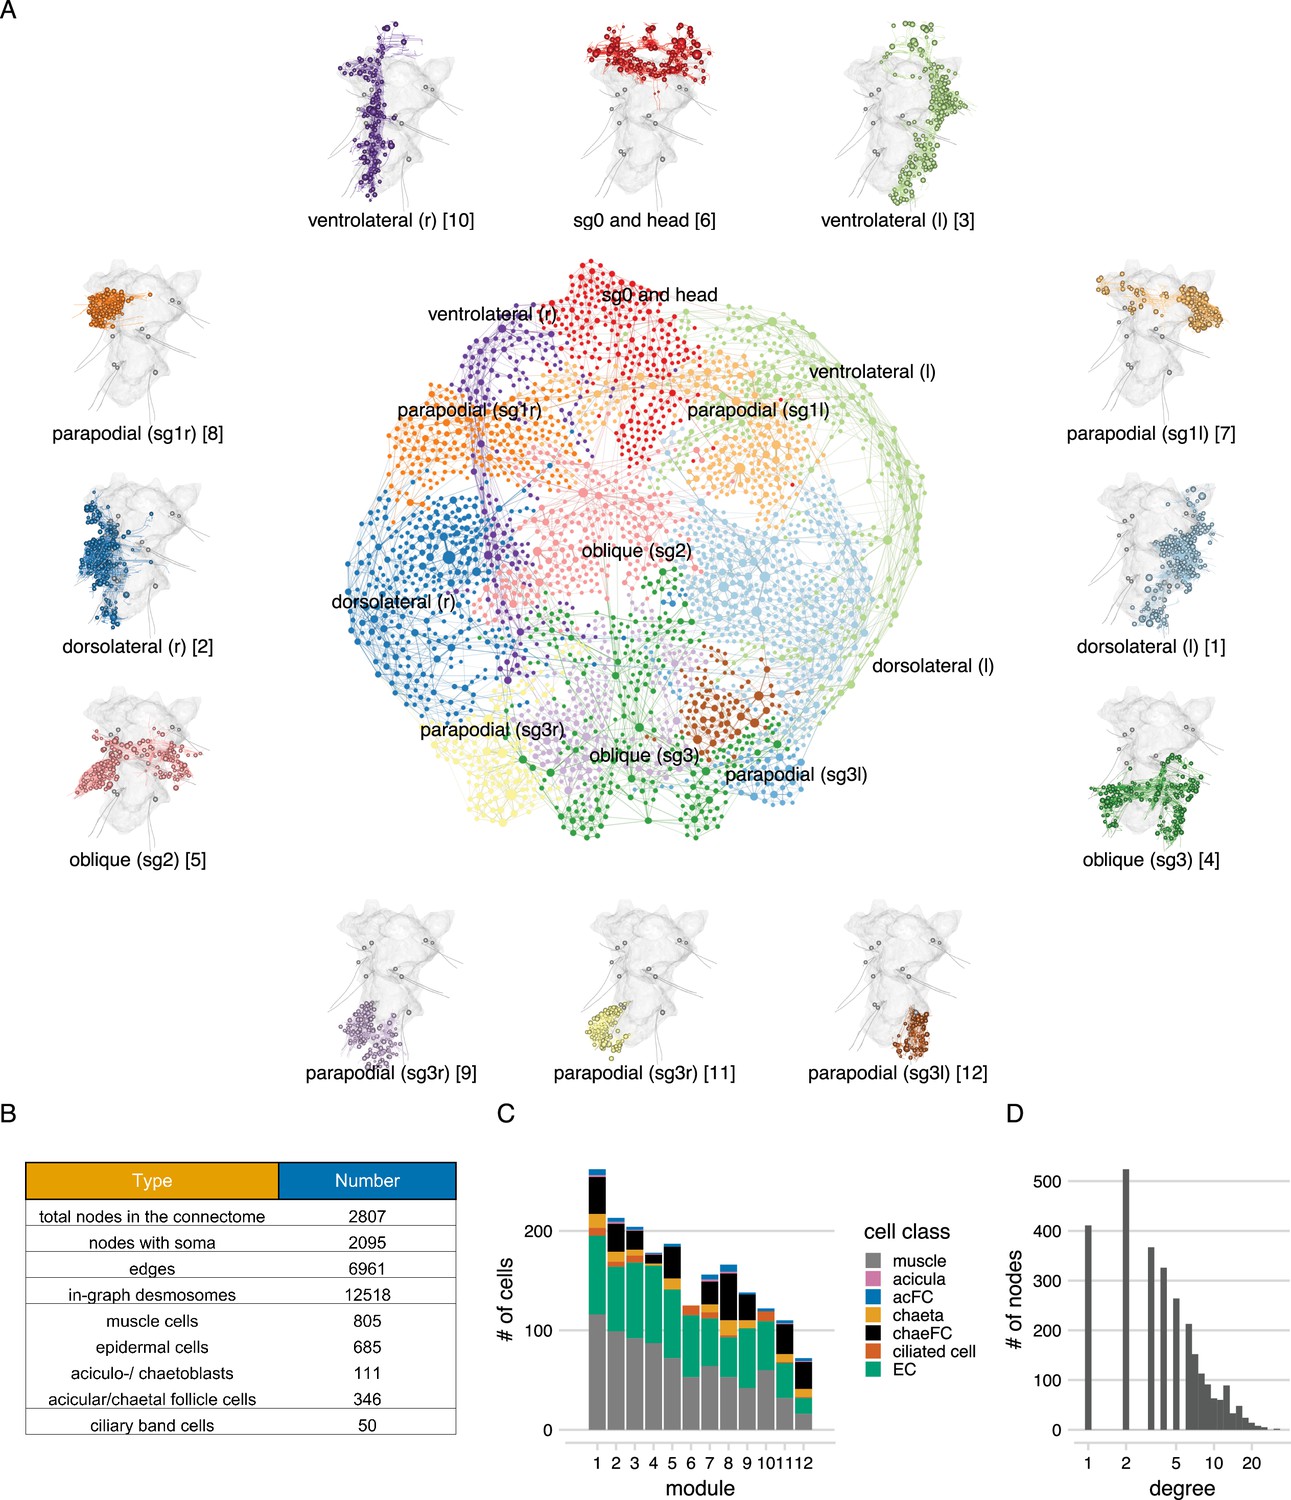
The desmosome connectome of the 3-day-old Platynereis larva.
(A) The desmosomal connectome coloured by Leiden modules. Nodes represent cells or basal lamina fragments and edges represent desmosomal connections. Node sizes are proportional to weighted degree (sum of all weighted connections). The graph layout was computed by a force-field-based method. Around the network graph, morphological renderings of the cells are shown for each module. Spheres show positions and sizes of nuclei. Grey meshes show the outline of the yolk. The 12 aciculae are shown for segmental reference. Numbers in square brackets after the module names show module id, ordered by module size. (B) Number of nodes, edges, and cells per main cell classes in the desmosomal connectome. (C) Number of cells in each module (ordered by module size) coloured by cell class. (D) Histogram of node degrees (number of connected nodes) for the desmosomal connectome. This figure can be reproduced by running the code/Figure3.R script (Jasek, 2022).
-
Figure 3—source data 1
The desmosomal connectome graph in igraph format.
- https://cdn.elifesciences.org/articles/71231/elife-71231-fig3-data1-v2.zip
-
Figure 3—source data 2
The desmosomal connectome graph in visNetwork format.
- https://cdn.elifesciences.org/articles/71231/elife-71231-fig3-data2-v2.txt
-
Figure 3—source data 3
The desmosomal connectome graph in html format.
- https://cdn.elifesciences.org/articles/71231/elife-71231-fig3-data3-v2.zip
Figure 3—figure supplement 1
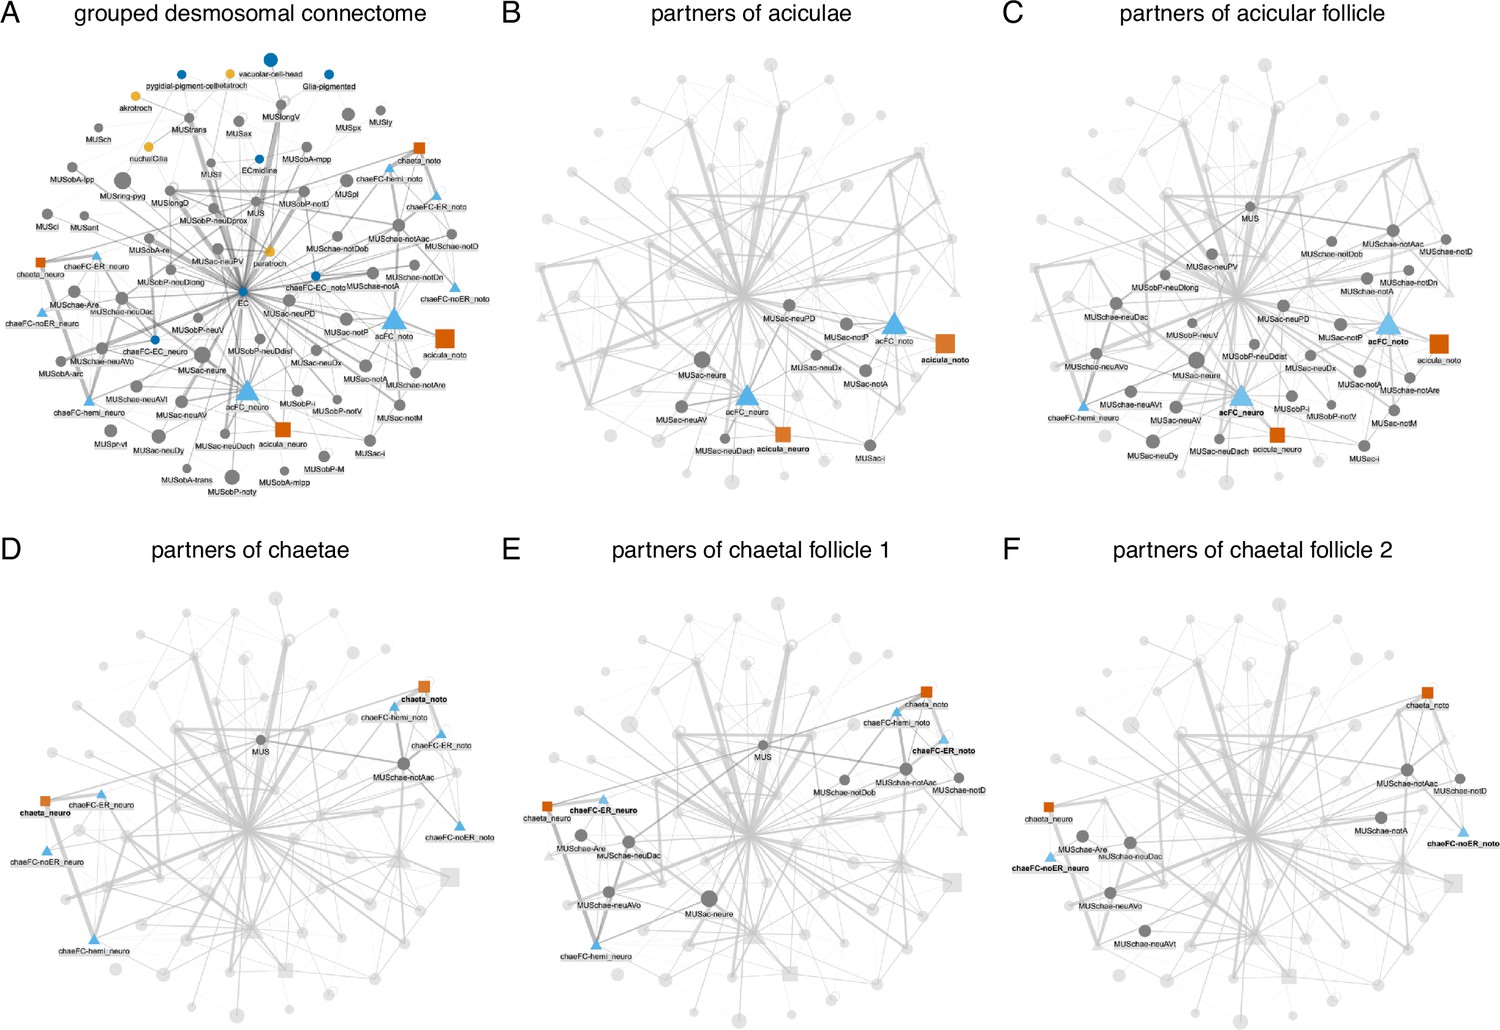
Grouped connectivity graph of the desmosomal connectome.
Nodes represent groups of cells grouped by cell type. Basal body and other fragments are not shown for clarity. Node size is proportional to degree, edge thickness to the square root of edge weight (sqrt values between 1 and 22). (A) The entire grouped connectivity graph. The same graph with all partners of the aciculae (B), acicular follicle (acFC) cells (C), chaetae (D), chaetal follicle 1 (chaeFC_ER) (E), and chaetal follicle 2 (chaeFC_noER) (F) cells highlighted. The aciculae, chaetae, and follicle cells are separated into notopodial and neuropodial groups.
-
Figure 3—figure supplement 1—source data 1
The grouped desmosomal connectome graph in visNetwork format.
- https://cdn.elifesciences.org/articles/71231/elife-71231-fig3-figsupp1-data1-v2.txt
-
Figure 3—figure supplement 1—source data 2
The grouped desmosomal connectome graph in html format.
- https://cdn.elifesciences.org/articles/71231/elife-71231-fig3-figsupp1-data2-v2.zip
Figure 4
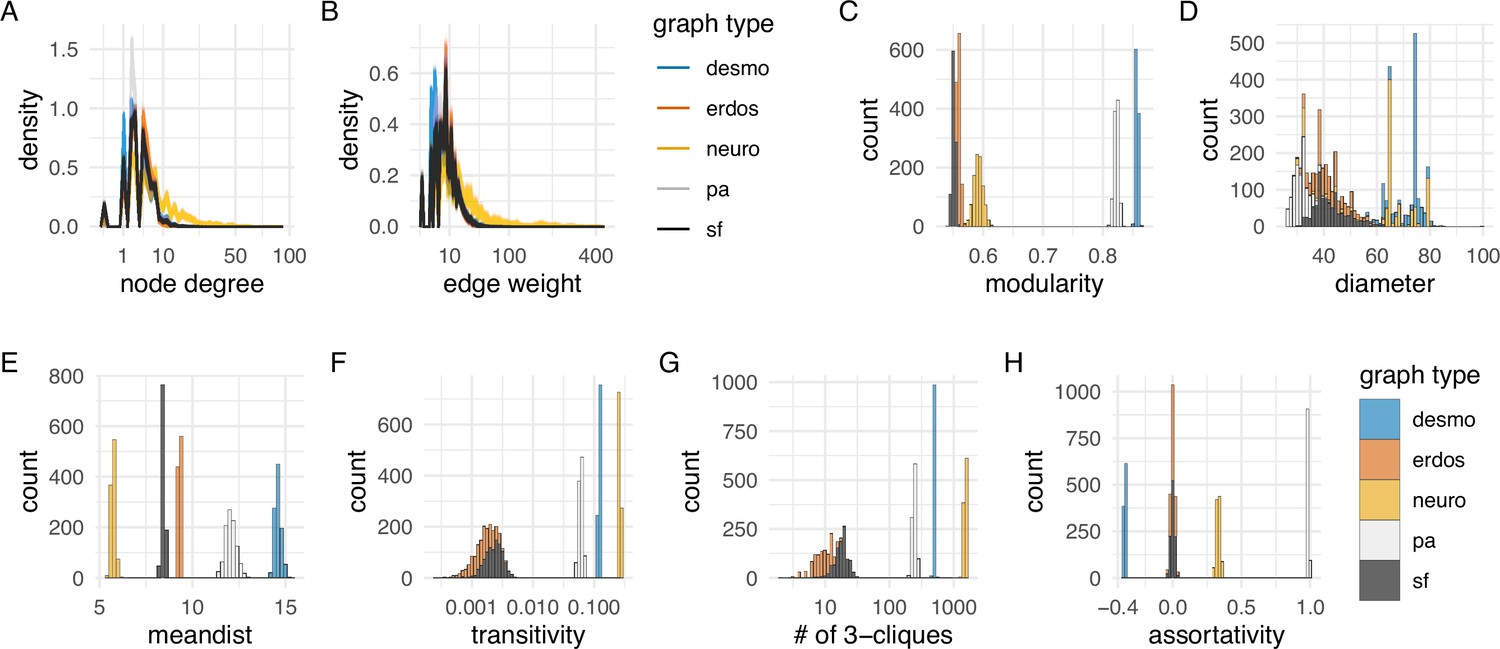
Network statistics of the desmosomal connectome relative to random graphs.
(A) Degree distribution and (B) edge-weight distribution of the desmosomal connectome compared to the synaptic (neuronal) connectome (neuro), scale-free (sf), Erdős-Rényi (erdos), and preferential-attachment (pa) graphs (1000 graphs each). (C) Modularity scores of 1000 weighted scale-free (sf), Erdős-Rényi, and preferential-attachment (pa) graphs relative to the weighted desmosomal and synaptic connectome graphs (1000 subsamples each). (D) Mean diameter scores of 1000 scale-free, Erdős-Rényi, and preferential-attachment graphs relative to the desmosomal and synaptic connectome graphs (1000 subsamples). (E) Mean distance and (F) transitivity (clustering coefficient) scores of 1000 weighted scale-free, Erdős-Rényi, and preferential-attachment graphs relative to the weighted desmosomal and synaptic connectome graphs (1000 subsamples each). (G) Number of 3-member cliques (triangles) and (H) assortativity coefficient. X axes are in sqrt scale for A, B and log10 scale for F, G. Abbreviations: desmo, desmosomal connectome; neuro, synaptic connectome; sf, scale-free; erdos, Erdős-Rényi; pa, preferential-attachment. This figure can be reproduced by running the code/Figure4.R script (Jasek, 2022).
-
Figure 4—source data 1
Network statistics for the 1,000 simulated scale-free, Erdős-Rényi, preferential-attachment graphs and the 1000 subsampled desmosomal connectome and synaptic connectome graphs.
- https://cdn.elifesciences.org/articles/71231/elife-71231-fig4-data1-v2.txt
Figure 5
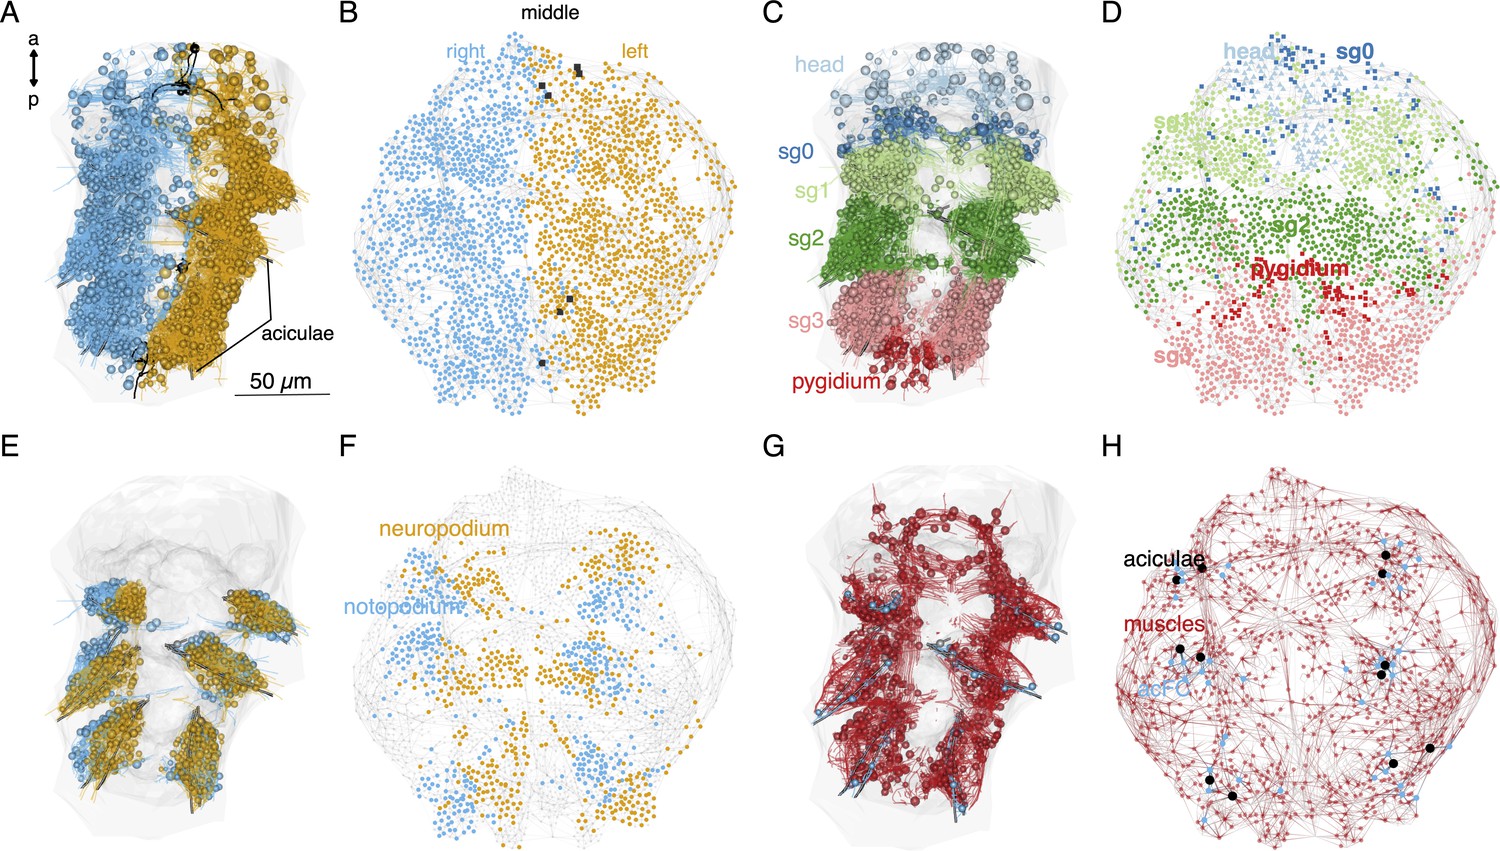
Local connectivity of the desmosomal connectome.
(A) Morphological rendering of cells of the desmosomal connectome in the midline (black) and on the right (cyan) and left (orange) side of the body. (B) The same cells in the force-field-based layout of the graph, coloured by the same colour scheme. (C) Morphological rendering of cells of the desmosomal connectome coloured by body region (head, segments 0–3 and pygidium). (D) The same cells in the force-field-based layout of the graph, coloured by the same colour scheme. (E) Morphological rendering of cells of the desmosomal connectome in the neuropodia (orange) and notopodia (cyan). (F) The same cells in the force-field-based layout of the graph, coloured by the same colour scheme. (G) Morphological rendering of muscle cells (red), aciculae (black), and acicular follicle (acFC) cells (cyan). (H) The same cells in the force-field-based layout of the graph, coloured by the same colour scheme. Spheres in the morphological rendering represent the position and size of cell nuclei. Nodes in the connectivity graphs represent cells with their sizes proportional to weighted degree. This figure can be reproduced by running the code/Figure5.R script (Jasek, 2022). An interactive html version of the graph with node labels is in the GitHub repository supplements/Fig5_desmo_connectome_seg_interactive.html.
Figure 6 with 4 supplements
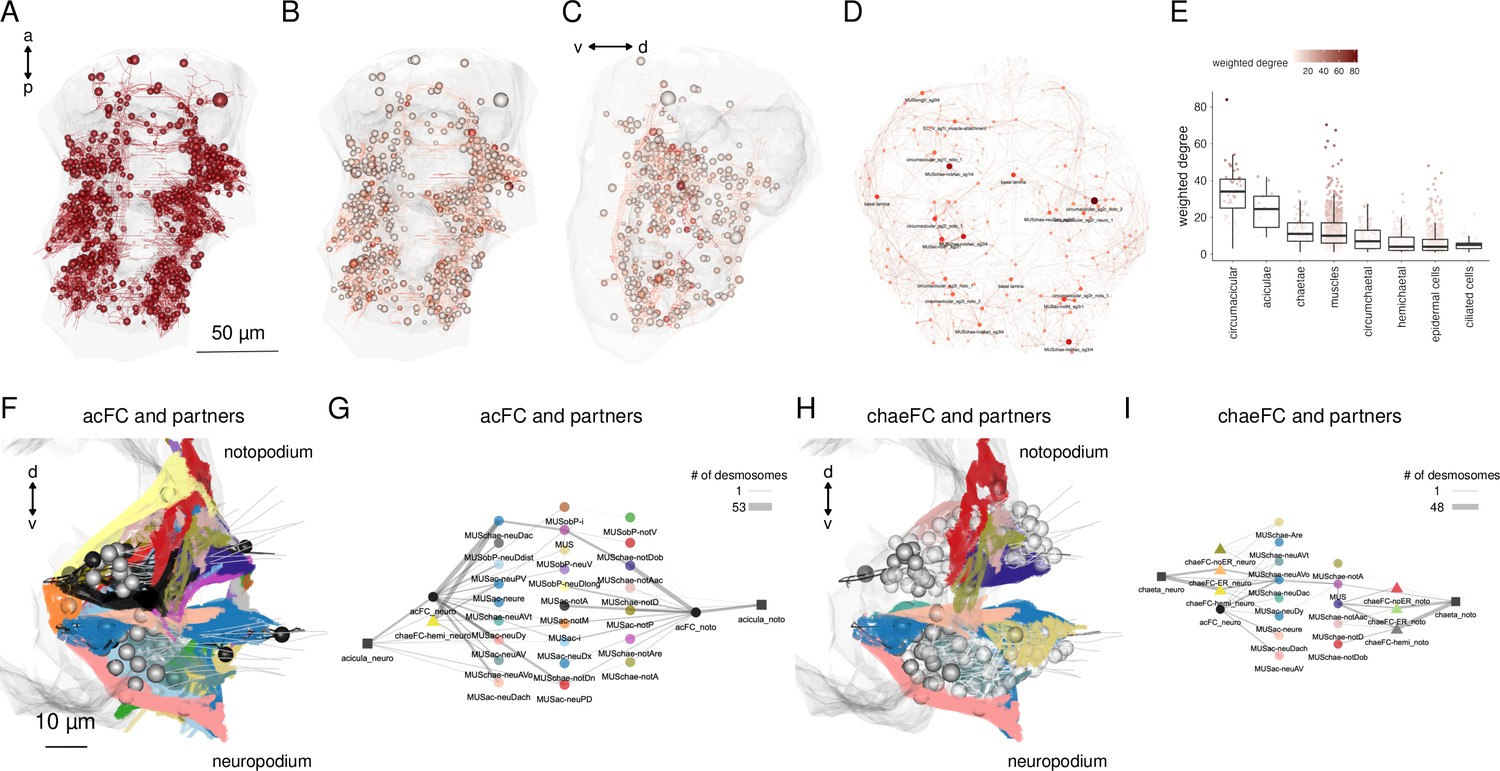
Cell-type diversity and connectivity of the parapodial muscle complex.
(A) Morphological rendering of all cells of the desmosomal connectome with a weighted degree >10. (B) Same cells coloured with a colour scale proportional to the cell’s weighted degree, ventral and (C) lateral views. (D) The desmosomal connectome with node-colour intensity and node size proportional to node weighted degree. (E) Weighted degree of the most highly connected cells in the desmosomal connectome, arranged by cell class. Colour scale in E also applies to B–D. (F) Morphological rendering of the outlines of muscle cell types that directly connect through desmosomes to the acicular follicle cells. Anterior view of a transverse section showing neuro- and notopodia in the left side of the second segment. (G) Desmosomal connectivity graph of acicular follicle cells and their partners. Nodes represent groups of cells of the same cell type. Aciculae and acicular follicle cells are separated into neuropodial and notopodial groups. (H) Morphological rendering of the outlines of muscle cell types that directly connect through desmosomes to the chaetal follicle cells. Anterior view of a transverse section showing neuro- and notopodia in the left side of the second segment. (I) Desmosomal connectivity graph of chaetal follicle cells and their partners. Nodes represent groups of cells of the same cell type. Chaetae and chaetal follicle cells are separated into neuropodial and notopodial groups. Edge thickness is proportional to the number of desmosomes connecting two cell groups. This figure can be reproduced by the code/Figure6.R script (Jasek, 2022).
-
Figure 6—source data 1
Source data for panel E of Figure 6.
Text file listing weighted degree values for the most highly connected cells in the desmosomal connectome, arranged by cell class.
- https://cdn.elifesciences.org/articles/71231/elife-71231-fig6-data1-v2.txt
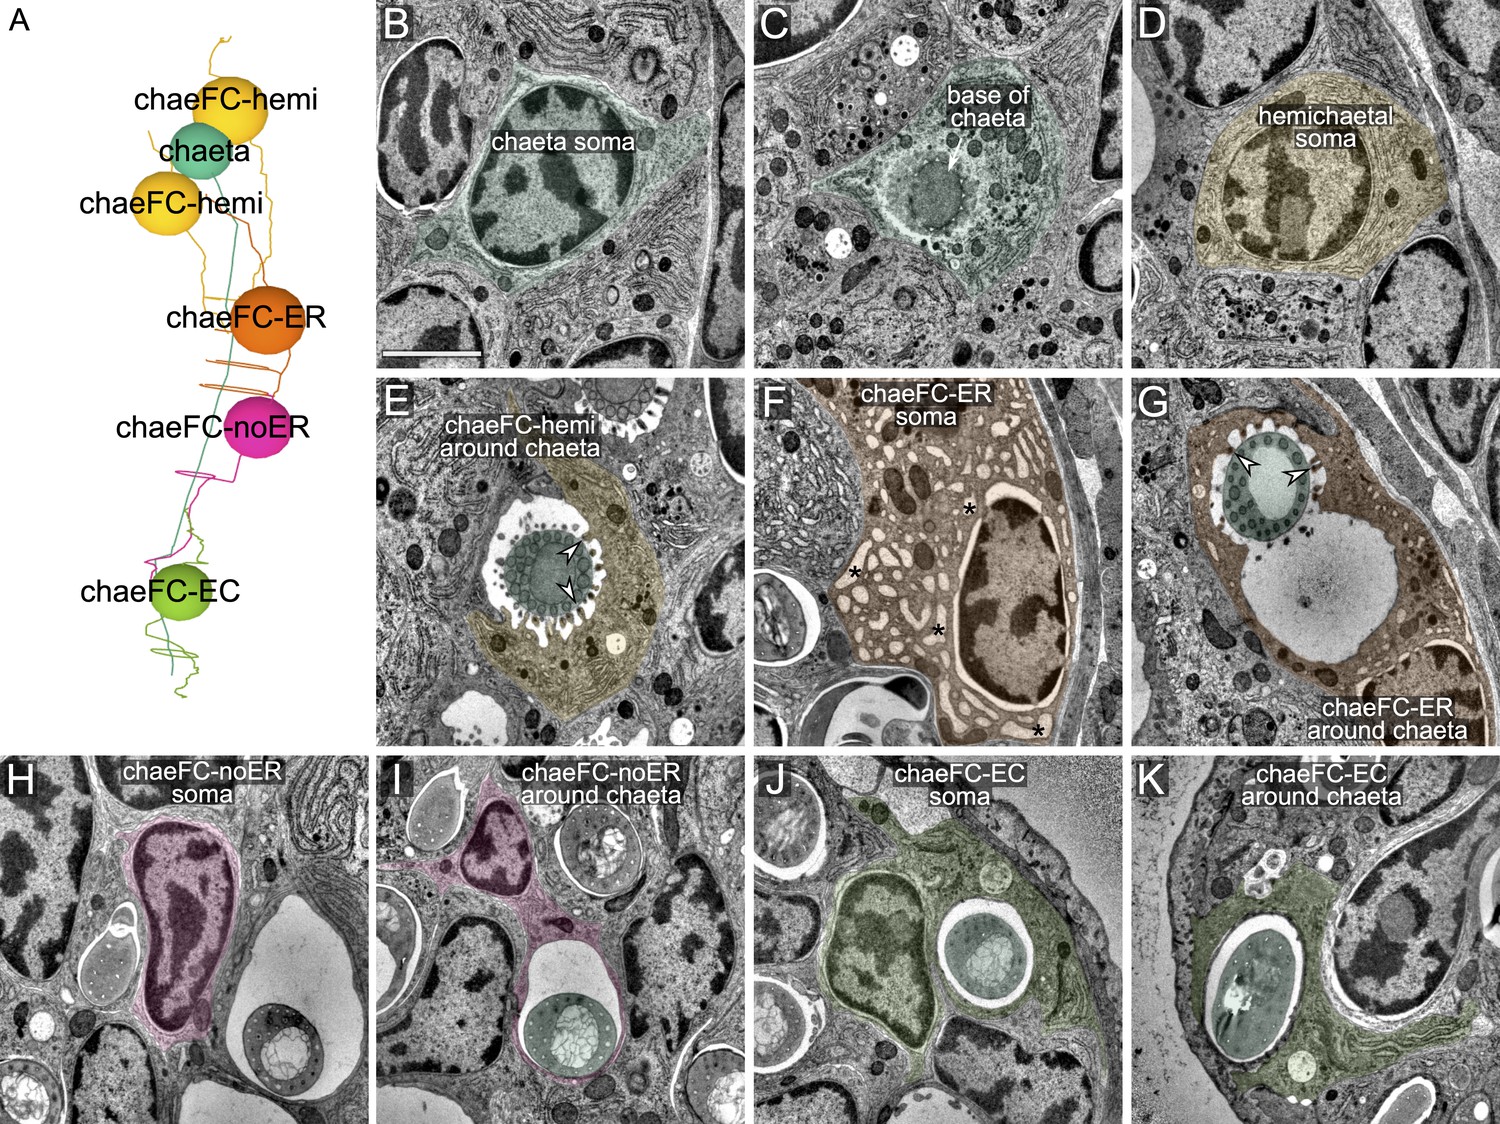
Figure 6—figure supplement 1
Ultrastructure of chaetal sac cells.
(A) Soma positions of chaetoblast and follicle cells. Each chaeta, growing from a chaetoblast cell is accompanied by two chaeFC-hemi, one chaeFC-ER, one chaeFC-noER, and one chaeFC-EC cell. (B) TEM image of the soma of a chaetoblast. (C) Chaetoblast at the base of the chaeta. (D) Soma of a chaeFC-hemi cell. (E) chaeFC-hemi cell surrounding a chaeta from one side. Arrowheads mark microvilli with hemidesmosomes that connect to the chaeta. (F) Soma of an chaeFC-ER cell with its characteristic vacuolar ER. The ER lumen has the characteristic vacuolar shape only in the region where the hollow part of the chaeta (proximal to the joint) is forming. (G) chaeFC-ER cell surrounding a chaeta. Arrowheads mark microvilli with hemidesmosomes that connect to the chaeta. (H) Soma of a chaeFC-noER cell with very little ER. (I) A chaeFC-noER cell surrounding a chaeta, no microvilli are present. (J) Soma of an chaeFC-EC (epidermal chaetal follicle) cell. (K) chaeFC-EC surrounding a chaeta, no microvilli are present. Scale bar: 1 μm for all panels.
Figure 6—figure supplement 2
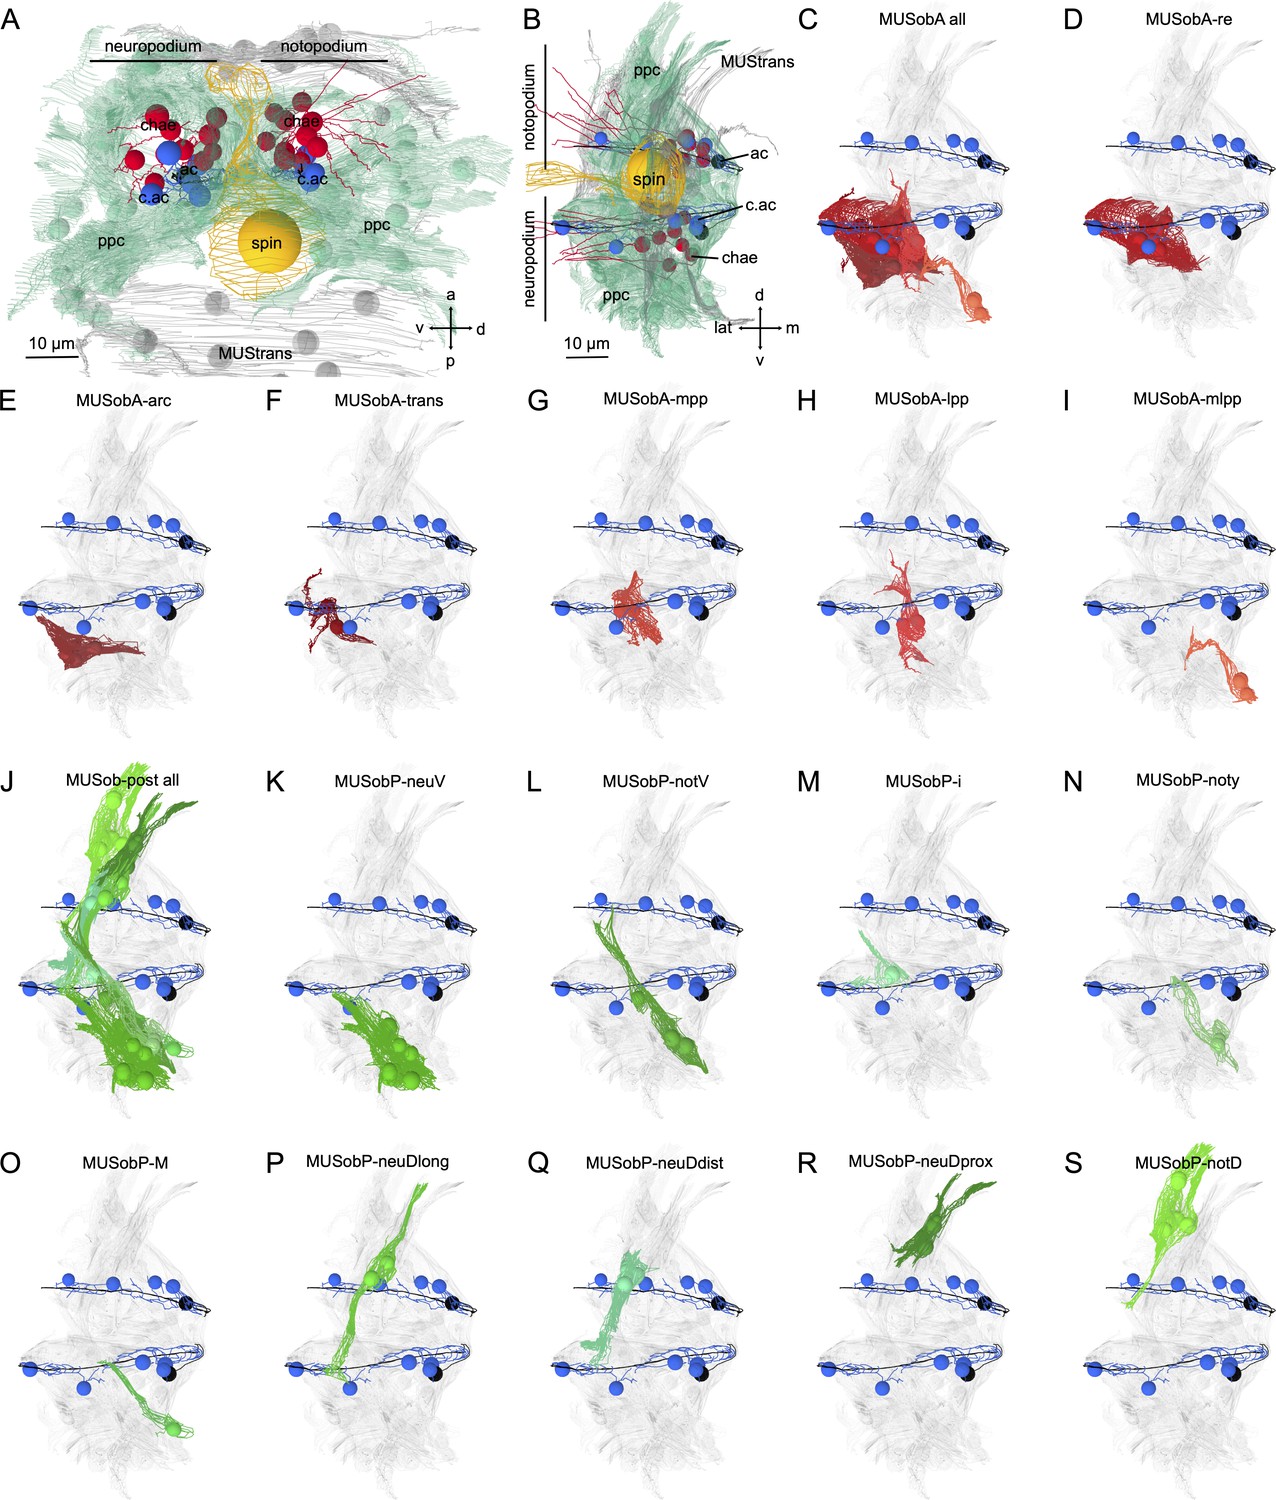
Morphological renderings of oblique muscles.
(A) Lateral and (B) posterior views of a parapodium (second segment, left side) with a neuropodial and notopodial lobe and a spinning gland. (C) All anterior oblique muscles. Outline of (D) MUSobA-re, (E) MUSobA-arc, (F) MUSobA-trans, (G) MUSobA-mpp, (H) MUSobA-mpp, and (I) MUSobA-mmpp muscles. (J) All posterior oblique muscles. Outline of (K) MUSobP-neuV, (L) MUSobP-notV, (M) MUSobP-i, (N) MUSobP-noty, (O) MUSob-postM, (P) MUSobP-neuDlong, (Q) MUSobP-neuDdist, (R) MUSobP-neuDprox, and (S) MUSobP-notD muscles. The aciculae (black) and acicular follicle cells (blue) are shown for reference. Directions: a – anterior, p – posterior, v – ventral, d – dorsal, m – medial, lat – lateral, ac – acicula, acFC – acicular follicle, chae – chaetae, ppc – parapodial complex, spin – spinning gland.
Figure 6—figure supplement 3
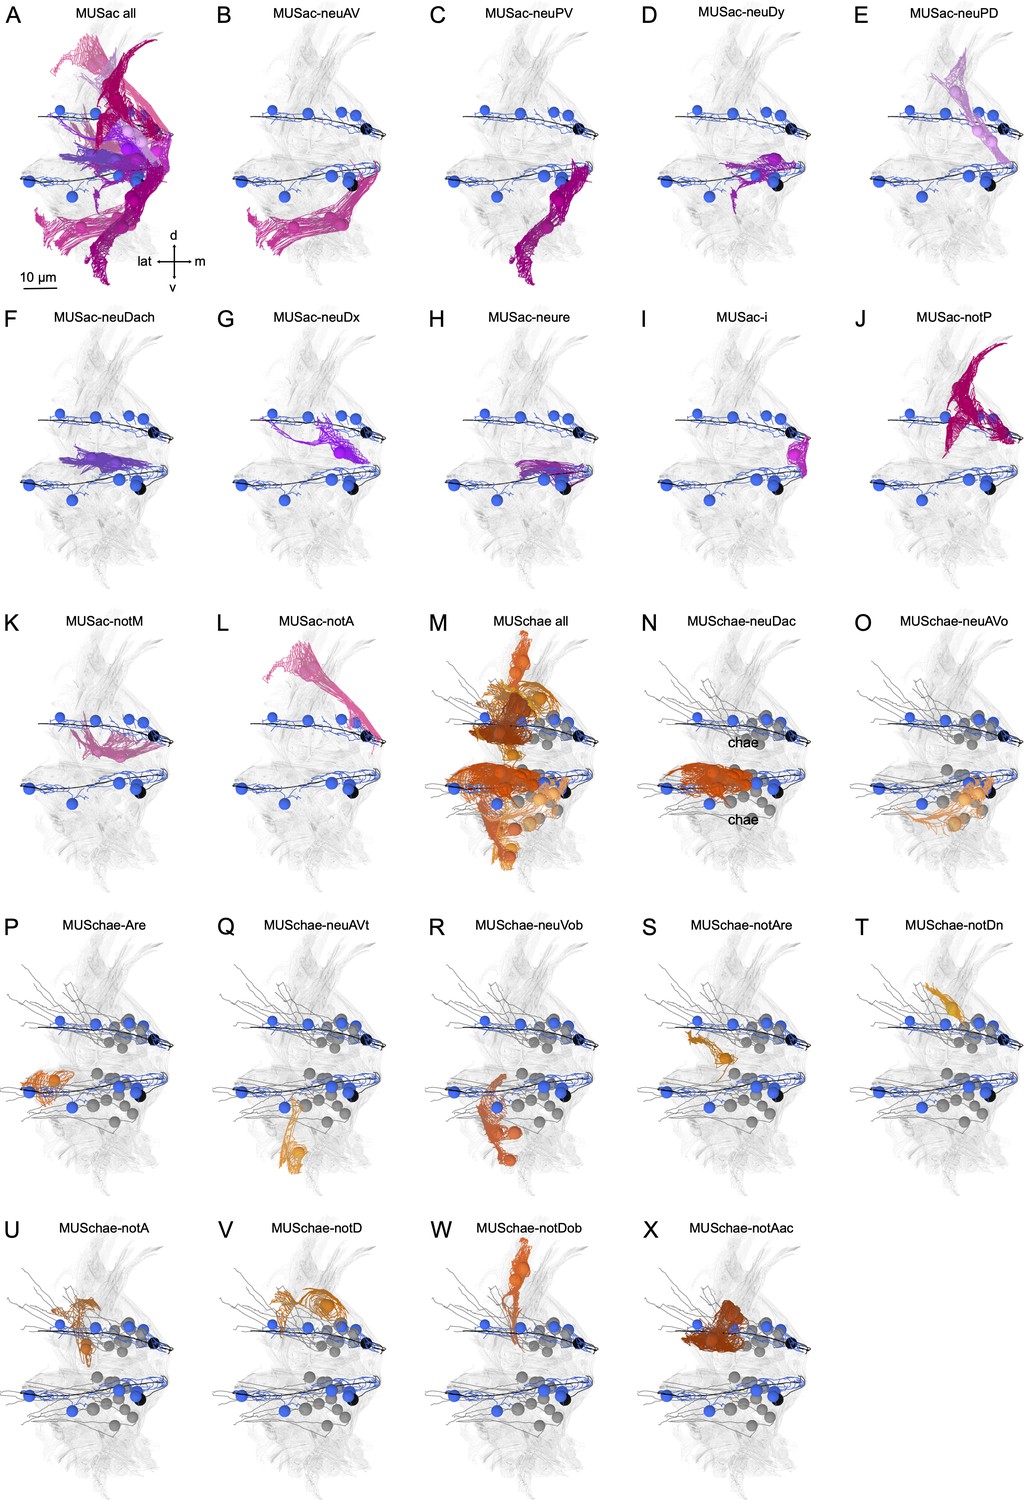
Morphological renderings of acicular and chaetal muscles.
(A) Posterior view of a parapodium (second segment, left side) with all acicular muscles shown. (B) Outline of MUSac-neuAV, (C) MUSac-neuPV, (D) MUSac-neuDy, (E) MUSac-neuPD, (F) MUSac-neuDach, (G) MUSac-neuDx, (H) MUSac-neure, (I) MUSac-i, (J) MUSac-notP, (K) MUSac-notM, and (L) MUSac-notA muscles. (M) All chaetal muscles. Outline of (N) MUSchae-neuDac, (O) MUSchae-neuAVo, (P) MUSchae-neuAre, (Q) MUSchae-neuAVt, (R) MUSchae-neuVob, (S) MUSchae-notAre, (T) MUSchae-notDn, (U) MUSchae-notA, (V) MUSchae-notD, (W) MUSchae-notDob, and (X) MUSchae-notAc muscles.
Figure 6—figure supplement 4
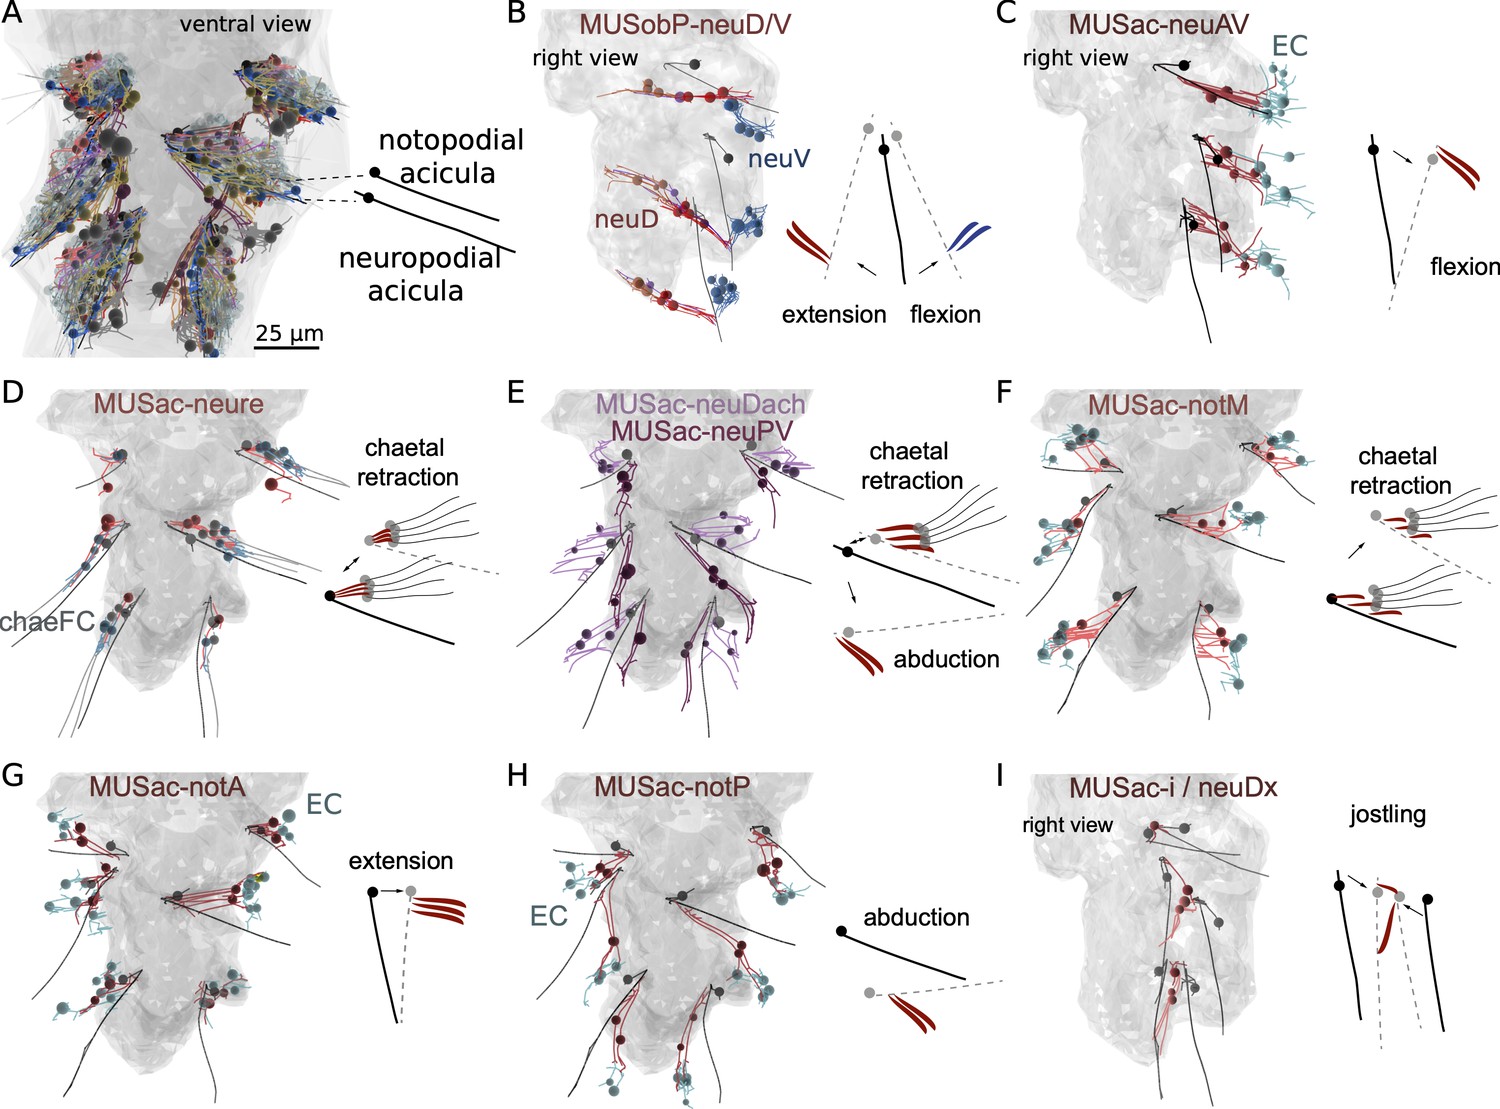
Morphological renderings of muscles in the parapodial muscle complex and inferred movement of the aciculae.
(A) Skeleton view of the parapodial muscle complexes in all three parapodia. Each parapodium has a notopodial (dorsal) and a neuropodial (ventral) acicula. (B) The MUSobP-neu muscles (neuDdist, neuDLong, and neuDprox) and the inferred movement of the neuropodial aciculae upon their contraction. MUSobP-neuDlong cells connect to MUSlong-D, which are shown for reference. (C) The MUSac-neuAV muscles and the inferred movement of the neuropodial aciculae. (D) The MUSac-neure muscles and the inferred movement of the neuropodial aciculae and chaetae. (E) The MUSac-neuDach and MUSac-neuPV muscles and the inferred movement of the neuropodial aciculae. (F) The MUSac-notM muscles and the inferred movement of the notopodial aciculae. (G) The MUSac-notA muscles and the inferred movement of the notopodial aciculae. (H) The MUSac-notP muscles and the inferred movement of the notopodial aciculae. (I) The MUSac-i and MUSac-neuDx muscles and the inferred movement of the neuropodial and notopodial aciculae. B, C, and I are right lateral views, all other views are ventral views. The outline of the yolk is shown in grey for reference.
Figure 7 with 1 supplement
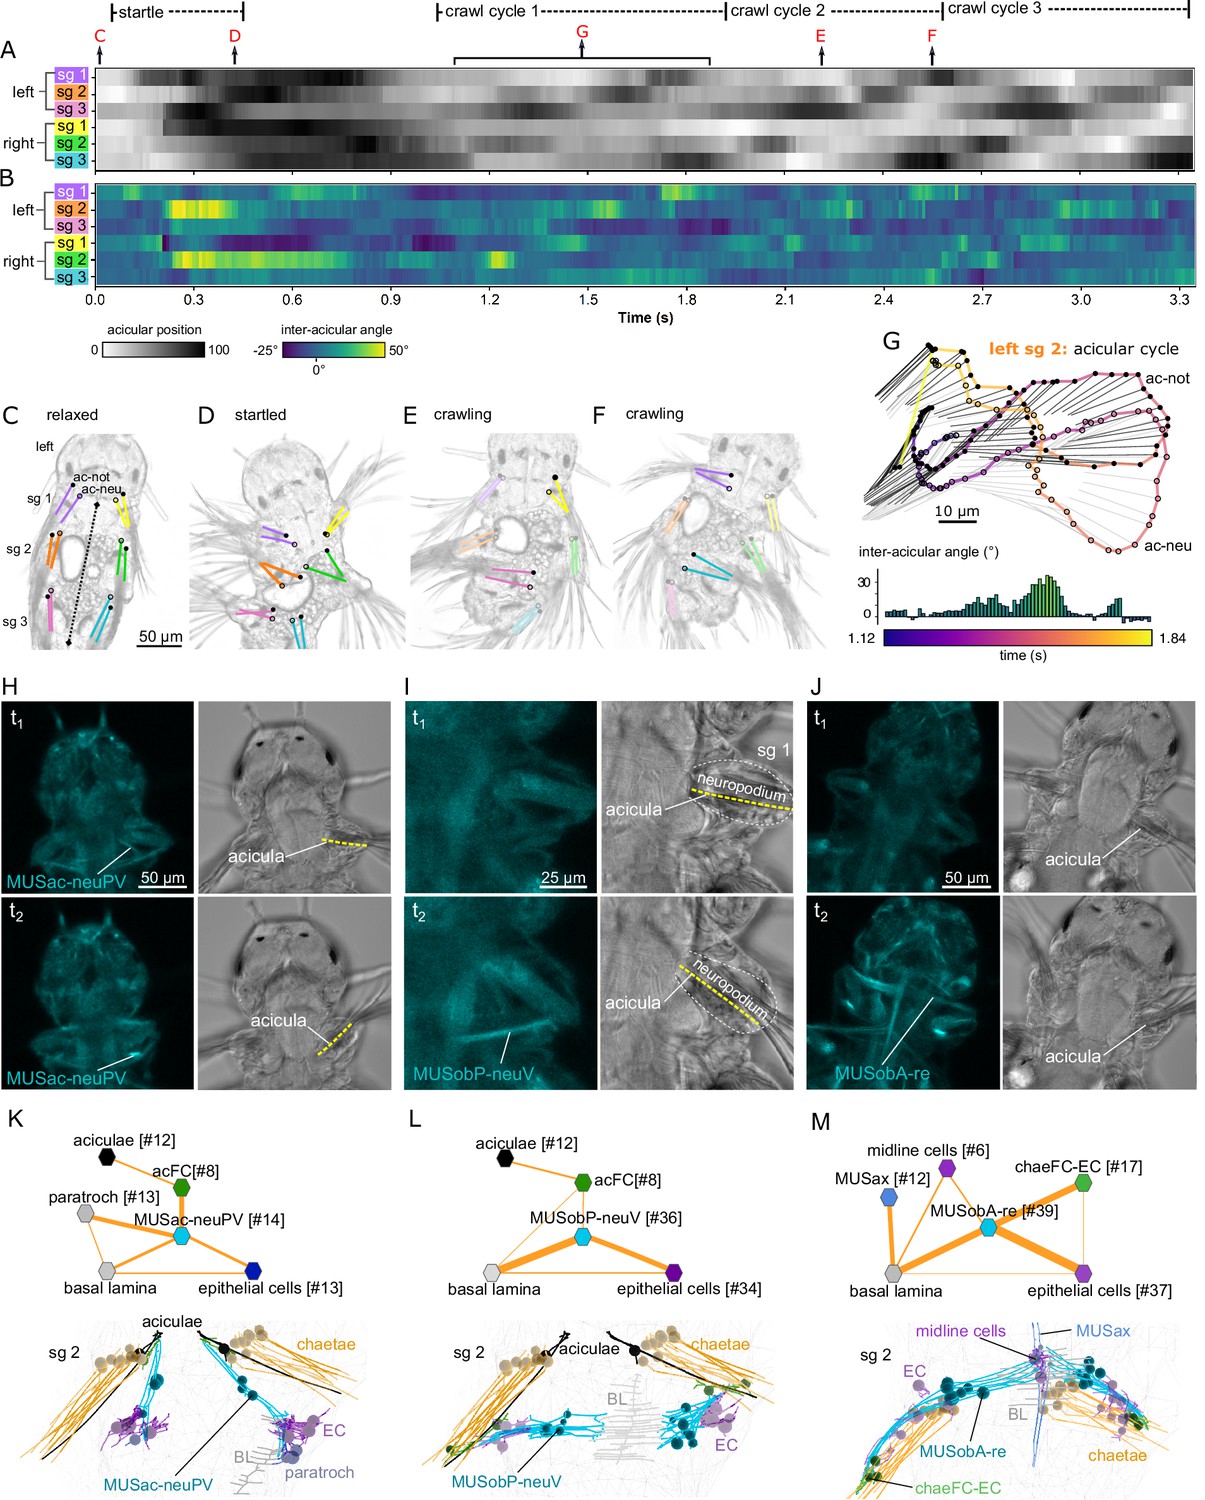
Acicula tracking, muscle contractions, and desmosomal connectivity.
(A) Acicular position over time in all six parapodia analysed from video tracking data to indicate gait of the larva over time. Angles between the anterior–posterior bodyline connecting the mouth and the hindgut (dotted line, panel C) and each notopodial acicula were normalised (scale 0–100) within each parapodium’s angular range of motion. White areas of the heatmap represent aciculae held fully back, close to the trunk. Black areas represent aciculae extended to their extreme forward position. Arrows indicate time points at which panels C–G were taken. (B) Inter-acicular angle between notopodial and neuropodial aciculae over time. Frames of the video sequence are labelled to show (C) the larva relaxed, (D) showing a partial startle response, (E, F) during crawl cycle 2 where opposite acicula pairs diverge, extend rostrally and inward towards the trunk, causing the larva to bend left or right. (G) From crawl cycle 1, acicular positions from one example acicular cycle (lasting 720 ms) are plotted for the left parapodium in segment 2, as the larva crawls forward. Points mark the proximal tips of the two aciculae, connected by coloured lines to indicate time. Finer light/dark grey straight lines show the relative positions and angles of the distally projecting aciculae. Below, the inter-acicular angles are plotted for the same parapodium over this time period. (H) Live imaging of MUSac-neuPV, (I) MUSobP-neuV, and (J) MUSobA-re contraction and neuropodia displacement. In H, I, and J, the left panel shows the GCaMP6s signal, the right panel shows the differential interference contrast (DIC) channel, the top and bottom panels show two frames from a video (t1, t2). (K) Desmosomal connectivity of MUSac-neuPV. Skeletons of MUSac-neuPV and their desmosomal partners in segment-2. (L) Desmosomal connectivity of MUSobP-neuV. Skeletons of MUSobP-neuV and their desmosomal partners in segment-2. (M) Desmosomal connectivity of MUSobA-re. Skeletons of MUSobA-re and their desmosomal partners in segment-2. Abbreviations: ac-not, notopodial acicula; ac-neu, neuropodial acicula; BL, basal lamina; EC, epidermal cell; sg, segment.
-
Figure 7—source data 1
Source data for panel A-G of Figure 7.
- https://cdn.elifesciences.org/articles/71231/elife-71231-fig7-data1-v2.gz
Figure 7—figure supplement 1

Somatic muscles in Platynereis larvae visualised by phalloidin Images are maximum intensity projections of CLSM-image stacks taken of phalloidin-labelled specimens.
(A) Three-day-old larva in whole-body dorsal overview, detail of contracted neuro- (B) and notopodia (C) in dorsal view; (D) 4-day-old larva in whole-body dorsal overview (with dorsolateral longitudinal muscles removed for an unobstructed view of overall musculature), detail of neuro- (E) and notopodium (F) in dorsal view. Frames in A and D indicate the region of parapodial detail. Scale bar is 10 µm in all images. Abbreviations: MUSac, acicular muscles; MUSant, antennal muscle; MUSax, axochord muscle; MUSchae, chaetal muscle; MUSll, lower lip muscle; MUSlongD, dorsolateral longitudinal muscle; MUSlongV, ventrolateral longitudinal muscle; MUSob, oblique muscle; MUSobA, anterior oblique muscle; MUSobP, posterior oblique muscle; MUSpx, plexus muscle; MUSring_pyg, muscular ring of the pygidium.
Figure 8 with 1 supplement
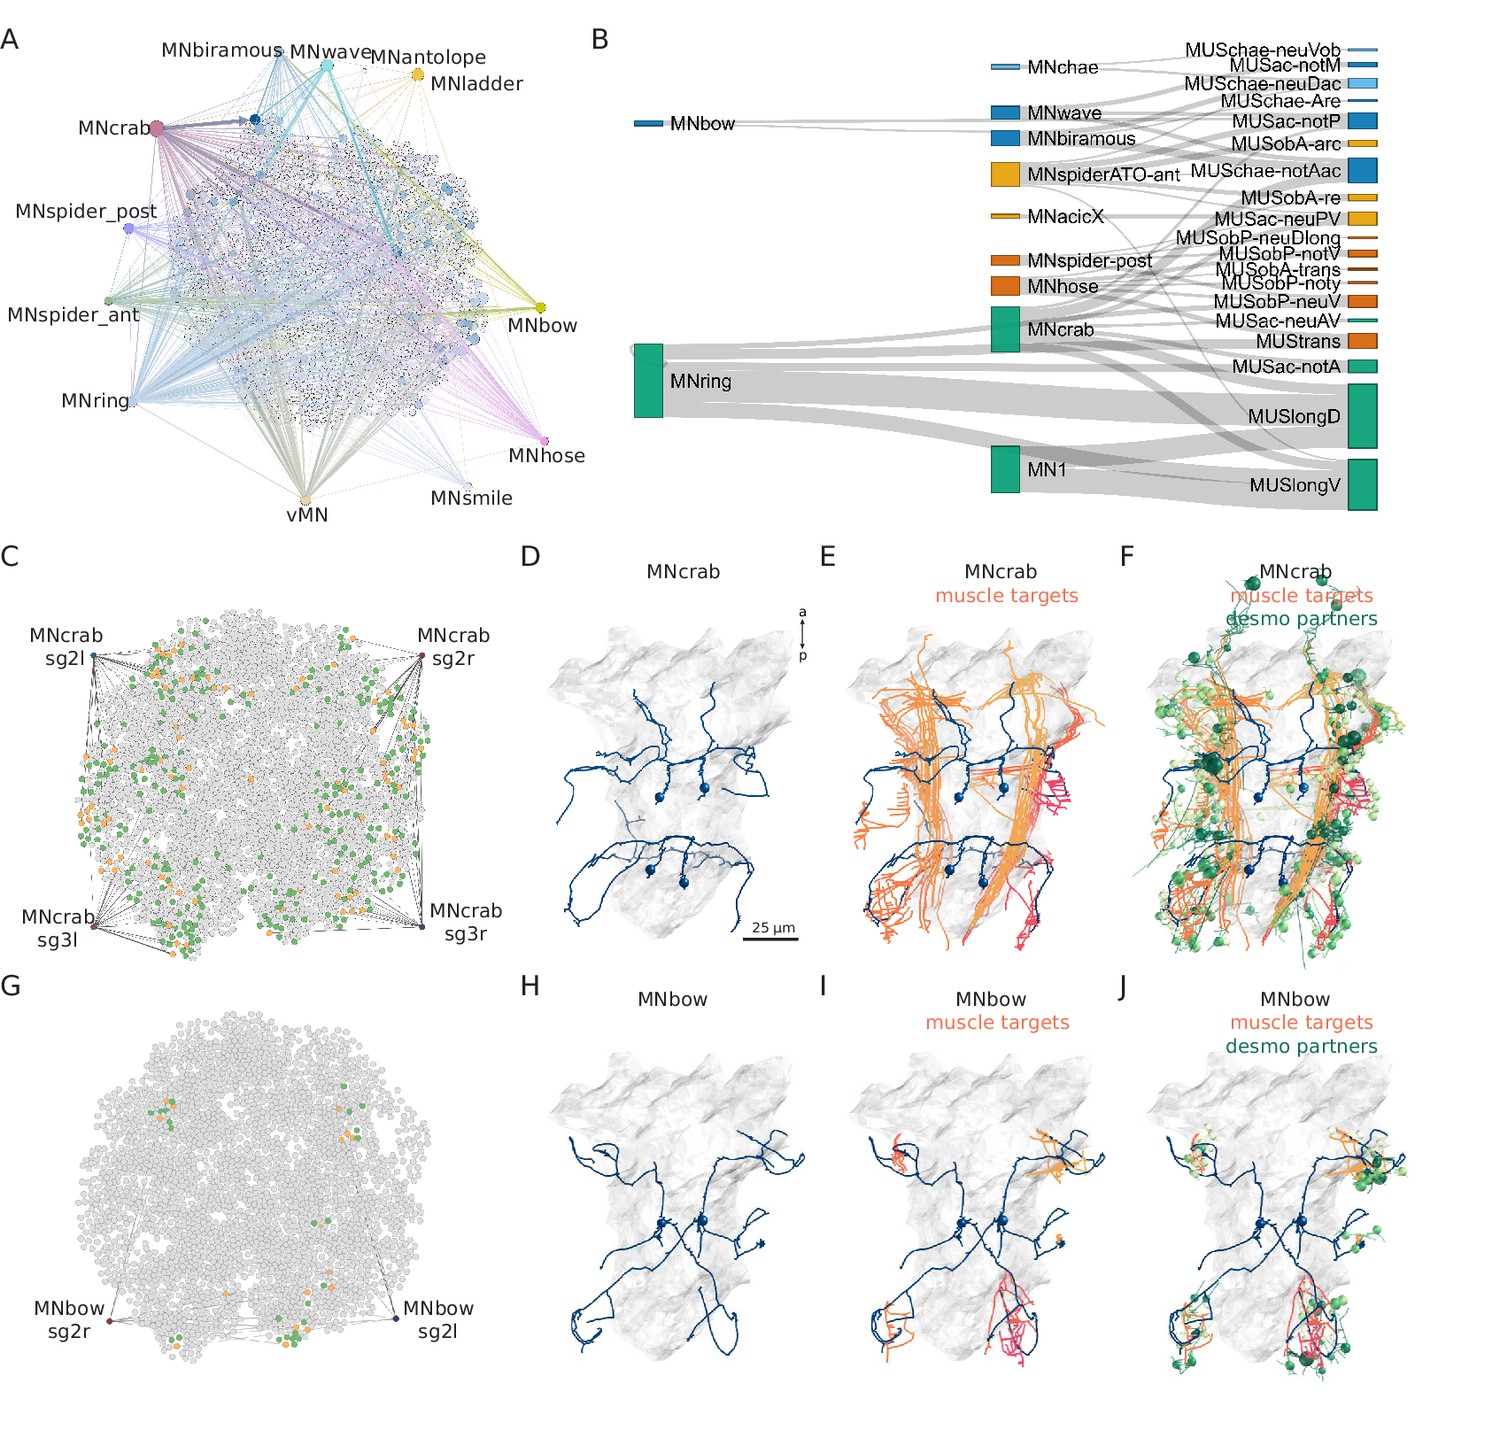
Combining synaptic and desmosomal connectomics.
(A) Graph representation of motoneuron synaptic inputs to the desmosomal connectome. The 11 main motoneuron groups are shown. (B) Sankey diagram of the synaptic innervation of muscle types by motoneurons. The width of the bands is proportional to the number of synapses from a motoneuron class to a muscle class. Only connections with >9 synapses are shown. Cell types are coloured by Leiden modules determined for this grouped synaptic graph. (C) MNcrab motoneuron synaptic inputs to muscle cells (orange) in the desmosomal connectome and the desmosomal partners of these muscle cells (green). (D) Morphological rendering of the four MNcrab motoneurons. (E) The postsynaptic muscle partners (shades of red) of the MNcrab neurons (blue). (F) The postsynaptic muscle partners (shades of red) of the MNcrab neurons (blue) and the desmosomal partners of the innervated muscles (shades of green). (G) MNbow motoneuron synaptic inputs to muscle cells (orange) in the desmosomal connectome and the desmosomal partners of these muscle cells (green). (H) The two MNbow motoneurons. (I) The postsynaptic muscle partners (shades of red) of the MNcrab neurons (blue). (J) The postsynaptic muscle partners (shades of red) of the MNcrab neurons (blue) and the desmosomal partners of the innervated muscles (shades of green). In D–F and H–J, the yolk outline is shown in grey for reference. In A, C, and G the desmosomal links are not shown for clarity.
Figure 8—figure supplement 1
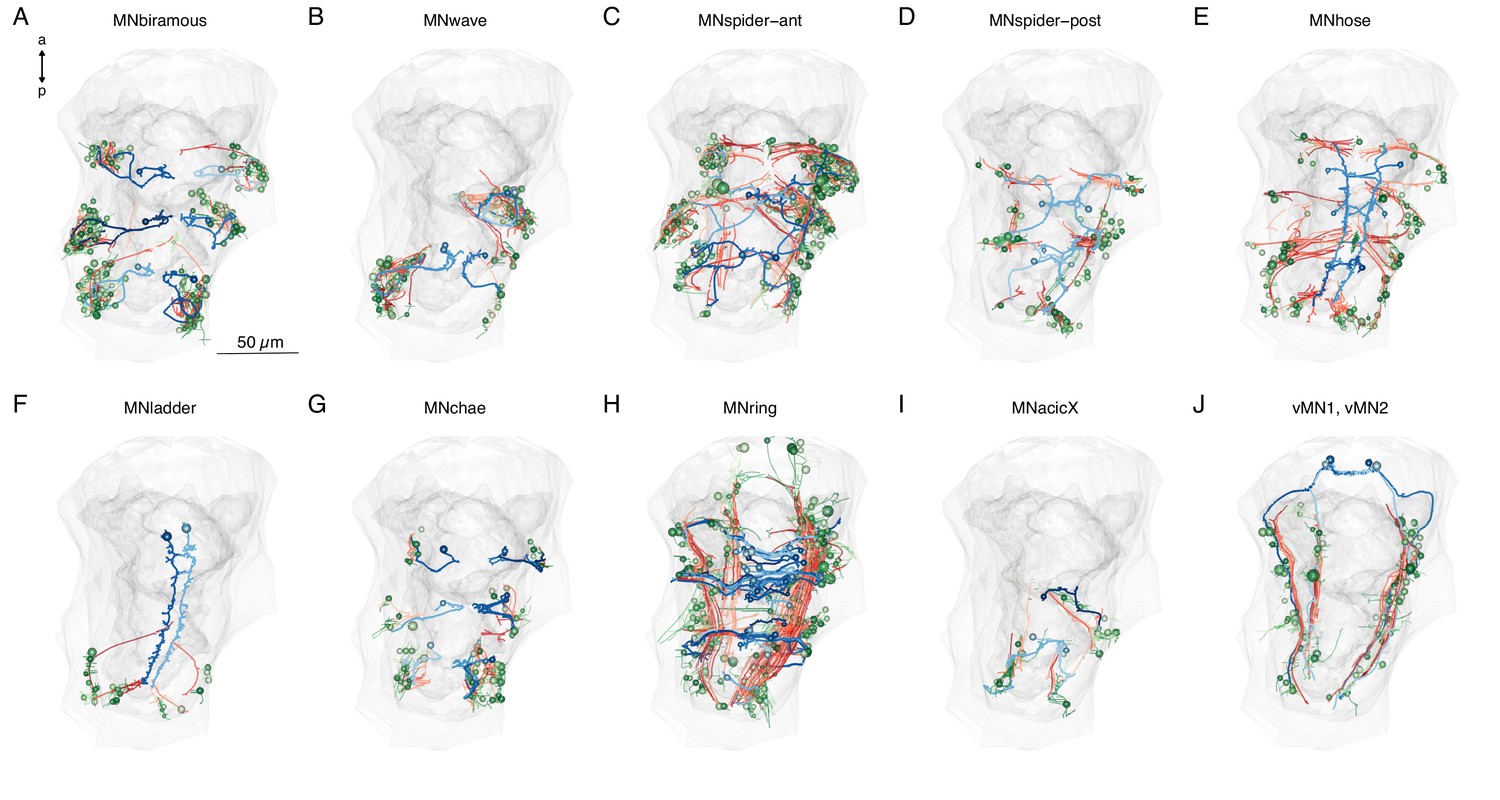
Downstream synaptic and desmosomal partners of main motoneuron types.
(A–J) Morphological renderings of muscle targets of 10 trunk motoneuron types (blue) in the 3-day-old larva, their postsynaptic muscle targets (orange-red) and the desmosomal partners of the innervated muscles (shades of green). The yolk and body outlines are shown in grey for reference. This figure can be reproduced by running the code/Figure8_figure_suppl1.R script (Jasek, 2022).
Figure 9
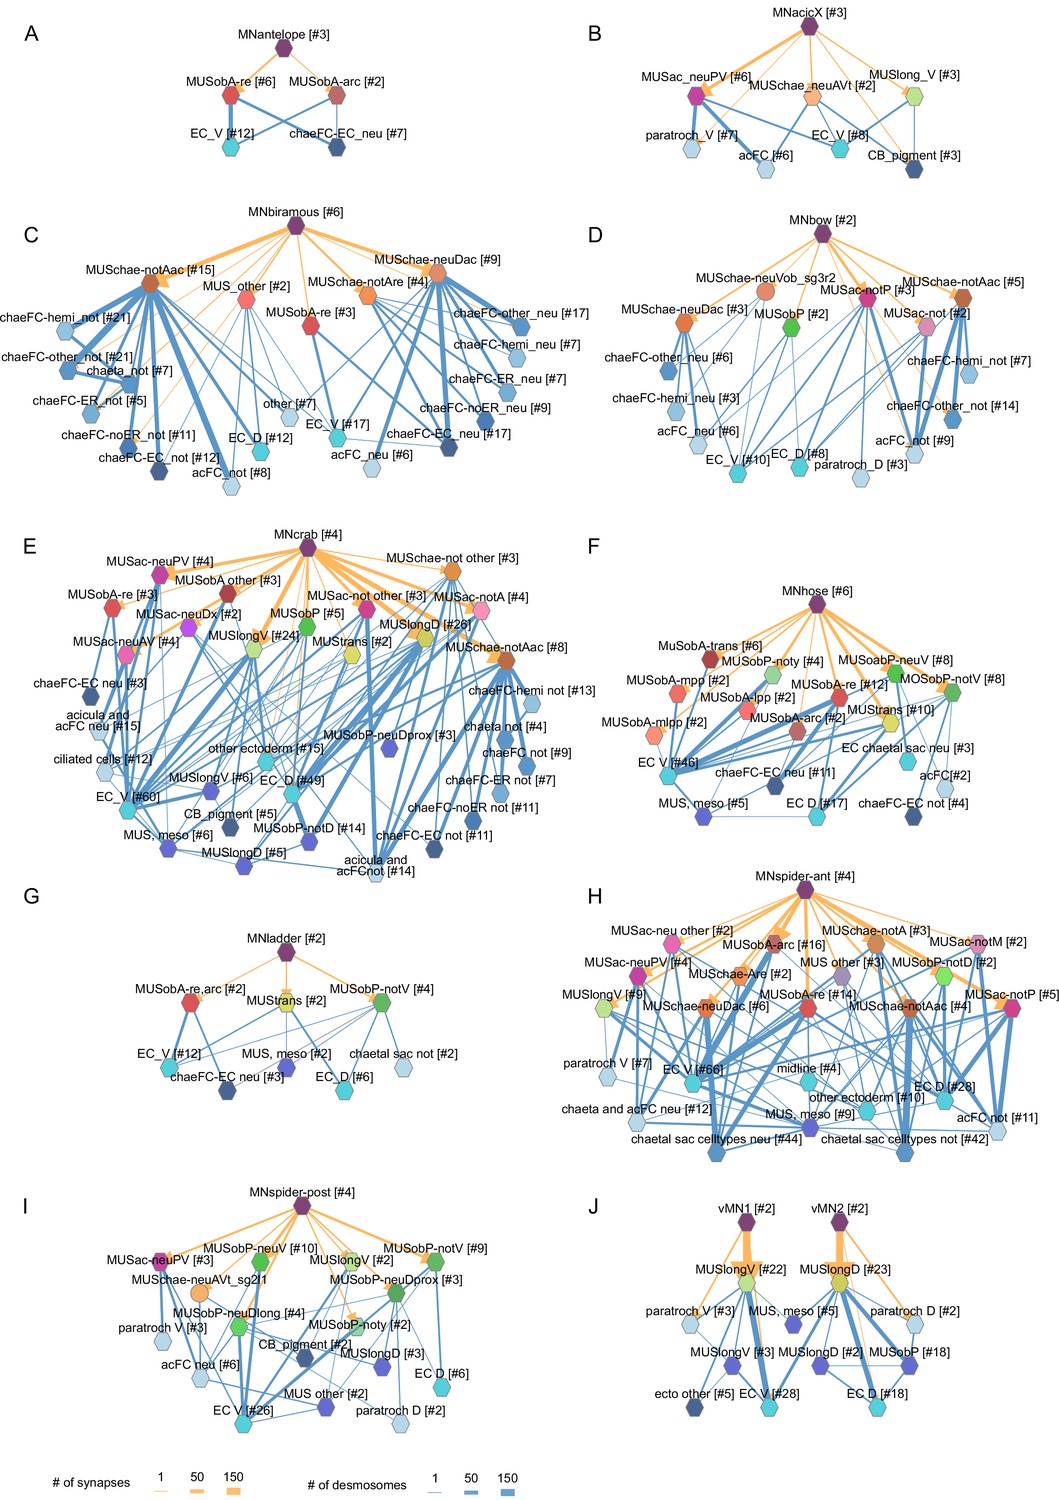
Combined synaptic–desmosomal graphs of motoneurons.
Synaptic connections (orange arrows) of motoneuron classes to muscles and desmosomal links (blue edges) of the innervated muscle cells. Combined synaptic-desmosomal graph for (A) MNantelope, (B) MNacicX, (C) MNbiramous, (D) MNbow, (E) MNcrab, (F) MNhose, (G) MNladder, (H) MNspider-ant, (I) MNspider-post and (J) vMN1 and vMN2 motoneurons. Only the muscle cells directly innervated by the motoneurons are shown.
-
Figure 9—source data 1
A zip archive of CATMAID json files.
The graphs can be loaded in the CATMAID graph widget at https://catmaid.jekelylab.ex.ac.uk.
- https://cdn.elifesciences.org/articles/71231/elife-71231-fig9-data1-v2.zip
Figure 10

Postsynaptic muscle targets in the parapodial complex of different motoneurons.
Morphological rendering of postsynaptic muscle targets (red-purple) within the parapodial complex of (A) MNcrab, (B) MNbiramous, (C) MNwave, (D) MNspider-ant, (E) MNspider-post, (F) MNhose, (G) MNchae, and (H) MNring motoneurons. The desmosomal partners of the innervated muscles are also shown (green). Only the muscles in the left parapodium of segment 2 and the motoneurons innervating this parapodium are shown.
Videos
Video 1
All muscles in the 3-day-old Platynereis larva.
Individual muscle cell types are shown by cell type and muscle category. The 12 aciculae are shown in grey for reference. The cell nuclei are labelled by a sphere. The yolk and body outlines are shown in grey. This video can be reproduced by loading the Jasek_et_al.Rproj R project in RStudio and running the code/Video1.R script (Jasek, 2022).
Video 2
Muscle groups in the parapodial complex.
Reconstruction of all cell groups in the left parapodial complex in the second segment. The neuropodial and notopodial aciculae are shown in black, chaetae are in yellow. The dark-brown cell with the large nucleus is the spinning gland. The yolk outline is shown in grey. Subsequent rotations highlight selected muscle cell types involved in some of the movements in Figure 6—figure supplement 4. CATMAID view of a similar 3D rendering: https://catmaid.jekelylab.ex.ac.uk/11/links/ooeymw3. This video can be reproduced by loading the Jasek_et_al.Rproj R project in RStudio and running the code/Video2.R script (Jasek, 2022).
Video 3
3D visualisation of all cells in the desmosomal connectome coloured by module.
The colour scheme is the same as in Figure 3. The cell nuclei are labelled by a sphere. Individual Z planes from the stack are also shown to indicate the orientation of the serial EM stack. The yolk and body outlines are shown in grey. CATMAID view: https://catmaid.jekelylab.ex.ac.uk/11/links/7ftc5sa. This video can be reproduced by loading the Jasek_et_al.Rproj R project in RStudio and running the code/Video3.R script (Jasek, 2022).
Video 4
3D visualisation of selected muscle groups and their desmosomal connections.
Morphological renderings of selected muscle groups and partner cells and the desmosomes (in red) that connect them. The video illustrates that desmosomes often occur at the most distal ends of muscle cells. This video can be reproduced by loading the Jasek_et_al.Rproj R project in RStudio and running the code/Video4.R script (Jasek, 2022).
Video 5
Acicular movements in crawling and startling Platynereis larvae.
Differential interference contrast (DIC) video of a crawling larva and a startling larva (end of the video) with the position of the aciculae tracked by DeepLabCut.
Video 6
Calcium imaging of muscle contractions in Platynereis larvae.
Spontaneous contractions of individual muscle groups as visualised by the confocal imaging of calcium signals reported by GCaMP6s fluorescence. The larvae were also imaged in the differential interference contrast (DIC) channel to reveal the movements of the parapodia.
Video 7
3D visualisation of motoneurons, their muscle targets, and the desmosomal partners of the muscles.
The first half of the video shows the combined synaptic and desmosomal connectome of different types of motoneurons. The muscles postsynaptic to the motoneurons are shown in orange. The desmosomal partners of these muscle cells are shown in green. The second half of the video shows all motoneurons from the 12 analysed motoneuron classes, their muscle partners, and the desmosomal partners of those muscles. A similar visualisation is also available in CATMAID where it can be explored interactively: https://catmaid.jekelylab.ex.ac.uk/11/links/8lzcofe. This video can be reproduced by loading the Jasek_et_al.Rproj R project in RStudio and running the code/Video7.R script (Jasek, 2022).
Tables
Table 1
Muscle cell types.
Hierarchical classification and nomenclature of all muscle cells in the 3-day-old Platynereis larva.
| Anatomical name and CATMAID annotation | Example CATMAID neuron name (example) | Number of cells (per segment [sg] and body side) | Desmosomal connections to | Synaptic connections from (>3 synapses) | ||
|---|---|---|---|---|---|---|
| Acicular muscle (MUSac) | Notopodial | Anterior notopodial acicular muscle | MUSac-notA | sg1: 2 l, 2 r sg2: 2 l, 2 r sg3: 2 l, 2 r | Proximal base of notopodial acicula; notopodial ECs | MNring, MNcrab, MNwave, MNantacic |
| Posterior notopodial acicular muscle | MUSac-notP | sg1: 2 l, 2 r sg2: 2 l, 2 r sg3: 2 l, 2 r | Proximal base of notopodial acicula; septal ECs and dorsal paratroch | MNacic, MNwave, MNbow, MNspider-ant, MNcrab, MNperif | ||
| Middle notopodial acicular muscle | MUSac-notM | sg1: 2 l, 2 r sg2: 2 l, 2 r sg3: 2 l, 2 r | Proximal base of notopodial acicula; parapodial ECs | MNwave, MNacic, MNantaci, MNbow | ||
| Unpaired notopodial dorsal acicular muscle | MUSac-notDo | sg1: 0 l, 0 r sg2: 1 l, 0 r sg3: 0 l, 0 r | Proximal base of notopodial acicula; dorsal ECs | None | ||
| Neuropodial | Anterior ventral neuropodial acicular muscle | MUSac-neuAV | sg1: 2 l, 2 r sg2: 3 l, 3 r sg3: 3 l, 3 r | Proximal base of neuropodial acicula; epidermal cells near ventrolateral muscles | MNcrab, MNring, MNchae | |
| Posterior dorsal neuropodial acicular muscle | MUSac-neuPD | sg1: 3 l, 3 r sg2: 3 l, 3 r sg3: 3 l, 3 r | Proximal base of neuropodial acicula; dorsal ECs and notopodial EC chaeFC and distal notopodial acicula (1) and dorsal paratroch (2) | MNarm, sparse various others | ||
| Posterior ventral neuropodial acicular muscle | MUSac-neuPV | sg1: 2 l, 2 r sg2: 3 l, 3 r sg3: 2 l, 2 r | Proximal base of neuropodial acicula; ventral paratroch and ECs around it | MNcrab, MNacicX, MNperifac, MNspider-post, MNspider-ant, MNpostv | ||
| Neuropodial Y | MUSac-neuDy | sg1: 0 l, 0 r sg2: 1 l, 1 r sg3: 1 l, 1 r | Proximal and mid neuropodial acFC; neuropodial chaeFC-hemi; mid-parapodial septal EC | Fragments | ||
| Dorsal neuropodial muscle to notopodium | MUSac-neuDx | sg1: 0 l, 0 r sg2: 2 l, 2 r sg3: 2 l, 2 r | Proximal neuropodial acFC; mid-distal notopodial acFC; and mid-dorsal parapodial ECs (2) | MNchae, MNcrab, MNarm | ||
| Dorsal neuropodial chaetal muscle | MUSac-neuDach | sg1: 3 l, 3 r sg2: 3 l, 3 r sg3: 3 l, 3 r | Entire length of neuropodial acicula (all acFC); mid-parapodial ECs | MNarm, MNac, MNchae, MNantacic | ||
| Chaetal sac retractor | MUSac-neure | sg1: 1 l, 1 r sg2: 2 l, 2 r sg3: 1 l, 1 r | Proximal base of neuropodial acicula; proximal neuropodial chaeFC | Sparse | ||
| Inter-acicular | interacicular_muscle | MUSac-i | sg1: 1 l, 1 r sg2: 1 l, 1 r sg3: 1 l, 1 r | Proximal base of neuropodial acicula; proximal base of notopodial acicula | None | |
| Anterior oblique muscle | Anterior ventral oblique muscles | Parapodial retractor muscle | MUSobA-re | sg1: 6 l, 5 r sg2: 7 l, 7 r sg3: 7 l, 7 r | Neuropodial EC chaeFC and chaetal sac ECs; midline cells | MNspider-ant, MNantacic, MNhose, MNob-contra |
| Ventral parapodial muscle arc | MUSobA-arc | sg1: 2 l, 2 r sg2: 4 l, 4 r sg3: 3 l, 3 r | Basal lamina next to nerve chord; neuropodial ECs and chaeFC-ECs | MNspider-ant, MNantacic, MNob-contra | ||
| Medial oblique to mid-parapodium | MUSobA-mpp | sg1: 1 l, 1 r sg2: 2 l, 2 r sg3: 3 l, 3 r | Medial basal lamina next to medial nerve cord and putative radial glia; mid-parapodial ECs | MNob-contra, MNhose, MNcrab, others | ||
| Mediolateral oblique to mid-parapodium | MUSobA-mlpp | sg1: 0 l, 0 r sg2: 2 l, 2 r sg3: 0 l, 0 r | Medial basal lamina next to mediolateral nerve cord and putative radial glia; mid-parapodial ECs | MNhose | ||
| Lateral oblique to mid-parapodium | MUSobA-lpp | sg1: 1 l, 1 r sg2: 2 l, 2 r sg3: 2 l, 2 r | Lateral basal lamina next to the nerve cord and putative radial glia; mid-parapodial ECs | MNob-contra, MNhose, MNsmile, other | ||
| Oblique to start of transverse | MUSobA-trans | sg1: 1 l, 1 r sg2: 2 l, 2 r sg3: 2 l, 2 r | Basal lamina next to the axochord; ventrolateral ECs | MNhose, MNcross | ||
| Posterior oblique muscle | Posterior dorsal oblique muscle | Notopodial dorsal oblique muscle | MUSobP-notD | sg1: 4 l, 4 r sg2: 5 l, 5 r sg3: 5 l, 5 r | Dorsal longitudinal muscles and ECs near them; ECs of the notopodium | MNpostacic, MNspider-ant |
| Neuropodial dorsal oblique long | MUSobP-neuDlong | sg1: 1 l, 1 r sg2: 2 l, 2 r sg3: 2 l, 1 r | MUSlong_D; distal neuropodial acFC, neuropodial ECs, and mid-parapodial ECs | MNspider-post; MNpostacic | ||
| Neuropodial dorsal oblique proximal | MUSobP-neuDprox | sg1: 3 l, 3 r sg2: 3 l, 3 r sg3: 3 l, 3 r | MUSlong_D; dorsal paratroch and ECs around it | MNspider-post | ||
| Neuropodial dorsal oblique distal | MUSobP-neuDdist | sg1: 3 l, 3 r sg2: 3 l, 3 r sg3: 3 l, 3 r | ECs near dorsal paratroch; distal neuropodial acFC, neuropodial ECs and mid-parapodial ECs | MNbow | ||
| Posterior ventral oblique muscle | Posterior ventral neuropodial muscle | MUSobP-neuV | sg1: 5 l, 5 r sg2: 7 l, 7 r sg3: 7 l, 7 r | Basal lamina next to VNC; ECs from the distal part of neuropodial acicula to the ventral paratroch area | MNring, MNspider-post, MNob-ipsi, MN_oblique, MNob, many fragments | |
| Posterior ventral notopodial muscle | MUSobP-notV | sg1: 3 l, 3 r sg2: 3 l, 3 r sg3: 3 l, 3 r | Basal lamina next to VNC; septal ECs; EC and chaeFC near distal part of notopodial acicula | MNhose, MNspider-post, MNob-ipsi, MN_oblique, MNladder, MNob-contra, fragments | ||
| Oblique to distal inter-acicular | MUSobP-M | sg1: 0 l, 0 r; sg2: 1 l, 1 r sg3: 1 l, 1 r | Each other and basal lamina of the VNC; distal inter-acicular muscle | None | ||
| Oblique to body wall near distal inter-acicular and neuropodial Y | MUSobP-noty | sg1: 1 l, 1 r sg2: 1 l, 1 r sg3: 1 l, 1 r | Basal lamina next to the axochord; septal ECs | MNhose, MNpostacic, MNob-ipsi, MNspider-post, fragments | ||
| sg0 ventral posterior oblique muscle | MUSobP | sg0: 2 l, 2 r sg1: 0 l, 0 r sg2: 0 l, 0 r sg3: 0 l, 0 r | Basal lamina near VNC and ventral ECs; dorsal ECs | MNsmile, MNcrab, MNob-contra, MNmouth | ||
| Posterior median oblique muscle | Distal inter-acicular muscle | MUSobP-i | sg1: 1 l, 1 r sg2: 1 l, 1 r sg3: 1 l, 1 r | Neuropodial EC, chaeFC-EC, acFC-EC; notopodial EC, chaeFC EC; MUSob-postM | Sparse | |
| Oblique muscle other | MUSob | sg0: 1 l, 1 r sg1: 0 l, 0 r sg2: 0 l, 0 r sg3: 0 l, 0 r | ECs near mouth/lower lip; MUStrans | MNsmile | ||
| Chaetal sac muscle | Notopodial | Notochaetal next to dorsal oblique | MUSchae-notDob | sg1: 3 l, 3 r sg2: 3 l, 3 r sg3: 3 l, 3 r | Dorsolateral ECs; notopodial chaeFC | MNpostatic, various |
| Dorsal notopodial chaetal sac muscle | MUSchae-notD | sg1: 1 l, 1 r sg2: 1 l, 1 r sg3: 1 l, 1 r | Proximal notopodial acicula; notopodial chaeFC (semicircle around dorsal side of notopodial chaetal sac) | Sparse | ||
| Next to dorsal notopodial chaetal sac muscle | MUSchae-notDn | sg1: 1 l, 1 r sg2: 1 l, 1 r sg3: 1 l, 1 r | Dorsolateral ECs; ECs of the notopodial chaetal sac and notopodial chaeFC-ECs; notopodial acFC cells | MNpostacic | ||
| Anterior notopodial chaetal sac muscle | MUSchae-notA | sg1: 1 l, 1 r sg2: 1 l, 1 r sg3: 1 l, 1 r | Mid-parapodial chaetal sac ECs and MUSobA-che; notopodial ECs, chaeFC-EC and acFC | MNspider-ant, MNantacic | ||
| Notopodial chaetal muscle under acicula | MUSchae-notAac | sg1: 4 l, 4 r sg2: 4 l, 4 r sg3: 4 l, 4 r | Distal acFC; all types of chaetal sac cells | MNcrab, MNbiramous, MNwave, MNantacic, MNacic, MNspider-ant, MNbow, fragments | ||
| Notopodial retractor muscle | MUSchae-notAre | sg1: 0 l, 0 r sg2: 1 l, 1 r sg3: 1 l, 1 r | Mid-parapodial ECs; distal notopodial acFC and EC chaeFC | Sparse | ||
| Neuropodial | Neurochaetal next to ventral oblique | MUSchae-neuVob | sg1: 2 l, 2 r sg2: 3 l, 3 r sg3: 2 l, 2 r | Proximal neuropodial chaeFC-hemi; ventrolateral ECs | MNchae | |
| Neuropodial chaetal muscle under acicula | MUSchae-neuDac | sg1: 4 l, 4 r sg2: 5 l, 5 r sg3: 5 l, 5 r | Mid and distal neuropodial circumacicluar cells; proximal and distal chaeFC cells and chaetal sac ECs | MNbiramous, MNchae, MNspider-ant, fragments | ||
| Anterior ventral neurochaetal muscle ob | MUSchae-neuAVo | sg1: 2 l, 2 r sg2: 3 l, 3 r sg3: 3 l, 3 r | Neuropodial mid acFC and proximal chaeFC; distal chaeFC and neuropodial ECs | MNarm, MNchae | ||
| Anterior ventral neurochaetal muscle trans | MUSchae-neuAVt | sg1: 1 l, 1 r sg2: 1 l, 1 r sg3: 1 l, 1 r | Distal neuropodial acFC; ventrolateral ECs next to VLM | MNacicX, MNspider-post | ||
| Chaetal sac under parapodial retractor | MUSchae-Are | sg1: 1 l, 1 r sg2: 1 l, 1 r sg3: 1 l, 1 r | Mid and distal neuropodial chaeFC cells | MNbiramous, MNspider-ant | ||
| Transverse muscle | Transverse muscle | MUStrans | sg0: 4 l, 5 r sg1: 5 l, 5 r sg2: 9 l, 9 r sg3: 8 l, 9 r pyg: 4 l, 4 r | Lateral ECs; metatroch; akrotroch | MNring, MNhose, MNsmile, MNob-contra, MNladder | |
| Longitudinal muscle | Dorsolateral | Dorsolateral muscle | MUSlongD | sg0: 11 l, 15 r sg1: 13 l, 15 r sg2: 10 l, 10 r sg3: 7 l, 7 r | Epidermal cells; MUSobP-neuD, MUSobP-notDprox, MUSobP-notDlong; paratroch; nuchal organ | MN2, MNring, MNcrab |
| Ventrolateral | Ventrolateral muscle | MUSlongV | head: 9 l, 8 r, 1 m sg0: 7 l, 4 r sg1: 8 l, 12 r sg2: 11 l, 8 r sg3: 7 l, 7 r pyg: 1 l, 1 r | Basal lamina lateral of VNC; ventral ECs | MN1, MNring, MNcrab, MNsmile, MNspider-ant | |
| Axochord | Axochord | MUSax | sg1: 4 l, 4 r sg2: 1 l, 1 r sg3: 1 l, 1 r | Basal lamina next to VNC; radial glia-like midline; ECs | MNax; MNsmile | |
| Digestive system muscle | Circular pygidial muscle | MUSring-pyg | pyg1 | Self; dorsal pygidial ECs; ventral pygidial ECs | None | |
| Pharyngeal muscle | MUSph | 28 l, 30 r | Basal lamina | None | ||
| Lower lip muscle | MUSll | 5 l, 5 r | Metatroch and ECs next to metatroch | MNsmile | ||
| Head muscle | Head appendage | Antenna muscle | MUSant | 4 l, 4 r | ECs | Sparse |
| Lyrate muscle | MUSly | 3 l, 3 r | Basal lamina | None | ||
| Palp muscle | MUSpl | 2 l, 2 r | ECs and prototroch cover cells | None | ||
| Cirrus muscle | MUSci | 2 l, 2 r | ECs and basal lamina | None | ||
| Other head | Cheek muscle | MUSch | 3 l, 3 r | Basal lamina | MNsmile | |
| Plexus muscle | MUSpx | 1 | ECs and putative glia | SNs with very weak connections | ||
| Ventral transverse muscle of prostomium | MUSpr-Vt | 1 | Dorsolateral head ECs | Sparse | ||
| Triangle muscle | MUStri | 1 l, 1 r | Basal lamina | None | ||
| Smooth head muscles | MUSmed-head | 1 l, 1 r | Head ECs | None |
Additional files
Download links
A two-part list of links to download the article, or parts of the article, in various formats.
Downloads (link to download the article as PDF)
Open citations (links to open the citations from this article in various online reference manager services)
Cite this article (links to download the citations from this article in formats compatible with various reference manager tools)
Desmosomal connectomics of all somatic muscles in an annelid larva
eLife 11:e71231.
https://doi.org/10.7554/eLife.71231


