Modulation of pulsatile GnRH dynamics across the ovarian cycle via changes in the network excitability and basal activity of the arcuate kisspeptin network
- Department of Mathematics and Living Systems Institute, College of Engineering, Mathematics and Physical Sciences, University of Exeter, United Kingdom
- Department of Women and Children’s Health, School of Life Course Sciences, King’s College London, United Kingdom
Figures
Figure 1
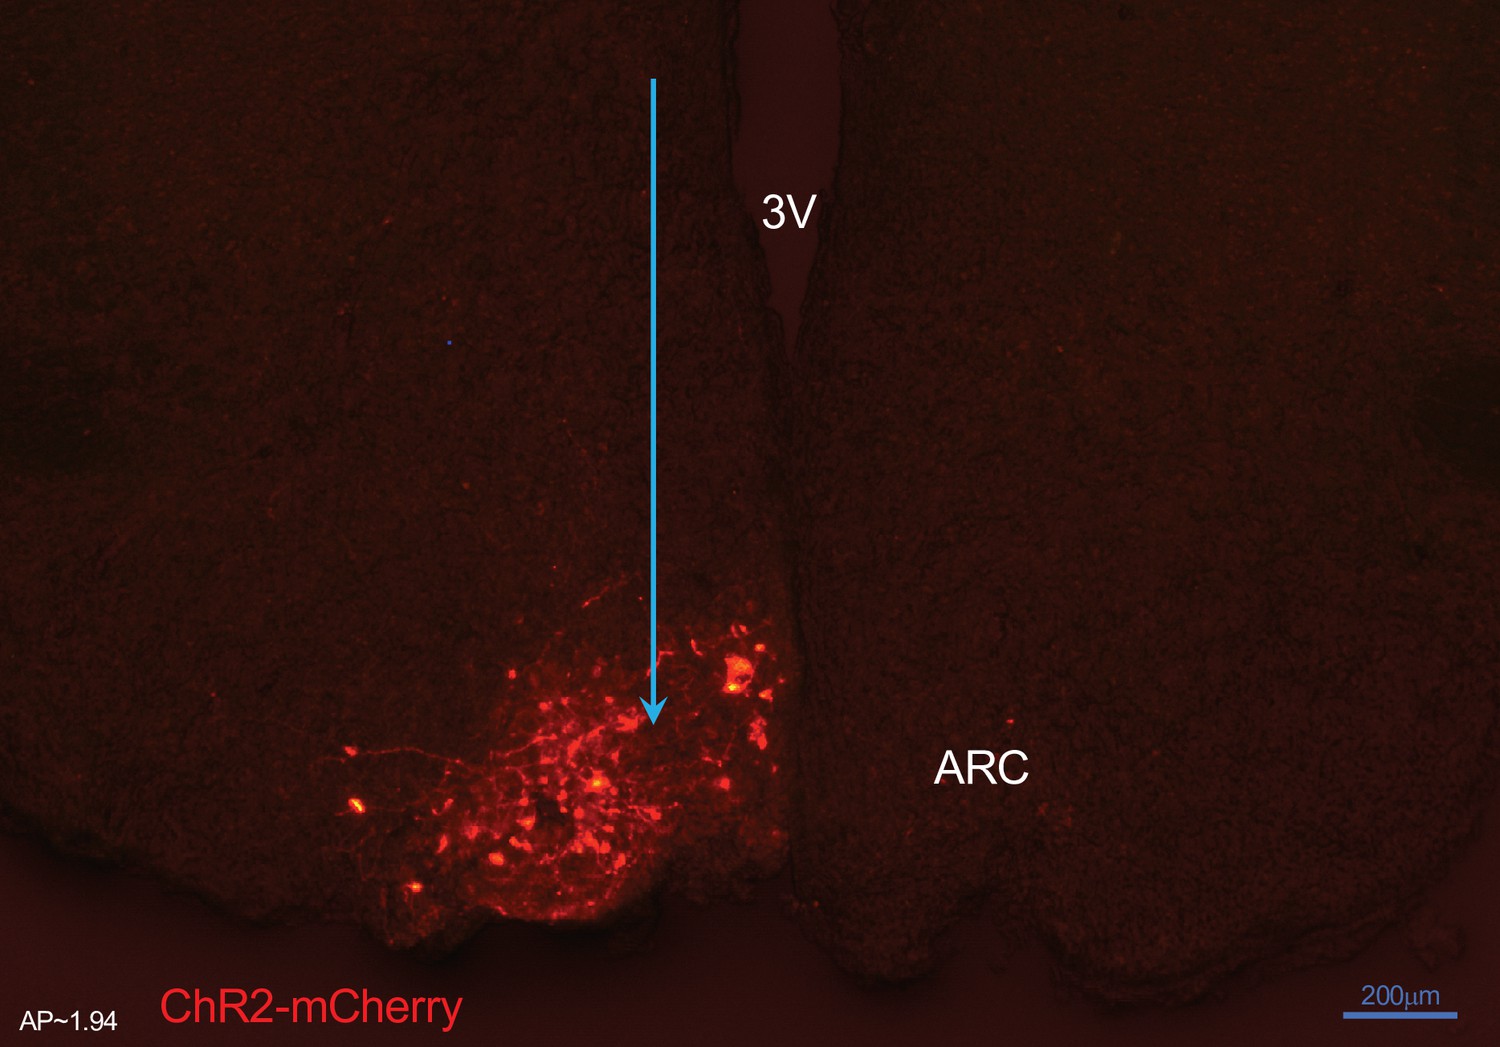
Expression of arcuate nucleus (ARC) kisspeptin neurones with ChR2-mCherry in Kiss-Cre mouse.
Coronal section showing red mCherry fluorescence positive neurons in the ARC which indicates ChR2 receptor expressing kisspeptin neurones, following unilateral injection of AAV9.EF1.dflox.hChR2(H134R)-mCherry.WPRE.hGH into the ARC of Kiss-Cre mouse. Note the absence of mCherry fluorescence in the other side of ARC.
3 V, Third ventricle.
Figure 2 with 2 supplements
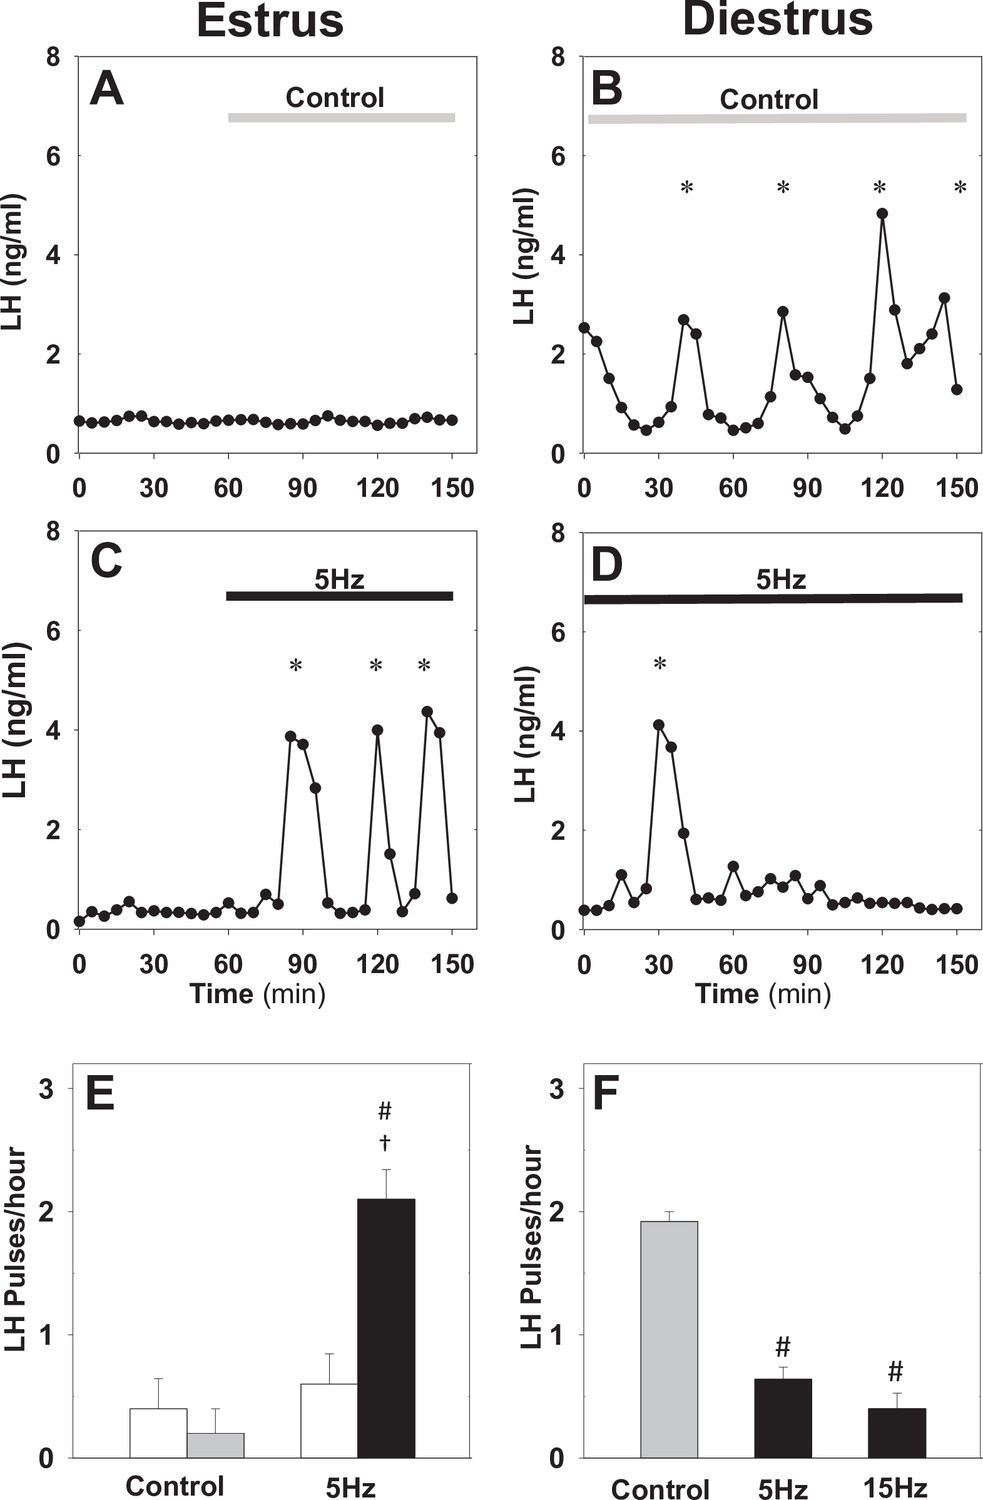
Differential effect of optic stimulation of ARC kisspeptin neurons in estrous and diestrous Kiss-Cre mice.
(A–B) Representative examples showing LH secretion in response to no stimulation (grey bar) or sustained blue light (473 nm, 5 ms pulse width, black bar) activation of kisspeptin neurons at 5 Hz in estrous (C) and diestrous (D) mice. (E) Summary showing mean ± SEM LH pulse frequency over the 60 min control period (white bars) and over the subsequent stimulation period (black bar) in estrous mice. (F) Summary showing mean ± SEM LH pulse frequency in the control (grey bar) and stimulated (black bars) diestrous mice. *Denote LH pulses. #p < 0.05 vs control; †p < 0.05 vs pre-stimulation; n = 5–6 per group.
Figure 2—figure supplement 1
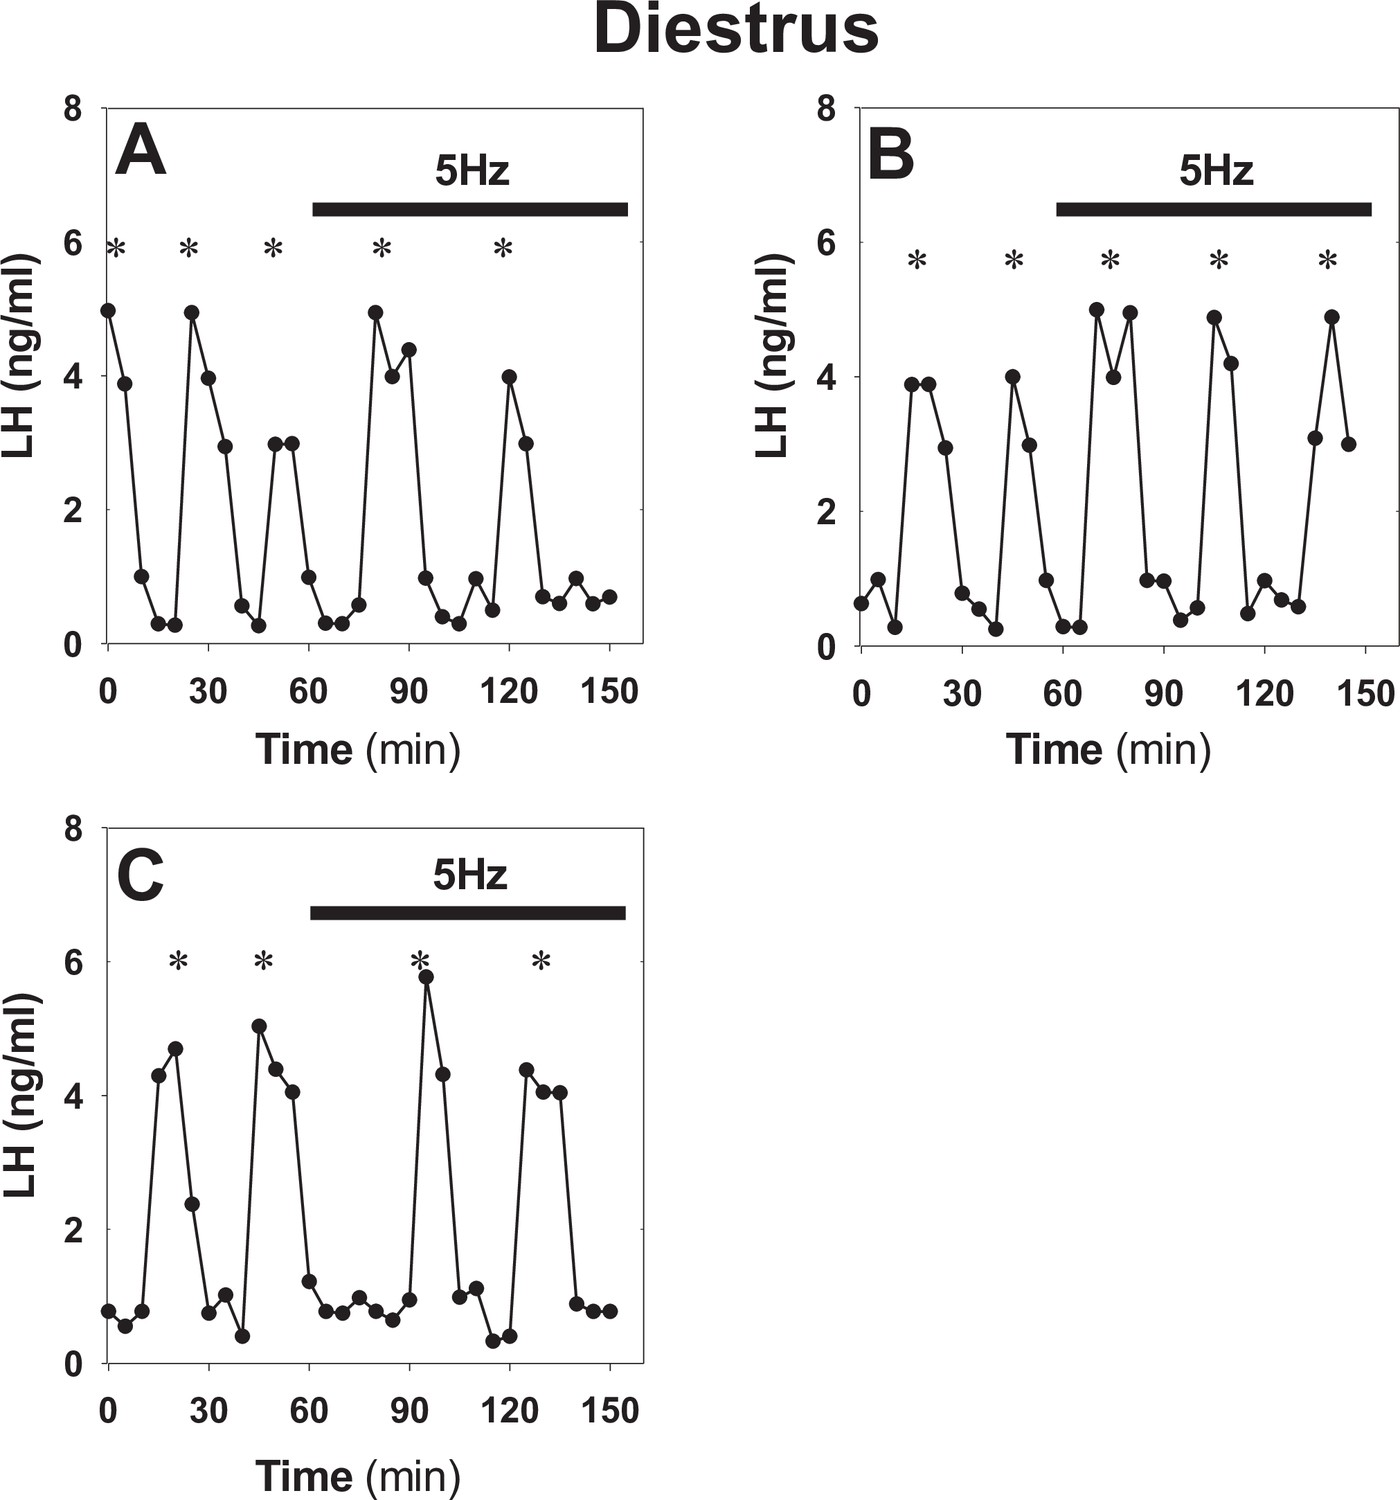
Optogenetic stimulation of ARC kisspeptin neurons in diestrous Kiss-Cre mice using the original protocol.
(A–C) Representative examples showing LH secretion in diestrous Kiss-Cre mice over a 60 min control period followed by a 90 min period of sustained blue light (473 nm, 5 ms pulse width, black bar) activation of kisspeptin neurons at 5 Hz. There is a tendency for LH pulses to slow down during the activation period: (A) 0.05 vs 0.222 pulses/h (slow down); (B), 0.03 vs 0.03 pulses/h (no change); and (C) 0.03 vs 0.222 pulse/h (slow down). To investigate the possibility of an effect in more depth, we revised the protocol by removing the control period and extending stimulating to 150 min (see Figure 1 in main text). *Denote LH pulses.
Figure 2—figure supplement 2
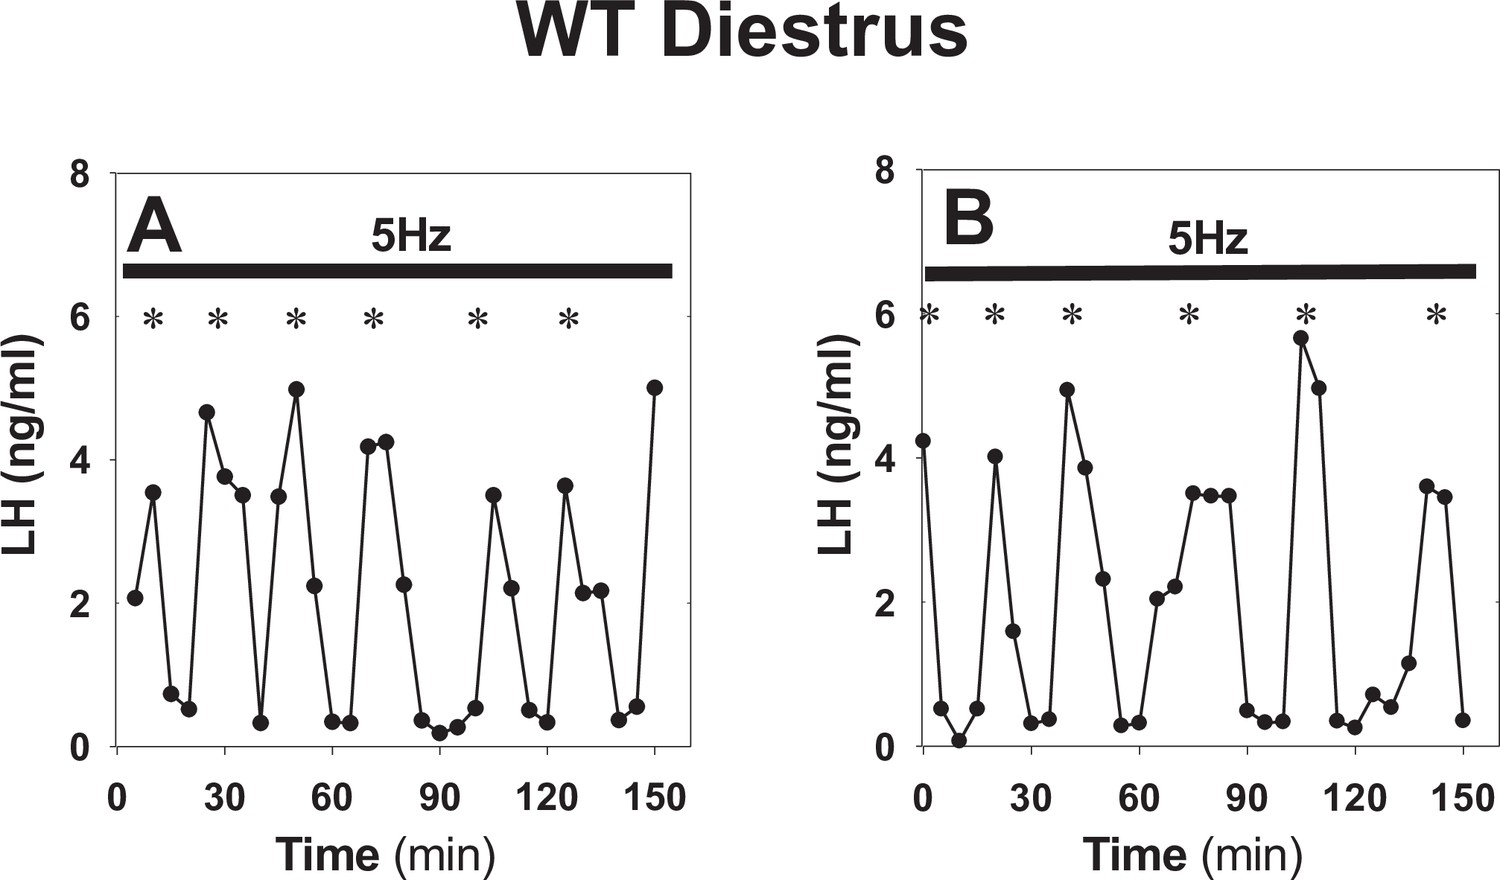
Sustained optogenetic stimulation in control WT animals.
(A–B) Representative examples showing normal LH secretion in diestrous WT animals under sustained blue light (473 nm, 5 ms pulse width, black bar) activation of kisspeptin neurons at 5 Hz. *Denote LH pulses.
Figure 3 with 1 supplement
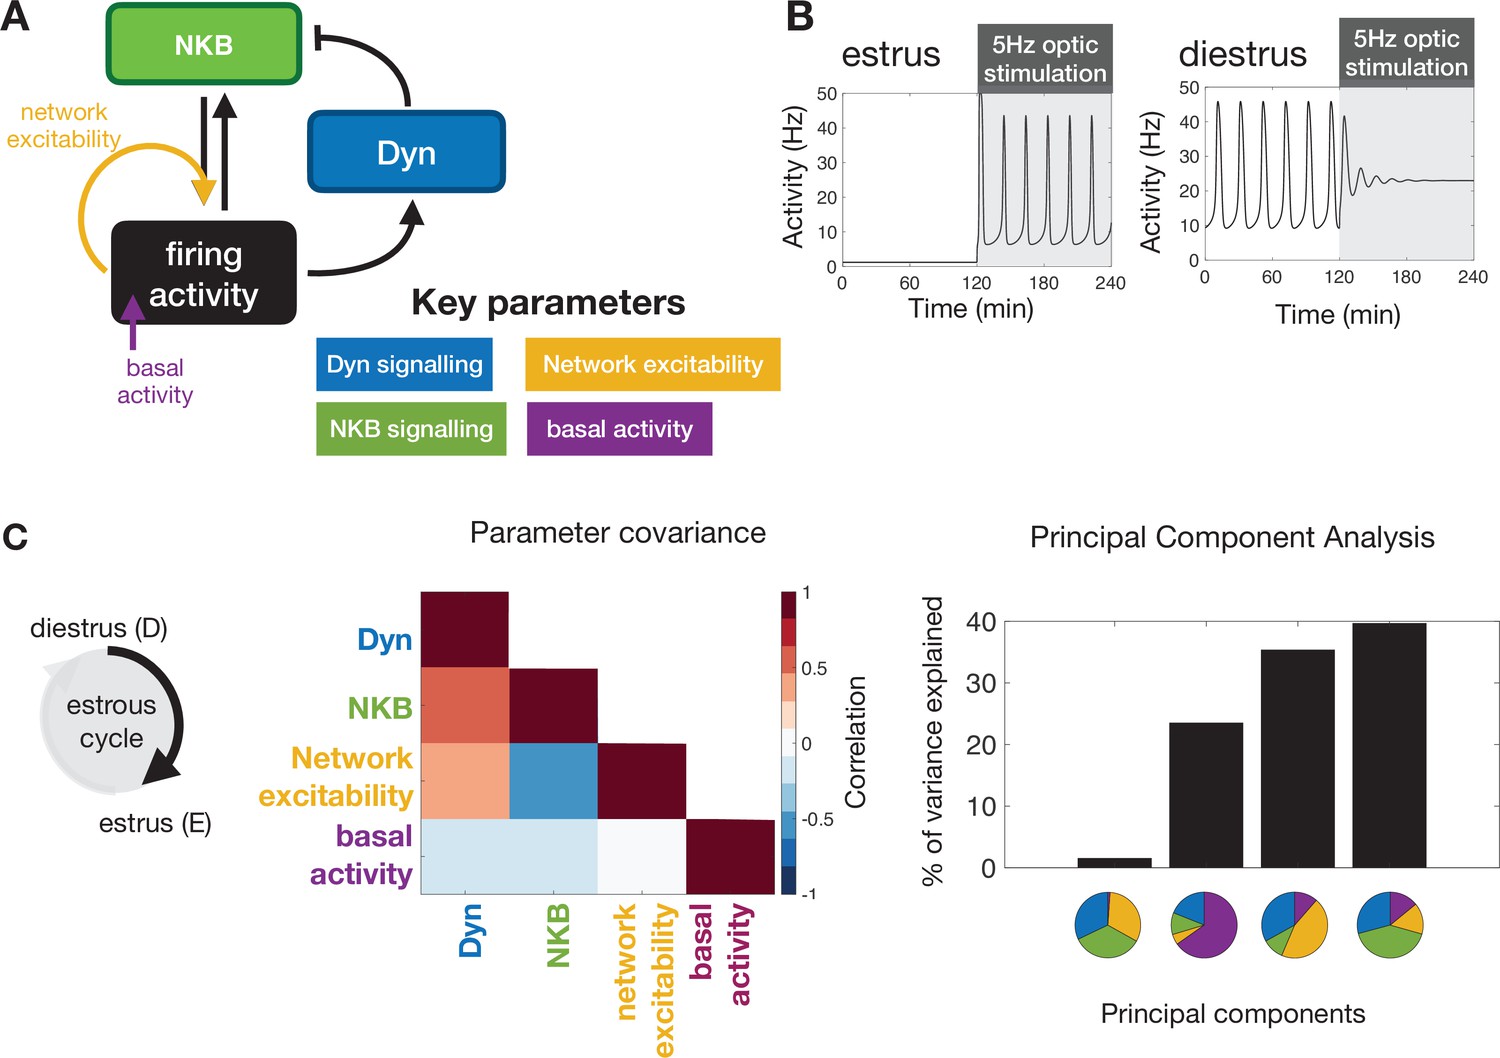
Model predictions on the key mechanisms modulating the behaviour of the KNDy pulse generator across the ovarian cycle.
(A) Schematic illustration of the coarse-grained model of the ARC KNDy population. The model comprises three dynamical variables representing the average levels of Dyn and NKB secreted by the population, and its average firing activity. We hypothesise that four key parameters modulate the behaviour of the system across the ovarian cycle: (i) Dyn signalling strength; (ii) NKB signalling strength; (iii) network excitability; and (iv) basal neuronal activity. Estimates for the four parameters in estrus and diestrus are inferred from LH pulse frequency data in estrus and diestrus animals; with or without 5 Hz optic stimulation (Figure 2E&F) (B) System response to low frequency stimulation during estrus and diestrus, using the maximum a-posteriori estimate of the parameter values inferred from the frequency data. (C) Analysis of parameter changes across the cycle. For each of the four parameter , the diestrus-to-estrus change is defined as the log-ratio between the corresponding parameter values, that is, Normalised covariance (correlation) matrix of parameter changes reveals negative correlation between changes in NKB signalling strength and network excitability, and positive correlation between Dyn signalling strength and both NKB signalling. Eigen-parameters are visualised as pie charts. The eigen-parameter explaining the least of the variance in the posterior distribution corresponds to the stiffest parameter combination to which the system is most sensitive.
Figure 3—figure supplement 1
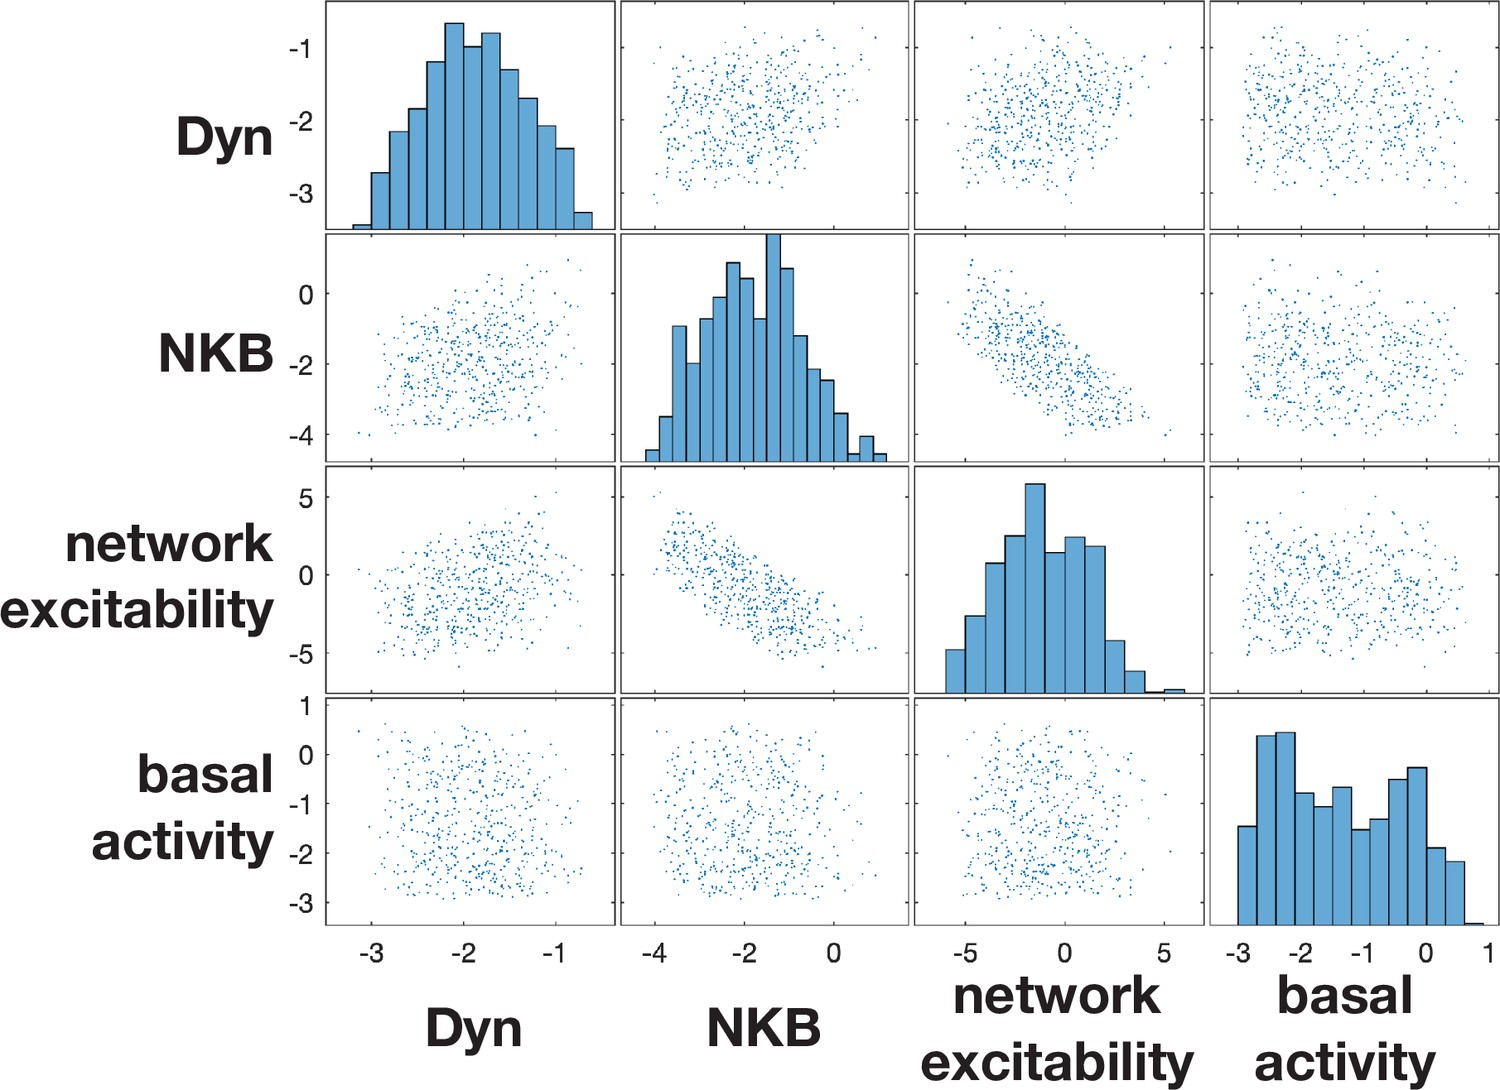
Posterior distributions of diestrus-to-estrus parameter changes inferred from data.
The behaviour of the model depends upon four parameters: (i) Dyn signalling strength; (ii) NKB signalling strength; (iii) network excitability and (iv) basal neuronal activity. For each of the four parameter (), we quantify the diestrus-to-estrus change as the log-ratio between the corresponding parameters, that is, , and we infer them from frequency of LH pulses using Approximate Bayesian Computation based on sequential Monte Carlo (see main text).
Figure 4
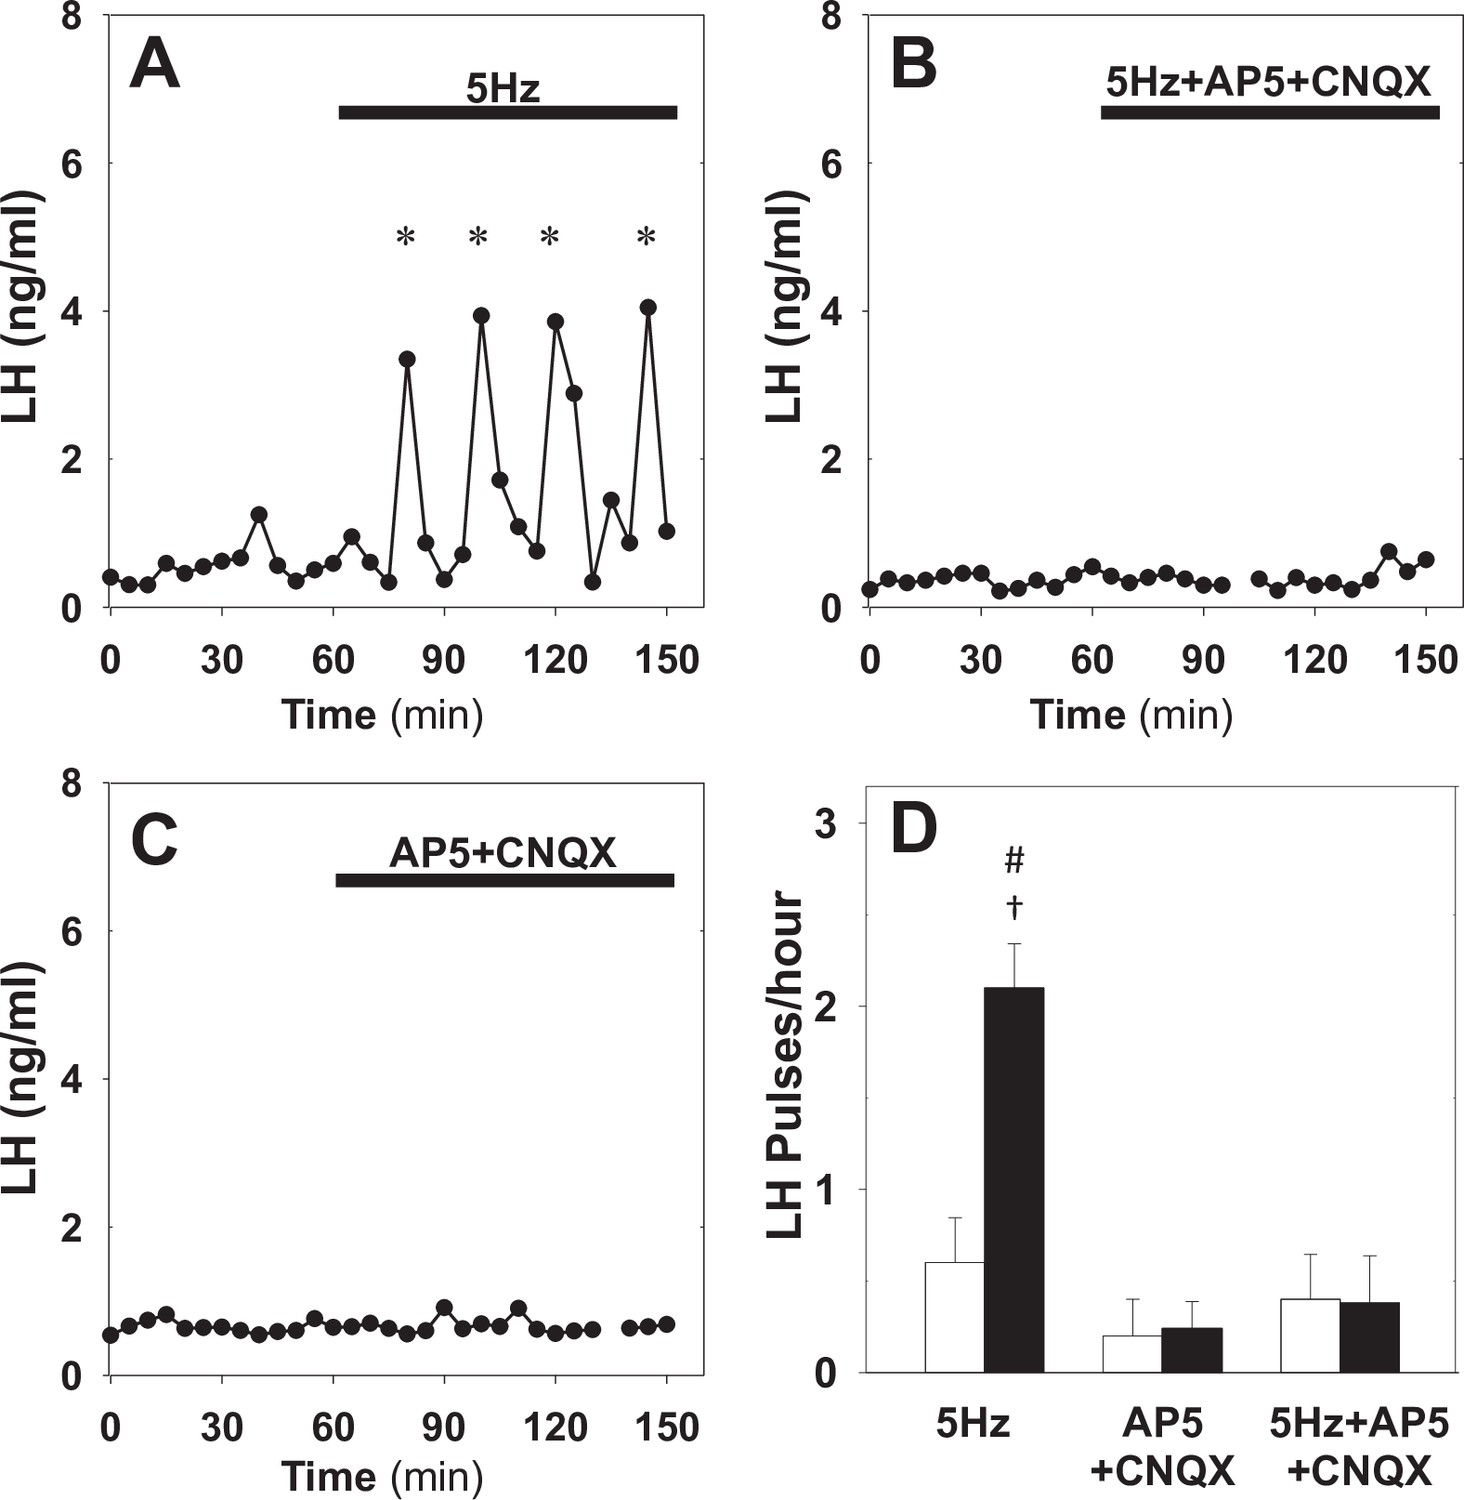
Effect of NMDA + AMPA receptor antagonists on pulsatile LH secretion in estrus.
Representative examples showing LH secretion in estrous mice in response to optic stimulation (5 Hz blue light, 473 nm, 5 ms pulse width) (A) and optic stimulation combined with the NMDA + AMPA receptor antagonist (bolus ICV injection [12 nmol AP5 +5 nmol CNQX] over 5 min, followed by a continuous infusion [20 nmol AP5 and 10 nmol CNQX] for the remaining 90 min) treatment (B). NMDA + AMPA receptor antagonist alone had no effect (C). (D) Summary showing mean ± SEM LH pulse frequency over the 60 min non-stimulatory period (white bars) and over the subsequent 90 min stimulation period or appropriate non-stimulatory period in presence of. NMDA + AMPA receptor antagonist alone (black bar) in diestrous mice. *Denote LH pulses. †p < 0.05 vs pre-stimulation. #p < 0.05 compared to antagonist treatment groups; n = 5–6 per group.
Figure 5

Effect of NMDA + AMPA receptor antagonists on pulsatile LH secretion in diestrus.
Representative examples showing pulsatile LH secretion in response to ICV administration of aCSF as control (A), treatment with NMDA + AMPA receptor antagonists (AP5+ CNQX: bolus ICV injection [12 nmol AP5 +5 nmol CNQX] over 5 min, followed by a continuous infusion [20 nmol AP5 and 10 nmol CNQX] for the remaining 90 min) (B) and combined NMDA/AMPA receptor antagonist treatment and sustained optic stimulation (blue light 473 nm, 5 ms pulse width) at 5 Hz (C). (D) Summary showing mean ± SEM LH pulse frequency over the 60 min non-stimulatory period (white bars) and over the subsequent 90 min stimulation period in control mice (grey bar) and mice receiving treatment (black bar). *Denote LH pulses. †p < 0.05 vs pre-stimulation. #p < 0.05 compared to 5 Hz stimulation plus antagonist treatment and aCSF control groups; n = 5–6 per group.
Figure 6 with 1 supplement
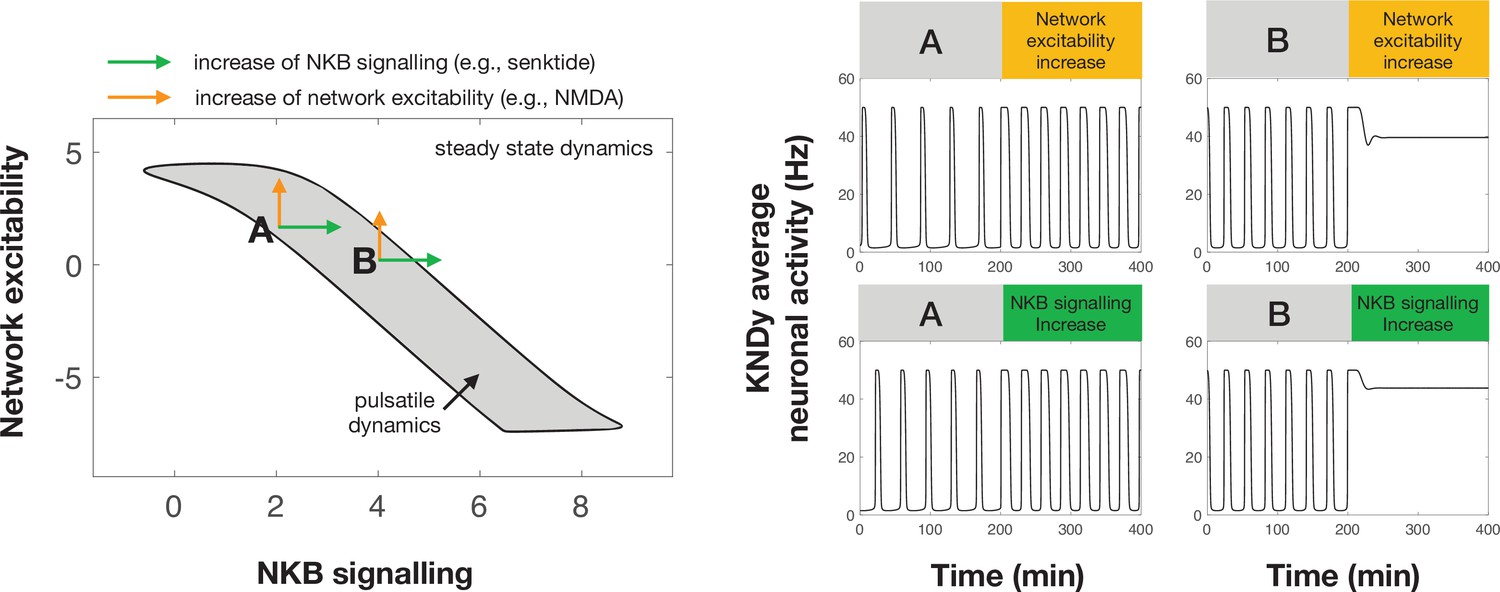
Differential effect of perturbations on the dynamics of the pulse generator.
Two-parameter (NKB signalling and network excitability) bifurcation diagram showing the region in the parameter space for which the system exhibits pulsatile dynamics (grey area). Two points (denoted by A and B) illustrate how an increase in NKB signalling or network excitability could have a differential effect on the dynamics of the system. For point A an increase in network excitability or NKB signalling could lead to an increase in the frequency and width of pulses. However, for point B a similar increase leads to pulse inhibition and steady state system dynamics. Furthermore, a negative correlation in how NKB signalling and network excitability co-vary (i.e. aligned with the direction of the pulsatile regime) make the system dynamics less sensitive to small perturbations and enable more robust control over the cyle.
Figure 6—figure supplement 1
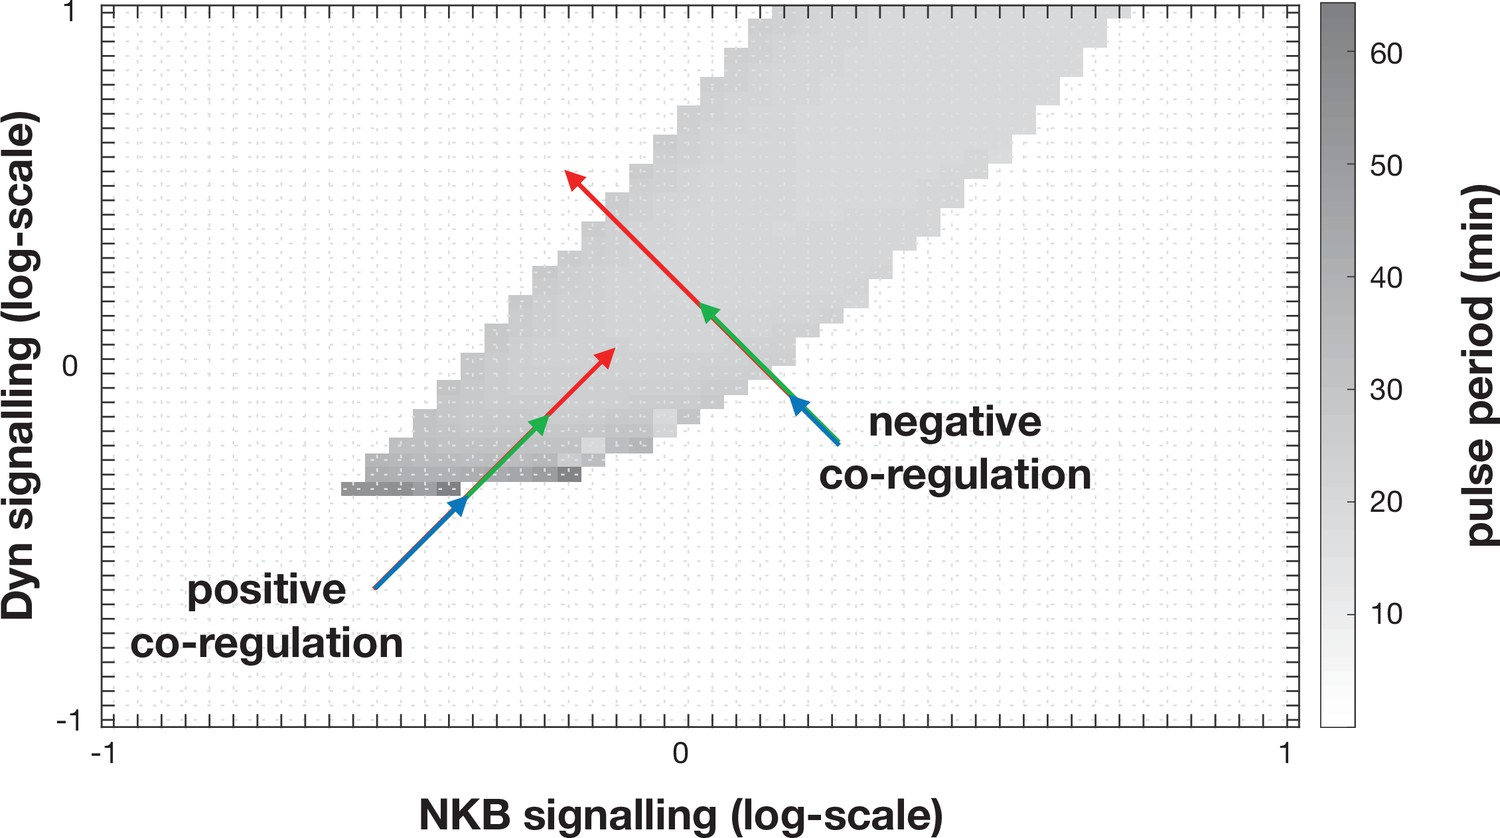
Dynamic behaviour of the KNDY system as a function of dynorphin and NKB singalling.
Positive correlation in the regulation of these two parameters (see positive co-regulation arrows) allows robust control over the system’s dynamics, that is, large enough changes (regardless their actual magnitude) will move the system from the quiescent into the pulsatile regime. Negative correlation in the regulation of the two parameters (see negative co-regulation arrows) makes system dynamics more sensitive to the magnitude of the change (arrow length), for example, large changes can fail to trigger LH pulses.
Tables
Table 1
Model parameters values.
| No | Parameter | Description | Value | Ref. |
|---|---|---|---|---|
| 1 | Dyn degradation rate | 0.25 min–1 | Voliotis et al., 2019 | |
| 2 | NKB degradation rate | 0.25 min–1 | Voliotis et al., 2019 | |
| 3 | Firing rate reset rate | 10 min–1 | Qiu et al., 2016 | |
| 4 | Dyn singalling strength | inferred | ||
| 5 | NKB signalling strength | inferred | Ruka et al., 2016 | |
| 6 | Network excitability | inferred | ||
| 7 | Maximum rate of neuronal activity increase | 30000 spikes min–2 | Qiu et al., 2016 | |
| 8 | Dyn IC50 | 0.3 nM | Yasuda et al., 1993 | |
| 9 | NKB EC50 | 32 nM | Seabrook et al., 1995 | |
| 10 | Firing rate for half-maximal NKB and Dyn secretion | 1200 spikes min–1 | Dutton and Dyball, 1979 | |
| 11 | Basal activity | inferred | ||
| 12 | e | NKB-independent contribution to network excitability | inferred |
Additional files
Download links
A two-part list of links to download the article, or parts of the article, in various formats.
Downloads (link to download the article as PDF)
Open citations (links to open the citations from this article in various online reference manager services)
Cite this article (links to download the citations from this article in formats compatible with various reference manager tools)
Modulation of pulsatile GnRH dynamics across the ovarian cycle via changes in the network excitability and basal activity of the arcuate kisspeptin network
eLife 10:e71252.
https://doi.org/10.7554/eLife.71252


