Suppression weakens unwanted memories via a sustained reduction of neural reactivation
- Max Planck Institute for Human Cognitive and Brain Sciences, Germany
Figures
Figure 1
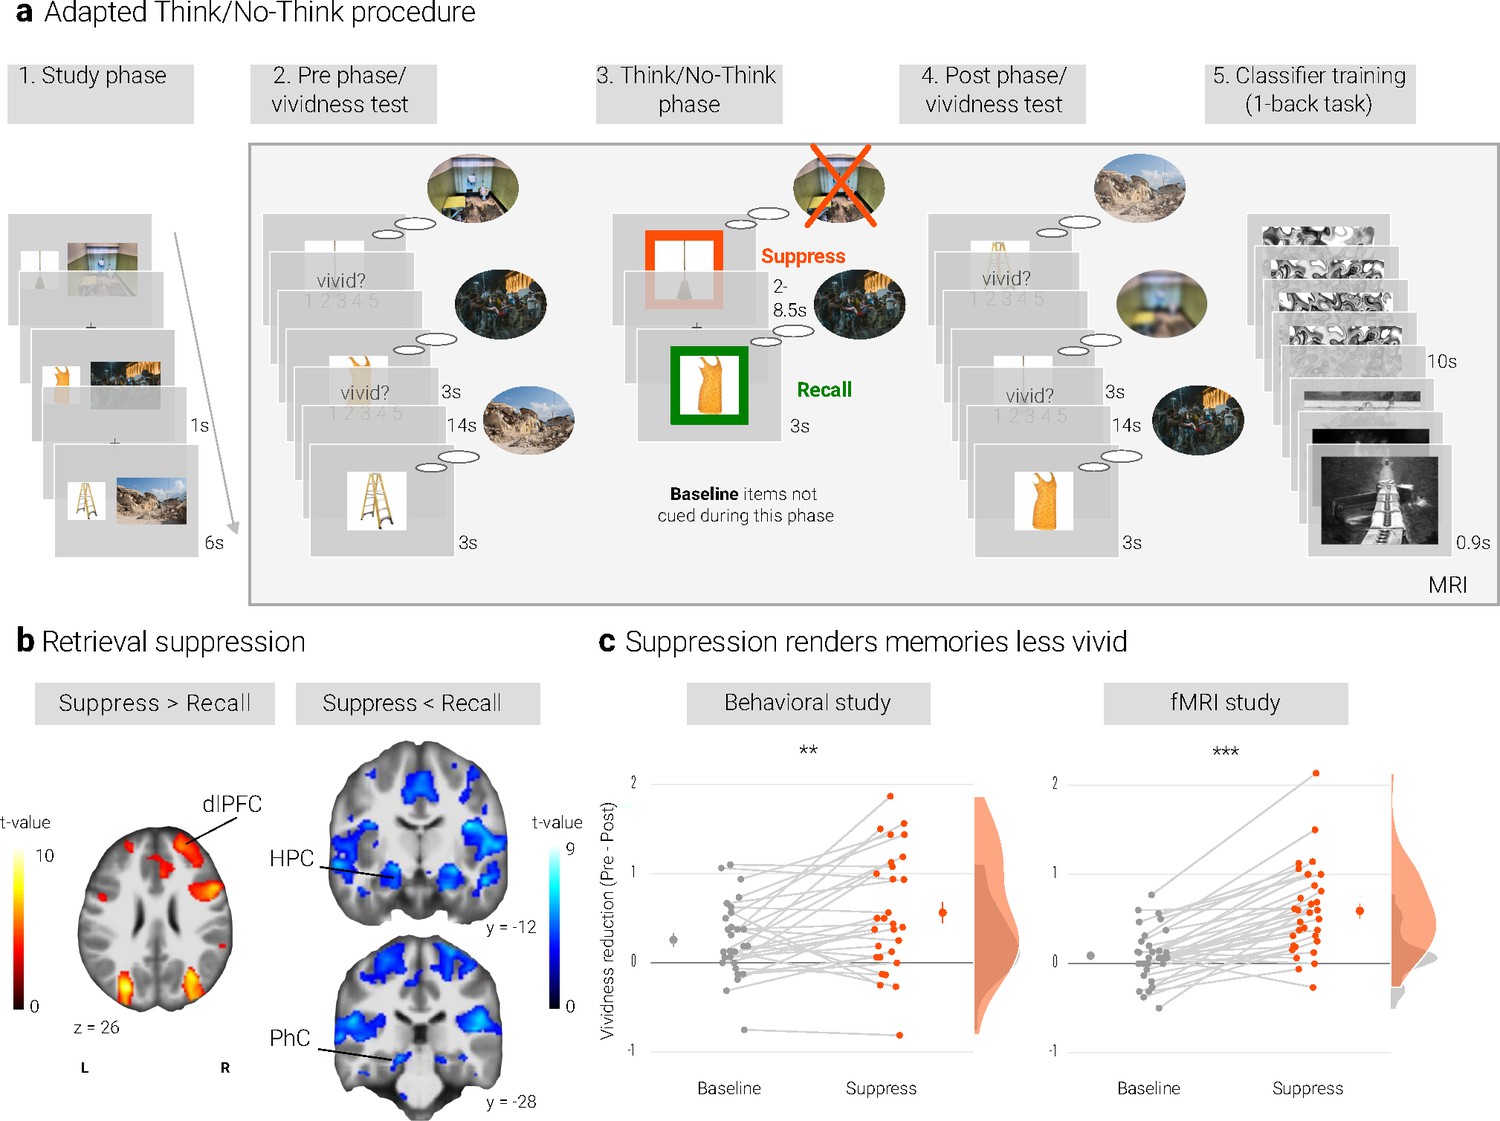
Experimental procedure, univariate MRI, and behavioral results.
(a) Illustration of the adapted Think/No-Think procedure. Participants studied associations between unique objects and aversive scenes. Both during a pre- and a post-test, they covertly recalled all the scenes in response to the objects and rated the vividness of their recollection. In between these two tests, they performed the Think/No-Think phase. Specifically, for objects presented in a green frame, participants repeatedly recalled the associated scene (recall condition). By contrast, for objects presented in a red frame, they suppressed the retrieval of the associated scene (suppress condition). Note that we did not present a third of the objects during this phase (baseline condition). Afterwards, participants performed a one-back task that served to train a pattern classifier in detecting evidence for scene reactivation. Finally, participants once more recalled the memories outside the MRI scanner (now shown in this figure). The complete experimental procedure is comprehensively described in the methods. (NB) Following the IAPS user agreement, we have replaced the original pictures with similar scenes for this figure. In the original stimulus set, each object cue also features in its paired scene. (b) The suppression phase yielded the typical activity pattern associated with retrieval suppression, including greater activation in the right dorsolateral prefrontal cortex (dlPFC) and reduced activation in the hippocampus (HPC) and parahippocampal cortex (PhC) during suppress versus recall trials. For display purposes, the images are thresholded at p < .001, uncorrected, with a minimum cluster size of 50 voxels. (c) Suppression caused a reduction in self-reported vividness from the pre- to post-test that exceeded any change due to the passage of time as indexed by the baseline condition. This effect replicated across the fMRI study (n = 33) and a behavioral study (n = 30) with an independent sample. Large dots indicate the mean, error bars the standard error of the mean. *** p < .001, ** p < .01, * p < .05.
Figure 2
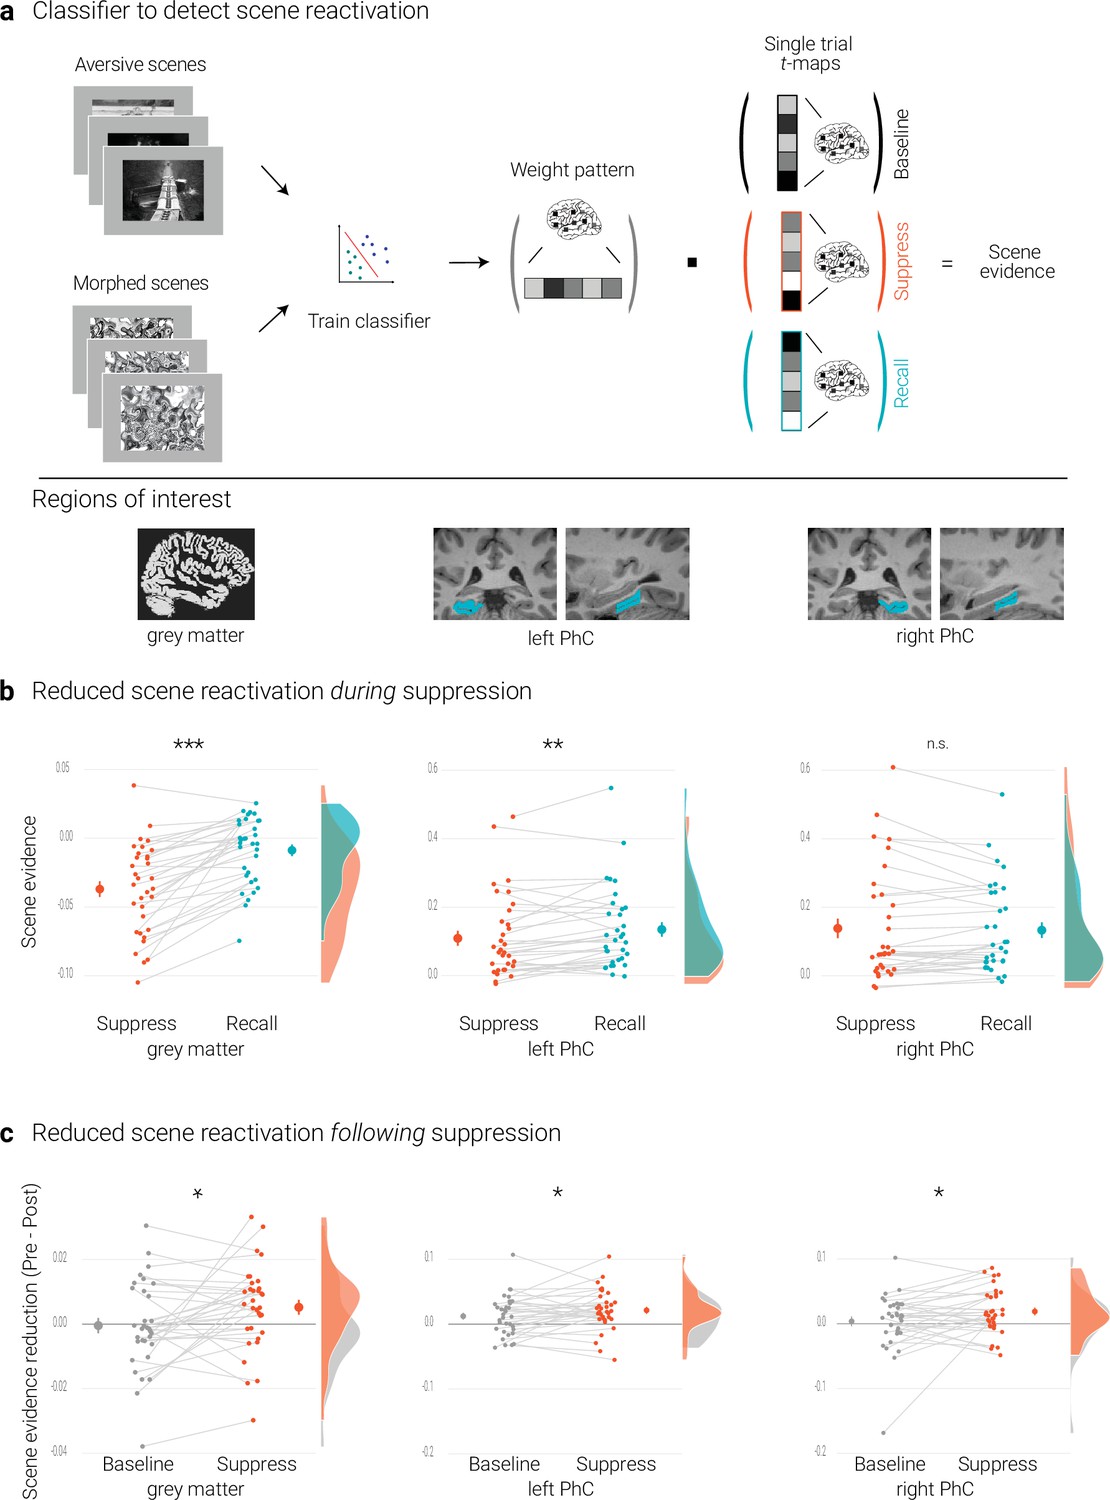
Effects of suppression on scene reactivation.
(a) A linear support vector machine was trained on data of an independent task to discriminate neural activity patterns associated with the perception of intact versus morphed aversive scenes. (NB) Following the IAPS user agreement, we have replaced the original pictures with similar scenes for this figure. The dot product of the resulting weight pattern and single-trial t-maps was used as a proxy for reactivated scene information. We compared such scene evidence between conditions globally across the grey matter and more locally in the left and right parahippocampal cortices (PhC, manually segmented on the individual structural images). (b) Across the grey matter and locally in left PhC, there is less scene evidence while participants suppress than recall scene memories. (c) The suppression-induced reduction in scene evidence lingers on after suppression: scene evidence decreases from the pre- to the post- test for suppressed memories but not for baseline memories. This was the case across the grey matter and in the PhC. Larger dots indicate the mean, error bars the standard error of the mean. *** p < .001, ** p < .01, * p < .05, n = 33.
Figure 3
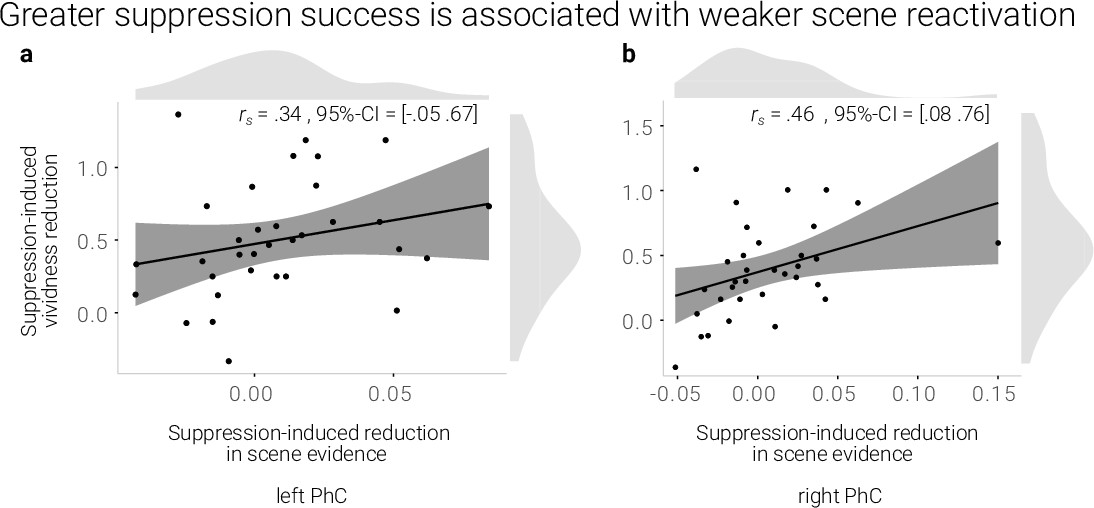
A greater suppression-induced reduction in vividness is associated with a greater suppression-induced reduction in scene evidence in right PhC as indicated by a robust skipped Spearman's correlation.
The left PhC showed a non-significant trend only for this effect. Black lines indicate linear regression lines, dark grey shades indicate 95%- confidence intervals, PhC: parahippocampal cortex.
Figure 4
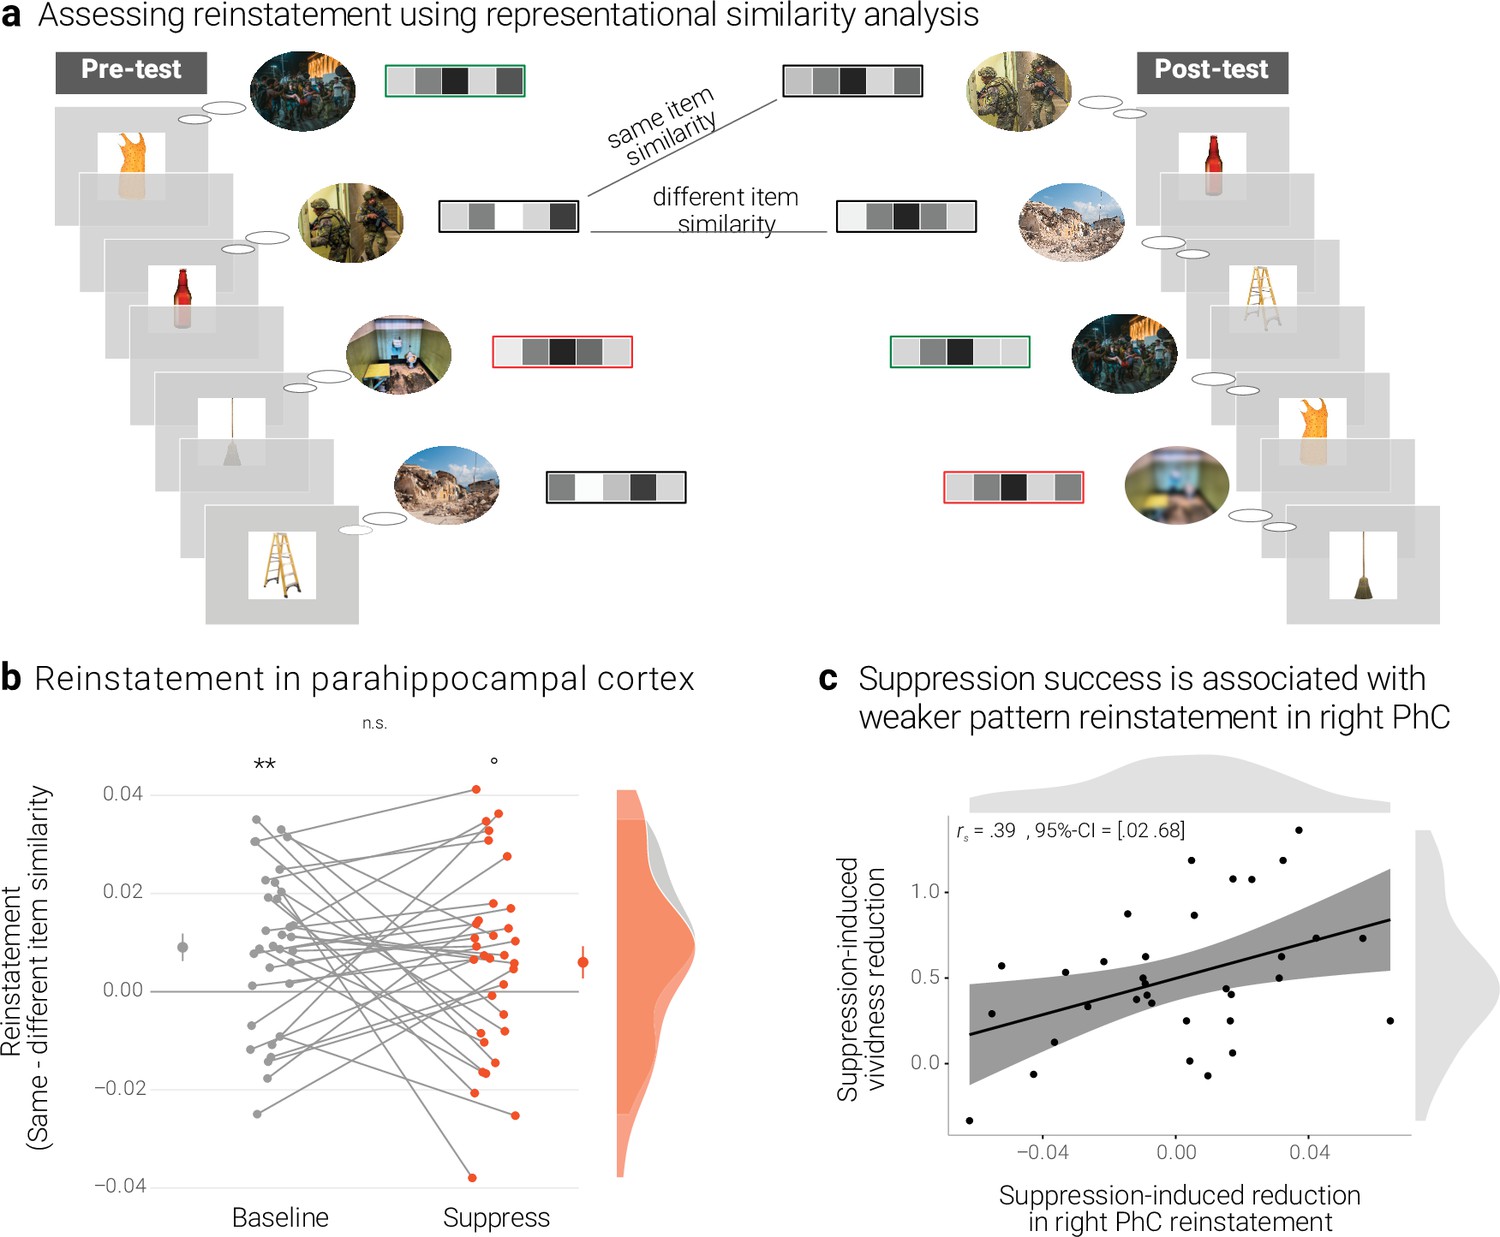
Effects of suppression on individual memory representations.
(a) We estimated the reinstatement of the neural memory representations by assessing the similarity of the activity patterns across the pre- and the post-test. We take the difference between the same-item and different-item similarity as an index of neural reinstatement. (NB) Following the IAPS user agreement, we have replaced the original pictures with similar scenes for this figure. (b) In the PhC, the difference between same- and different-item similarity was significant for the baseline memories. These memories thus seem to have been consistently reinstated across the two tests. By contrast, the suppressed memories only showed a trend for this effect, though the critical interaction was not significant. Large dots indicate the mean, error bars the standard error of the mean. (c) A greater suppression-induced reduction in vividness was associated with a greater suppression-induced reduction in reinstatement in the right PhC (as indicated by a robust skipped Spearman's correlation). Black lines indicate linear regression lines, dark grey shades indicate 95% - confidence intervals, PhC: parahippocampal cortex. ** p < .01, * p < .05, ° p < .1, n = 33.
Appendix 1—figure 1
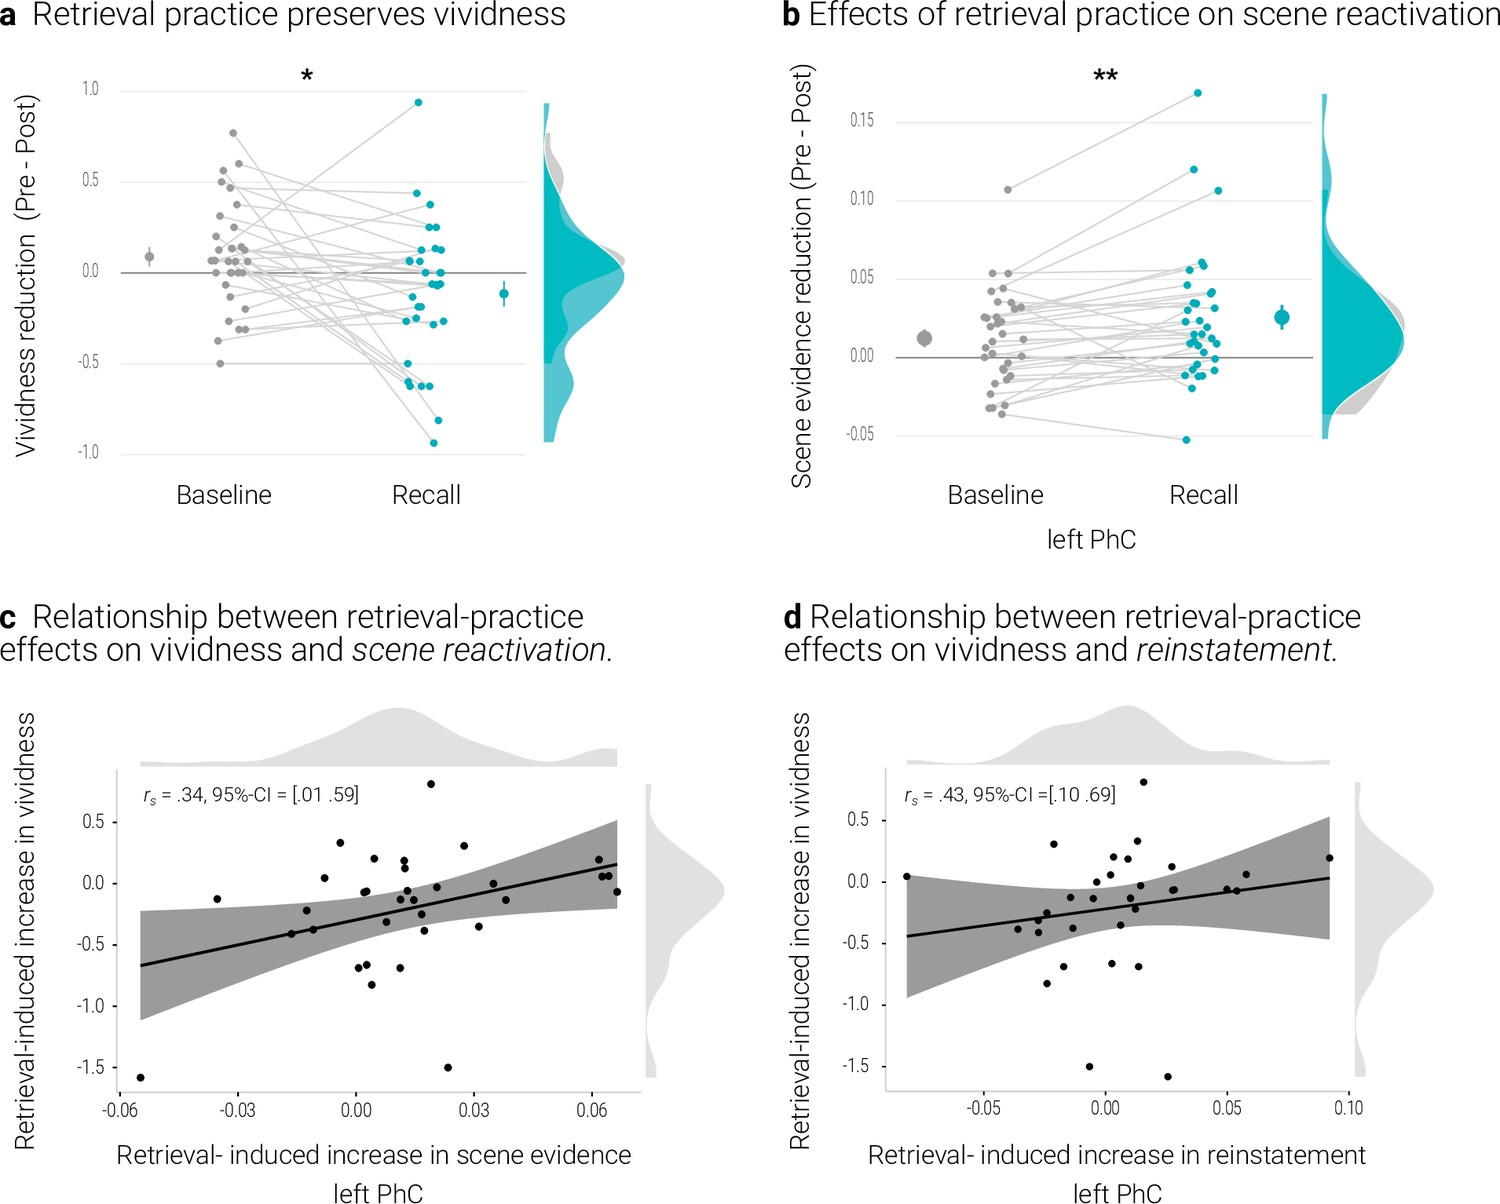
Effects of retrieval practice.
(a) Retrieval retained vividness from the pre- to post-test as compared with the baseline condition. (b) Retrieval induced a reduction in scene evidence in left PhC: scene evidence decreased from the pre- to the post- test for recalled memories but not for baseline memories. Larger dots indicate the mean, error bars the standard error of the mean. (c) A greater above-baseline increase in vividness is associated with a greater above-baseline increase in scene evidence in left PhC as indicated by a robust skipped Spearman’s correlation. (d) This greater above-baseline increase in vividness is also associated with a greater above-baseline increase in reinstatement in left PhC. Black lines indicate linear regression lines, dark grey shades indicate 95% - confidence intervals, PhC: parahippocampal cortex. ** p < .01, * p < .05, n = 33.
Tables
Table 1
Software resources used.
| Designation | Source/ Reference | Identifier |
| R version 4.0.3,RStudio | R Project for Statistical Computing | https://www.r-project.org/ |
| MATLAB, 2017 | Mathworks | https://mathworks.com/ |
| Psychtoolbox 3 | Pelli, 1997 | https://psychtoolbox.org/ |
| FMRIPrep | Poldrack Lab,Standford University | https://fmriprep.org/en/1.5.0/ |
| SPM12 | Wellcome Centre for Neuroimaging, UCL | https://fil.ion.ucl.ac.uk/spm/ |
| The decoding toolbox | Hebart et al., 2014 | https://sites.google.com/site/tdtdecodingtoolbox/ |
| RSA toolbox | Nili et al., 2014 | https://github.com/rsagroup/rsatoolbox |
| ITK-SNAP | Yushkevich et al., 2006 | http://itksnap.org/ |
Appendix 1—table 1
Demographic information.
| Study | Sample size | Age in yearsM(SD) | TCAQ | BDI | STAI-S | STAI-T |
|---|---|---|---|---|---|---|
| Behavioral Study | 30(15 female) | 23.83 (1.76) | 81.61 (15.11) | |||
| fMRI study | 33(17 female) | 24.85 (2.14) | 87.94 (16.2) | 4.27 (5.06) | 34.78 (8.37) | 35.78 (8.87) |
-
Note: Of the questionnaire data, exploratory analyses only suggested a relationship between the TCAQ and suppression-induced reductions in vividness. There was a trend for a skipped Spearman correlation in the MRI study (r = 0.32, 95% CI = [–0.08 0.58]) and a significant correlation across the two studies (r = 0.27, 95% CI = [0.004 0.49]).
Appendix 1—table 2
Control regions: Suppress >Recall.
| Region | ~BA | Hemi-sphere | Voxels | x | MNIy | z | t-value |
|---|---|---|---|---|---|---|---|
| Occipital, inferior temporal | 18 | L | 10,034 | -28 | -88 | 10 | 10.83 |
| 19 | L | -46 | -80 | -8 | 10.26 | ||
| 19 | L | -30 | -90 | 20 | 9.79 | ||
| Occipital, inferior temporal | 18 | R | 9,037 | 40 | -90 | 4 | 9.03 |
| 37 | R | 36 | -44 | -18 | 8.82 | ||
| 7 | R | 30 | -68 | 30 | 8.68 | ||
| Superior & middle frontal * | 6 | L/R | 10,089 | 8 | 22 | 62 | 8.89 |
| 13 | R | 28 | 20 | -12 | 8.59 | ||
| 6 | R | 48 | 6 | 28 | 7.84 | ||
| Thalamus | L/R | 681 | 2 | -6 | 18 | 6.54 | |
| R | 4 | -22 | 18 | 5.48 | |||
| R | 12 | -14 | 18 | 5.07 | |||
| Inferior frontal | 13 | L | 723 | -36 | 20 | -4 | 6.51 |
| 13 | L | -30 | 20 | -12 | 6.51 | ||
| 45 | L | -42 | 22 | 8 | 6.51 | ||
| Middle frontal | 6 | L | 738 | -48 | 4 | 30 | 6 |
| 6 | L | -56 | 8 | 44 | 5.12 | ||
| 6 | L | -48 | 14 | 42 | 4.95 | ||
| Orbitofrontal | 47 | L | 166 | -34 | 46 | -14 | 4.88 |
| 47 | L | -46 | 44 | -14 | 4.5 | ||
| Superior & middle frontal | 9 | L | 219 | -24 | 46 | 34 | 4.59 |
| 10 | L | -24 | 50 | 26 | 4.59 | ||
| 10 | L | -30 | 56 | 20 | 4.03 |
-
Note. Thresholded at p < .05, FWE cluster corrected, with a cluster forming threshold of p < .001; local maxima more than 8 mm apart, minimum of 10 voxels. BA = Brodmann area.
-
*
includes peak for direct suppression by Benoit and Anderson, 2012
Appendix 1—table 3
Modulated regions: Suppress <Recall.
| Region | ~BA | Hemisphere | Voxels | x | MNIy | z | t-value |
|---|---|---|---|---|---|---|---|
| Cuneus, precuneus, HPC, amygdala, PhC | 19 | L/R | 31,631 | -10 | -82 | 34 | 9.88 |
| 23 | L | 12 | -56 | 24 | 9.85 | ||
| 18 | L | -18 | -62 | 22 | 9.34 | ||
| Cerebellum | L | 185 | 12 | -52 | -62 | 5.59 | |
| L | 22 | -48 | -52 | 5.22 | |||
| L | 18 | -58 | -48 | 4.2 |
-
Note. Thresholded at p < .05, FWE cluster corrected, with a cluster forming threshold of p < .001; local maxima more than 8 mm apart, minimum of 10 voxels. BA = Brodmann area, HPC = Hippocampus, PhC = Parahippocampal cortex.
Appendix 1—table 4
Suppression-induced reductions in univariate brain activity: (BaselinePost > SuppressPost) > (BaselinePre > SuppressPre).
| Region | ~BA | Hemi-sphere | Voxels | x | MNIy | z | t-value |
|---|---|---|---|---|---|---|---|
| Middle temporal, fusiform, inferior occipital | 37 | R | 290 | 54 | -70 | 2 | 6.17 |
| Precentral, Postcentral | 6 | L | 344 | -64-34 -28 | -18-14-34 | 446270 | 5.375.234.72 |
| Lingual | 18/19 | R | 132 | 2026 | -76-70 | -4-4 | 5.224.18 |
| Supplementary motor area | 6 | L | 180 | -6-14-10 | -14-16-6 | 564650 | 5.074.883.87 |
| Middle Temporal | 19 | L | 156 | -52-40 | -70-70 | 812 | 4.814.25 |
| Hippocampus | R | 133 | 302416 | -6-14-8 | -2616-18 | 4.674.553.97 | |
| Superior occipital | 19 | L | 126 | -18-12 | -84-84 | 3434 | 4.594.59 |
| Lingual, cerebellum | 37/19 | R | 118 | 263020 | -44-56-54 | -10-24-12 | 4.254.363.96 |
-
Note. Thresholded at p < .05, FWE cluster corrected, with a cluster forming threshold of p < .001; local maxima more than 8 mm apart, minimum of 10 voxels. BA = Brodmann area.
Appendix 1—table 5
Results of candidate control regions.
| ROI | Classifier accuracyM (SD) | Reduced scene reactivation following suppression | Correlation between suppression-induced reductions in scene reactivation and in vividness | Reinstatement: same-item similarity >different item similarity | Correlation between suppression-induced reductions in reinstatement and in vividness |
|---|---|---|---|---|---|
| Amygdala | 62.4% (21.2)t(32) = 3.6,p = .002 | MB pre = –0.001MB post = –0.003MS pre = –0.003MS post = –0.007F(1,32) = 1.13,p = .29 | r = 0.06,95% CI = [–0.35 0.43] | MB same = 0.021MB different = 0.018MS same = 0.019MS different = 0.022F(1,32) = 0.34,p = .56 | r = –0.02,95% CI = [–0.38 0.35] |
| Angular gyrus | 76.8% (16)t(32) = 9.6,p < .001 | MB pre = –0.030MB post = –0.023MS pre = –0–028MS post = –0–021F(1,32) = 0.0,p = .97 | r = 0.49,95% CI = [–0.04 0.67] | MB same = 0.146MB different = 0.125MS same = 0.132MS different = 0.123F(1,32) = 2.1,p = .16 | r = 0.1,95% CI = [–0.23 0.41] |
| Precuneus | 80.6% (13.8)t(32) = 12.8,p < .001 | MB pre = 0.004MB post = 0.008MS pre = 0.007MS post = 0.009F(1,32) = 0.15,p = .71 | r = 0.32,95% CI = [–0.05 0.61] | MB same = 0.103MB different = 0.093MS same = 0.108MS different = 0.092F(1,32) = 2.1,p = .16 | r = –0.09,95% CI = [–0.42 0.23] |
| V1 | 70.7% (14.5)t(32) = 8.2,p < .001 | MB pre = –0.096MB post = –0.089MS pre = –0.088MS post = –0.097F(1,32) = 3.29,p = .08 | r = 0.2,95% CI = [–0.21 0.58] | MB same = 0.524MB different = 0.482MS same = 0.542MS different = 0.483F(1,32) = 3.94,p = .056 | r = 0.05,95% CI = [–0.21 0.58] |
-
Note. B = Baseline, S = Suppress. Robust skipped spearman correlations
Appendix 1—table 6
Behavioral results of the final memory test.
| Study | Measure | BaselineM (SD) | SuppressM (SD) | RecallM (SD) |
|---|---|---|---|---|
| Behavioral Study | Identification | 0.94 (0.18) | 0.92 (0.19) | 0.94 (0.18) |
| Gist | 0.52 (0.20) | 0.48 (0.19) | 0.5 (0.19) | |
| Details | 9.24 (2.71) | 9.07 (2.73) | 9.47 (2.84) | |
| fMRI study | Identification | 0.98 (0.05) | 0.96 (0.07) | 0.96 (0.06) |
| Gist | 0.55 (0.15) | 0.54 (0.14) | 0.55 (0.15) | |
| Details | 9.77 (1.61) | 9.66 (1.74) | 9.71 (1.75) |
Additional files
Download links
A two-part list of links to download the article, or parts of the article, in various formats.
Downloads (link to download the article as PDF)
Open citations (links to open the citations from this article in various online reference manager services)
Cite this article (links to download the citations from this article in formats compatible with various reference manager tools)
Suppression weakens unwanted memories via a sustained reduction of neural reactivation
eLife 11:e71309.
https://doi.org/10.7554/eLife.71309


