Time-resolved single-cell sequencing identifies multiple waves of mRNA decay during the mitosis-to-G1 phase transition
- Oncode Institute, Hubrecht Institute – KNAW and University Medical Center Utrecht, Netherlands
Figures
Figure 1 with 2 supplements
A method for time-resolved transcriptome analysis during the cell cycle.
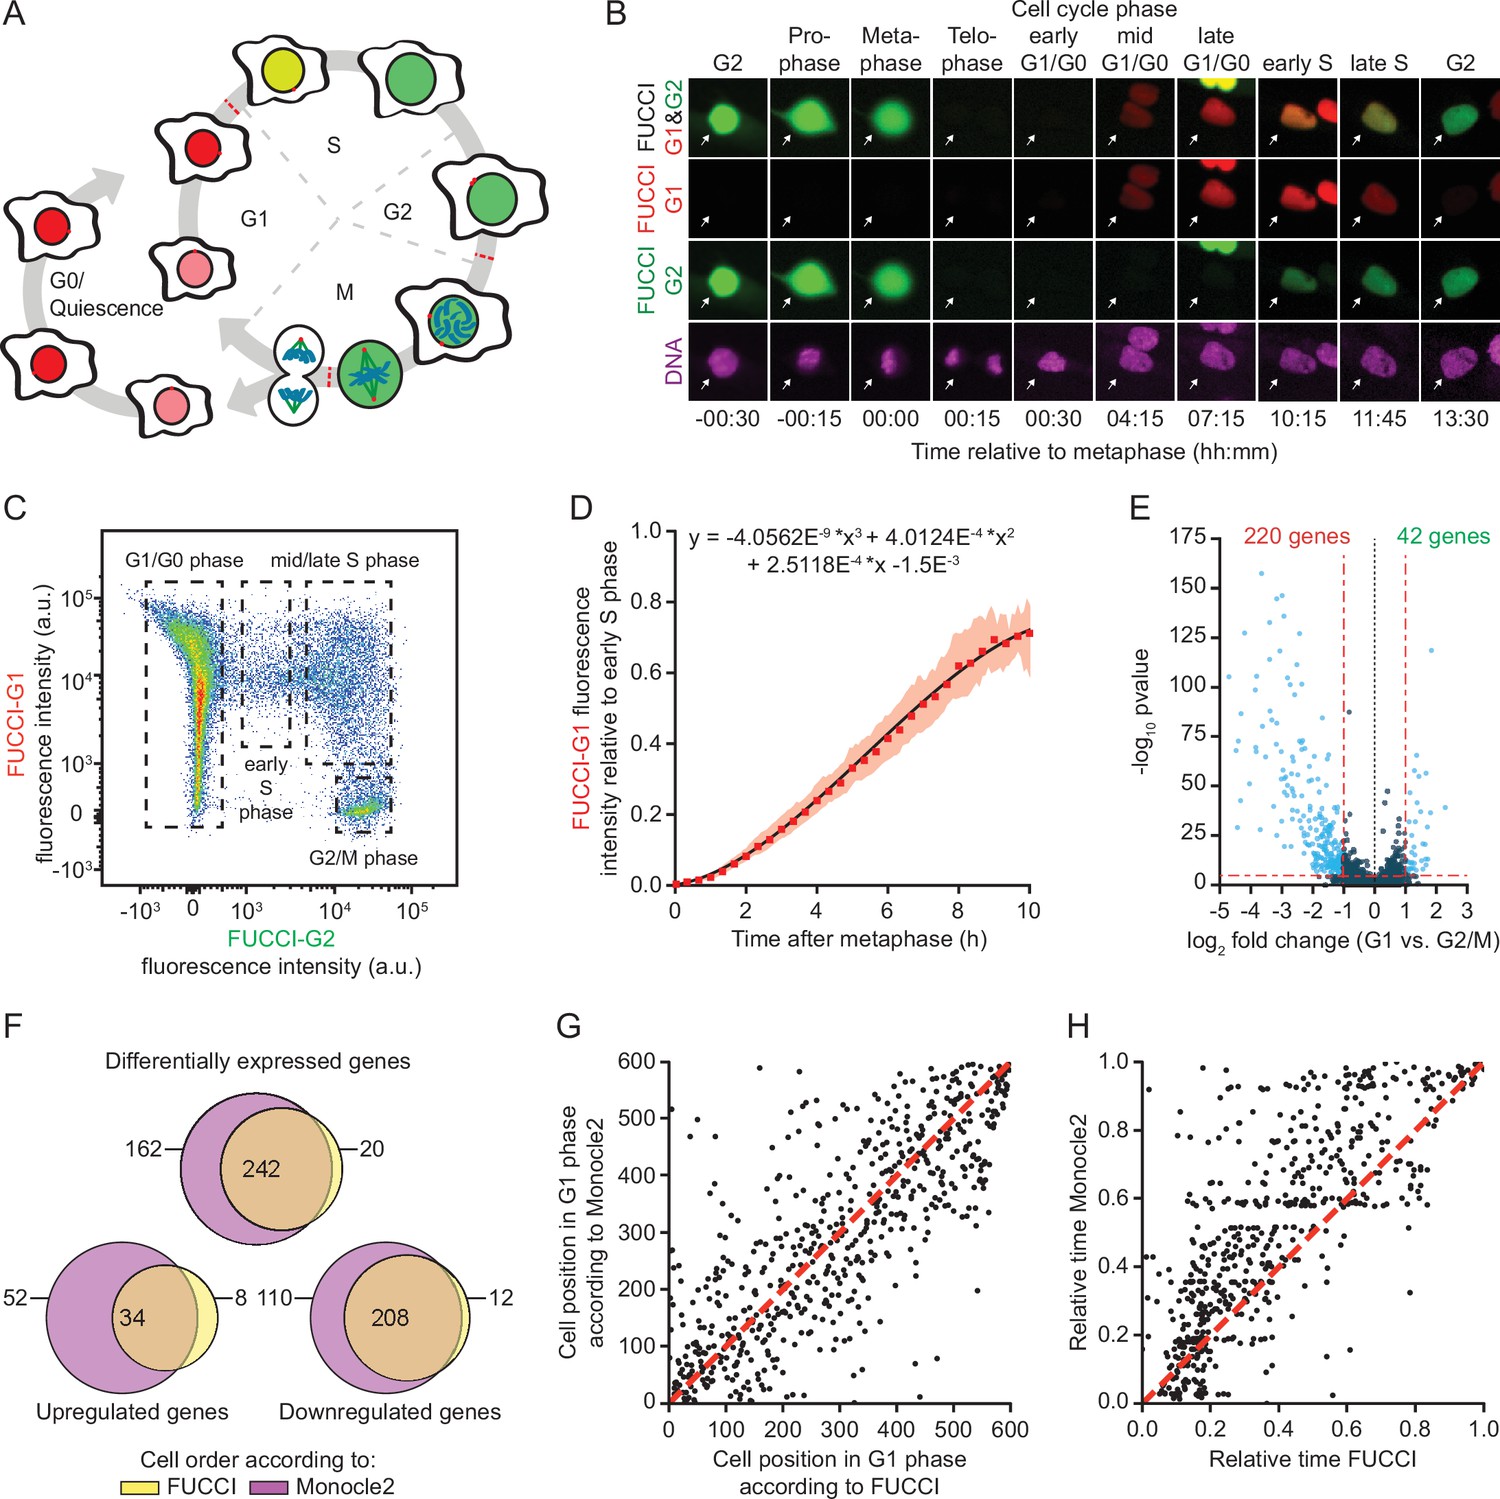
(A) Schematic representation of the human cell cycle and the fluorescent, ubiquitination-based cell cycle indicator (FUCCI) system. (B) Representative images of RPE-FUCCI cells throughout the cell cycle (see Figure 1—video 1). RPE-FUCCI cells were incubated for 2 hr with SPY650-DNA to visualize the DNA. Cells were imaged every 15 min for a duration of 15 hr. Arrows indicate a single cell undergoing a complete cell cycle. (C) Fluorescence activated cell sorting (FACS) analysis of asynchronously growing RPE-FUCCI cells. Dashed boxes indicate the gating strategy used for the identification and isolation of cells in G1/G0, early S phase, mid/late S phase, and G2/M phases. (D) Modeling of FUCCI-G1 fluorescence intensities. Asynchronously growing RPE-FUCCI cells were analyzed by live-cell imaging (Figure 1—figure supplement 1A). Subsequently, FUCCI-G1 fluorescence intensities were measured and normalized to the average FUCCI-G1 fluorescence in early S phase cells (see Materials and methods). Red squares and shading represent the mean fluorescence and SEM, respectively, of three individual experiments. The mean FUCCI-G1 fluorescence was fit to a third-order polynomial (black line, equation above plot). The fit has no biological meaning, but serves to approximate the data to allow calculation of G1 phase cell cycle times based on FUCCI-G1 fluorescence intensity. (E) Differential gene expression analysis of RPE-FUCCI cells in G2/M phase versus G1 phase. Cells were ordered based on FUCCI fluorescence and differential gene expression analysis was performed using Monocle2 (see Materials and methods). (F) Venn diagram comparing differentially expressed genes (both up- and downregulated in G1 versus G2/M phase) identified after FUCCI- or Monocle2-based cell ordering. (G) Comparison of FUCCI- and Monocle2-based ordering of G1 phase cells. Dashed red line indicates identical order of cells. (H) Comparison of G1 phase cell cycle time from FUCCI-based ordering with G1 pseudo time based on trajectory inference by Monocle2. Both FUCCI-G1 phase cell cycle time and Monocle2 G1 pseudo time are normalized to values between 0 and 1 for comparison. Dashed line indicates identical timing of FUCCI and Monocle2.
Figure 1—figure supplement 1
A method for time-resolved transcriptome analysis during the cell cycle.
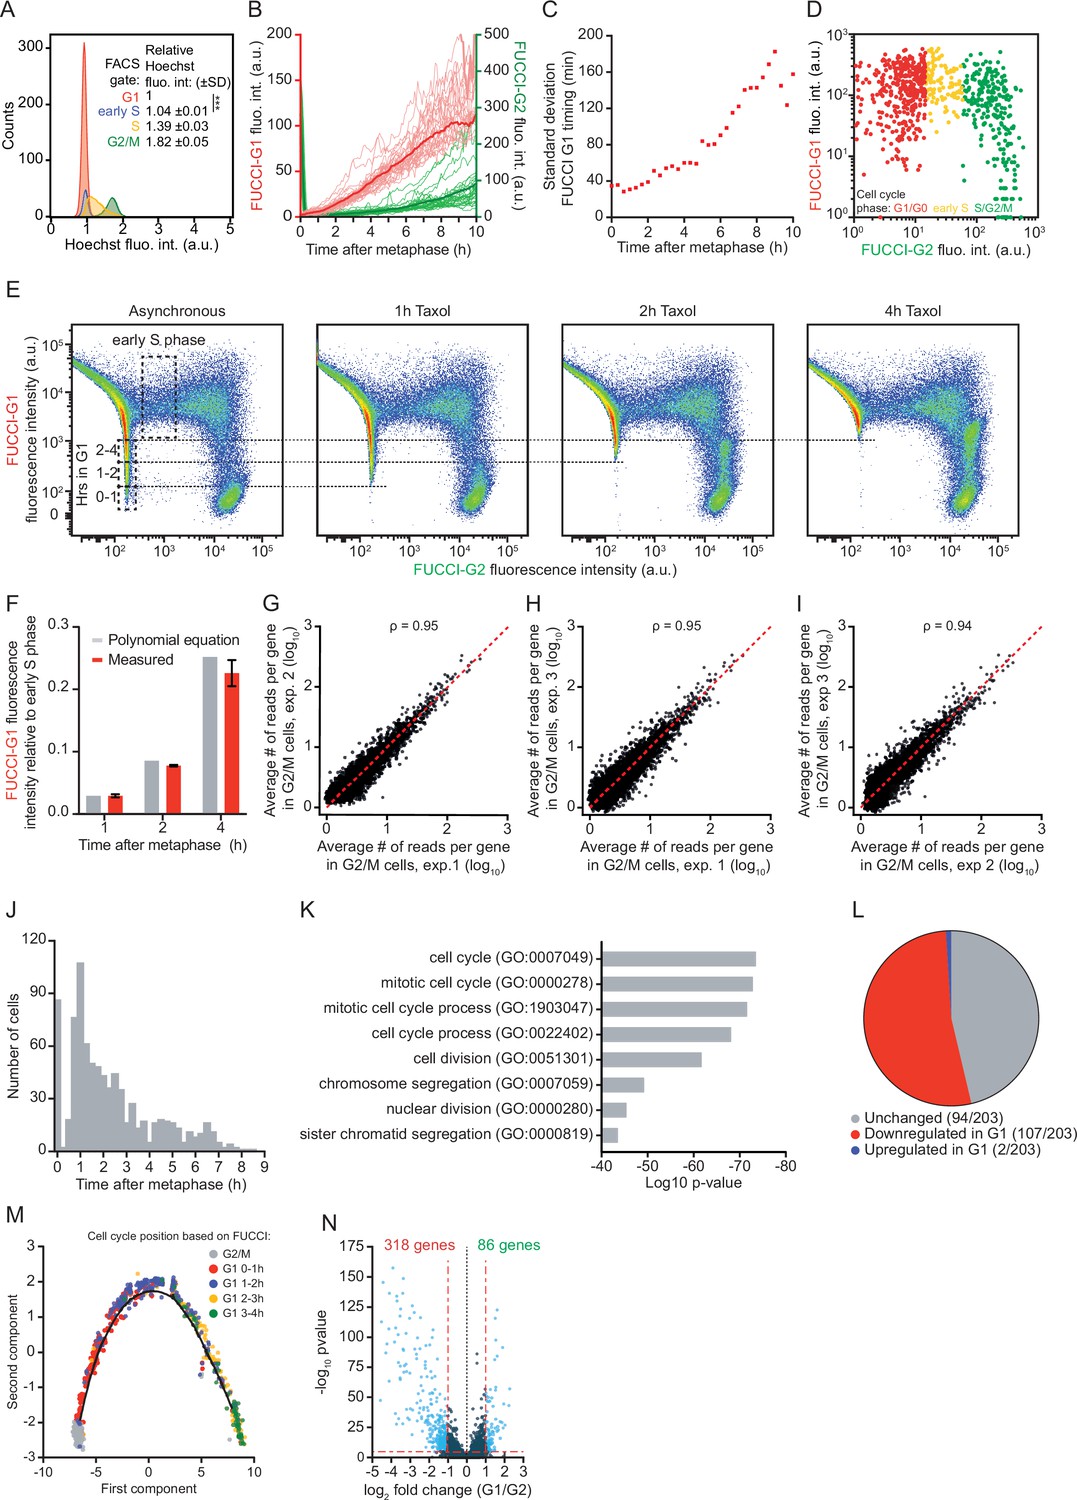
(A) Histogram of the DNA content of RPE-fluorescent, ubiquitination-based cell cycle indicator (FUCCI) cells. RPE-FUCCI cells were stained with Hoechst 33,342 for 30 min before fluorescence activated cell sorting (FACS) analysis. Four different gates were set based on FUCCI fluorescence, gating G1, early S, S, and G2/M phase cells. For each FUCCI-based gate we calculated the average Hoechst fluorescence intensity, relative to the intensity of G1 phase cells. Shown is one representative of three experiments. p-Value is based on a one-tailed unpaired Student’s t-test. p-Value is indicated as *** (p < 0.001). (B) Fluorescence microscopy time traces of RPE-1 cells expressing FUCCI-G1 and FUCCI-G2 markers. Asynchronously growing RPE-FUCCI cells were imaged every 5 min and the average nuclear intensities for both FUCCI markers were measured (red and green lines, respectively). Dark red and green lines represent the average of 30 cells, light red and green lines represent individual cells of one representative experiment of three experiments. For quantification of FUCCI-G1 fluorescence during G1 phase, cells that entered S phase within the 10 hr window post-mitosis were excluded, because the FUCCI-G1 reporter is rapidly degraded upon S phase entry. S phase entry is identified based on an increase in FUCCI-G2 fluorescence (Figure 1A–C and Figure 1—figure supplement 1A). See Supplementary file 2 for the number of cells included in each condition. (C) Measurement error in the G1 phase cell cycle time due to cell-to-cell variability in FUCCI-G1 fluorescence intensities. We calculated the standard deviation of the G1 phase cell cycle time (see Materials and methods). Since cell-to-cell variability in FUCCI-G1 fluorescence increases at later time points in G1 phase (Figure 1D and (B)), the measurement error of G1 phase cell cycle time increases at later time points in G1 phase. Red squares are individual data points. (D) Microscopy-based analysis of FUCCI fluorescence intensities in RPE-FUCCI cells. Early S phase cells were identified based on the presence of high FUCCI-G1 and low FUCCI-G2 fluorescence (yellow dots), and the FUCCI-G1 fluorescence intensity of early S phase cells was recorded (see Materials and methods). A representative experiment is shown (three experiments were performed with at least 700 cells quantified per experiment). (E) FACS plots of FUCCI fluorescence after different durations of Taxol treatment. To quantify the increase in FUCCI-G1 fluorescence over time, asynchronously growing RPE-FUCCI cells were treated with Taxol for the indicated durations to arrest cells in mitosis, thus preventing new cells from entering G1 phase. Over time, FUCCI-G1 fluorescence increases which results in the gradual loss of cells with low FUCCI-G1 fluorescence. The lowest FUCCI-G1 fluorescence intensity after a 1, 2, or 4 hr incubation with Taxol were identified (dotted lines), and used to calculate the FUCCI-G1 fluorescence at various times during G1 phase relative to early S phase (see Materials and methods). (F) Comparison of the relative FUCCI-G1 fluorescence intensities as determined by the polynomial equation (Figure 1D) and by Taxol treatment of cells followed by FACS (see panel S1E) at 1, 2, and 4 hr after mitosis. Bars and error bars indicate average ± SEM of three experiments. (G–I) Comparison of normalized read counts in G2/M from three sequencing experiments. Each dot represents the expression of one gene averaged over all cells in G2/M phase. Dotted red line indicates identical read counts in two experiments. (J) Histogram showing the position in the cell cycle of all cells subjected to single-cell RNA sequencing (scRNA-seq). The position in the cell cycle was determined based on the FUCCI-G1 fluorescence intensity as measured by FACS. (K) Gene Ontology term analysis of genes downregulated in G1 phase compared to G2/M phase. For this analysis, cells were grouped into either G2/M or G1 phase based on FUCCI fluorescence. (L) Pie chart showing the fraction of all genes with known cell cycle functions (derived from Cyclebase 3.0) that are up- or downregulated in G1 phase compared to G2/M phase, or that show no change in expression. (M) Single-cell trajectory of the mitosis-to-G1 (M-G1) phase transition constructed by Monocle2. Colors indicate the cell cycle position based on FUCCI-G1 fluorescence. (N) Differential transcriptome analysis of G1 phase versus G2/M phase RPE-FUCCI cells, aligned based on Monocle2 trajectory inference.
Figure 1—video 1
Example movie of RPE-1 cells expressing the G1 and G2 fluorescent, ubiquitination-based cell cycle indicator (FUCCI) reporters.
Video of asynchronously growing RPE-FUCCI cells imaged every 15 min. RPE-FUCCI cells were incubated with SPY650-DNA for 2 hr prior to imaging to visualize DNA. To facilitate visualization of the FUCCI reporters, SPY650-DNA is not shown in the video, but is included in the still images shown in Figure 1B.
Figure 2 with 1 supplement

Reduction in mRNA levels occurs in multiple waves, during and after cell division.
(A) Time relative to metaphase of the highest rate of mRNA decrease for the 220 downregulated genes. For each gene a smoothing spline was fit to the data and the moment of maximum negative slope of the spline was determined (see Materials and methods). (B) Average slope of mRNA levels over time for genes that display immediate (thick red line) or delayed decrease (thick blue line). Thin red and blue lines show a random selection of 25 individual genes belonging to the immediate or delayed decrease group, respectively. (C) Validation of the two waves of mRNA decline. RPE-fluorescent, ubiquitination-based cell cycle indicator (FUCCI) cells at different stages of the cell cycle were isolated by fluorescence activated cell sorting (FACS) based on FUCCI fluorescence (see Figure 2—figure supplement 1A for gating strategy). mRNA expression levels of indicated genes was measured by RT-qPCR. Five genes from the immediate decrease group and five genes from the delayed decrease group were selected. Note that the moment of decrease as measured by RT-qPCR closely mirrors the moment of decrease determined by modeling of our single-cell sequencing data (see Supplementary file 1). Lines with error bars represent average ± SEM of three experiments. (D) Example images of TOP2A and CDK1 single molecule fluorescence in situ hybridization (smFISH) at the different stages of mitosis. Asynchronously growing RPE-1 cells were fixed and stained for DNA (DAPI), membranes (WGA), and TOP2A and CDK1 mRNA (using smFISH). Scale bar, 10 µm. (E–F) Quantification of TOP2A (E) and CDK1 (F) transcript number in different stages of mitosis. Each dot represents the average number of transcripts in a single experiment and lines with error bars represent average ± SEM of three experiments (at least 15 cells per experiment per condition analyzed, see Supplementary file 2 for the exact number of cells included). Single-cell TOP2A and CDK1 transcript counts are shown in Figure 2—figure supplement 1B-C. p-Values are based on a one-tailed unpaired Student’s t-test, and are indicated as * (p < 0.05), ** (p < 0.01), *** (p < 0.001), ns = not significant.
Figure 2—figure supplement 1
Reduction in mRNA levels occurs in multiple waves, during and after cell division.
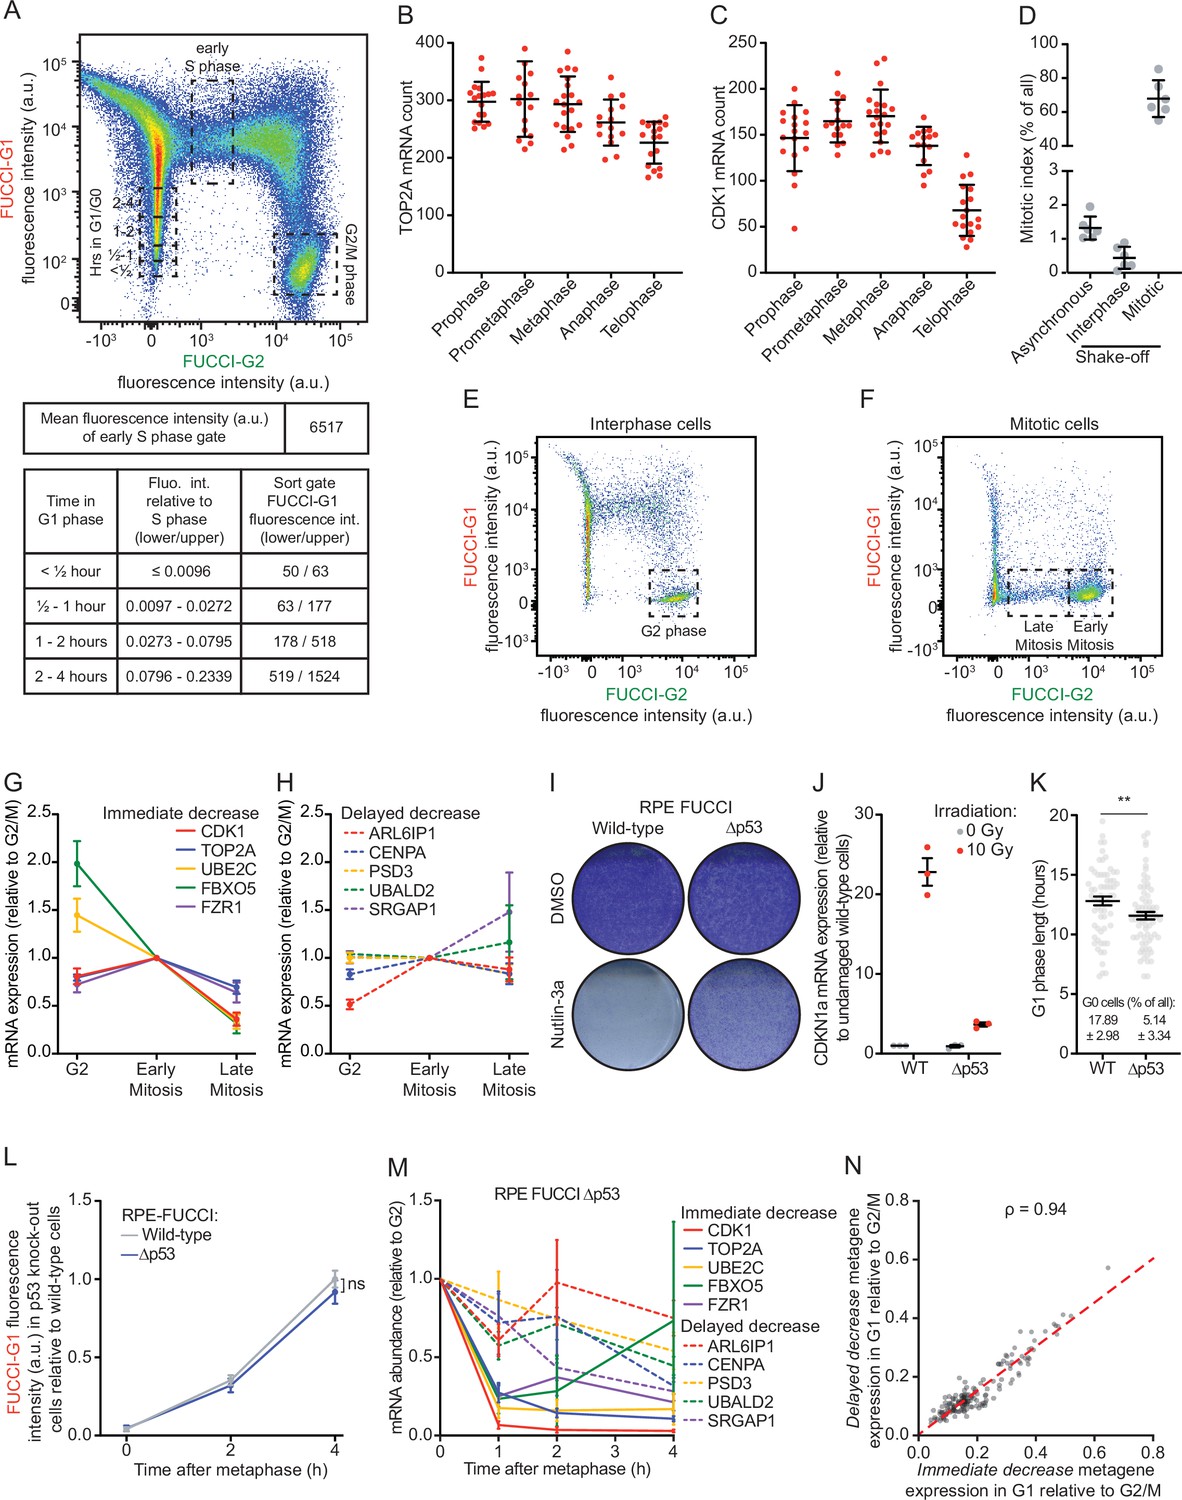
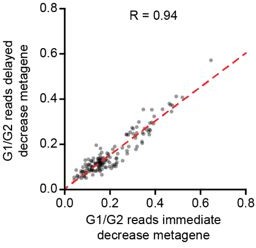
(A) Gating strategy for the identification of G1, early S, and G2 phase cells in fluorescence activated cell sorting (FACS) analysis of asynchronously growing REP-fluorescent, ubiquitination-based cell cycle indicator (FUCCI) cells (top). The tables below the FACS plot display the FUCCI-G1 fluorescence intensity associated with cells at various times in G1 or S phase. The top table shows the mean FUCCI-G1 fluorescence intensity during early S phase obtained. In the lower table, the left column states the time a cell has spent in G1 phase. The middle column indicates the FUCCI-G1 fluorescence intensities relative to cells in early S phase (calculated using the polynomial equation). The right column shows the range in absolute FUCCI-G1 fluorescence intensities in each bin. These intensities were calculated by multiplying the mean FUCCI-G1 fluorescence intensity in early S phase (6517, see top table) by the fluorescence intensity relative to S phase (middle column, lower table). The resulting fluorescence intensity ranges were used to set the sorting gates for the isolation of cells at different times in G1 phase. These gates are indicated in the FACS plot above. (B–C) Quantification of the number of TOP2A (B) and CDK1 (C) transcripts in different phases of mitosis. Each dot represents the number of transcripts in a single cell and lines with error bars represent average ± SD (at least 15 cells per experiment per condition analyzed, see Supplementary file 2 for the exact number of cells included). One representative of three experiments is shown. (D) Fraction of mitotic cells in different isolated cell populations. Cells were either left untreated (asynchronous) or mitotic shake-off was performed to split the cells into two populations: Mitotic cells (collected cells from shake-off that are highly enriched for mitotic cells) and interphase cells (adherent cells remaining after shake-off that are depleted of mitotic cells). After isolation of different populations of cells, cells were fixed and stained with DAPI for DNA content measurements and for the mitosis-specific marker phosphorylated histone 3 ser 10, and the fraction of mitotic cells was determined by FACS for each cell population (see Materials and methods). Lines with error bars represent average ± SD of six experiments. (E–F) FACS strategies to enrich for G2 phase cells (E), early mitotic cells, or late mitotic cells (F). RPE-FUCCI cell populations depleted of mitotic cells (E) or enriched for mitotic cells (F) were isolated as in (D). The population of cells enriched for interphase cells (‘interphase’ in D) was used to isolate G2 phase cells. The population of cells enriched for mitotic cells (‘mitotic’ in D) was used to isolate early and late phase mitotic cells (prometaphase/metaphase and anaphase/telophase, respectively). Early and late mitotic cells were distinguished using FUCCI-G2 fluorescence levels: cells that express high levels of the FUCCI-G2 marker are early mitotic cells and cells that express low levels of the FUCCI-G1 marker are late mitotic cells. (G–H) Relative mRNA levels of indicated genes in G2, early and late mitosis, as measured by RT-qPCR. RPE-FUCCI cells in G2 phase, early and late mitosis were isolated by FACS (see E-F). mRNA expression levels of five genes from the immediate decrease group (G) and five genes from the delayed decrease group (H) were analyzed. Dots and error bars represent average ± SEM of three to five experiments. (I) Crystal violet staining of wild-type and p53 knock-out RPE-FUCCI cells that were treated with Nutlin-3a for 1 week. A representative experiment of two experiments is shown. (J) Validation of p55 knock-out cells. Wild-type and p53 knock-out RPE-FUCCI cells were irradiated using 10 Gy of ɣ-irradiation, or left unirradiated. Five hours later, cells were lysed and CDKN1a expression was analyzed by RT-qPCR. Lines with error bars represent average ± SEM of three experiments. (K) Analysis of G1 phase duration and the fraction of G0 (quiescent) cells in p53 knock-out cells. RPE-FUCCI wild-type or p53 knock-out cells were imaged for at least 21 hr. The duration of G1 phase in cells entering G1 during the first hour of imaging was analyzed. G0 (quiescent) cells are defined as cells that maintain FUCCI-G1 fluorescence for >20 hr. Pooled data of two experiments is shown. Per cell line 20 cells were included per experiment. (L) Accumulation of the FUCCI-G1 fluorescence in wild-type and p53 knock-out RPE-FUCCI cells. Wild-type and p53 knock-out RPE-FUCCI cells were imaged by time-lapse microscopy. FUCCI-G1 fluorescence was determined for cells at metaphase and 2 or 4 hr thereafter. Fluorescence intensities were normalized against the average fluorescence intensity of wild-type cells at 4 hr post-metaphase. Bots and error bars indicate average ± SEM of three experiments. At least 10 cells per condition per experiment were quantified (see Supplementary file 2). (M) Validation of the two waves of mRNA decline. RPE-FUCCI p53 knock-out cells at indicated stages of the cell cycle were isolated by FACS (see A for sorting strategy). mRNA expression levels of indicated genes were measured by RT-qPCR. Five genes from the immediate decrease group and five genes from the delayed decrease group were selected. Dots and error bars represent average ± SEM of three to five experiments. (N) Correlation plot comparing the relative expression of immediate decrease genes to the relative expression of delayed decrease genes in single cells. Cells were selected that have spent at least 4 hr in G1 phase (158 cells in total). For individual cells, we averaged the expression of all genes belonging to either the immediate or delayed decrease groups, thus creating two metagenes. We then normalized the expression of both metagenes to the average expression of either metagene in G2 phase cells. Red dashed line represents the linear model fit to the data. For all panels, p-values are based on an unpaired one-tailed Student’s t-test. p-Values are indicated as * (p < 0.05), ** (p < 0.01), *** (p < 0.001), ns = not significant. See Supplementary file 2 for the exact number of included cells in each condition.
Figure 3 with 1 supplement
mRNA decay occurs during a brief window of time as cells exit mitosis and enter G1 phase.
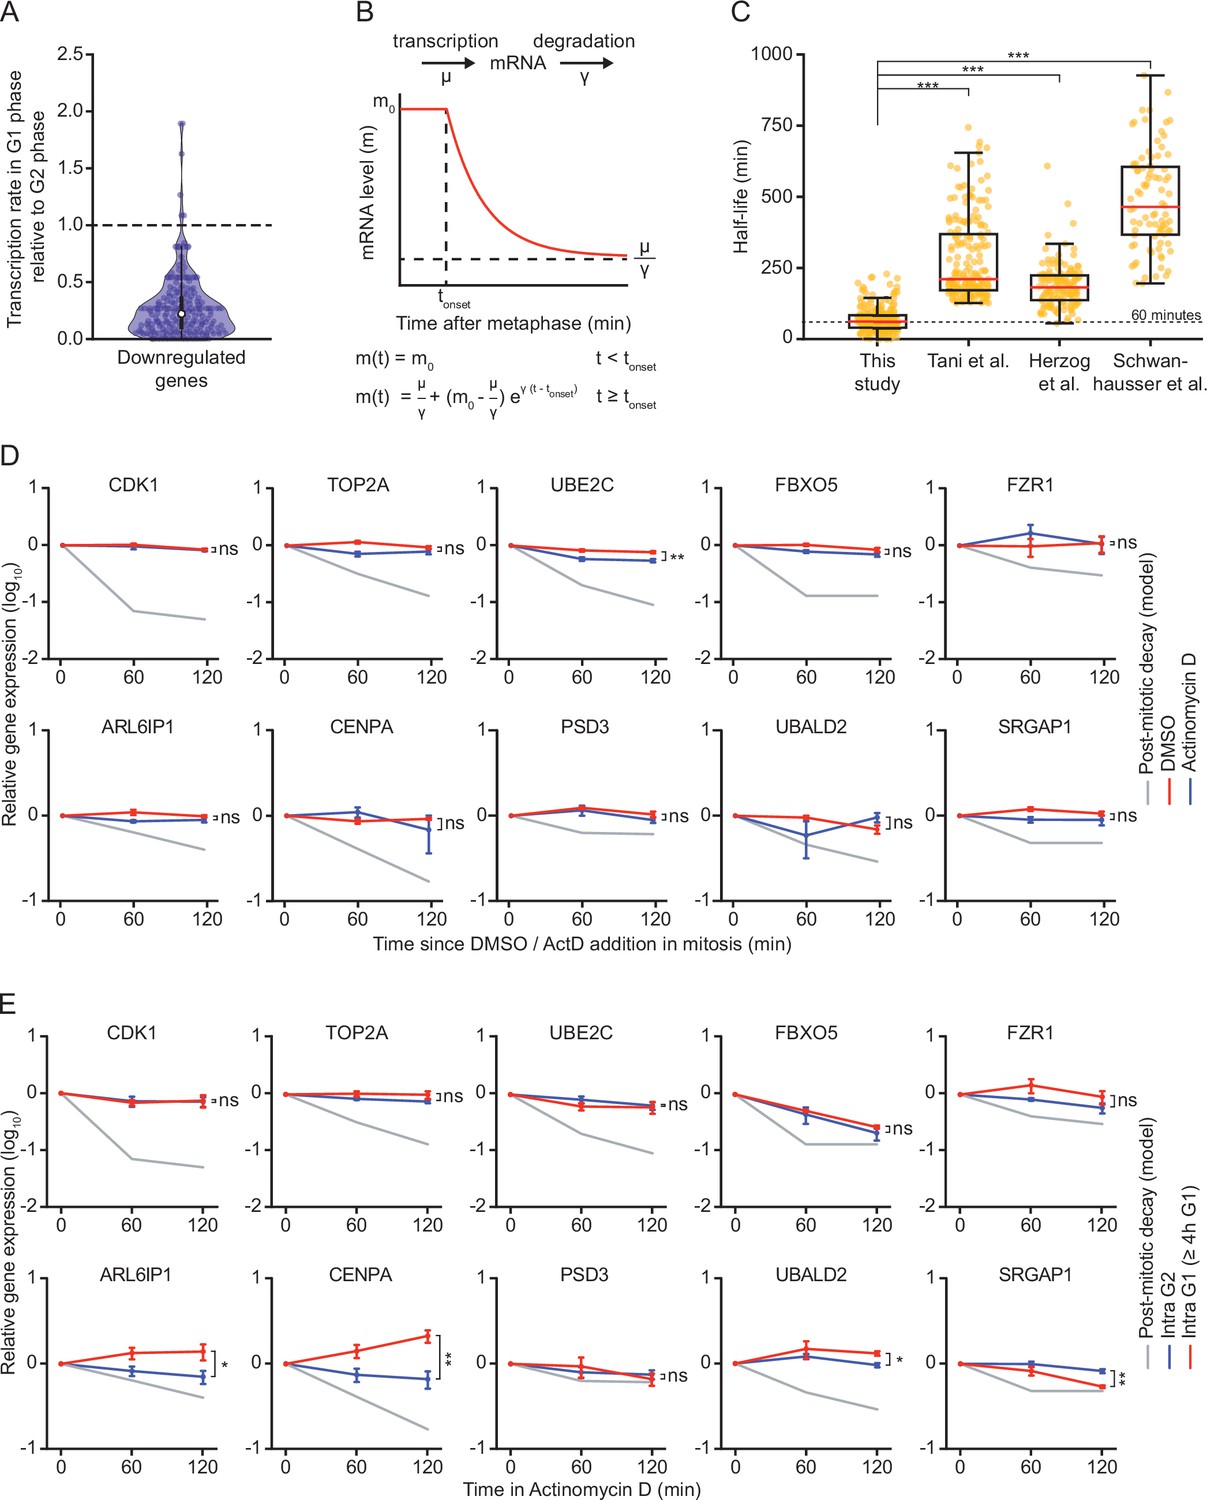
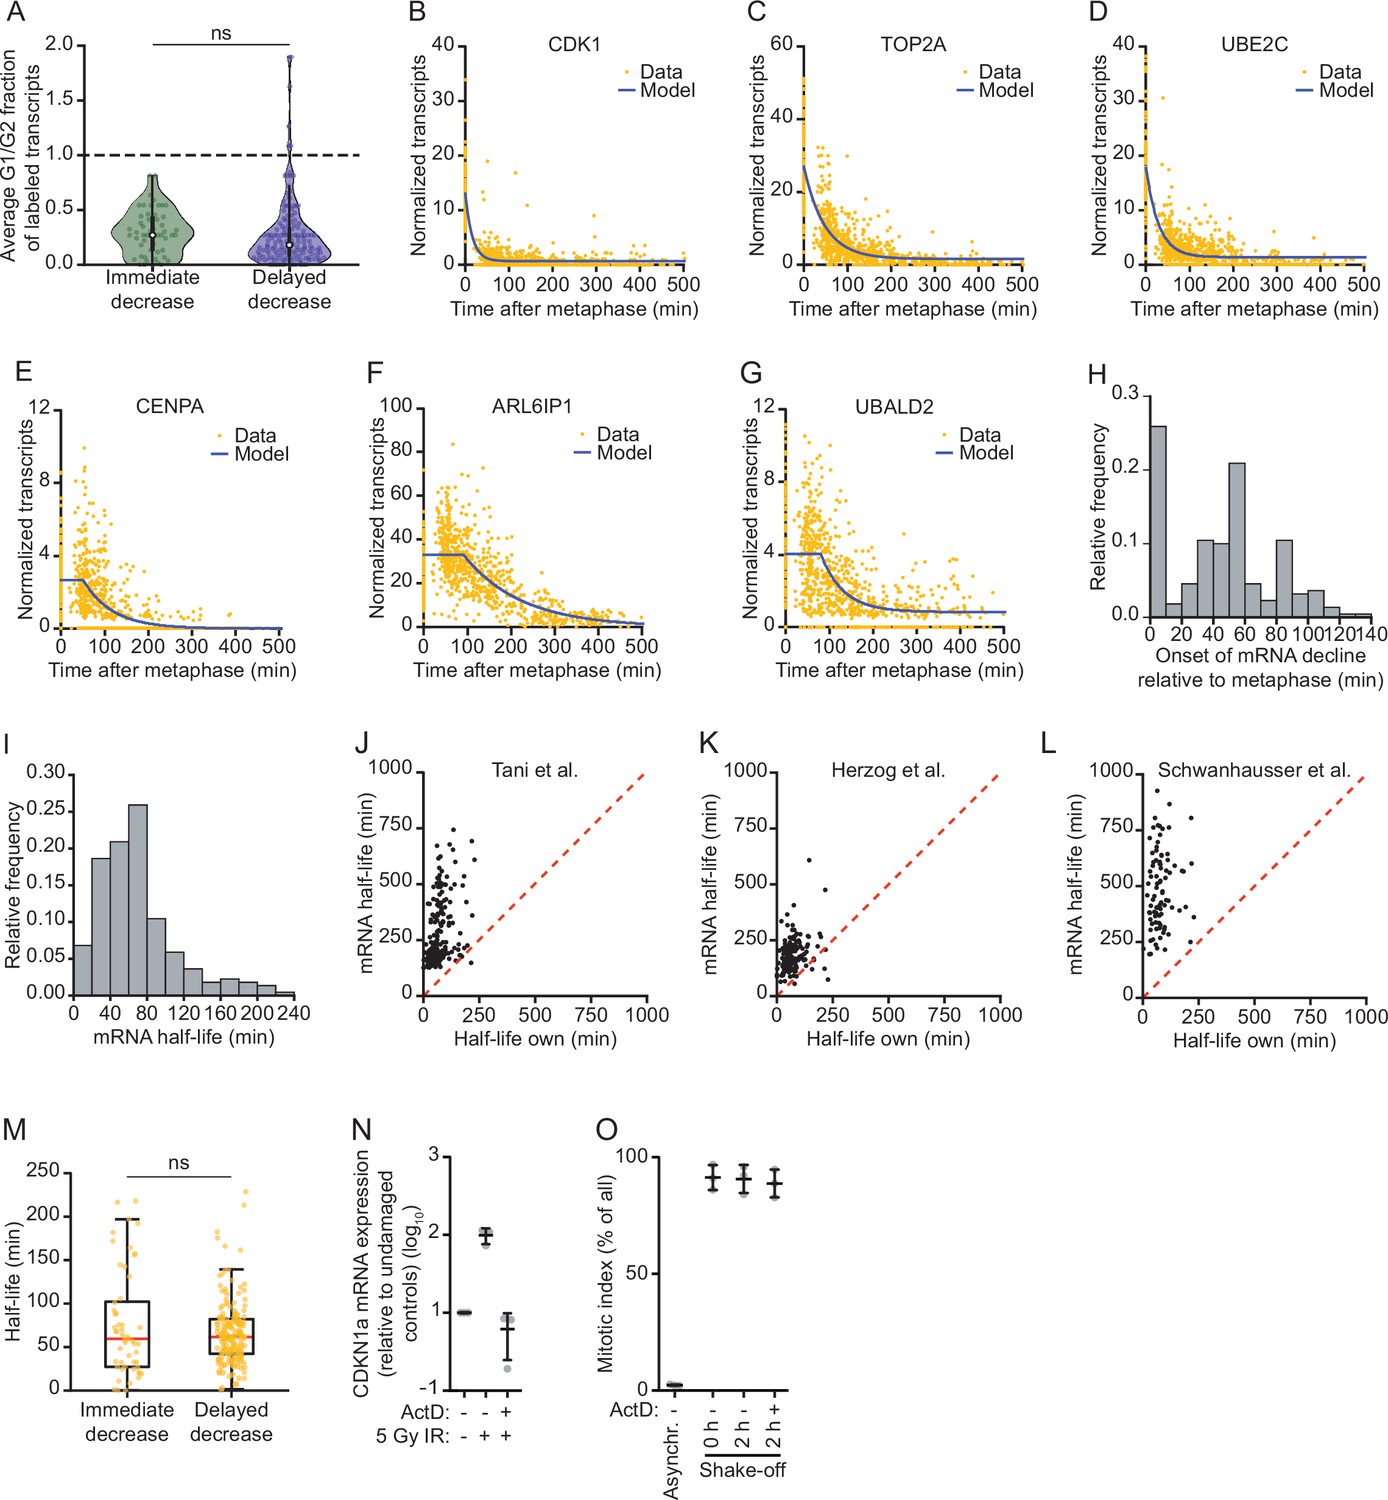
(A) Violin plot showing the ratio of transcription in G1 phase versus G2 phase for the 220 genes that we identified as downregulated in G1 phase. Data were retrieved from Battich et al., 2020. Battich et al. labeled new transcripts for 30 min using EU, and old and new transcripts were quantified using deep sequencing. We defined the relative rate of transcription as the number of labeled transcripts in G1 versus G2 phase. Dashed line indicates a ratio of 1, indicative of a similar transcription rate in G2 and G1 phase (a ratio <1 is indicative of reduced transcription in G1 phase). (B) Schematic of the mathematical model that was used to fit the decrease in mRNA levels as cells progress from mitosis into G1 phase. (C) Boxplot of mRNA half-lives for the genes that were identified as downregulated in G1 phase in our study. Half-lives at the mitosis-to-G1 (M-G1) transition are shown (this study), as well as the half-lives of the same genes determined in asynchronous cell populations in HeLa cells (Tani et al.), mouse embryonic stem cells (Herzog et al.) and mouse fibroblasts (Schwanhausser et al.). (D) Relative mRNA levels in mitosis after different times of transcription inhibition, as measured by RT-qPCR. RPE-1 cells were synchronized in G2 using the CDK1-inhibitor RO-3306. Subsequently, cells were released from RO-3306 into medium containing Taxol, to arrest cells in mitosis. Mitotic cells were collected by mitotic shake-off, and cultured for an additional 2 hr in the presence or absence of the transcription inhibitor Actinomycin D (blue and red lines, respectively). For comparison, mRNA levels during the M-G1 phase transition are shown (gray line). Note that mRNA of indicated genes is stable in mitosis, indicating that mRNA is degraded specifically during the M-G1 phase transition. Lines with error bars indicate average ± SEM of three experiments. (E) Relative mRNA levels in G2 and late G1 phase after different times of transcription inhibition, as measured by RT-qPCR. Asynchronously growing RPE-fluorescent, ubiquitination-based cell cycle indicator (FUCCI) cells were treated with Actinomycin D for indicated times. Cells were then fluorescence activated cell sorting (FACS)-sorted and G2 phase cells and late G1 phase cells (>4 hr into G1 phase) were isolated based on FUCCI reporter fluorescence. The mRNA levels of indicated genes were then measured by RT-qPCR. mRNA levels during the M-G1 phase transition are shown for comparison (gray lines). Note that mRNA levels are substantially less stable in cells during the M-G1 phase transition compared to G2 or late G1 phase cells. Lines with error bars indicate average ± SEM of three experiments. p-Values are based on a one-tailed unpaired Student’s t-test (C-E), and are indicated as * (p < 0.05), ** (p < 0.01), *** (p < 0.001), ns = not significant.
Figure 3—figure supplement 1
mRNA decay occurs during a brief window of time as cells exit mitosis and enter G1 phase.
(A) Violin plot showing the ratio of transcription in G1 phase versus G2 phase for the genes belonging to the immediate decrease or delayed decrease groups (Figure 2A and Supplementary file 1). Data were retrieved from Battich et al., 2020. New transcripts were labeled for 30 min using EU, and old and new transcripts were quantified using deep sequencing. The relative rate of transcription was defined as the number of labeled transcripts in G1 versus G2 phase. Dashed line indicates supplemnetary filea ratio of 1, indicative of a similar transcription rate in G2 and G1 phase (ratios < 1 are indicative of reduced transcription in G1 phase). (B–G) mRNA abundance over time for genes that undergo mRNA decay at the mitosis-to-G1 (M-G1) transition. Blue lines indicate the best fit obtained using the mathematical model described in Figure 3C. Representative genes of the immediate decrease group (CDK1, TOP2A, and UBE2C) and the delayed decrease group (CENPA, ALR6IP1, and UBALD2) are shown. (H) Histogram of the time (relative to metaphase) when mRNA levels start to decline is shown for genes that are downregulated during the M-G1 phase transition. mRNA levels over time were fit as in B–G and the onset time of mRNA decline was determined for each of the 220 downregulated genes. (I) Histogram of mRNA half-lives for the 220 genes that are downregulated during the M-G1 phase transition. To obtain mRNA half-lives, mRNA levels over time were fit as in B–G and the mRNA half-lives were calculated using the mathematical model described in Figure 3 (see Materials and methods). (J–L) Comparison of mRNA half-lives during the M-G1 phase transition with mRNA half-lives in asynchronous cells determined in previous studies (Herzog et al., 2017; Schwanhäusser et al., 2011; Tani and Akimitsu, 2012). Dashed lines indicate identical half-lives. Note that the half-lives of most genes are shorter during the M-G1 phase transition than in asynchronous growing cells. (M) Boxplot of mRNA half-lives of immediate and delayed decrease genes. For each gene, the half-live was determined from the moment mRNA levels start to decrease (see Supplementary file 1). (N) Analysis of transcription inhibition by Actinomycin D. Expression levels of the DNA damage-induced gene CDKN1a were measured by RT-qPCR in cells that were DNA damaged (exposed to 5 Gy ionizing radiation), in the presence or absence of Actinomycin D, relative to non-irradiated cells. Lines with error bars indicate average ± SEM of three experiments. (O) Mitotic index of RPE-1 cells treated with the transcription inhibitor Actinomycin D. RPE-1 cells were arrested in G2 phase using a CDK1 inhibitor (RO-3306). After 16 hr, the CDK1 inhibitor was removed and replaced by Taxol, thereby releasing cells from the G2 phase arrest and blocking cells in mitosis. Forty-five minutes later, mitotic cells were collected through mitotic shake-off, after which Actinomycin D was added for up to 2 hr. Cells were fixed and the fraction of mitotic cells was determined by fluorescence activated cell sorting (FACS) (by staining cells for DNA content and the mitosis-specific marker phosphorylated histone 3 at ser 10). Lines with error bars indicate average ± SEM of three experiments. p-Values are based on a one-tailed Student’s t-test, and indicated as * (p < 0.05), ** (p < 0.01), *** (p < 0.001), ns = not significant.
Figure 4 with 1 supplement
CNOT1 promotes decay of mRNAs during mitotic exit and early G1 phase.
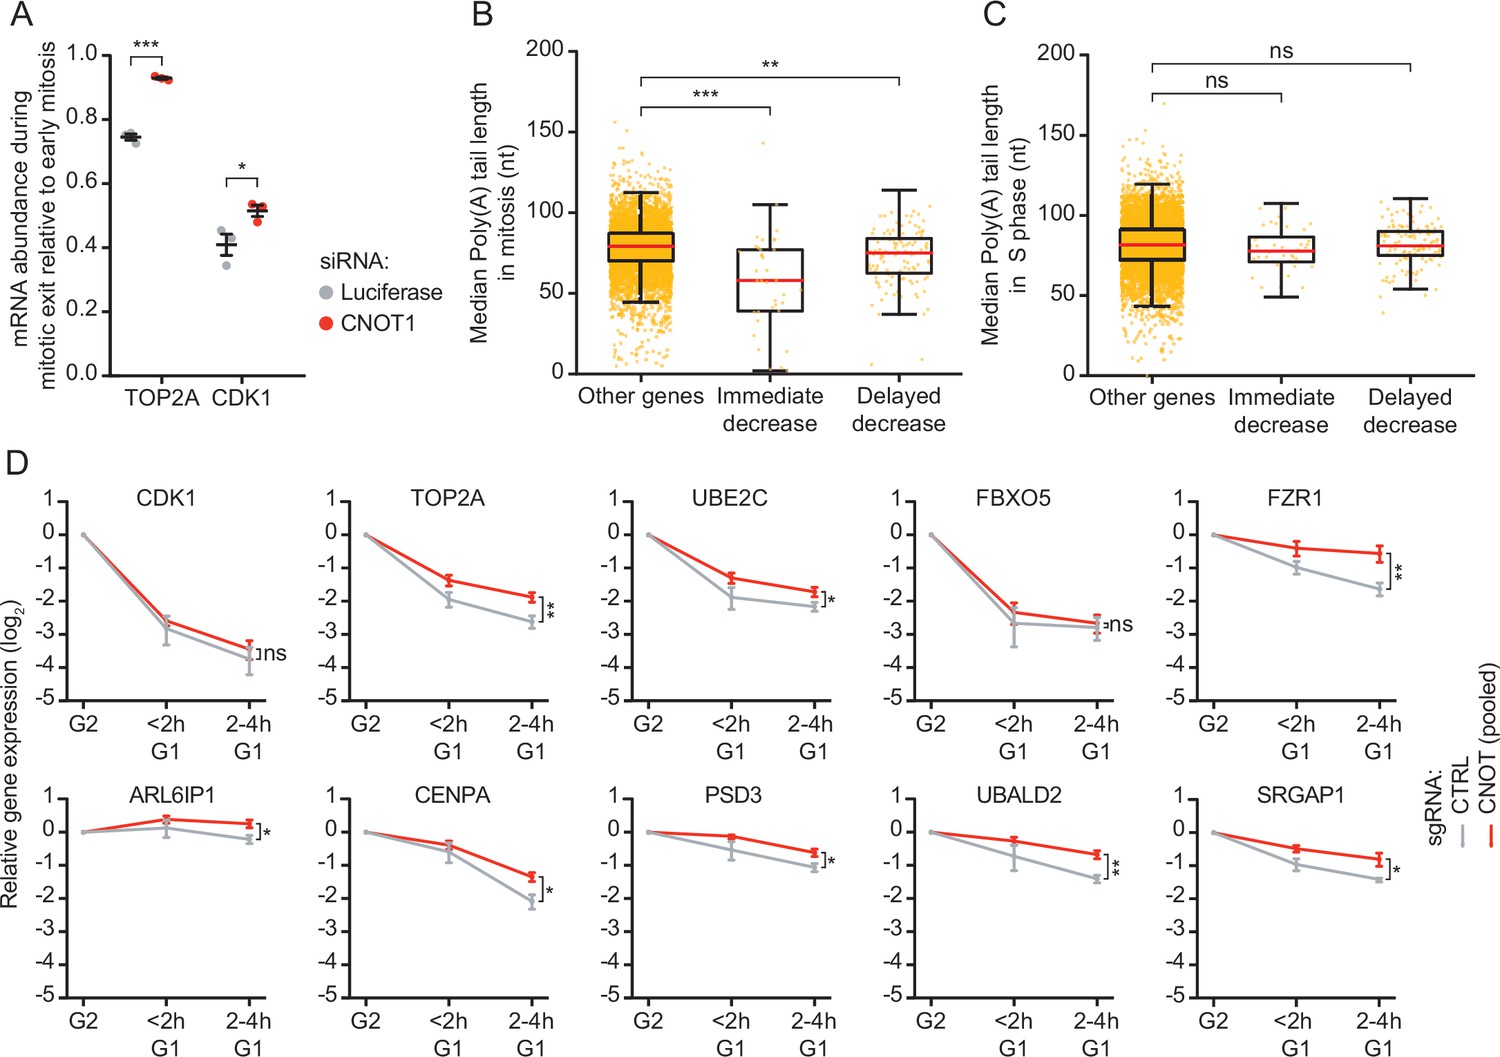
(A) Effect of CNOT1 depletion on TOP2A and CDK1 mRNA abundance in different states of mitosis. Cells were transfected with indicated siRNAs. Two days after transfection, cells were fixed and TOP2A and CDK1 mRNAs were visualized using single molecule fluorescence in situ hybridization (smFISH) (as in Figure 2D) and the number of mRNAs per cell was determined. To calculate the relative abundance of mRNAs during mitotic exit, we divided the average number of mRNAs present in telophase by the average number of mRNAs present in prophase, prometaphase, and metaphase mRNA abundance is similar during these phases of mitosis (Figure 2E–F). Relative abundance was used instead of absolute abundance, as the absolute number of detectable foci varied between experiments due to variations in labeling intensity of smFISH probes. Each dot represents a single experiment and lines with error bars indicate average ± SEM of three experiments. Per experiment, at least 10 cells during mitotic exit and 10 early mitotic cells were quantified (see Supplementary file 2 for the exact number of cells included). p-Values are based on a one-tailed Student’s t-test, and indicated as * (p < 0.05), ** (p < 0.01), *** (p < 0.001), ns = not significant. (B–C) Boxplot of poly(A) tail lengths in mitosis (B) and S phase (C) for immediate decrease genes, delayed decrease genes, or genes that are not subjected to mRNA decay (other genes). p-Values are based on a one-tailed Student’s t-test. (E) Expression levels of indicated mRNAs during the mitosis-to-G1 (M-G1) phase transition in control cells and cells depleted of CNOT1. RPE-fluorescent, ubiquitination-based cell cycle indicator (FUCCI) CRISPR interference (CRISPRi) cells infected with control- or one of three different CNOT1-targeting sgRNAs were sorted into populations of G2/M phase and G1 phase cells at 5 days post-sgRNA infection. mRNA levels of indicated genes were measured by RT-qPCR. Data from three CNOT1-targeting gRNAs were averaged. Lines and error bars indicate average ± SEM of three experiments. p-Values are based on a one-tailed Welch’s t-test. p-Values are indicated as * (p < 0.05), ** (p < 0.01), *** (p < 0.001), ns = not significant.
Figure 4—figure supplement 1
CNOT1 promotes decay of mRNAs during mitotic exit and early G1 phase.
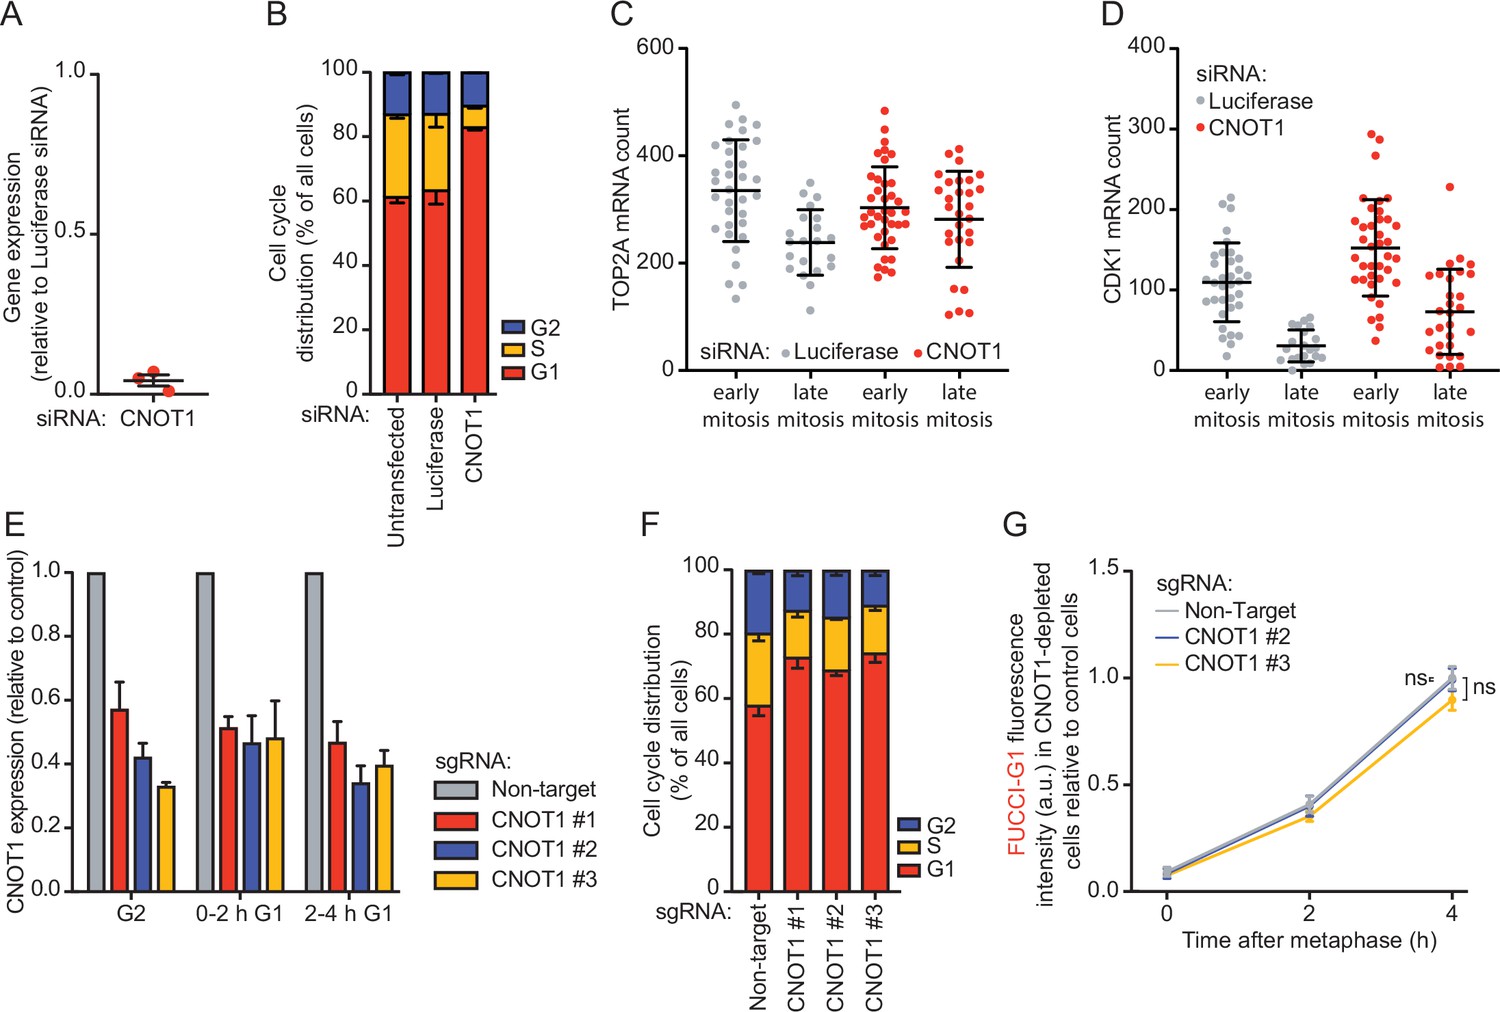
(A) Quantification of CNOT1 expression levels following siRNA-mediated knockdown. RPE-1 cells were transfected with a CNOT1 siRNA, or a control siRNA-targeting luciferase. CNOT1 mRNA levels were measured by RT-qPCR at 48 hr post-siRNA transfection, and were normalized to CNOT1 expression levels in control siRNA treated cells. Lines with error bars indicate the average ± SEM of three experiments. (B) Cell cycle analysis of control- and CNOT1-depleted cells. RPE-fluorescent, ubiquitination-based cell cycle indicator (FUCCI) cells were transfected with indicated siRNAs. At 48 hr post-transfection, the cell cycle distribution was determined by fluorescence activated cell sorting (FACS) using FUCCI fluorescence. (C–D) Quantification of TOP2A (C) and CDK1 (D) transcript number in individual cells. Asynchronously growing RPE-1 cells were transfected with indicated siRNAs. Forty-eight hours later, cells were fixed and stained for DNA (DAPI), membranes (WGA), TOP2A, and CDK1 mRNA (using single molecule fluorescence in situ hybridization [smFISH]). A representative experiment of three experiments is shown. At least 10 cells per mitotic phase were included per experiment (see Supplementary file 2 for the exact number of cells included). (E) Quantification of CNOT1 expression levels following CRISPR interference (CRISPRi)-mediated knockdown. RPE-FUCCI CRISPRi cells were infected with the indicated sgRNAs, and selected for successful infection using puromycin. Five days post-infection, cells were sorted into the indicated cell cycle fractions based on FUCCI fluorescence (see Materials and methods). CNOT1 expression was measured by RT-qPCR. Bars and error bars indicate the average ± SEM of three experiments. (F) Cell cycle analysis of control- and CNOT1-depleted cells. RPE-FUCCI CRISPRi cells were infected with CNOT1 sgRNAs as in (E) and the cell cycle distribution of cells was determined as in (B). Bars and error bars represent average ± SEM of three experiments. (G) Accumulation of the FUCCI-G1 marker in control or CNOT1-depleted RPE-FUCCI CRISPRi cells. Control and CNOT1-depleted RPE-FUCCI CRISPRi cells were imaged using time-lapse microscopy. FUCCI-G1 fluorescence was determined for cells at metaphase and 2 or 4 hr thereafter. Fluorescence intensities were normalized to the average fluorescence intensity of wild-type cells at 4 hr post-metaphase. Dots and error bars indicate average ± SEM of three experiments. At least eight cells per condition per experiment were quantified. For all panels, p-values are based on an unpaired one-tailed Student’s t-test. p-Values are indicated as * (p < 0.05), ** (p < 0.01), *** (p < 0.001), ns = not significant. See Supplementary file 2 for the exact number of cells included.
Author response image 1
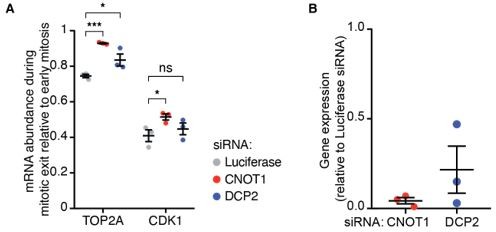
Figure 1.
(A) Cells were transfected with the indicated siRNAs and fixed 48 hours later. mRNAs, DNA and membranes were labeled with smFISH probes, DAPI and fluorescent wheat germ agglutinin, respectively. mRNA numbers of cells in late mitosis were counted and divided by the number of mRNAs present in cells in early mitosis. (B) Cells were transfected with the indicated siRNAs. 48 hours later cells were lysed and the RNA was harvested. Gene-expression levels were analyzed by qPCR, relative to cells treated with siRNAs targeting Luciferase.
Author response image 2
Comparison of immediate decay versus delayed decay in single cells.
We generated two metagenes, one including all genes belonging to the ‘immediate decay’ wave, and one including all genes belonging to the ‘delayed decay’ wave. Metagenes were created by summing up all reads for the genes that belonging to the same wave of decay in a single cell, thus creating one expression value per metagene per cell. Then we analyzed metagene expression at 240 minutes post metaphase normalized to its expression at G2/M.
Tables
Key resources table
| Reagent type (species) or resource | Designation | Source or reference | Identifiers | Additional information |
|---|---|---|---|---|
| Cell line (Homo sapiens) | hTERT RPE-1 | ATCC | CRL-4000 | Cell line maintained in DMEM/F12 |
| Cell line (Homo sapiens) | HEK293T | ATCC | CRL-3216 | Cell line maintained in DMEM |
| Antibody | Anti-Histone three phospho-serine 10 (pH3 Ser10) (Rabbit polyclonal) | Upstate | 06–570 | FACS (1:500) |
| Recombinant DNA reagent | pMD2.G | Addgene #12,259 | Lentiviral packaging plasmid | |
| Recombinant DNA reagent | psPAX2 | Addgene #12,260 | Lentiviral packaging plasmid | |
| Recombinant DNA reagent | mkO2-hCdt1(30/120) | Sakaue-Sawano et al., 2008 | FUCCI-G1 marker | |
| Recombinant DNA reagent | mAG-hGem(1/110) | Sakaue-Sawano et al., 2008 | FUCCI-G2 marker | |
| Recombinant DNA reagent | dCas9-BFP-KRAB | Jost et al., 2017 | CRISPRi construct | |
| Recombinant DNA reagent | CRISPRia-v2 with sgRNA non-targeting control | Addgene plasmid #84832 and this paper | sgRNA | GCTGCGCTCCGAGCAACCAC |
| Recombinant DNA reagent | pCRISPRia-v2 with sgRNA CNOT1 #1 | Addgene plasmid #84832 and this paper | sgRNA | GCTCCGGGAAACGCTTCCAG |
| Recombinant DNA reagent | CRISPRia-v2 with sgRNA CNOT1 #2 | Addgene plasmid #84832 and this paper | sgRNA | GCGGAGCTCTAGGGAGTGAG |
| Recombinant DNA reagent | CRISPRia-v2 with sgRNA CNOT1 #3 | Addgene plasmid #84832 and this paper | sgRNA | GCGGAGCTCTAGGGAGTGAG |
| Sequence-based reagent | siRNA luciferase | This paper | sgRNA | CGUACGCGGAAUACUUCGAUU |
| Sequence-based reagent | CDK1 qPCR For | This paper | qPCR primers | CTATCCCTCCTGGTCAGTACATGG |
| Sequence-based reagent | CDK1 qPCR Rev | This paper | qPCR primers | CTCTGGCAAGGCCAAAATCAGCCAG |
| Sequence-based reagent | TOP2A qPCR For | This paper | qPCR primers | GTCTCTCAAAAGCCTGATCCTGCC |
| Sequence-based reagent | TOP2A qPCR Rev | This paper | qPCR primers | GTCATCACTCTCCCCCTTGGATTTC |
| Sequence-based reagent | UBE2C qPCR For | This paper | qPCR primers | GATGTCAGGACCATTCTGCTCTCC |
| Sequence-based reagent | UBE2C qPCR Rev | This paper | qPCR primers | GCTCCTGGCTGGTGACCTGC |
| Sequence-based reagent | FBXO5 qPCR For | This paper | qPCR primers | GATCCTAGAAGATGATAAGGGGG |
| Sequence-based reagent | FBXO5 qPCR Rev | This paper | qPCR primers | CACCTTGATTGGATAACTTGGTT |
| Sequence-based reagent | FZR1 qPCR For | This paper | qPCR primers | GCACGCCAACGAGCTGGTGAGC |
| Sequence-based reagent | FZR1 qPCR Rev | This paper | qPCR primers | CAGACACAGACTCCCACTTTACC |
| Sequence-based reagent | ARL6IP1 qPCR For | This paper | qPCR primers | CTACCTTGTTCCCATTCTAGCGCC |
| Sequence-based reagent | ARL6IP1 qPCR Rev | This paper | qPCR primers | GGCGTTTCCACCAACCCACAGC |
| Sequence-based reagent | CENPA qPCR For | This paper | qPCR primers | GCCCTATTGGCCCTACAAGAGGC |
| Sequence-based reagent | CENPA qPCR Rev | This paper | qPCR primers | GGCTCTGGAGAGTCCCCGG |
| Sequence-based reagent | PSD3 qPCR For | This paper | qPCR primers | CTTAAAACTGCCGACTGGAGGGTC |
| Sequence-based reagent | PSD3 qPCR Rev | This paper | qPCR primers | CTTCAGTTGCTCCTCCTGAGACAG |
| Sequence-based reagent | UBALD2 qPCR For | This paper | qPCR primers | CGGCCGACCAGGCGAAGCAG |
| Sequence-based reagent | UBALD2 qPCR Rev | This paper | qPCR primers | CAGCGCATCGGGGAAGTTGGG |
| Sequence-based reagent | SRGAP1 qPCR For | This paper | qPCR primers | GGCAGCCTGACCAACATCAGCCG |
| Sequence-based reagent | SRGAP1 qPCR Rev | This paper | qPCR primers | GGGGCATGCTTTGCTGTGCTCTG |
| Sequence-based reagent | CNOT1 qPCR For | This paper | qPCR primers | GTAGTGCCCTTTGTTGCCAAAG |
| Sequence-based reagent | CNOT1 qPCR Rev | This paper | qPCR primers | GGAGGTTTCCAGGTTTTAGCTC |
| Sequence-based reagent | CDKN1A qPCR For | This paper | qPCR primers | GCACCTCACCTGCTCTGCTGC |
| Sequence-based reagent | CDKN1A qPCR Rev | This paper | qPCR primers | CCTCTTGGAGAAGATCAGCCGG |
| Sequence-based reagent | Alt-R crRNA targeting p53 | This paper; ordered from Integrated DNA Technologies (IDT) | crRNA | UCGACGCUAGGAUCUGACUG |
| Sequence-based reagent | Alt-R tracrRNA | Integrated DNA Technologies (IDT) | tracrRNA | |
| Sequence-based reagent | sgRNA non-targeting control | This paper | sgRNA | GCTGCGCTCCGAGCAACCAC |
| Sequence-based reagent | sgRNA CNOT1 #1 | This paper | sgRNA | GCTCCGGGAAACGCTTCCAG |
| Sequence-based reagent | sgRNA CNOT1 #2 | This paper | sgRNA | GCGGAGCTCTAGGGAGTGAG |
| Sequence-based reagent | sgRNA CNOT1 #3 | This paper | sgRNA | GCGGAGCTCTAGGGAGTGAG |
| Sequence-based reagent | siRNA luciferase | This paper | sgRNA | CGUACGCGGAAUACUUCGAUU |
| Sequence-based reagent | siRNA CNOT1 | Dharmacon ON-TARGET plus | siRNA pool of 4 | |
| Sequence-based reagent | smFISH probe for TOP2A | ThermoFisher | VA1-14609 | Fluorophore: Alexa Fluor 546Sequence:Proprietary |
| Sequence-based reagent | smFISH probe for CDK1 | ThermoFisher | VA6-17545 | Fluorophore: Alexa Fluor 647Sequence:Proprietary |
| Chemical compound, drug | Propidium Iodide | Sigma-Aldrich | P4170 | |
| Chemical compound, drug | Taxol (Paclitaxel) | Sigma-Aldrich | T1912 | |
| Chemical compound, drug | RO-3306 | Calibochem | 217699 | |
| Chemical compound, drug | Actinoymcin D | Sigma-Aldrich | A9415 | |
| Chemical compound, drug | Hoechst 33,342 | ThermoFisher | H3570 | |
| Chemical compound, drug | TriSure | Bioline | BIO-380032 | |
| Commercial assay or kit | Bioscript Reverse Transcriptase Kit | Bioline | BIO-27036 | |
| Commercial assay or kit | SYBR-Green Supermix | Bio-Rad | #1708880 | |
| Commercial assay or kit | viewRNA smFISH kit | ThermoFisher | QVC0001 | |
| Software, algorithm | Matlab | Mathworks | ||
| Software, algorithm | R | R | ||
| Other | DAPI stain | ThermoFisher | D1306 | 1 µg/ml |
| Other | Wheat Germ Agglutinin | ThermoFisher | W11261 | 1 µg/ml |
Additional files
-
Supplementary file 1
Analyses used in this study.
This file contains analyses that were used throughout the study, in Figure 1D–E, Figure 1—figure supplement 1J,L,N, Figures 2A–B–3C and Figure 3—figure supplement 1B-G.
- https://cdn.elifesciences.org/articles/71356/elife-71356-supp1-v1.xlsx
-
Supplementary file 2
Sample size indication.
This file contains sample sizes for all experiments that involved single-cell analyses.
- https://cdn.elifesciences.org/articles/71356/elife-71356-supp2-v1.xlsx
-
Supplementary file 3
Nucleotide sequences.
This file contains nucleotide sequences for reagents that were used in this study; RT-qPCR primer sequences and sgRNA sequences.
- https://cdn.elifesciences.org/articles/71356/elife-71356-supp3-v1.xlsx
-
Source data 1
Single-cell transcript counts plate 1.
- https://cdn.elifesciences.org/articles/71356/elife-71356-supp4-v1.csv
-
Source data 2
Single-cell transcript counts plate 2.
- https://cdn.elifesciences.org/articles/71356/elife-71356-supp5-v1.csv
-
Source data 3
Single-cell transcript counts plate 3.
- https://cdn.elifesciences.org/articles/71356/elife-71356-supp6-v1.csv
-
Source data 4
Single-cell sequencing metadata.
- https://cdn.elifesciences.org/articles/71356/elife-71356-supp7-v1.xlsx
-
Transparent reporting form
- https://cdn.elifesciences.org/articles/71356/elife-71356-transrepform1-v1.pdf
Download links
A two-part list of links to download the article, or parts of the article, in various formats.
Downloads (link to download the article as PDF)
Open citations (links to open the citations from this article in various online reference manager services)
Cite this article (links to download the citations from this article in formats compatible with various reference manager tools)
Time-resolved single-cell sequencing identifies multiple waves of mRNA decay during the mitosis-to-G1 phase transition
eLife 11:e71356.
https://doi.org/10.7554/eLife.71356


